Article

Life Cycle Assessment of District Heating Systems in Europe: Case Study and Recommendations

by
Camille Jeandaux
*,
Jean-Baptiste Videau
and
Anne Prieur-Vernat
ENGIE Lab CRIGEN, F-93249 Stains, France
*
Author to whom correspondence should be addressed.
Sustainability 2021, 13(20), 11256; https://doi.org/10.3390/su132011256
Submission received: 15 July 2021 / Revised: 24 September 2021 / Accepted: 4 October 2021 / Published: 12 October 2021

Abstract

:
District heating systems are a way to integrate renewable energies into the heating sector, with the primary aim of decarbonizing this final use. In such systems, renewable energy sources are centrally managed with cutting-edge technological equipment, efficient maintenance rates and service guarantees. Both the decarbonization effect and the centralization lead to environmental benefits, which can go beyond the climate change indicator. In this study, life cycle assessment was used to assess the environmental sustainability of district heating solutions compared to standalones. The study aimed to examine a diverse set of options for large-scale district heating systems across Europe and to compare them to different standalone solutions. Eight technologies (five district-level and three standalone solutions) were analyzed in two densities of habitats and four areas of Europe. This study aimed to understand the drivers of district heating environmental performance and to provide guidelines for accounting said performance. The analysis showed better performance for district heating scenarios compared to isotechnology standalones for every environmental impact category: the climate change impact category were reduced from 5 to 90%, while respiratory inorganics were reduced from 45 to 64%, depending on the considered climatic area. This statement was true under key parameters, both technical and methodological—efficiencies and complement rates, but also the neutral carbon principle for biomass energy accounting and allocation rules.

1. Introduction

District heating systems (DHSs), because they are expected to be a relevant vector for the energy transition [1], have attracted growing interest.
In Europe and around the world, most of the heat is supplied by fossil fuels and mainly in direct use [2]. DHSs are an effective lever in energy renovation, as they can significantly reduce primary energy use [3]. These centralized systems are considered a key technology to increase energy efficiency [4] by replacing less efficient, often individual equipment with more efficient central heating systems [1].
Another major advantage of DHSs is that, in addition to conventional fuels, renewable and recovered heat from industrial processes can be easily integrated into such systems now or in the future [5]. DHSs can also adapt more easily to future technological improvements and future environmental constraints related to the energy mixes they use. As renewable energies are an important part of the decarbonization strategies of Europe in general, and of the energy sector in particular, the carbon footprint and potential resulting greenhouse gas (GHG) savings engendered by renewable energy sources have been widely studied: geothermal heat pump emission savings [6], photovoltaics as a contributor to the European decarbonization path towards 2030 [7] or evaluations of biofuels’ environmental performance, for instance [8]. For example, efficient systems, such as geothermal heat pumps, can be a relevant solution for the decarbonization of standalone solutions by replacing gas boilers [9].
The integration of district heating itself has not been very widely studied, and there is a lack of literature concerning the observation of both the potential decarbonization effect with renewable energy integration and the decarbonization effect due to the centralized equipment associated with DHSs. According to [10], as compared to heat generation and distribution based on individual natural-gas-fired boilers, the centralized DHS option also based on natural gas improved the GHG balance by 20%.
Some studies actually observed the GHG abatement from district heating systems [11], but environmental performance is not limited to climate change, and other impact categories must be taken into account through a life cycle consideration to obtain a complete overview. When it comes to particulate matter, for instance, biomass-based heat can be a controversial alternative to fossil gas scenarios [12]. Biomass boilers can even be a better route towards decarbonization compared to heat pumps, but show a significant increase in some other impacts, according to [13,14]. However, when comparing heat from an individual biomass-fueled boiler to that from a biomass-based DHS, it is still preferable to avoid combustion in each individual housing unit in terms of particulate emissions [1,12,13,14,15].
One particularly promising large-scale district heating technology is geothermal heat direct integration, which cannot be economically viable in a small district [16]. Few studies have focused on deep geothermal environmental performance in general or its integration for direct heat use within low-temperature DHSs [17]. There have been a few life cycle environmental impact studies for electricity production systems, with an emphasis on the construction phase which is the main contributor for impacts such as ecotoxicity or particulate matter (steel used for well casing and diesel oil consumed for drilling) [17]. In [18], Karlsdottir et al. presented the performance of geothermal-heat-fed district systems with a CO2 and energy focus in Iceland. McKay et al. [19] studied the carbon intensity of the same technology in Scotland, stating that it was compatible with carbon reduction targets for 2050. Pratiwi et al. [20] also studied the GHG performance of heat-only geothermal systems, concluding with the importance of infrastructure. However, no other environmental impacts were investigated. The environmental performance of geothermal systems needs to be precisely known, as the accounting methodology has varied across different publications [16]. The H2020 GEOENVI project gathered industrial and academic stakeholders to establish a consensus on specific LCA guidelines to apply for geothermal systems such as system boundaries, allocations, etc. This study followed those guidelines to contribute to harmonized data in the sector [21].
This study aimed to fill the gap identified in the literature and to provide insights on the environmental performance of large-scale district heating systems in Europe, including geothermal DHSs. It aimed to be representative of the current technologies used for district heating networks installation. It focused on fourth-generation district heating systems [22]. Steam district heating systems were out of the scope of the study, and the temperatures considered for delivery ranged from 60 to 70 °C. As deep geothermal heat was within the scope of the study, small district heating systems could not be considered, as the service provided is by such systems is not strictly comparable. It was assumed by ENGIE internal experts that deep geothermal heat cannot be economically developed for a final heating demand of less than 110 GWh.
Some life cycle assessment (LCA) studies about district heat exist, though, and they were reviewed in [1], as always demonstrating that such systems could make a substantial contribution to the decarbonization of energy in the building sector. However, those studies compared only one particular case [23], aimed only at analyzing the installation and production phase [24,25,26] or adopted a consequential approach to investigate the potential savings of such a solution based on penetration scenarios [27].
In [1], Bartolozzi et al. led an attributional life cycle assessment on district versus standalone heating solutions in the Mediterranean region. They demonstrated the benefits of centralized systems compared to individual ones in the specific urban region of Tuscany in terms of GHG emission reduction and for impact categories other than climate change. They also suggested some ecodesign strategies to guarantee and enhance the sustainability of DHS: coupling thermal energy production with a photovoltaic system to satisfy the electricity demand, improving the wood-chipping process for biomass, etc. The results of the study were valid in the specific local temperate context with 2007–2011 data but need to be challenged with other heat-demand scenarios (climates) or to ensure their validity on a larger scale.
In [25,26,27,28], the authors analyzed the environmental performance of DHS through three life cycle stages: pipeline production, network construction and network use. The environmental impact from the use of the district heat distribution system depended heavily on the type of energy source that was utilized to supply the network with heat. The authors gave recommendations on parameters to monitor during the production and installation phases, with the admonition to ensure that the insulation properties of the pipes, and thus the use phase, remained unaltered. However, no comparison with standalone solutions was led.
In [27], the authors led a consequential life cycle assessment of several DHS options to help policy makers understand the challenges of DHSs. They concluded on the sustainability of biofuels for the Swedish DH sector but could not draw conclusions on CHP production itself.
In [10,15], focus was placed on biomass-based district heating systems compared with standalone (open fireplaces and stoves) and fossil-based solutions. Both publications adopted a life-cycle vision to describe the environmental performance of the DHS beyond the climate change indicator. The shift of domestic consumption towards centralized district heating plants allowed gains in terms of GHG emission reduction and a substantial decrease in toxic emissions such as PM10 (Particulate Matter), CO (Carbon monoxide) and VOCs (Volatile Organic Compounds). The reduction of direct pollutants emissions with a centralized system was emphasized in [15], but the study did not adopt a life-cycle view and thus did not intend to give key parameters to guarantee the sustainability of DHS.
There have been no studies with a European perspective aimed at quantifying DHS burdens and benefits that could integrate in very different climatic conditions and residential contexts to challenge the current results.
Moreover, the district heating trend for decarbonization in Europe is about remanufacturing old networks, installing new ones or extending existing ones [29,30]. This would actually lead to large-scale networks. As a comparison, the district scenario modelled in [1] was a 3 GWh scenario, whereas [31] focused on small district systems (36 GWh maximum).
Therefore, this study aimed to provide new insights regarding the environmental impacts of large-scale district heating systems, including geothermal heat direct use systems, above and beyond the climate change consideration, thus challenging the assumptions among different European contexts and identifying the main sources of impacts within a large panorama of technological options.
In this context, the different objectives of the study were to:
  • Conduct a holistic analysis of life-cycle environmental impacts in several scenarios of district heating systems;
  • Compare decentralized systems (in buildings) to centralized district heating systems;
  • Identify the main sources of the environmental impacts of different heating production system scenarios used in district heating networks, over and above climate change, and the levers for more sustainable heating production.
The LCA standards referred to in this study include the international standards ISO 14040 [32] and 14044 [33].
The work is presented under the four interrelated steps introduced in ISO 14040: goal and scope definition under materials and methods, life cycle inventory analysis, life cycle assessment results and interpretation under discussion and recommendations.

2. Materials and Methods

2.1. Goal and Scope of the Functional Unit

The study aimed to compare district heating systems with themselves and with individual equipment for space heating and domestic hot water supply. It aimed to cover a wide range of technologies and European situations to understand the main drivers of such an assessment.
This led to 8 different heat production systems, split between district heating systems (5 technological options) and standalone solutions (3 technological options).
The functional unit is defined on the basis of the recommendation in [34], with the following components:
  • function: deliver the final demand of heat for a specific neighborhood detailed below;
  • quantity: 110 GWh of delivered heat in a typical neighborhood (based on [35] and on internal experts to fit for an extension of a DHC in a neighborhood planning development [36]), composed of 40% for old collective housing buildings, 30% for new collective housing buildings and 15% each for new and old office buildings;
  • timeline: one year of fulfilling heat demand for current technologies;
  • quality: as high as possible in a 4th generation district heating (4GDH) system when considering a DHS.
Each DHS system had:
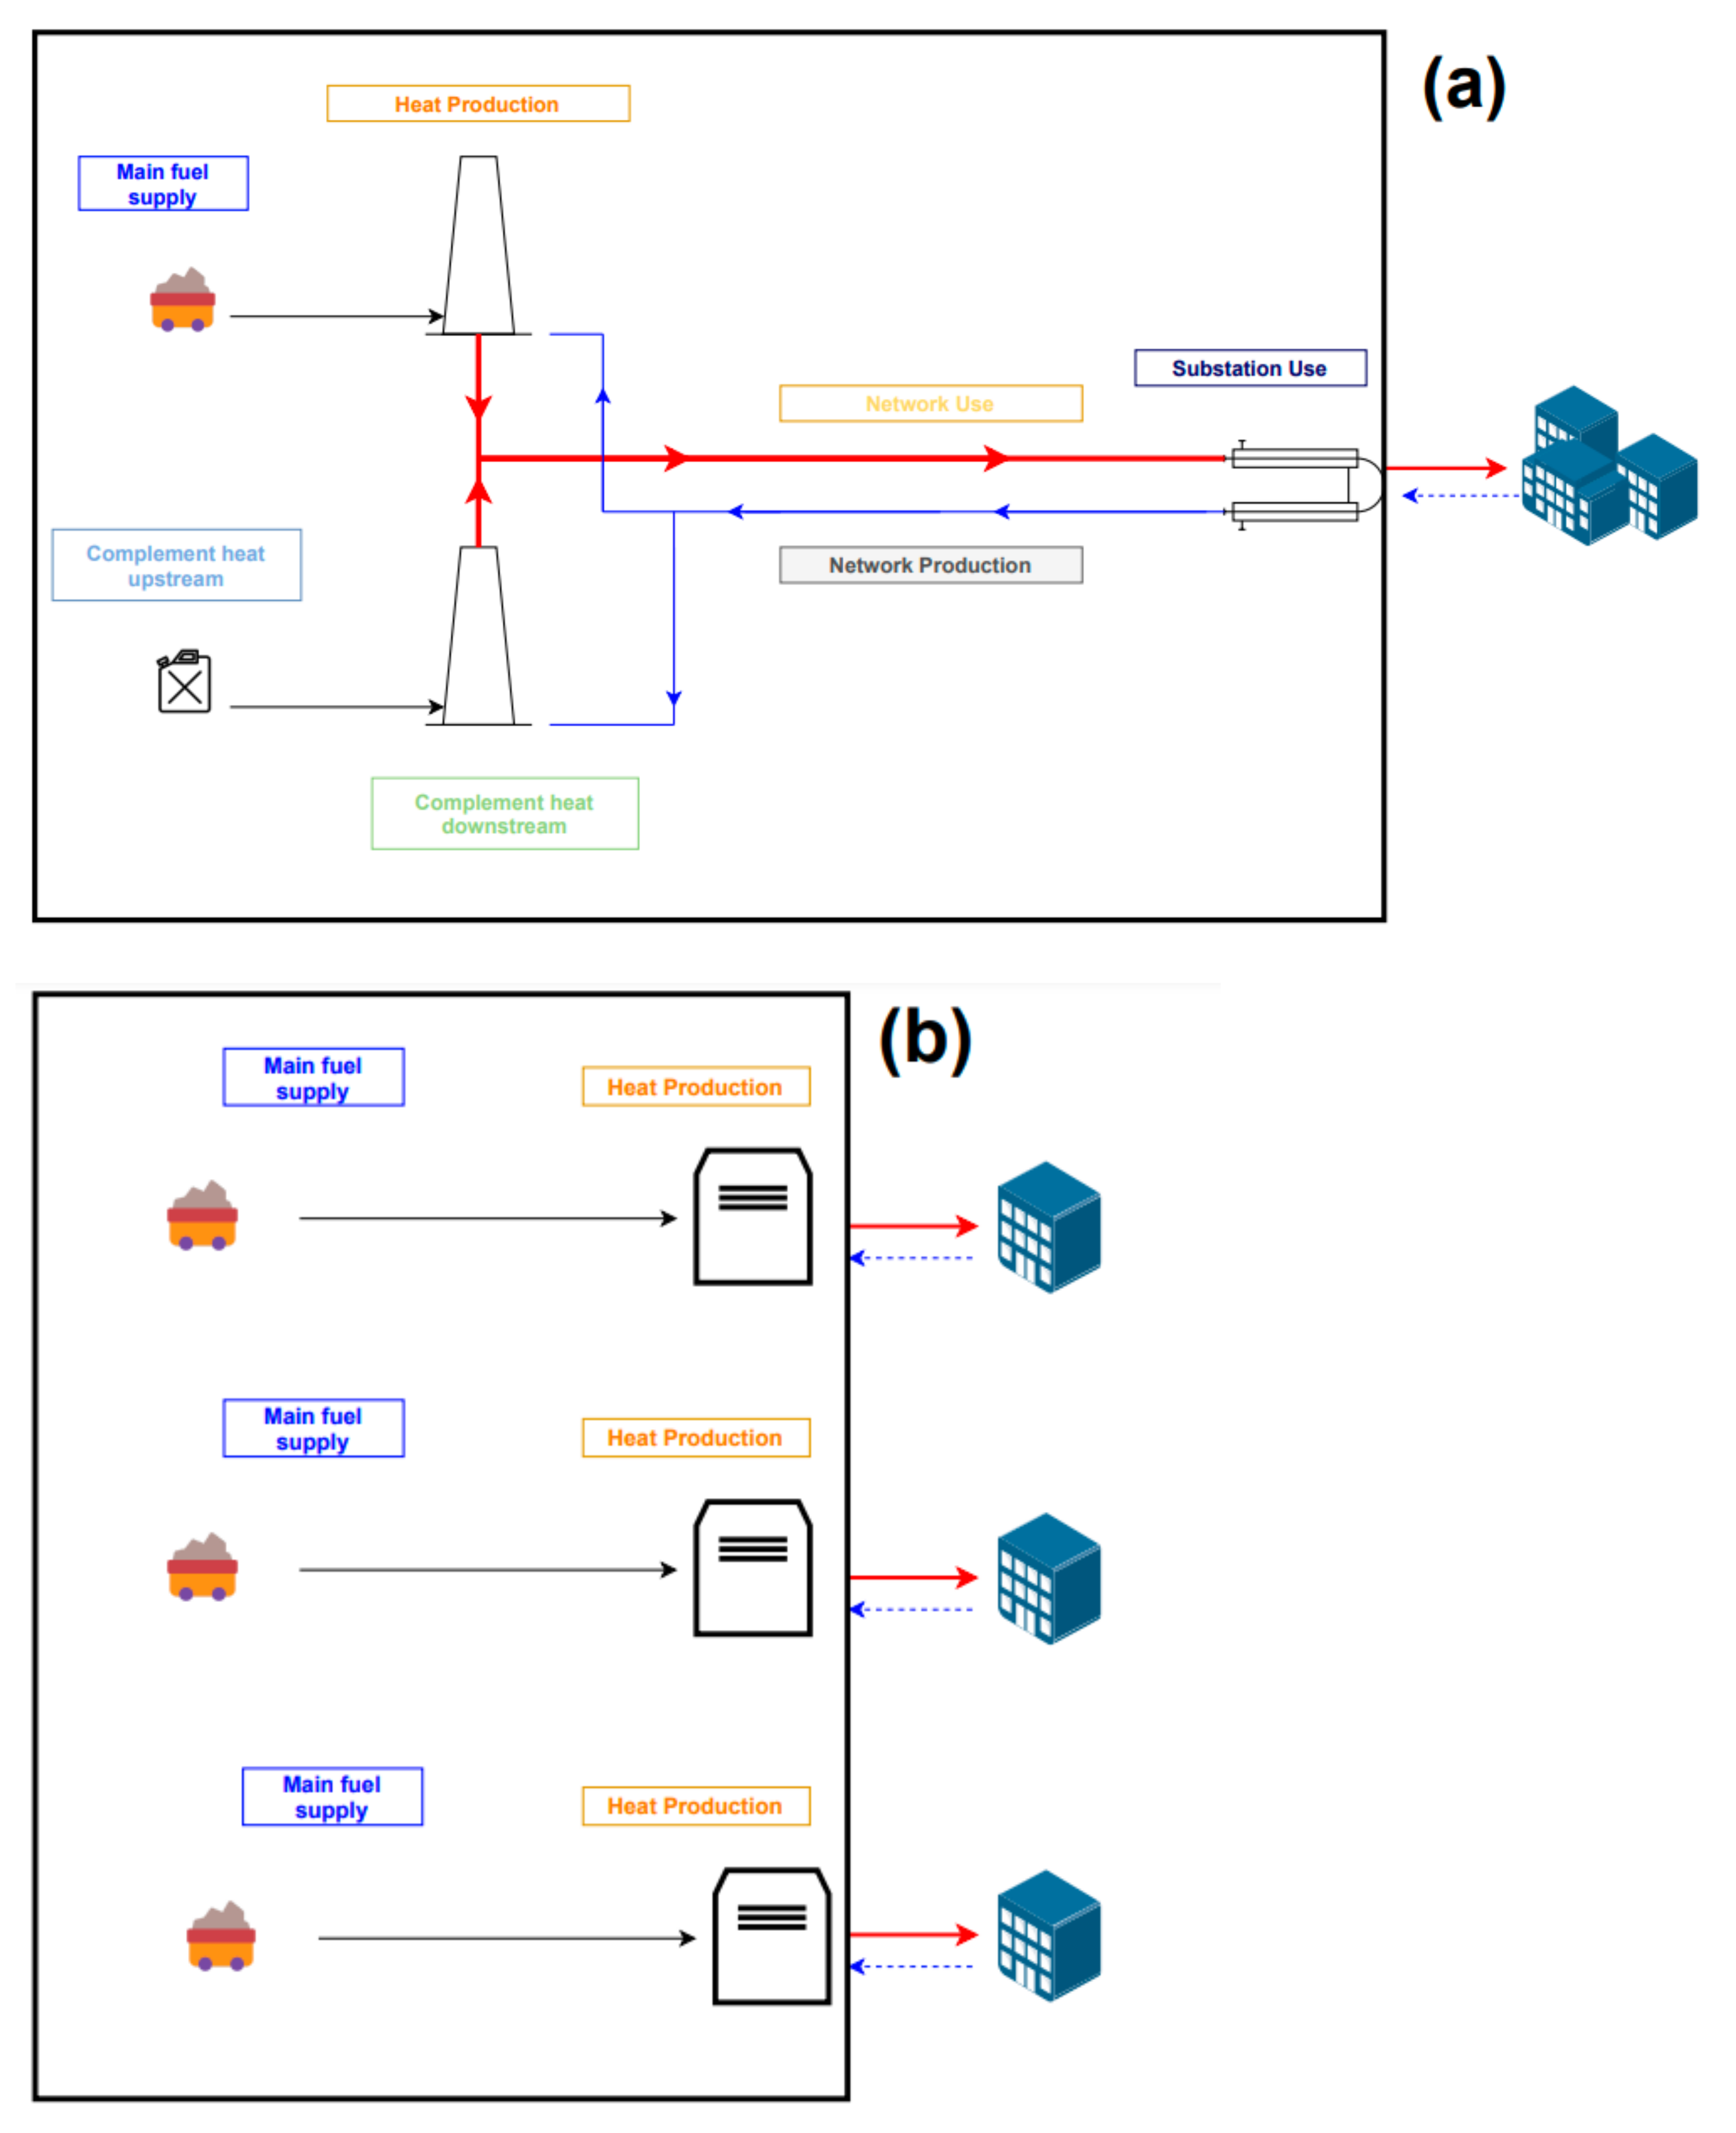
  • one or more heating source for the main function, a complement and a back-up to cover high-heating-demand periods and supply issues, to bridge power failures and to ensure continuous heat delivery. Decentralized (individual) systems had neither complements nor back-up installations;
  • networks and substations for every connected building.
The study covered all of the life cycle steps of the systems: production, distribution, installation, use/maintenance and end-of-life (waste collection, transportation and landfilling). System boundaries of individual systems also included the low-pressure distribution of natural gas and low-voltage electricity networks.
Problem-oriented environmental impact indicators, also called “midpoint indicators”, were considered in this study. Impact categories to consider and of linked characterization methodologies were selected following the guidelines of the Initiative Environmental Footprint (PEF/OEF) v 6.3.2 report from the European Commission in 2018 [37]. The versions used (EF v2) were those available within the LCA software employed, which is Simapro v9.0.
Level III impact categories (as classified by PEF guidance [37]), meaning the less reliable ones, were not further investigated. These included human toxicity indicators (cancer and noncancer), land use impacts, water scarcity footprint, ecotoxicity and resource use categories (minerals/metals and fossil resources). As recommended by the PEF guidelines, the most relevant impact categories were identified to be developed further.
As shown in 4.1, those most relevant impact categories were:
  • climate change (100 years), excluding land use change and biogenic carbon, expressed in in kg CO2 equivalent;
  • photochemical ozone creation potential (POCP), expressed in kg NMVOC equivalent;
  • respiratory inorganics, expressed in disease incidence;
  • acidification, expressed in mol H+ equivalent;
  • eutrophication of freshwater, expressed in kg P equivalent;
Eight different scenarios, presented in Table 1, were assessed, with different heat production systems and types of energy delivery (centralized vs. decentralized).

2.2. System Boundaries

The life cycle assessment required us to include all steps from cradle to grave, as specified in the ISO 14040 standard [32]. As illustrated in Figure 1, the whole perimeter, from the fuel supply upstream to heat transportation and distribution to the buildings was taken into account for both district and standalone solutions. For each case, those steps are described further with their respective inventories in Section 3.

2.3. Temporal and Geographical Scope

Each heat production unit scenario was analyzed for very dense and less-dense habitats, and also for four different areas in Europe, corresponding to a variety of climate conditions: North, East, South and West.
Four European areas were defined for this study (Table 2). It was decided to use the results of the Eurostat survey (available at: https://ec.europa.eu/eurostat/fr/web/energy/data/database (accessed on 1 January 2020)) of some countries in those specific areas. Regarding the development and the accessibility of the data within the Eurostat database, specific countries were selected as estimations to assess the considered area.
For each area, we calculated the heating degree days (or HDD, the number of degrees that a day’s average temperature is below 18 °C), taking into account the mean of those three countries in each area for 10 years and eliminating the lowest and the highest values for those 10 years (Table 3).
Two global densities were defined and translated into useable quantitative information. The thermal density was defined as the ratio of the total delivered energy (in kWh) over the length of the network (in km) [38]. Two extreme values were used: the density of 2 GWh/km and the density of 10 GWh/km. These resulted in network lengths of 11 km and 55 km for the demand of 110 GWh.
In order to calculate the installed power of the different case studies across Europe and depending on the density of the habitat, the formula shown in Equation (1) was used, taking into account various parameters:
P t o   i n s t a l l = P h e a t i n g + P D H W   f 1 + s 1 + p
where:
  • P h e a t i n g is the maximal needed power for heating in the considered building (in MW);
  • P D H W is the maximal needed power for domestic hot water in the considered building (in MW);
  • f is the diversity factor;
  • s is the safety coefficient;
  • p is the leak rate (substation and network, in percentage).
The diversity factor represents how the heat demand of several installations was smoothed out because of the asynchrony of heat demands. It was evaluated with daily profiles of representative heat demands for every kind of building, calculated in a hourly timestep (cf. [39]). For a total heat load of X MW, a diversity factor of 0.7 meant that a 0.7xX MW plant was needed. For the neighborhoods studied herein, diversity factors of 0.82 to 0.85 in the different European areas were used. In offices, especially old ones, the heating power peak was important at the early morning to reach the heating setpoint before the occupants’ arrival. For all our neighborhoods, this heating peak appeared as the most sizing.
Regarding the safety coefficient, sources have varied from 25% [40] to 15% [41]. It was thus decided to fix it at 20%.
Regarding the substations and network losses, generic literature data gave a forfeiting rate of around 5% [41] or less [42]. However, losses were estimated in absolute values at around 15 to 30 W/m [43], so a choice of 22.5 W/m was made. Considering lengths of 11 or 55 km and a daily all-day functioning network, losses of 2% for dense networks and of 10% for less dense networks were calculated. This gave a range of possibilities around the standard 5% losses encountered in the literature.
Internal ENGIE Lab experts and the literature have estimated the efficiency of a substation at about 98%, in line with [44].
The maximal needed power for heating in the considered building calculation, P h e a t i n g , was given by Equation (2) [45]:
P h e a t i n g = C T r e f T e x t H D D 24 i
where:
  • Tref is the required temperature for heating: 18 °C;
  • Text is the minimal external temperature (°C);
  • HDD is the heating degree days of the considered area (°C∙d);
  • C is the annual heating consumption of the building (in MWh);
  • i is the intermittence coefficient, which corresponds to the heating system setpoint temperature variations.
For the different kinds of buildings, the annual consumptions were estimated by crossing the temperatures and the consumption per surface. These are available in European databases and regulatory reference documents such as the RT2012 ([39]) or the EPBD [46].
The intermittence coefficient was defined in Equation (3):
i = H D D 24 Δ θ N b h N b H e a t i n g D a y s H D D 24
where:
  • Δ θ is the difference between the reduced temperature setpoint and the standard setpoint (°C);
  • N b h is the number of hours during which the setpoint was reduced (8 h in residential buildings and 12 h in offices considered);
  • N b H e a t i n g D a y s is the number of days in the heating period, varying between 100 and 250 days according to the area and the type of building);
  • the maximal needed power for domestic hot water, P D H W , is given by Equation (4) [45] (in MW):
    P D H W = c Q 365 h
    where:
    • c is annual domestic hot water (DHW) consumption (in m3);
    • Q is the energy needed to heat 1 m3 (in MWh/m3);
    • h is the number of daily hours when the hot water tank heating is needed.
Finally, by combining the networks and substation losses with the safety coefficient, it was possible to obtain the power necessary for district heating units,   P t o   i n s t a l l , for every scenario variation (Table 4).
The size of the energy source equipment (decentralized natural gas boilers for instance) varied accordingly to these installed powers, as did the quantity of the materials needed.

3. Life Cycle Inventory

The technologies modelled in the LCA software within the different scenarios are presented below. They related both to heat production systems and network systems. For each technology, the main characteristics taken into account in this study are presented, as well as the adjustments that were made to model the technology in the different European areas.

3.1. Fuel Supply: Main Fuel and Complement

Electricity mixes from ecoinvent v3.5 (high-voltage national mixes for the district scenarios (S1–S5) and low-voltage national mixes for the individual scenarios (S6–S8)) were adopted in this study to account for the transmission networks for the individual scenarios. As a result, from the modelling of the European regions from the ecoinvent datasets, the different electricity generation sources are presented in Table 5.
Natural gas chains were modelled country-by-country, with high-pressure gas mixes for the district scenarios (S1–S5) and low-pressure gas mixes for the individual scenarios (S6–S8), chosen to account for the distribution networks for the individual scenarios.
In this study, the direct emissions of biomass combustion were collected from measurements of different units. Ecoinvent woodchips were considered as the biomass input for this study, with a lower heating value (LHV) of 19 MJ/kg.
A geothermal heat system was developed in France on the Dogger basin (Paris area). This is, however, not the case for all the countries in Europe, despite the potential of such systems. There was thus a lack of data regarding the performance of other units in Europe. We therefore assumed that the Dogger doublet system could actually be duplicated in every area of Europe where water at such a temperature was encountered, as specified in Table 6. This significant assumption neglected the effects of the soil temperature and estimated the quality of the water to be the same as that of the water in the Dogger basin. This meant that both depths and electricity mixes varied within the study.
There are many potential heat recovery options (e.g., [47]), and those options require heat exchangers or heat pumps to integrate the heat into the district networks. In this study, waste energy was considered hot enough to be recovered with simple heat exchangers. The waste energy was modelled under the zero-burden consideration, as it was assumed to be economically uninteresting and otherwise wasted by its producer (all burdens allocated to its primary function(s)) [48]. This assumption can be challenged depending on the source of the data, especially for incineration waste heat, where the question of the economic interest of valorizing the excess heat as a resource can be raised compared with treating waste materials and inevitably producing excess heat [49].

3.2. Heat Production: Main and Complement Heat Downstream

The whole principle of a gas boiler is to burn gas and to recover the energy of this combustion to heat water. In this study, two kinds of natural gas boilers were considered:
  • conventional boilers, which represent most of the existing stock for standalone solutions;
  • condensing boilers, which have the same basic properties as conventional boilers but include lower fume temperatures to cause condensation and thus recover latent heat. This kind of equipment has a much higher yield than a conventional boiler; the yield may be even higher than 100% of the lower heating value (LHV).
Condensing boilers are now considered the standard option for new buildings and were considered as the installed solutions for both new housing and new office buildings. However, as the current stock is mostly dominated by noncondensing boilers (87% in France, 69% in Germany and 98% in Belgium, for instance, in 2012 [50]), old housing and old office buildings were modelled as having noncondensing boilers.
Regarding district-size installed boilers, it was assumed that condensing boilers were used, given their size, as in new installations. The system is not modified by the size. However, the equipment cannot be linearly extended, and efficiencies and emissions were also adapted between small and large equipment using data from the literature and regulatory requirements.
The efficiency of a boiler can be expressed regarding the LHV or the high heating value (HHV): LHV is the maximum heat that can be generated before exhaust gas condensation, and HHV is the maximum heat that can be generated by both the gas and the condensation of all the water content of the exhaust gases.
The following assumptions were made:
  • The nominal efficiency after one year of installation for an average 100 kW condensing boiler was between 95 and 105% and closer to 85–95% for lower temperatures [50,51]. A 15% reduction factor was considered for converting nominal efficiencies to annual ones; this led to considered annual efficiencies of 90% for small condensing boilers and of 80% for small noncondensing boilers.
  • The efficiency of larger installations was considered better, as usually, the construction in larger installations is better, the installation is better maintained, the flame is more oxygenized, there is more space to develop and there is better inertia. This meant that, for an average 20 MW unit, the yield could reach around 102–105% on LHV for condensing boilers and 92–97% for noncondensing ones [50,51]. As the installations were considered to be composed of several units to allow a variation of the load, a 5% factor was considered on annual efficiencies. This led to annual efficiencies of 97% for large condensing boilers and 90% for large noncondensing boilers.
These values were in line with those recommended by the European Union delegated regulation 2015/2042 [52].
Regarding emissions, CO2 emissions were calculated based on the ecoinvent approaches, whereas NOX emissions came from the European Regulation for emission limit values (Directive (EU) 2015/2193 of the European Parliament and of the Council of 25 November 2015 on the limitation of emissions of certain pollutants into the air from medium combustion plants (MCP Directive)).
In this study, gas boilers based on natural gas were considered. In the short run, it is possible to imagine boilers (individual or district furnaces) burning biogas (from anaerobic digestion or pyrogasification, for instance) or even hydrogen. This possibility was further developed within the sensitivity analysis.
Biomass boilers lose performance and efficiency with small heat loads. Since standalone boilers must be designed to provide heat all year long and achieve peaks with high heat loads, their design leads to a wide period of small heat loads in the year that affects the global efficiency. District solutions can be designed with a complement for the heat or be composed of plants with different capacities to ensure modulation (cascade effect) and thus a smaller number of small heat loads and better overall efficiency.
We therefore set the annual efficiency of district-size boilers at 90% and that of building-size boilers at 80%, in line with the large-combustion plants BAT [53] and the recommended values from European Union delegated regulation 2015/2042 [52].
Regarding NOX, CO, NMVOC and particulate emissions for large-scale biomass furnaces, assumptions were based on actual atmospheric emission data (internal measures) from 79 boilers in this power range. The emissions for standalone boilers were estimated from internal measures for 33 boilers in this power range.
Internal combustion engine CHP systems are the most commonly used technology for DHSs. In such systems, a motor-powered CHP plant is constructed by connecting a motor shaft to a generator. The electricity generated is then fed into the power network. Heat from the exhaust gas, the cooling of the motor’s cylinders and sometimes the cooling of a turbo compressor is fed into the local DH network.
Equipment and the percentage of energy shared between electricity and heat production were supposed to be the same in every geographical subsection: 53% of heat and 47% of electricity, in line with internal expert estimations and the European average for ENGIE Networks. These figures were also in line with the Eurostat European data for 2017, which gave values of 55% heat and 45% electricity. Efficiencies also remained equal across Europe and were estimated at 90% (LHV) for gas cogeneration [50].
For geothermal heat, the system adopted in this study was the typical French deep geothermal system. It consists of one doublet of boreholes at around 1800 m to reach a sufficiently hot aquifer.
It was assumed that all the impacts caused by the construction, production and use of the well would be proportional to the depth of the well. However, the heat pump electricity consumption would remain the same, as the water raised would be at the same temperature. This important assumption neglected the effects of the soil temperature and assumed that the quality of the water would be the same that of water in the French Dogger basin. This meant that both depths and electricity mixes varied within the study.
As the pumped water was supposed to be at 60 °C in this kind of system, it needed an energy complement to reach the 70 °C needed for the network. This was achieved with a heat pump.
The geothermal heat system was modelled on the basis of a depth of 1800 m and then adapted to other depths (Table 6). Areas were chosen where the geothermal potential followed the temperature field of the Dogger basin [54]. Although this assumption was not completely precise, it was based on macro-level temperature levels, as there is a lack of quality, quantity and accessibility of geological information in Europe [55].
Heat pumps of 9.5 MW and 8.5 MW were used with the R1234ze refrigerant to meet regulation constraints on the use of HFC. However, a sensitivity analysis led us to assess the potential importance of this assumption.
The coefficient of performance (COP) for the whole installation was estimated at 6.3 for the 1800 m scenario, corresponding to Parisian Dogger onsite data.
Air/water heat pumps are constituted of a heat pump as described above, for which the fluid to be heated is water and the heat source is the outside air, plus electrical resistance when the pumps alone are not efficient enough.
In this case, the source was not the same, and thus, the COP had to be adapted for the regions. The annual COP of this system depends on the outside temperature and on the heating demand throughout the year, which is climate dependent. The seasonal COP (SCOP) was taken into account to address the changes across Europe according to [56]. Electricity mixes were also adapted for the different areas.
The different efficiencies and COPs are presented in the table below (Table 7).

3.3. Network Production

District heating networks are composed of a feed and a return water line. In this study, two preinsulated pipelines systems composed of the same material were considered. Those preinsulated pipelines were considered to be DN300, DN250 and DN200 for distribution, based on [57]. They are buried at a depth that can vary from 0.5 to 3 m, with a mean of 0.8 m: this mean value was considered in the study.
The network unit was modelled on a 1 km basis and then adapted to other lengths [57]. The installation was modelled according to [28].

3.4. Network and Substation Use

Pumps are also present along the network. The electricity consumption of those pumps was estimated at 7 kWh per MWh of delivered heat [58].
It is possible to criticize the assumption that network properties remained the same in every geographical situation. In particular, this cannot be true for the heat losses, as the soil temperature and temperature gradient might differ slightly. As heat losses are difficult to model, and as it is difficult to gather data regarding their variation, a sensitivity analysis was conducted on the insulation thickness, considering its effectiveness at mitigating the potential losses [59].

3.5. Infrastructure

The different infrastructures used in the different scenarios are presented in Table 8.
The geothermal doublet’s heat pump data were collected internally from real installations. The 1800 m doublet was composed of 600 tons of concrete and 400 tons of steel within the wells.
The two heat pumps had a total weight of 55 tons, distributed across the stainless-steel condenser (35%), the steel evaporator (30%), the copper and steel engine (30%) and the refrigerant (5%).
These inventories are aligned with those in [35].

4. Results

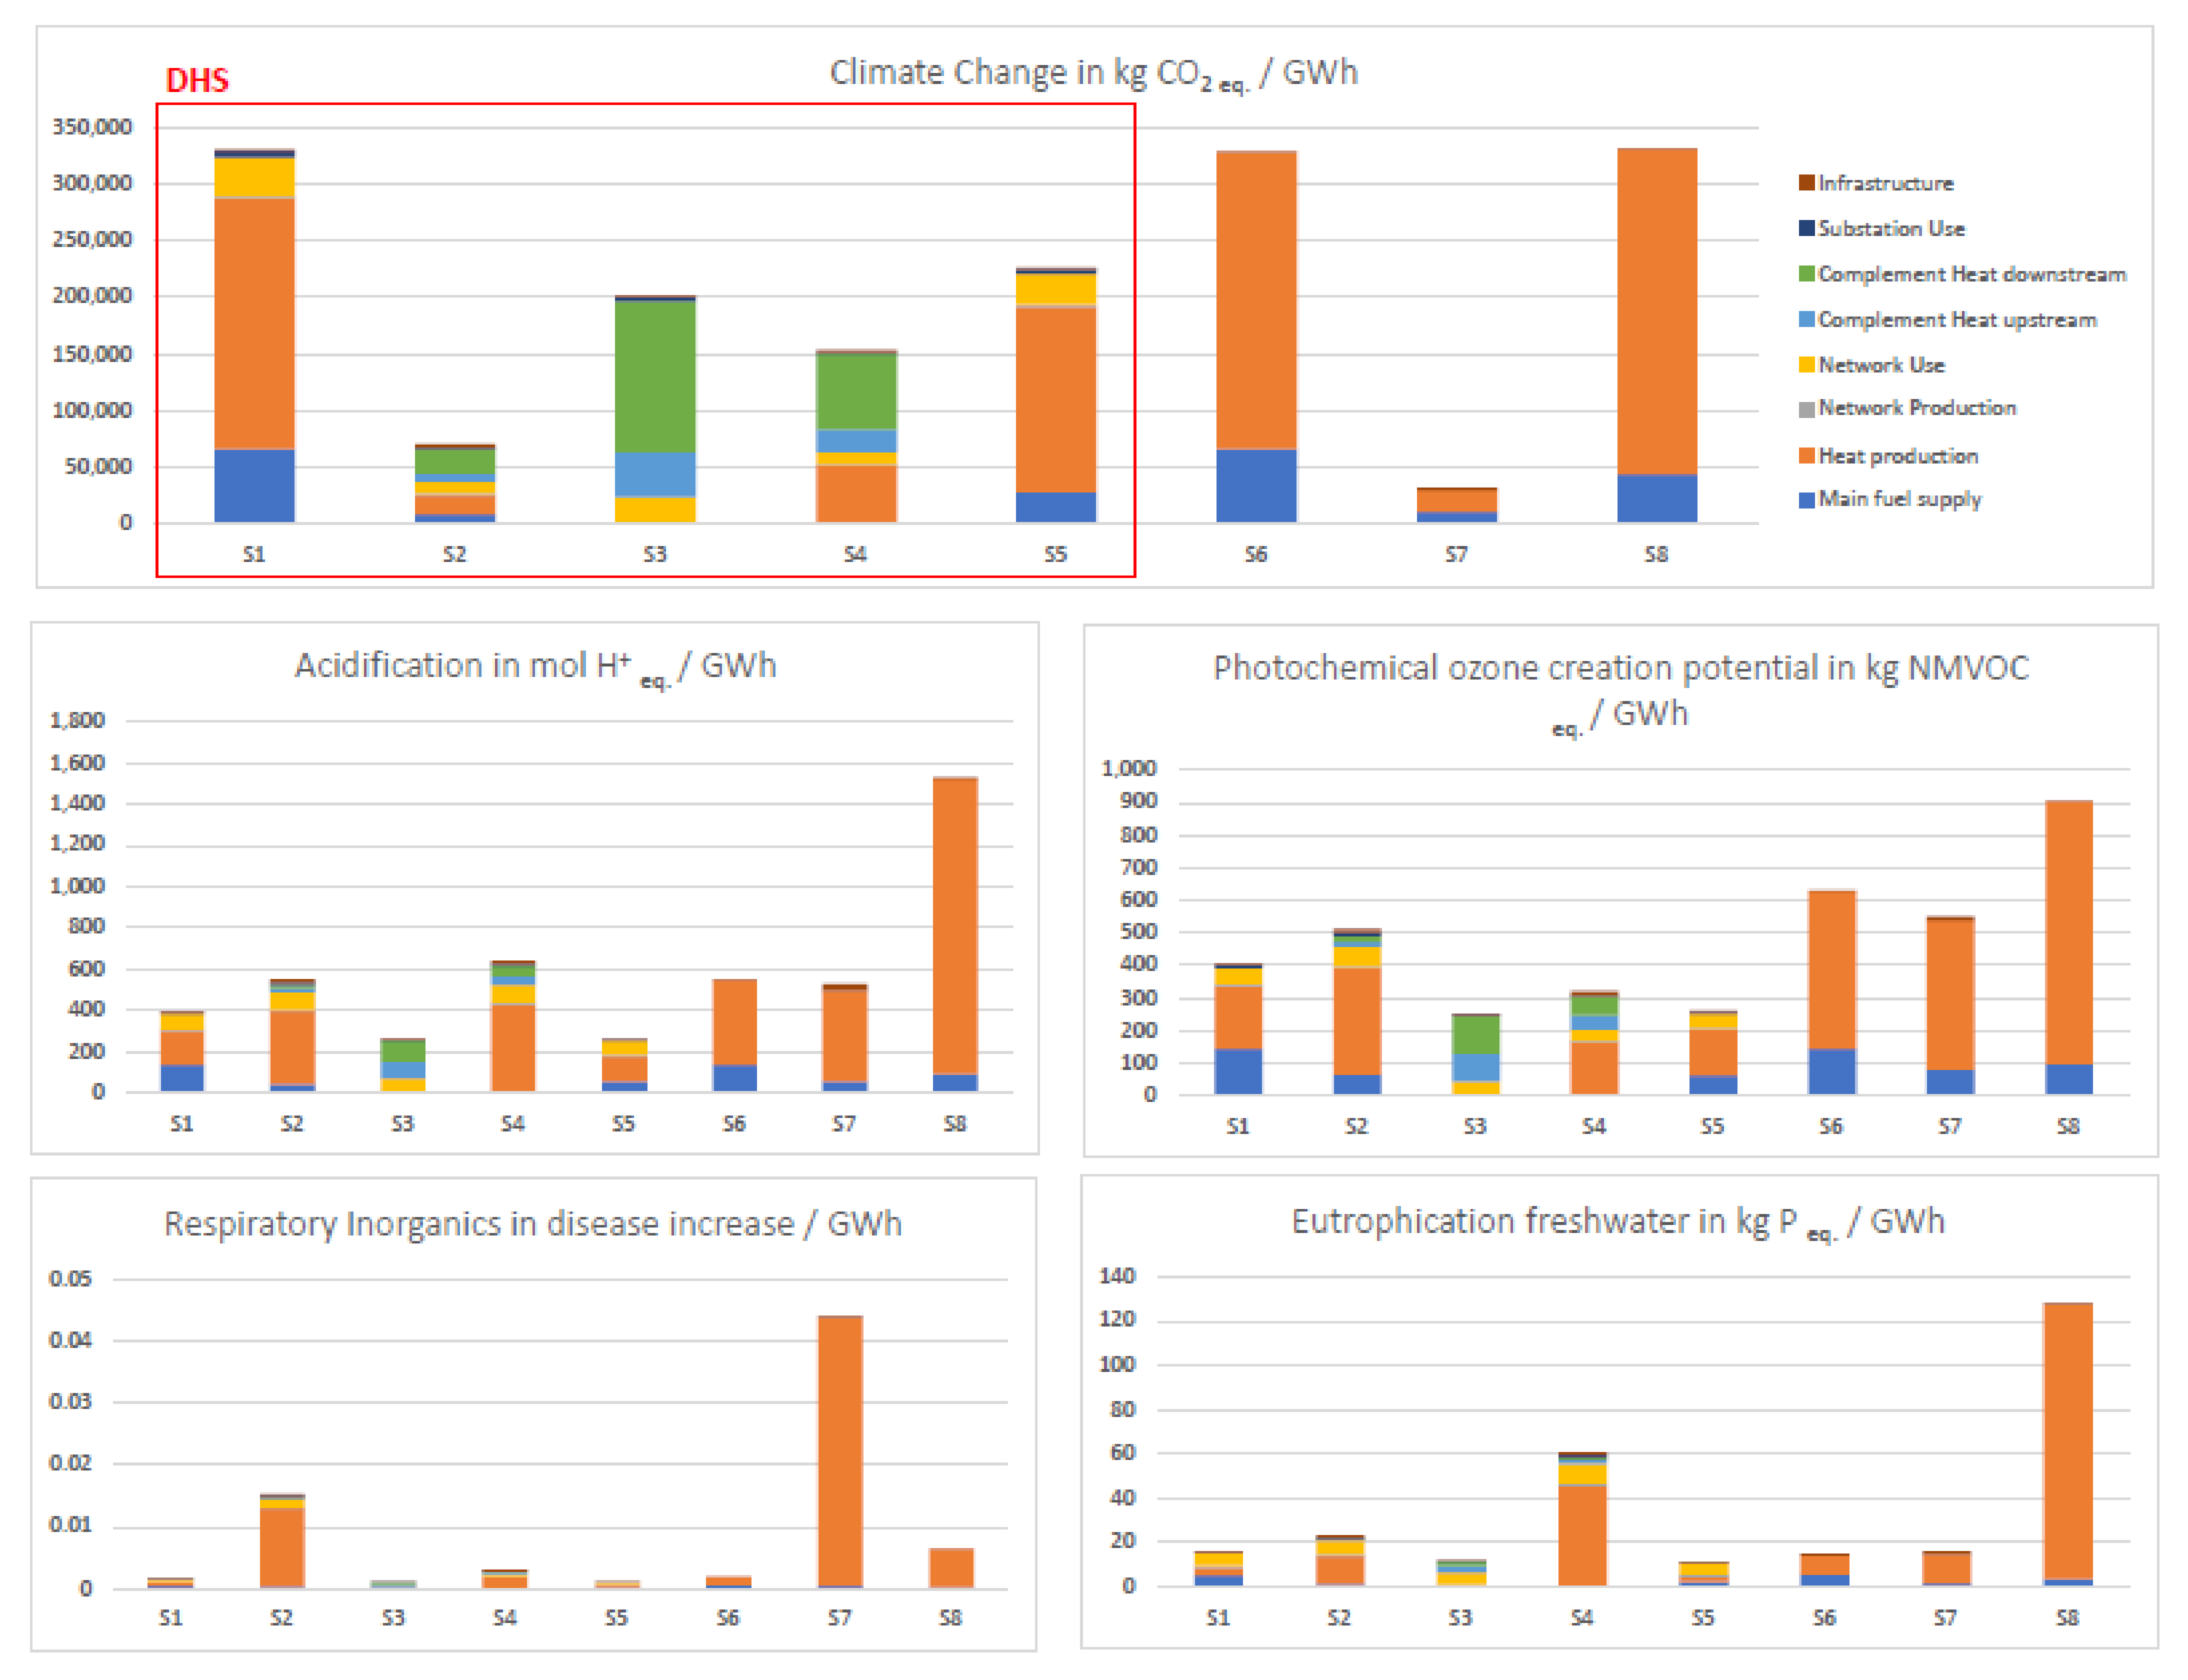
4.1. Main Impact Category Contributors

After ruling out the level III impact categories from the PEF (less robust) list, we were left with nine remaining impact categories. The normalization tool from the EF v2.0 calculation method was used [37] to identify the categories with the greatest impact. The results are shown in the graph below (Figure 2). Weighting with the ReCiPe endpoint methodology was used to select the impact categories that contributed the most to the human health and ecosystems damage with the methodology adopted in [35].
As shown in Figure 2, climate change appeared to be the impact category affected by most heating systems. Even if the results were less homogenous among the scenarios, respiratory inorganics (particulate matter) could not be neglected either. Acidification and photochemical ozone creation potential were also retained for further study. Marine and terrestrial eutrophication presented tendencies similar to acidification. Freshwater eutrophication, on the other hand, seemed to follow a different trend. Therefore, in this study, eutrophication was studied only for freshwater. Those indicators were also selected for their contribution to human health and ecosystem damage.
As a result, the impact categories that were further developed were:
  • climate change (100 years), excluding land use change and biogenic carbon;
  • photochemical ozone creation potential (POCP);
  • respiratory inorganics;
  • acidification;
  • eutrophication freshwater.
In addition, as it was not possible to present all eight scenarios under two habitat densities in four geographical areas for five impact categories, to simplify the analysis, some specific case studies were identified as representative.
The very dense–West case study was the best scenario in 27 cases out of the possible 40 (5 indicators × 8 scenarios), and the less dense–East case study was the worst scenario in all 40 cases. These scenarios were followed up on (Figure 2 and Figure 3).

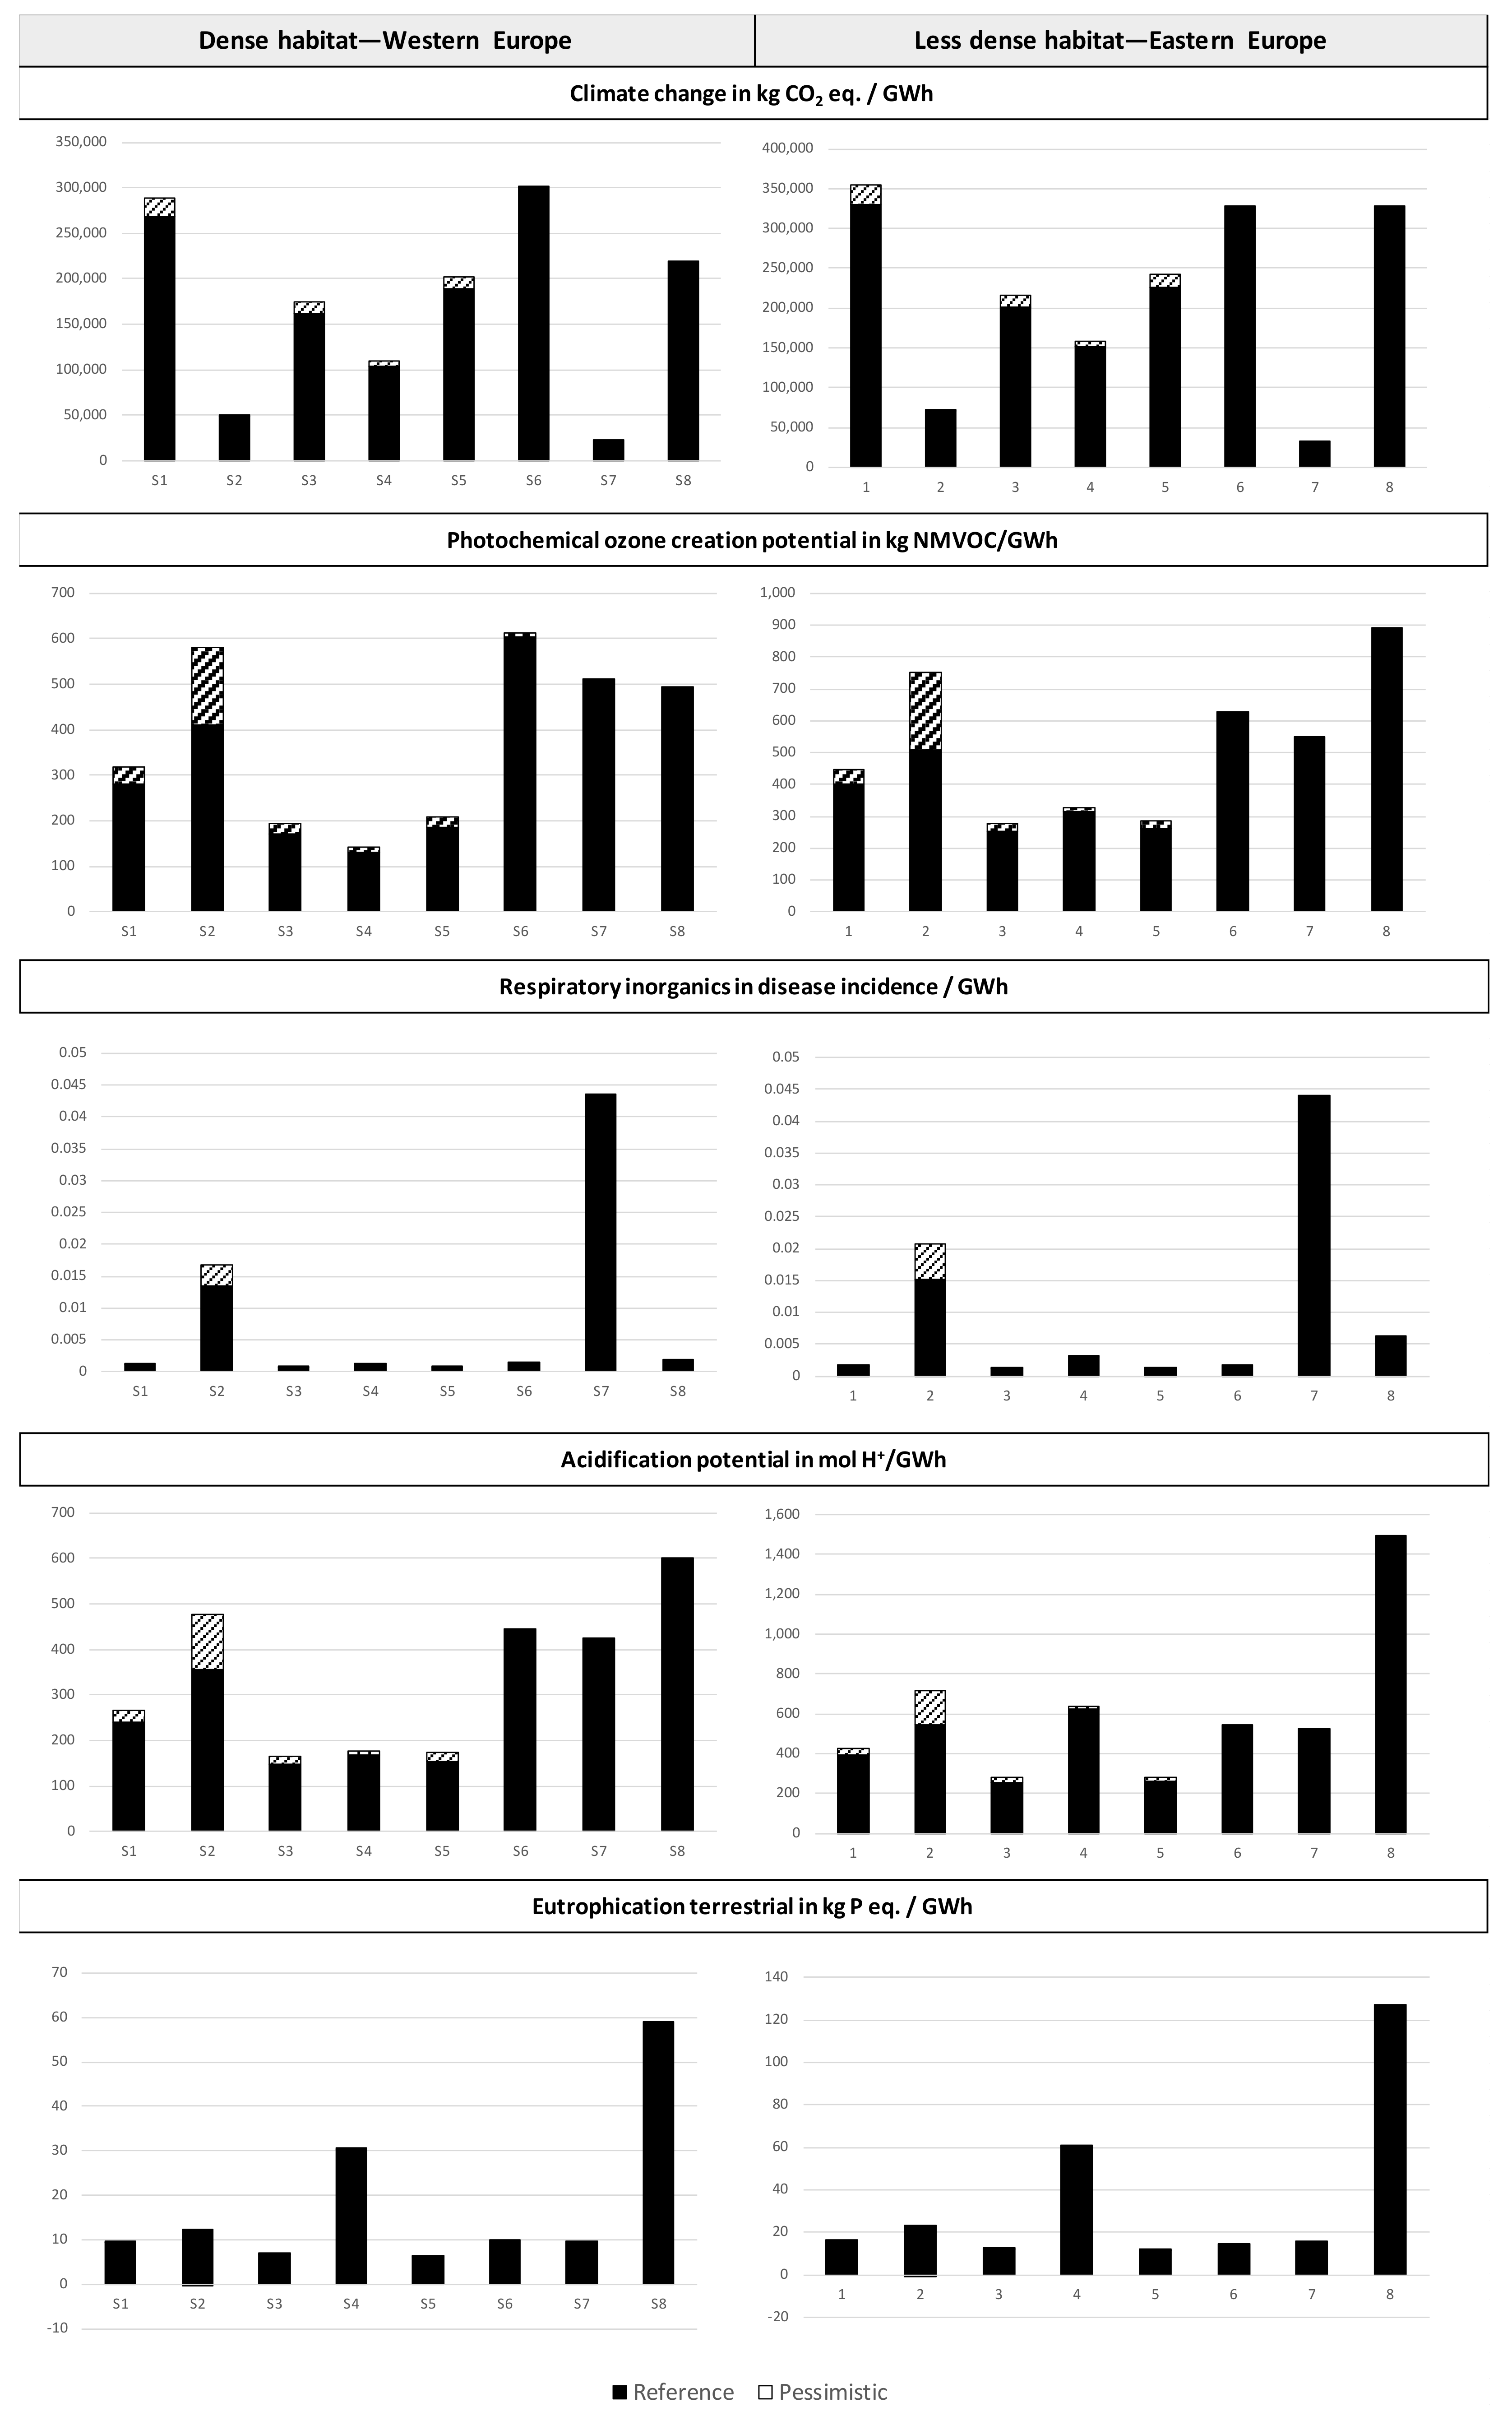
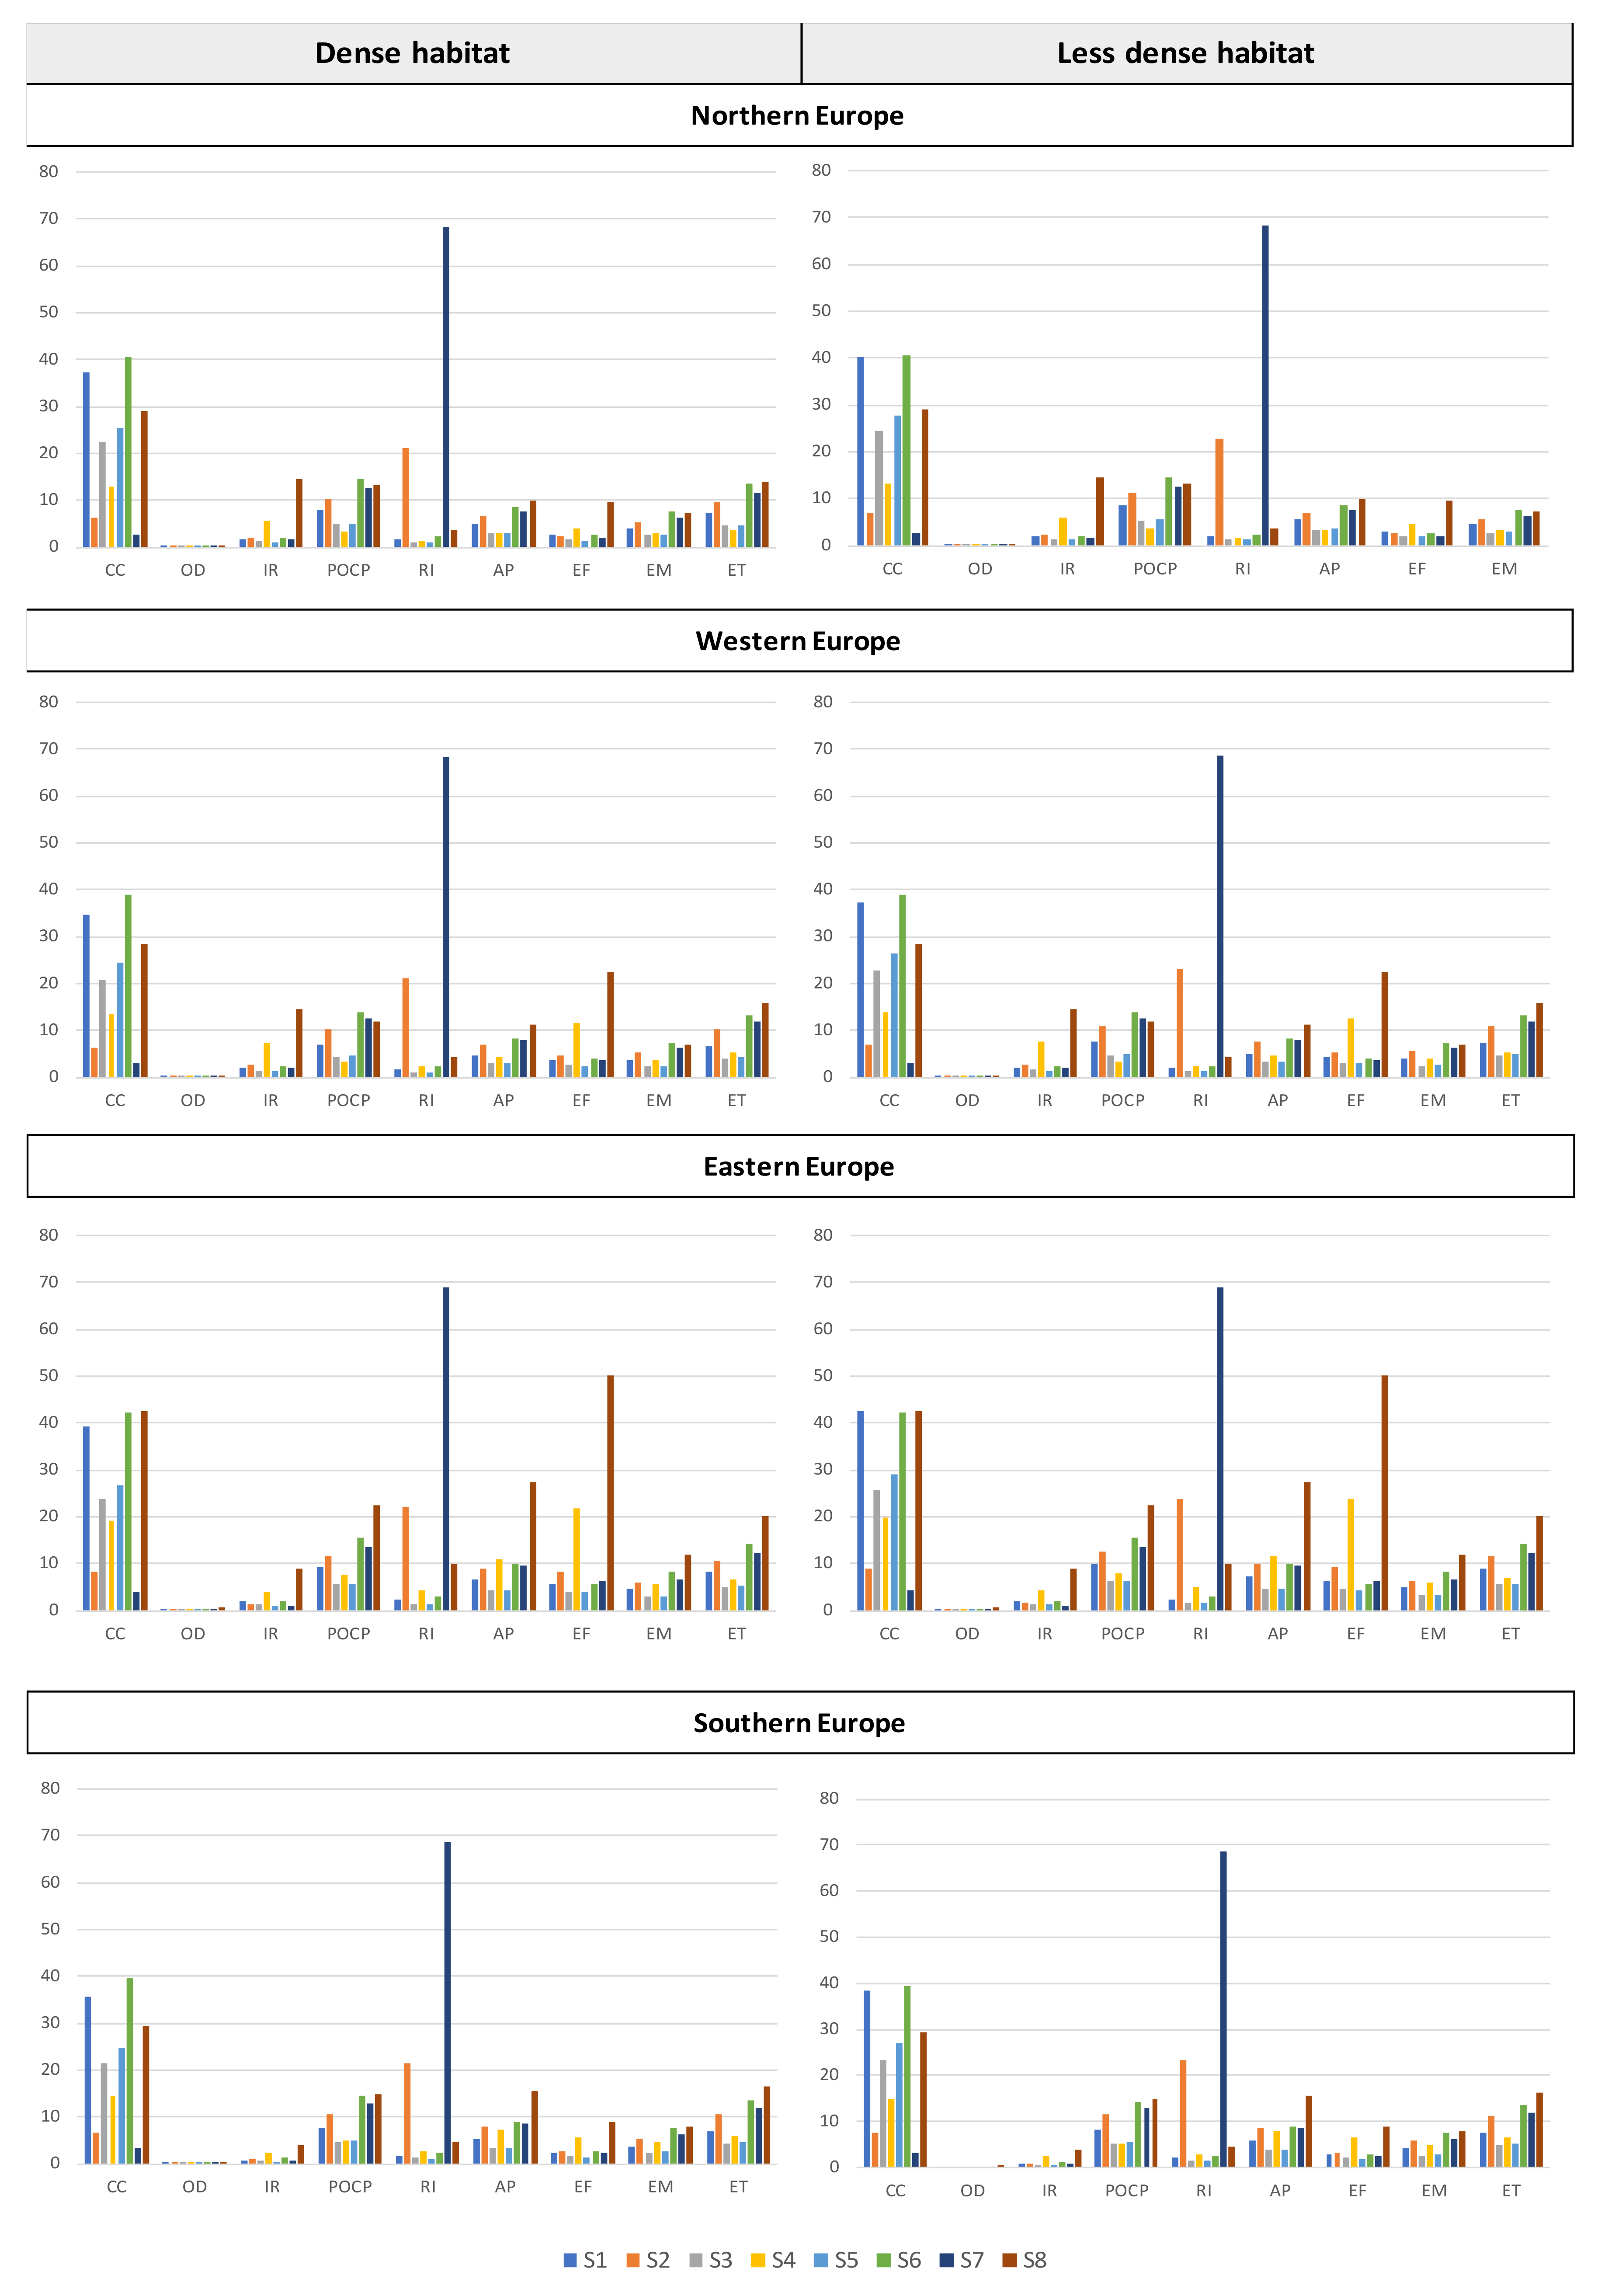
4.2. General Insights on District Heating Systems Environmental Performance

4.2.1. Climate Change

As illustrated in Figure 3 and Figure 4, most of the total impact was driven by direct emissions at the gas furnace or boiler. The only scenario that did not have any gas complement, i.e., the biomass individual boiler scenario (S7), in fact presented the lowest results in this category. The contribution of gas combustion (as the main fuel or complement) in the district scenarios varied from 38% (S2) to 78% (S1).
In the Eastern Europe case study with the less dense habitat, network use had a significant impact, as it was driven by the heat losses along the network, which are more important for a longer network. The impact was also driven by gas-consumption direct emissions and thus the benefits of the district compared with the standalone system were less noticeable (with only 5% reduction). In the Eastern Europe case study with the less dense habitat, the district heating scenarios showed a reduction of 5 to 90% compared to the standalone gas boiler scenario (S6). In the Western Europe case study with the dense habitat, this reduction was between 10 and 84%.
When comparing the biomass scenarios, this conclusion was harder to extract, as the biomass district scenario had a gas complement for supply security reasons because we wanted to build a realistic case. This is one key message of this study: renewable-energy-fed district heating systems need a complement (often natural-gas-based nowadays) to ensure the quality of the heat delivery service, and this has a severe impact on the total environmental score. This also means that the global result depends significantly on the complement rate and nature. A sensitivity analysis was led on this assumption; the results are presented in Section 4.
Considering both the network infrastructure (including installation), together with the substation and heat production plant infrastructure, their contribution to climate change ranges from 1% (S3) to 6% (S6) in the less dense habitat in Eastern Europe.

4.2.2. Photochemical Ozone Creation Potential (POCP)

Regarding human health global impact and POCP in particular, Ozone is formed by the oxidation of the primary contaminants VOCs (volatile organic compounds) or CO (carbon monoxide) in the presence of NOx (nitrogen oxides) under the influence of light.
As predicted, most of this impact was driven by the direct emissions at combustion.
NOx emissions also drove this impact category, which is why natural gas had an important impact. For instance, the district biomass scenario (S2) was much closer in impact to the individual scenario (S7) for the less dense habitat in Eastern Europe than it was for the very dense habitat in Eastern Europe. This was also due to the higher amount of energy that had to be provided, as the network losses were bigger.
The direct emissions of NOx and NMVOCs (nonmethane volatile organic compounds) by biomass combustion were very important. However, the district heating system (S2) performed better than the individual solution (S7) for this indicator.
S4 and S8 contributed more in comparison to other solutions in the eastern Europe scenario. This was because the eastern electricity mix included a bigger proportion of electricity from oil, as previously detailed in Section 3.1, and the direct emissions were therefore responsible for a bigger impact on POCP. The environmental performance of electricity-based scenarios must be considered for each electricity mix, as this factor highly drove the present results.
The key messages from the POCP analysis are that biomass is a challenging issue, and every technology permitting reduction in the release of NMVOCs can help reduce the global impact, which is easier for district systems than for individual ones. The conclusion is not always easy when comparing district and individual scenarios, as network properties (typically length and losses) may induce the opposite effect.

4.2.3. Respiratory Inorganics

The respiratory inorganics were completely driven by particulate matter and thus by biomass combustion. As illustrated in the Figure 3 and Figure 4, the biomass particulate matter emission was much lower in district than individual scenarios. This depended on the biomass input on one hand and the equipment on the other. It is logical to suppose that district systems may have higher-technology equipment, with better efficiency, efficient fume treatment systems and regular maintenance.

4.2.4. Acidification

The drivers of this impact category were mostly SOx and NOx emissions, which is why biomass and natural gas scenarios were the biggest contributors. However, this statement was not true in every European zone or in scenarios using large amounts of electricity, as S4 and S8 became the biggest contributors when the electricity mix contained oil and lignite (cf. Section 3.1), as illustrated in Figure 4. Thus, the comparison between different heat solutions led to different conclusions in different areas.
As observed with POCP, in the less dense habitat, where the network was longer and the heat losses were more important, the biomass district scenario (S2) is very close to the individual scenario (S7), even if the S2 scenario still produced lower impacts.

4.2.5. Eutrophication Freshwater

Another impact category that affects ecosystem health is eutrophication. The eutrophication studied here applied to freshwater and was driven by phosphate emissions.
As presented in Figure 2 and Figure 4, electricity-consuming scenarios (S4 and S8) were the biggest contributors to the freshwater eutrophication impact category, which is especially true in Eastern Europe. In those electricity mixes, the proportion of electricity from hard coal and lignite produced spoils that must be landfilled when being mined and were responsible for most of the total score. However, the phosphate proportion in these landfilled spoils might be overestimated in ecoinvent.
For biomass-based or even gas-based scenarios, electricity was also a major contributor to global impact, as can be seen from the Eastern Europe case study, as the network use life stage was significantly more important than the heat production itself. This was due to the electricity consumption of the pumps along the network (and the spoils induced in producing this electricity).

4.2.6. Main Conclusions from the European Case Study

District heating systems usually showed better environmental performance than individual systems for a given energy source, beyond the usual and unique consideration of the climate change impact category. This statement was, however, influenced by several parameters. It was challenged by the network property: the longer the network was, the higher the losses were, and the smaller the benefits.
Regarding the climate change impact category, the biomass-based district heating scenario was dependent on the gas complement’s nature and rate. However, both district and standalone scenarios presented very low results compared to the others. It must be pointed out again that this is only true when considering biogenic CO2 emissions as neutral, i.e., assuming reliable durability of biomass management. This result cannot be expanded to systems using biomass from deforestation, for instance.
The biomass-based district scenario was among the most important contributors (compared to the other scenarios) to air quality impacts such as respiratory inorganics and photochemical ozone creation potential. More NOx and particulates, responsible for such impacts, were released in this scenario. However, the district scenario behaved better than individual boilers, as it:
  • represented, usually, more modern technology, with more money available and better equipment (filters, etc.);
  • received better maintenance, not taken into account in the system boundaries but directly affecting the global efficiency;
  • benefitted from scale effects enhancing the modulating capability of the system and thus reaching a much better annual efficiency.
Geothermal heat scenarios performed better than other solutions for most of the impact categories. However, they were highly dependent on the nature of the electricity mix involved, as they used heat pumps to get the water to the right temperature.
From a global perspective, the nature of the electricity mix showed its importance, especially for the climate change and eutrophication impact categories.
These results were analyzed in regard to the assumptions made in this study to compare district solutions to standalone ones. Section 4.3 goes through some key assumptions that need to be explained and understood to validate or invalidate the previous statements. It focuses first on the enlarged definition of network efficiency (equipment yields, etc.) to analyze the importance of the district specialty having a security complement heat source. It then examines the biomass assumptions and finally the different allocation factors that can vary, from the waste energy zero burden to the cogeneration factor possibilities.

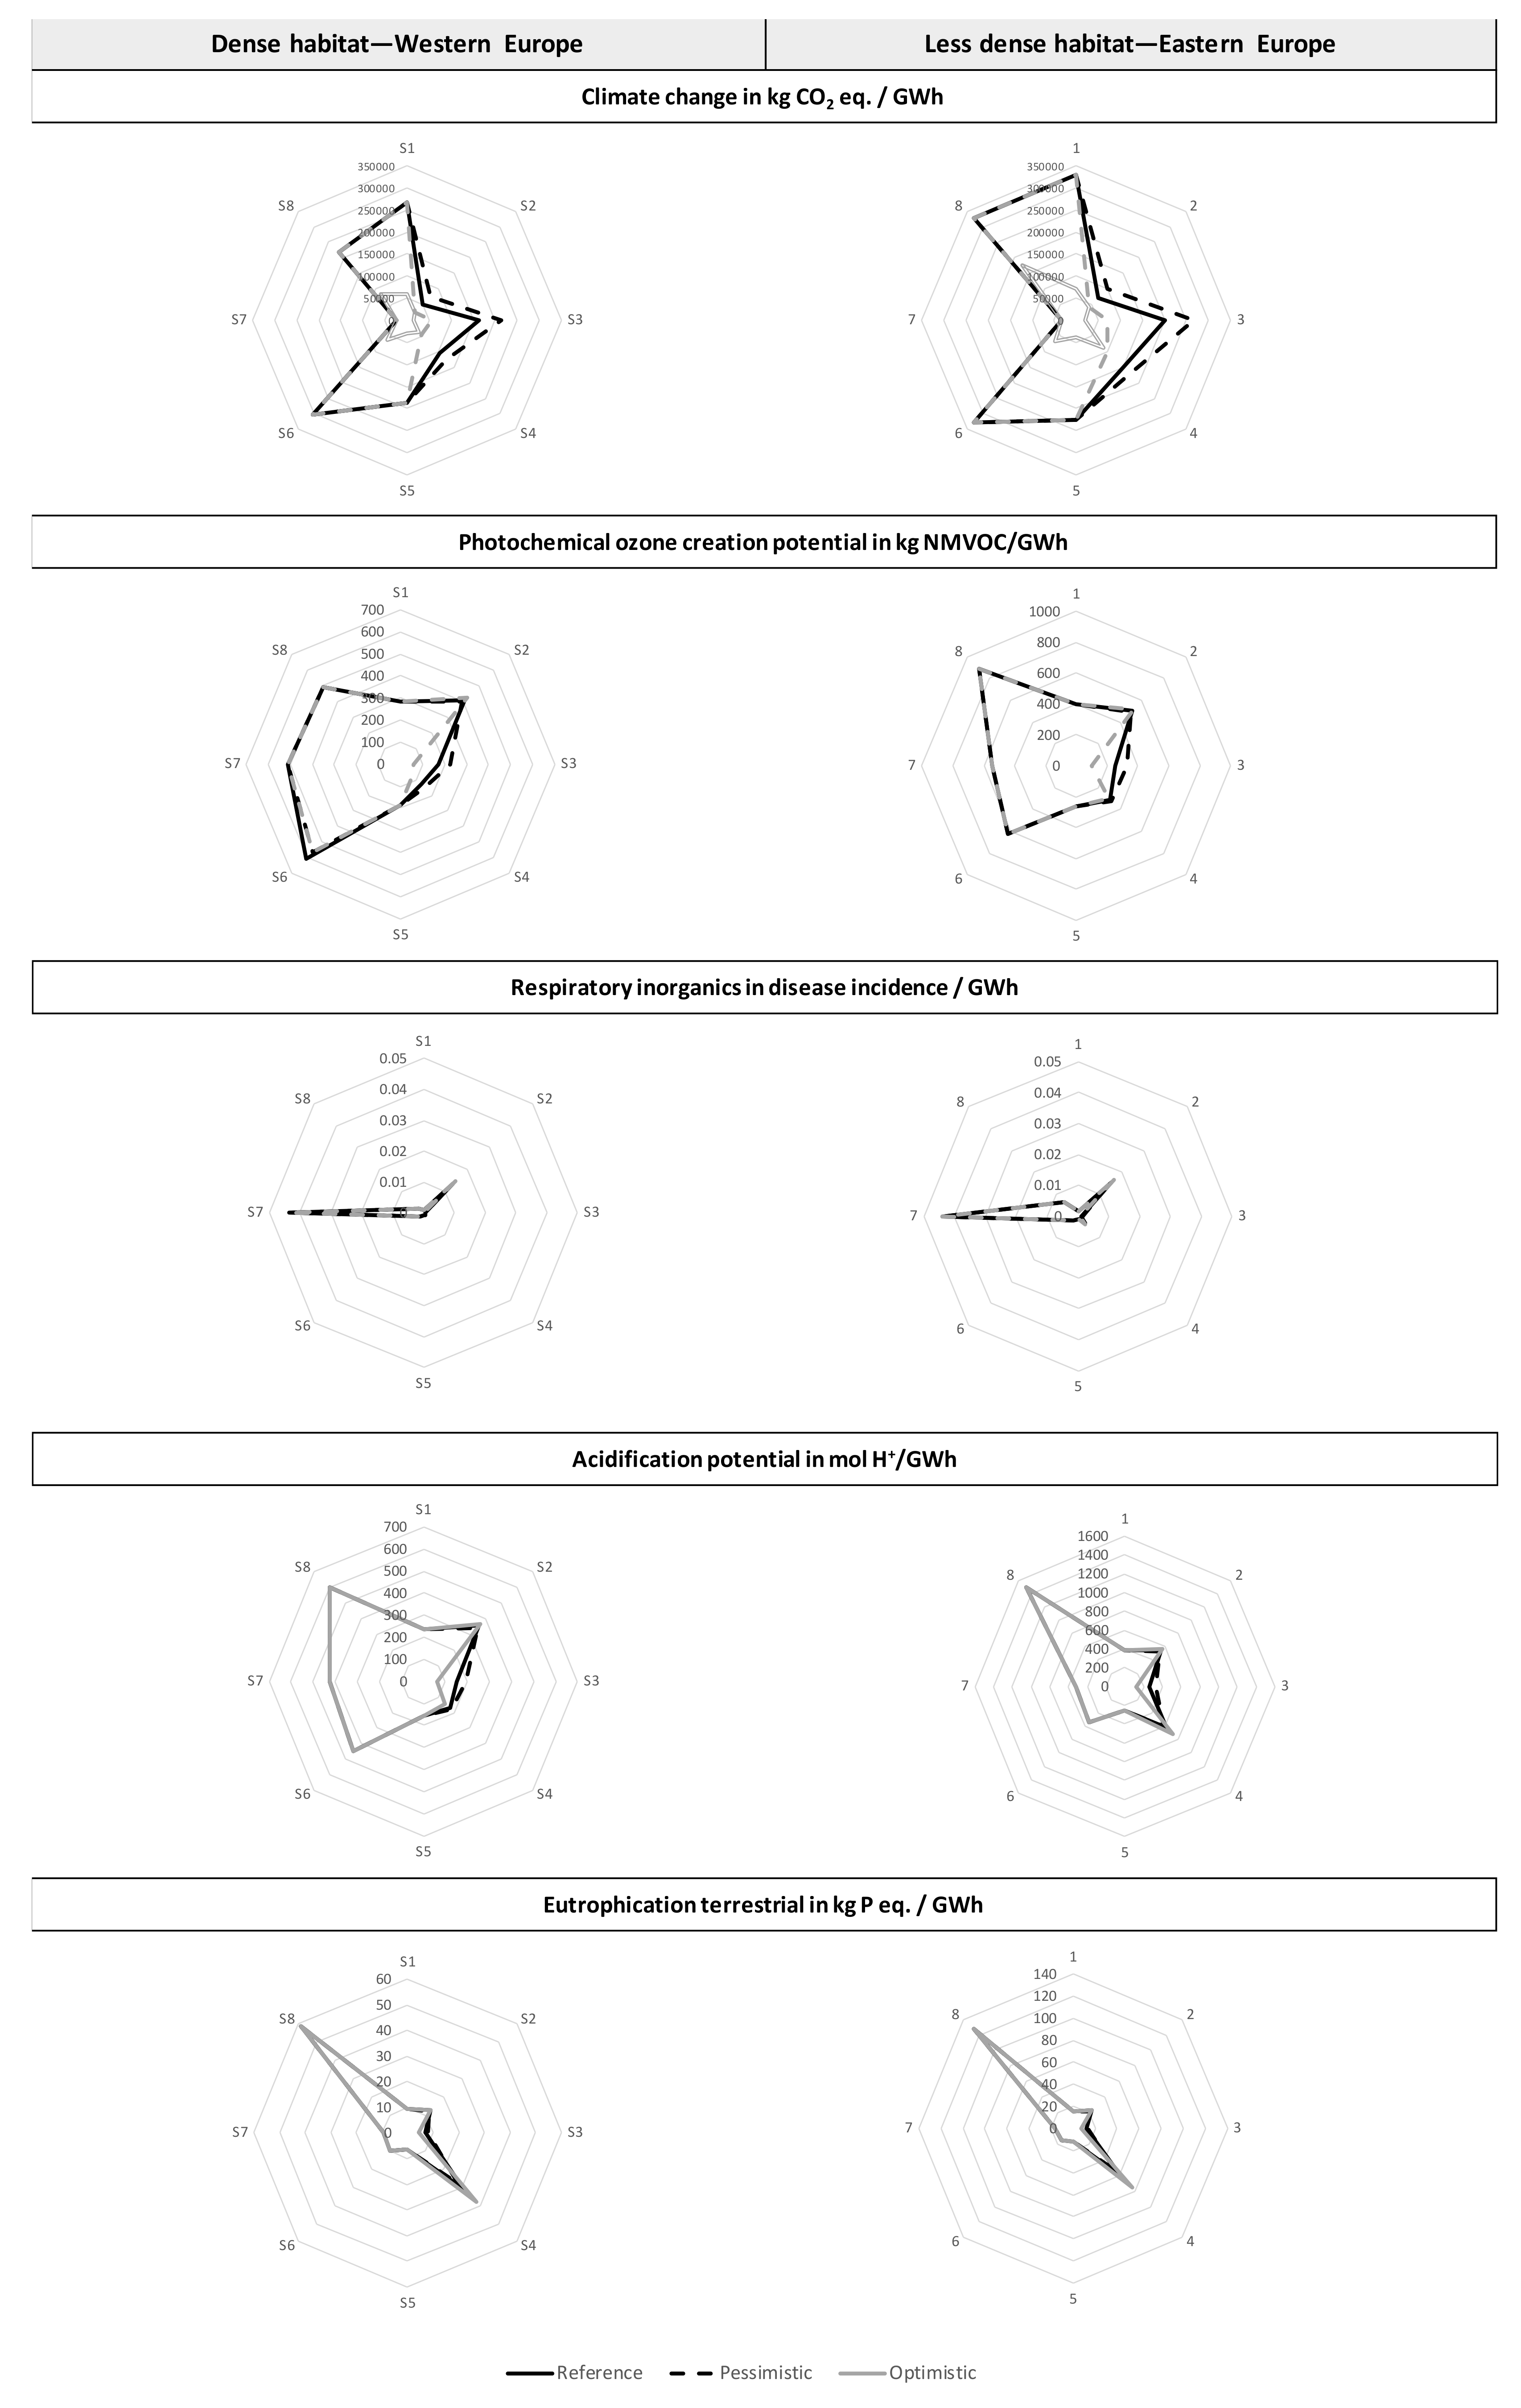
4.3. Sensitivities Analysis

4.3.1. Network Efficiency

The results highlighted the importance of network efficiency in the different indicators’ performance in regard to heat losses. In this study, the efficiency of the district equipment was high enough to counterbalance the overall network efficiency in comparison to standalone solutions. A sensitivity analysis was carried out on natural-gas-based district equipment efficiency to evaluate its importance in the comparison. This sensitivity was not possible for the biomass solutions, as the direct emissions were obtained from measured data and not extrapolated using the efficiency. However, to translate what a difference of efficiency would mean for wood-based scenarios, a sensitivity analysis was carried out with the direct emissions from ecoinvent, using hardwood chips to feed the boiler. The parameters of this analysis are presented below in Table 9.
As illustrated in Figure A1 (Appendix A), the gas-based district equipment efficiency was an important factor in the climate change impact indicator. The conclusion that gas-based district heating networks performed better than standalone solutions for this indicator can be a bit nuanced. In the pessimistic scenario, the performance of district and standalone solutions was similar, considering the uncertainties in life cycle assessment. Our study was based on typical ENGIE fleet equipment, but this parameter needs to be adapted for the considered project in further studies.
The direct emissions of biomass had a big influence on the biomass-based scenario results for the POCP and acidification potential impact categories. The respiratory inorganics impact category kept with the trend of better performance in the district than the standalone scenario. Once again, those direct emissions depended mainly on the efficiency of the equipment and the type of biomass considered. The conclusions drawn in the previous paragraphs were specific to the equipment used by ENGIE, but there are key parameters that need to be evaluated for future life cycle assessment studies.

4.3.2. The Importance of the Nature and Rate of Complements

Renewable-energy-fed district systems need a complement to ensure the quality of the demand; that complement is often fossil-based. As previously stated, this complement was a key driver of the climate change impact category. The gas complement rate for district scenarios can vary between an optimistic and a pessimistic consideration. A sensitivity analysis was therefore carried out from those two points of view after discussions with internal ENGIE experts. The parameters are considered below (Table 10).
In this optimistic scenario, despite a higher infrastructure for a potential backup, the biomass district scenario (S2) performed similarly to the biomass individual scenario (S7). This highlights the previous conclusion that while, in general, district heating systems performed better than individual solutions, this conclusion must be nuanced with realistic aspects such as the supply security and the gas complement to reach resource management requirements.
This leads to Figure A2, which shows that scenarios with a gas complement varied between −74% and 49% according to the sensitivity scenario they were studied under. This was especially the case for the industrial fatal energy case (S3), where the optimistic scenario only allowed infrastructure and 20% of natural gas, which represents a very small total impact.
Although these were theoretical cases, it is more likely that district heating systems combining various heat sources might be able to reduce the fossil complement rate in practice while ensuring the security of energy supply to all customers. Without changing the overall conclusions, this sensitivity is important for the other indicators as well.
As gas combustion was the key driver life cycle stage for almost every scenario, and as there is more and more biogas being produced to substitute for fossil natural gas, a sensitivity analysis was carried out on scenarios incorporating biomethane. However, the sensitivity analysis was conducted only for the climate change impact category, as there were no robust European data available for this study on other impact categories. Biogas was modelled as an anaerobic digestion biomethane of biowaste, in line with the default values provided by the Renewable Energy Directive II for a closed digestate tank, giving a climate change score of 14 g CO2 eq/MJ. [64].
The GWP of biomethane is intimately linked to the considered feedstock, which is why said feedstock was assumed to be biowaste.
Biomass district scenarios (S2) still contributed slightly more than biomass individual scenarios (S7) in the most optimistic variation, but mostly because the biomethane is not completely neutral, as its upstream is more important than that of natural gas per unit of energy.
This sensitivity analysis was carried out only for climate change to remain in line with RED II requirements. However, it could be an interesting route to examine other impacts and other feedstocks for biomethane production.

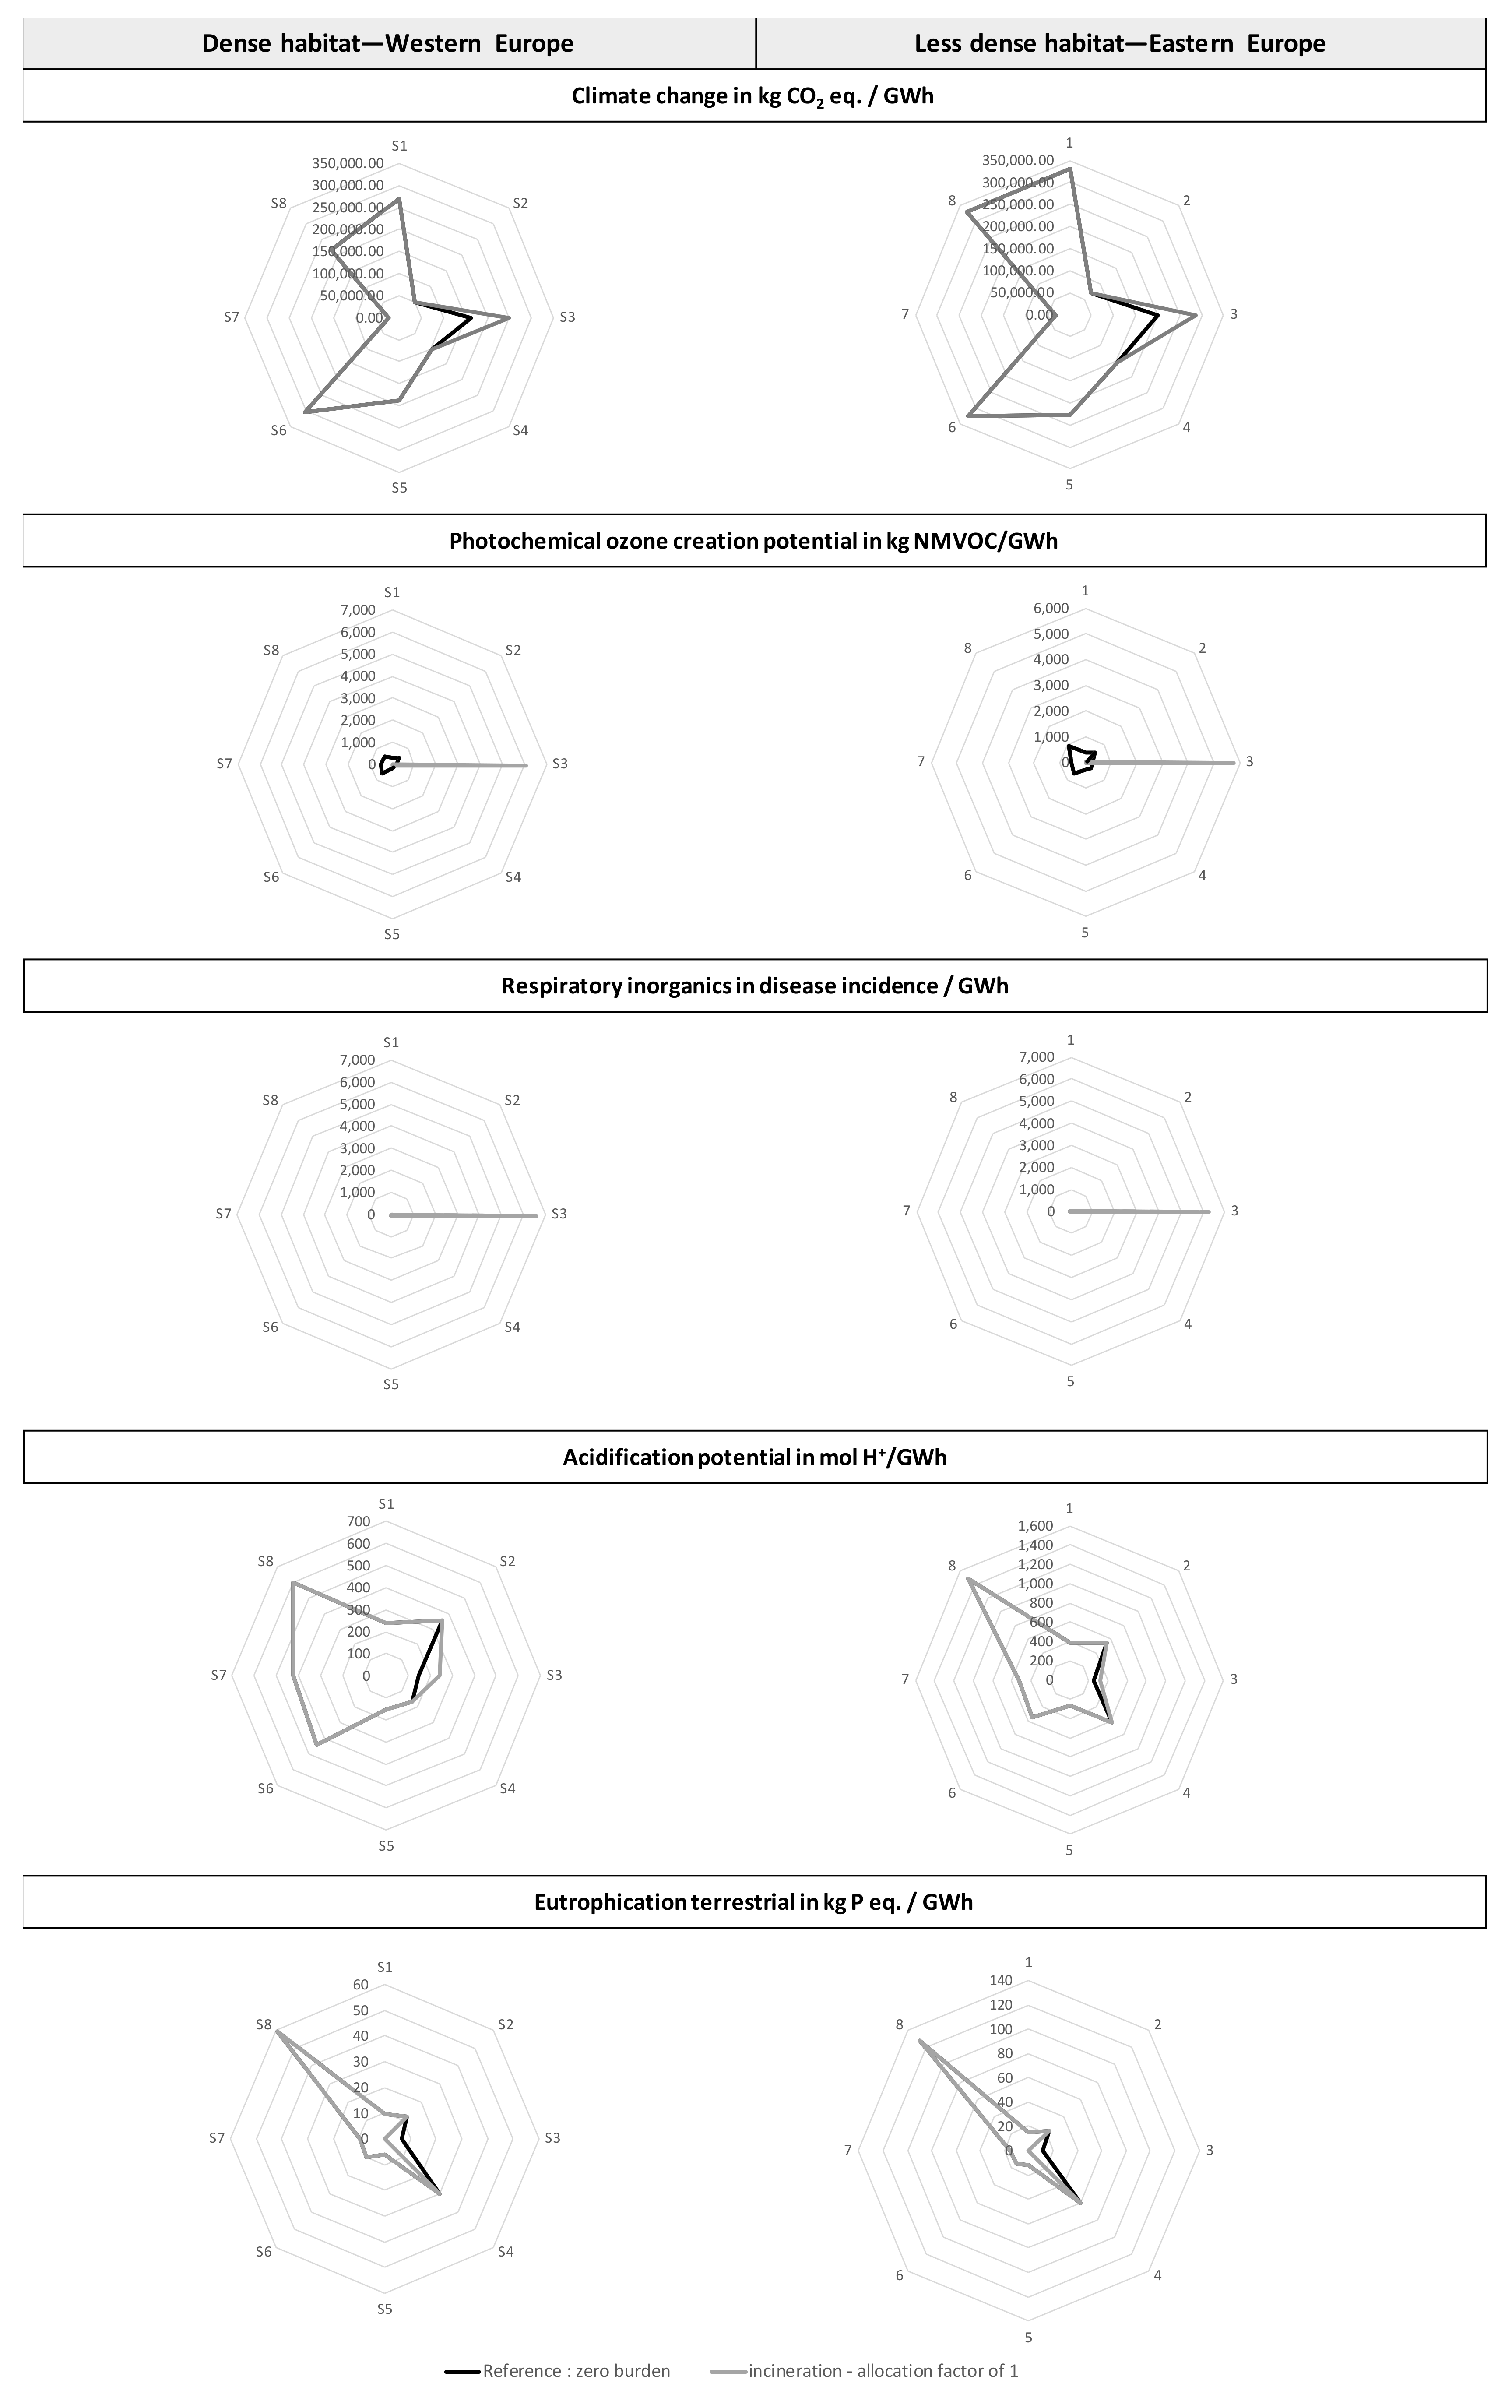
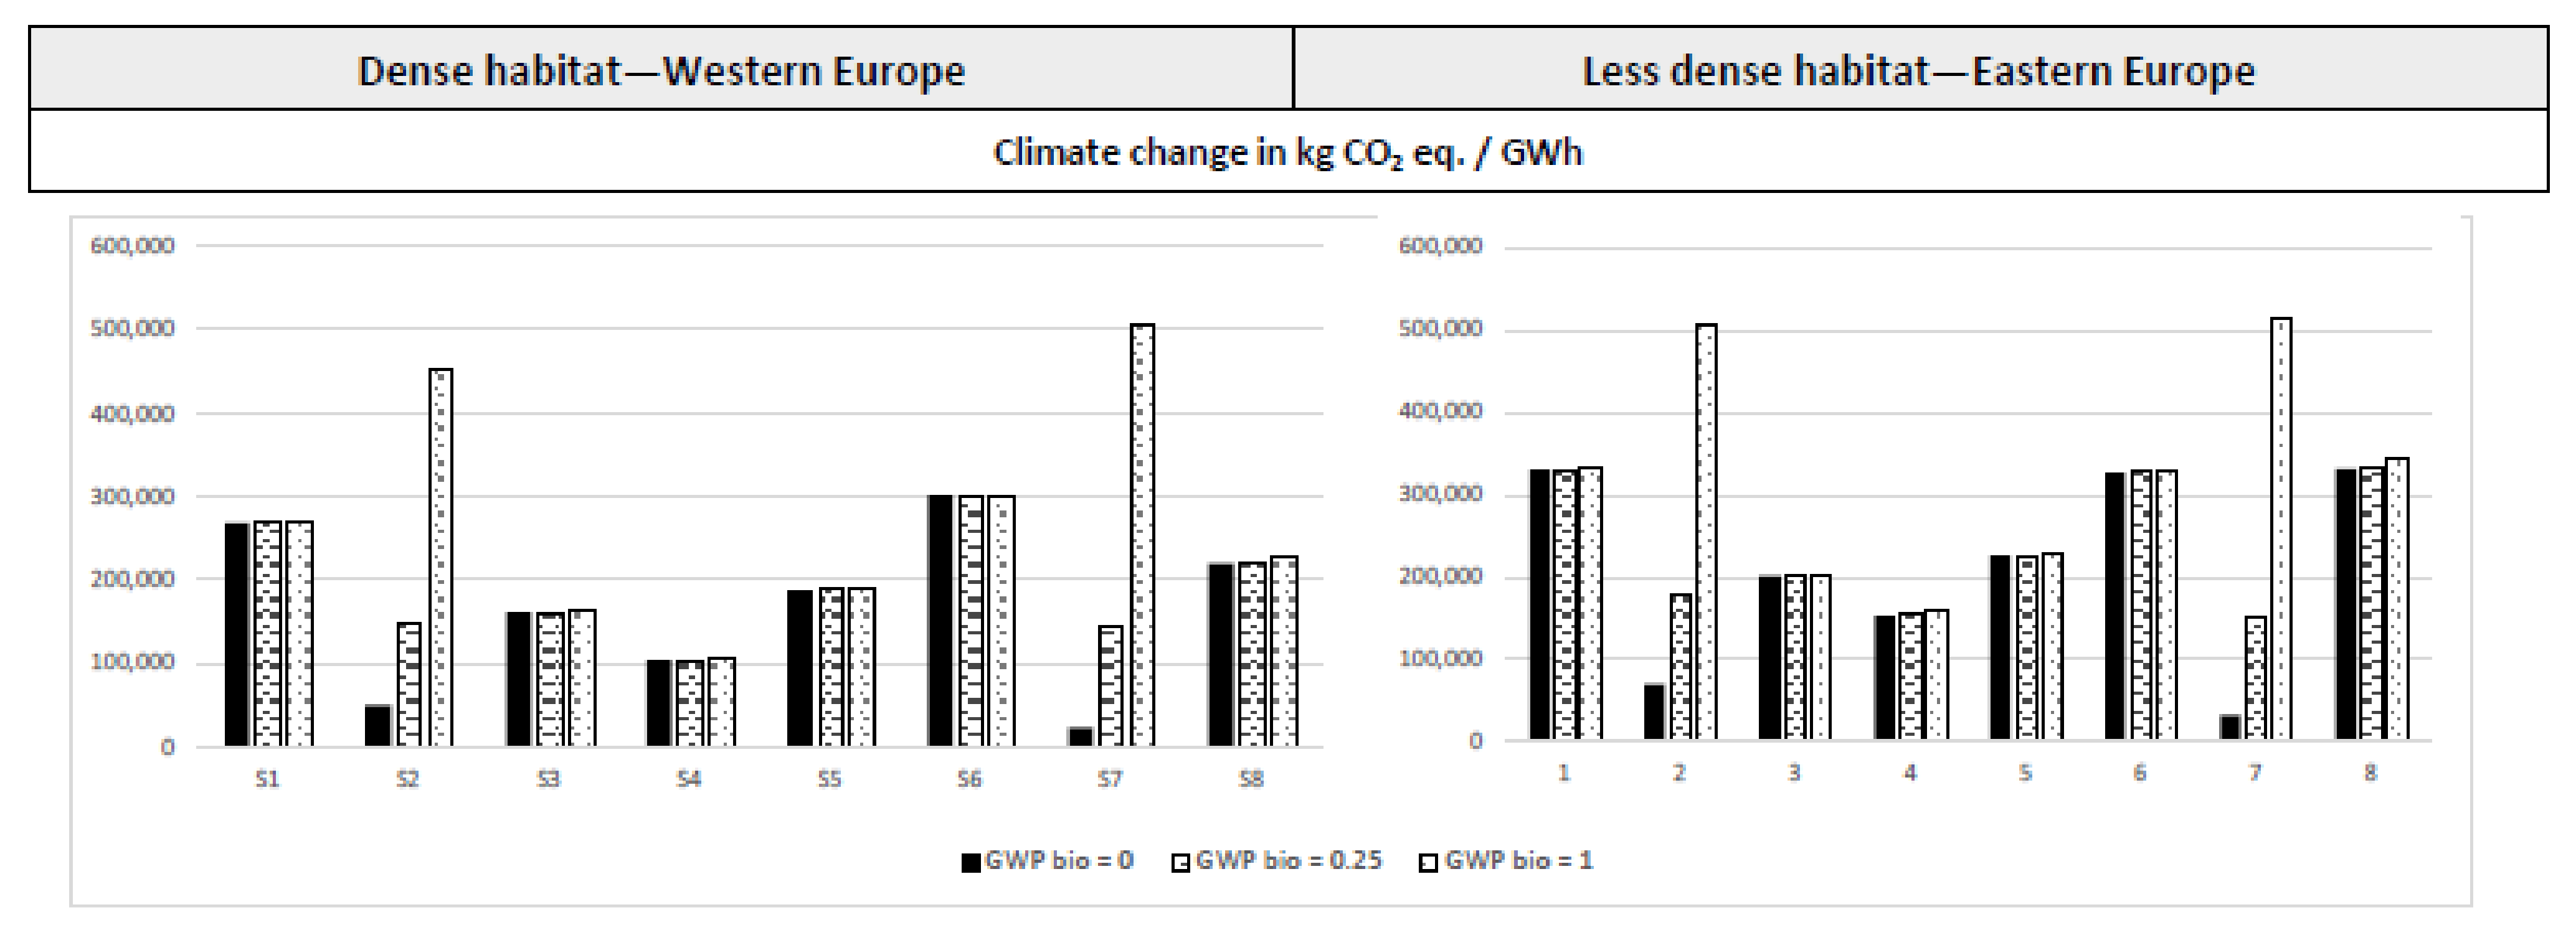
4.3.3. The Importance of Biogenic Carbon Accounting for Biomass-Based Scenarios

Biomass-based scenarios (S2 and S7) performed better on the climate change indicators than the other scenarios under the assumption of neutral carbon dioxide. In this study, the release of CO2 during the combustion of the biomass was supposed to be neutral, as the biomass was composed of biogenic CO2, and the released CO2 actually came from the biomass that had sequestrated it during growth.
The neutrality of the biogenic CO2 in the use phase must, however, be taken cautiously for two reasons:
  • There has been no absolute consensus in the literature regarding the way to account for it. For instance, the GHG protocol advised reporting GHG emissions in one section and biogenic CO2 in another. If the timeframe of a study is shorter than 100 years, the underlying assumption of total reabsorption becomes impossible. The Renewable Energy Directive in Europe [64] also considered biofuel use as neutral. However, some countries, such as Canada, have a shorter-term vision and account for the totality of the biogenic CO2 in the same way as fossil CO2.
  • The claim of neutrality of biogenic CO2 emissions can only be made when the biomass is sustainably managed and not imported from a country, e.g., deforesting its forests. If the biomass were not sustainably managed, the results for climate change for the less dense habitat in Eastern Europe would look like the graph below Figure 5, i.e., with a complete disadvantage for the biomass-based scenario.
Ref. [65] analyzed biogenic CO2 emission impacts by calculating the cumulative radiation forcing over a defined time horizon, depending on the further progressive sequestration of CO2 during a certain period of time corresponding to the growth duration of the biomass. According to [64], it is possible to take into account a GWPbiogenic (100 years) of 0.25, corresponding to a rotation of 60 years without any storage in the atmosphere.
As can be seen above (Figure 5), results for climate change altered drastically for the biomass-based scenarios (S2 and S7) depending on how the biogenic carbon was accounted for. The previously stated conclusion on the great advantage of the biomass-based scenarios (S2, S7) regarding the climate change indicator is questioned when accounting for biogenic carbon with a GWPbiogenic of 1, which is a “worst case” assumption. However, this conclusion, and the general trends observed in the reference scenario (nonbiogenic), are valid when using a GWPbiogenic of 0.25, which is a scientifically based assumption. It must, however, be pointed out that the wood used for bioenergy is often a coproduct of the wood-product sector, with storage in the anthroposphere. Another sensitivity that could have been carried out would have been to consider a different time horizon. In this study, climate change was analyzed with a 100-year perspective, but the carbon neutrality principle would be deeply undermined if examining a 25-year horizon, for instance.

4.3.4. The Importance of Waste Energy Accounting

As already stated in [27], waste energy recovery seems to be the most interesting solution, although it may potentially require greater amounts of complement, as it is not always reliable. However, this statement is true only under the zero-burden approach [66]. Although widely used [34], this approach is not globally shared [27]. For instance, it is not recommended by the European Union for waste heat produced by incineration [37], which allocates the burdens and the benefits of incineration to material producers and not energy generators. There is still a great potential for recovery, mainly by current waste-to-energy facilities operating at low average heat recovery efficiencies [67].
In the case of incineration, the so-called cutoff approach, taken in this study, permits the use of zero-burden heat as long as the material incineration impacts are taken into account. It is also possible to cut off the system the other way around, i.e., by accounting for the impacts of incineration in the heat delivered and not in the life cycle of the products that are incinerated. Those two approaches depend on where to set the system boundaries for the “waste treatment” function and the “heat production” function of an incineration plant, which is driven by economic factors. In this study, the incineration process was considered to be used only to treat the waste products, and heat was considered a waste of this main function.
However, it can be argued that the heat recovery of an incineration unit is economically interesting and might drive, at least partially, the functioning of the unit. In this case, an allocation factor between the “waste treatment” function and the “heat production” function must be chosen. The sensitivity was applied to two considerations: the heat is a waste of the incineration process (allocation factor of 0 for the heat) or the heat production is the only goal of the incineration unit (allocation factor of 1 for the heat).
As illustrated in Figure A3 the positioning of the waste-heat-based scenario (S3) was completely dependent on whether the heat could actually be considered as a waste or it carried the impacts of its production. This is a very important parameter to consider, and the zero-burden approach must be argued.

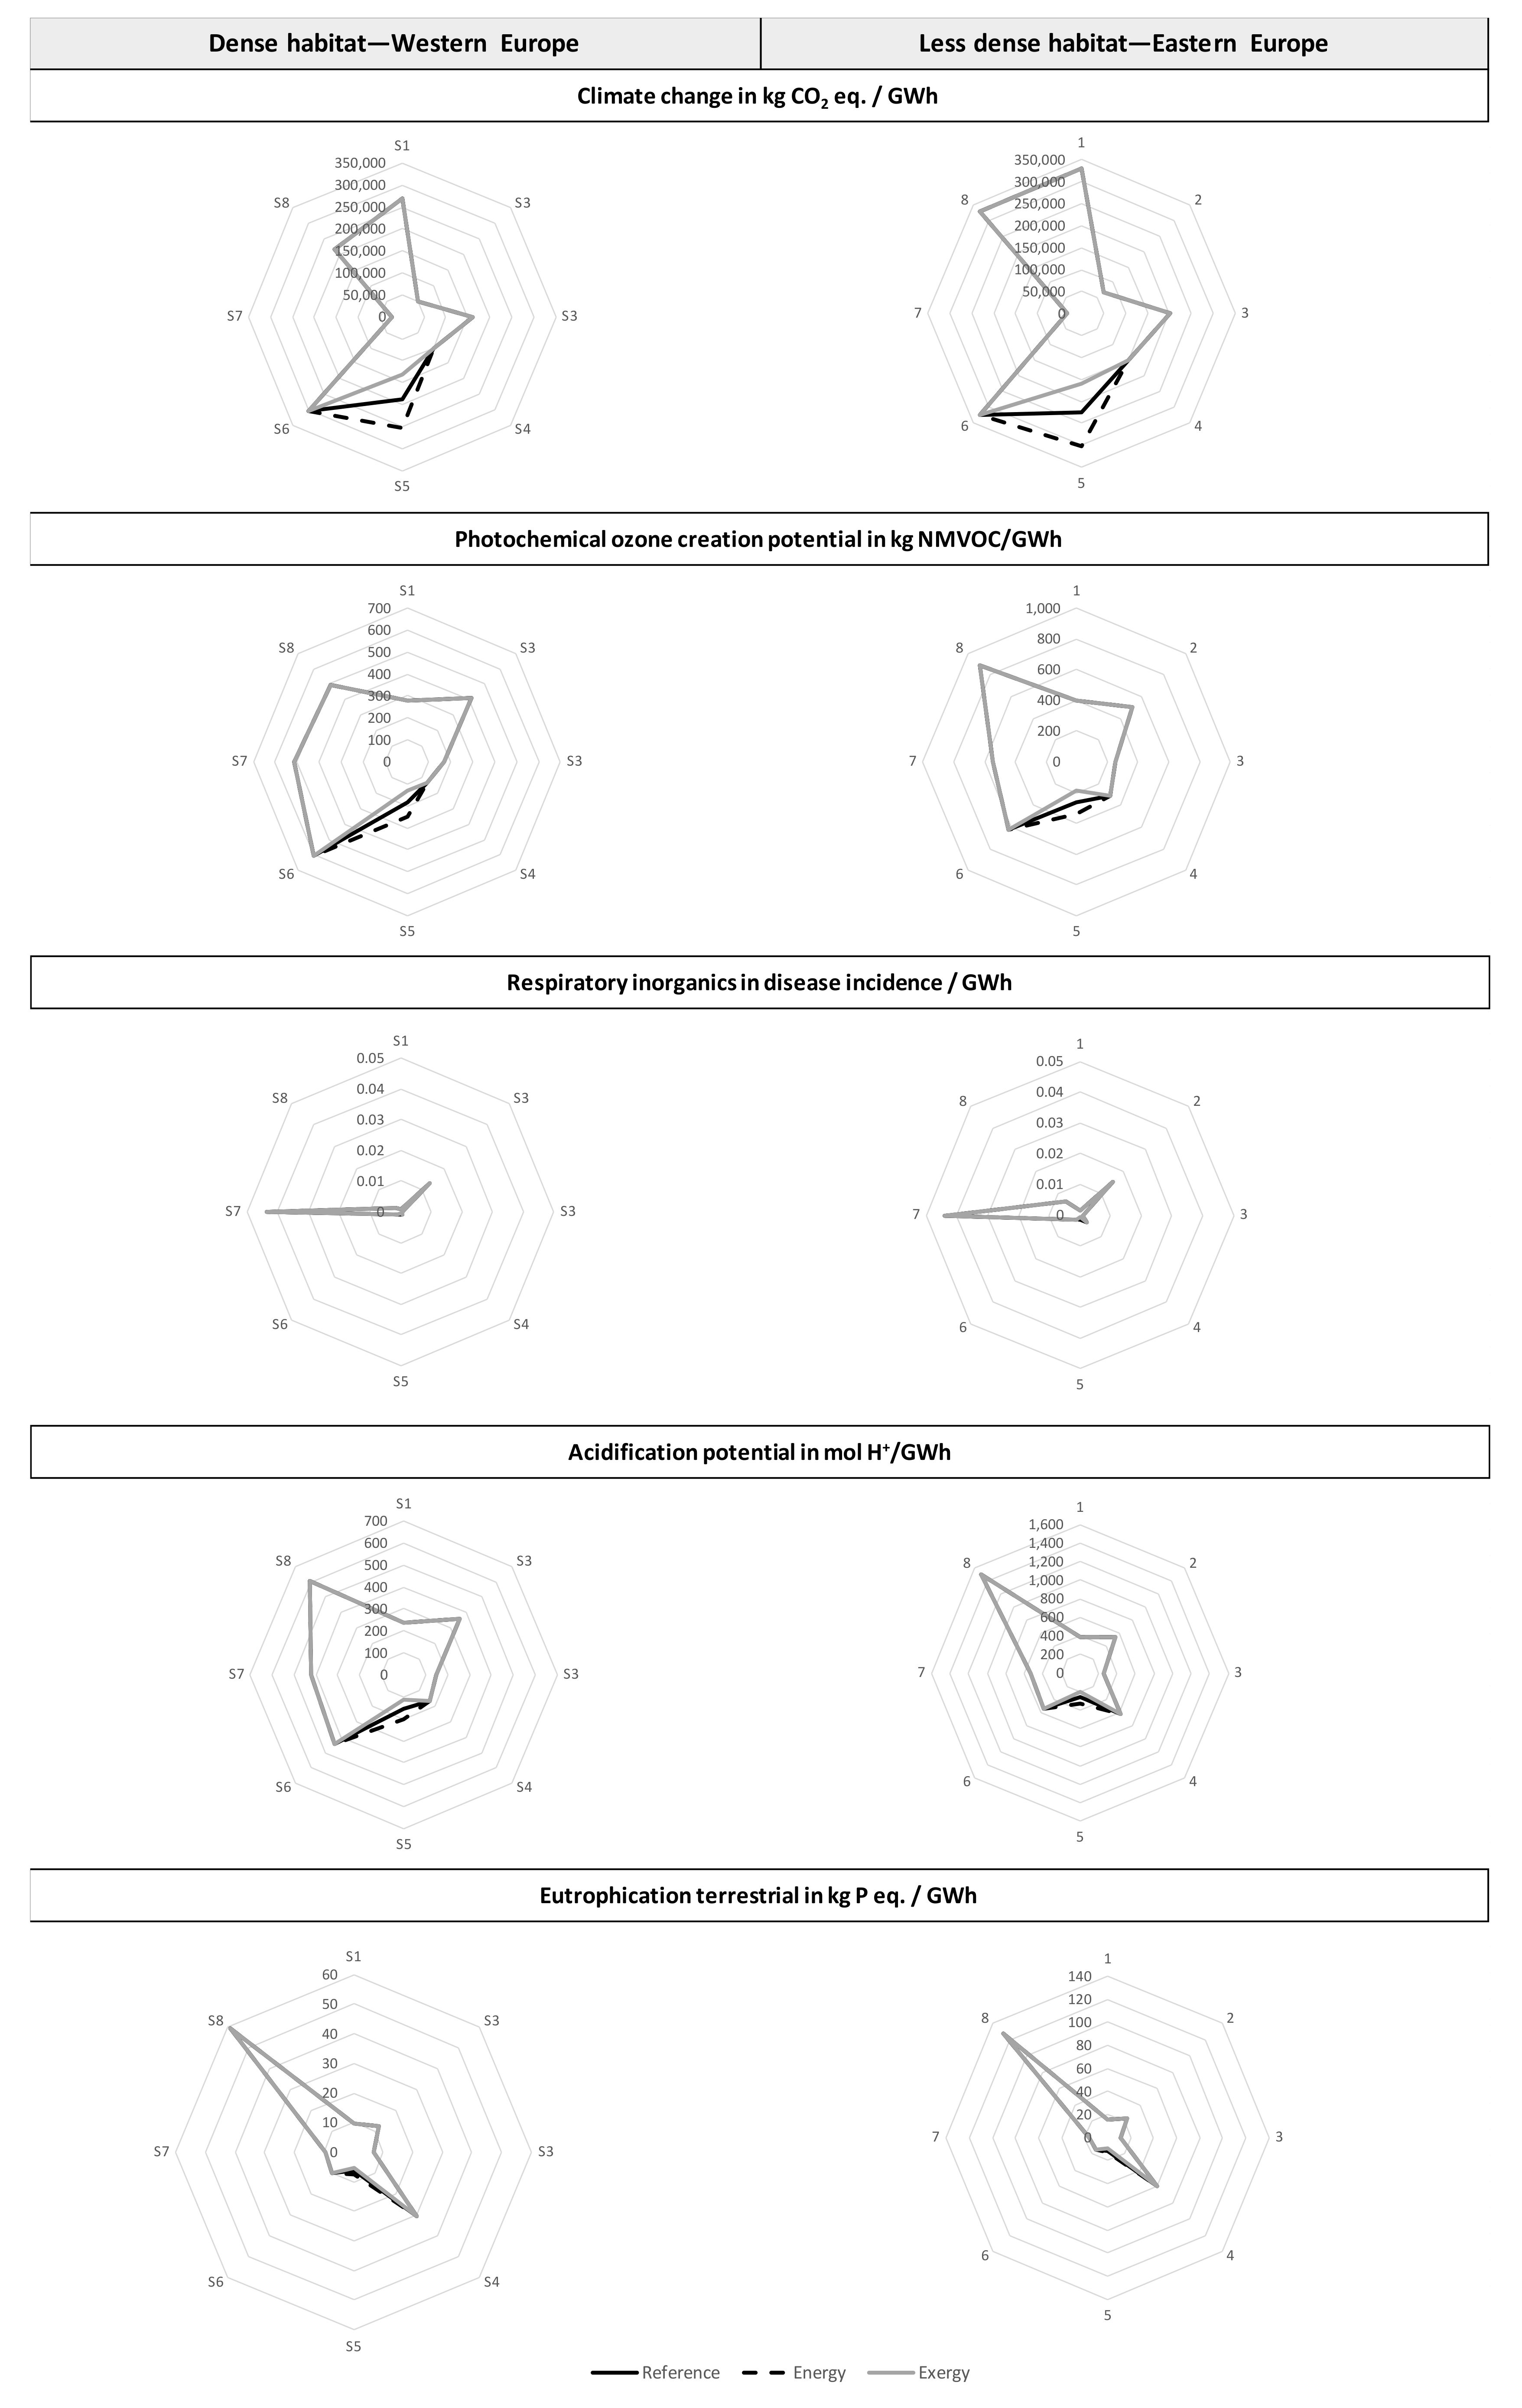
4.3.5. The Importance of Cogeneration Allocations

An allocation factor of environmental indicators must also be taken into account in the cogeneration process. The chosen approach for the cogeneration allocation in this study was in line with the 2012/27/UE directive [68] about energetic efficiency and the delegated act EU 2015/2402 [52].
The heat share of delivered energy was then calculated following Equation (5):
f H = H H + E H r E r
where:
  • f H is the allocation factor for heat;
  • H and E are, respectively, the energy of heat and electricity delivered by the process (in MWh);
  • H r and E r are the reference values for the separated production of heat and electricity, respectively. For natural gas, the ratio of the reference value for heat to the reference value for electricity was 1.7.
Other allocation rules exist for cogeneration, such as the energy and exergy rules. These were tested as a sensitivity analysis [69].
Energy allocation splits the impacts according to the proportion of furnished heat and furnished electricity; the allocation factor for heat was given by [69]. This was calculated following Equation (6):
f H , e n e r g y = H H + E
where:
  • f H , e n e r g y is the energy allocation factor for heat;
  • H and E are the energy, respectively, of the heat and electricity delivered by the process (in MWh).
The exergy content allocation splits the impacts by the exergy content of the electricity (which was 1) and the heat (which was considered as 0.15 for district heating systems) [69], and the allocation factor for heat was given by [69]. This was calculated following Equation (7):
f H , e x e r g y = H η H * η + E ή
where:
  • f H , e x e r g y is the exergy allocation factor for heat;
  • H and E are the energy, respectively, of the heat and electricity delivered by the process (in MWh);
  • η and ή are the exergy contents of heat and electricity respectively. In this study, it is considered that the Carnot factor characterizing the exergy content is 1 for electricity and 0.15 for district heating [69].
The different allocation factors for heat used in this sensitivity analysis are summarized in Table 11.
As illustrated in Figure A4, the cogeneration scenario (S5) behaved very differently according to the cogeneration allocation factors used, and its positioning among the other solutions was particularly affected in the climate change impact category. The energy allocation factor is the most traditional approach, but it might cause a misleading interpretation, as it does not consider the quality difference of heat vs. electricity. Exergy is a more appropriate allocation methodology to include the optimal use of resources [69]. As the data are not easy to collect, a compromise can be found with the approach advised by [52].

4.3.6. Data Quality and Limits

On average, the data used had good quality, with one exception: the approximation regarding the biomass type. The freshwater eutrophication result was very uncertain for every scenario, as the main contributor was always the spoil from the mining of fuels for the production of electricity.
The electricity mix used in this study was an annual country mix. However, for heating scenarios, the life cycle inventory can be made more accurate by taking into account dynamic emission factors [70]. As the electricity source was shown to have an important role in the different results, this alternative methodology may highlight some additional features.
The results were highly dependent on various factors checked in the sensitivity analysis: the complement rate, the nature of the gas, the methodology for accounting biogenic carbon dioxide and the different allocations.
This study was limited to large-scale district heating systems and did not include solar scenarios, although they are part of the fourth generation of heating systems. Their development is recent but promising [71]. Furthermore, our study aimed at being representative of current technologies but was limited to heating-only district systems, although fourth-generation systems tend to provide both heat and cold [22]. The solar sector, which was not studied in this assessment, has a role to play in both those situations and allows global warming to be greatly reduced when compared to natural-gas-based heating and cooling (for standalone and individual solutions) [35].

5. Conclusions and Discussion

The choice among various energy supply vectors or technologies in buildings is often driven by costs (CAPEX and OPEX for social landlords) and by the availability of energy networks (electricity, gas or district heating) in the vicinity. However, national or European policies, through regulations or public standards, will progressively constrain the choice and may also broaden their scope to other LCA-based indicators. This will lead to choosing a more environmentally virtuous energy supply above and beyond the usual and unique consideration of the climate change impact category.
This study identified relevant LCA indicators beyond climate change and compared the environmental performance of several DHSs representing different energy supply mixes and of standalone solutions. This study also highlighted key technical and methodological parameters to collect and harmonize when conducting a life cycle assessment of district heating systems.
For the same energy source, district heating systems showed better environmental performance than individual systems. The increase of distribution thermal losses was compensated by the mutualization of energy needs, better efficiency and the longer lifetime of centralized energy suppliers. These factors appear to be relevant for addressing environmental issues as a whole in buildings.
As emphasized by [72] for geothermal-based systems, district heating systems can improve local air quality (through the analysis of POCP and respiratory inorganics), mitigate regional effects such as acid rains or eutrophication and reduce GHG emissions globally. District scenarios reduced from 5 to 90% the impact of a natural-gas-based standalone solution for the considered neighborhoods, depending on the environmental impact category considered.
Biomass-based scenarios were the most efficient for the climate change indicator, and although they contributed more to the other indicators as compared to other district heating systems, district solutions based on biomass still performed better than the standalone installations based on biomass. As a result, the respiratory inorganics impact category was reduced from 45 to 64%, depending on the considered climatic area, with a biomass-based district scenario compared to an isofuel standalone option. This is also in line with the conclusions drawn in [73].
Waste heat integration was a very interesting option, especially when the source was reliable enough not to need much of a complement. This was also true for deep geothermal heat.
These conclusions were, however, influenced by several parameters that must be correctly reported to give an accurate analysis.
One key parameter that influenced the climate change impact of the networks was the complement they needed to fulfill their function. In the analyzed literature, the complement has often been ignored, as in [1], wherein a biomass-based district heating plant produced 100% of the heat. This study highlighted that the use of the complement should be kept to a minimum (for instance, by combining several supply sources) or should be based on renewable resources/energy (for instance, with biomethane). The natural gas-based complement was responsible for 38 to 78% of the total climate change for the different district heating scenarios studied. The sensitivity analysis showed that the total impact could be reduced to 74% with the use of biomethane instead of fossil natural gas. This supplements some of the conclusions drawn in [35].
Another technical parameter that must be checked for such an analysis is the equipment efficiency. This global parameter includes the network efficiency (the losses due both to the distance travelled and to the insulation), the furnace efficiency and the direct emissions of the involved combustion processes. This is in line with the conclusions drawn by [28]. Our study showed that the use phase represented the major contributor to the studied impacts. As highlighted in [28], ecodesign options for the production of pipes should not alter the insulating capacity, maintained over time.
This study highlighted the importance of electricity sourcing, mostly for geothermal-based DHSs but also for the pumps along the network. This supports the suggestion proposed in [1] to combine DHS with renewable energy systems for electricity production.
In the literature, focus was placed mainly on the climate change mitigation potential of district heating systems. The study of environmental impacts should not be limited to the climate change impact category, as that might hide some pollution transfers from one impact category to another. This study highlighted the importance of monitoring the photochemical ozone creation potential, respiratory inorganics, acidification and eutrophication terrestrial impact categories. This study did not consider level III impact categories, but this does not mean that those impacts must be ruled out for further studies.
This study was performed on different climate areas of Europe, which highlighted the need of precisely defining the climatic area and thus the heating demand of the considered scenario. Ref. [74] emphasized on the importance of the characterization of the plant for an environmental study. This study showed that the neighborhood repartition, the density of habitat and climatic area matter when characterizing plants and thus are a part of the functional unit, as in [35]. The results of this study are valid for the particular considered neighborhood and cannot be extrapolated for a neighborhood with older buildings, etc.
Another key result of this study was the importance of the method chosen to account for impacts related to biomass. In many DHS studies, the carbon neutrality principle has been considered to assess the GHG emissions of biomass-based heat [10,15,27]. However, the carbon neutrality principle cannot be systematically used when considering the source of biomass. To account for the biogenic carbon dynamic, a time-dependent LCA can be performed wherein yearly fluxes are considered [73]. This paper highlighted the need of ensuring the sustainability of biomass sourcing and advises using a GWPbiogenic that can be calculated from the forest rotation supplying the district heating plant.
The zero-burden approach for waste heat accounting must also be considered carefully. It should be used only for cases wherein the heat is actually a waste and not a coproduct of an activity (e.g., incineration); in the latter case, an allocation factor must be used. This study highlighted the importance of this assumption on the final result.
The cogeneration allocation factor should not be limited to the energy allocation factor, as it may distort the global interpretation by, e.g., assuming the electricity will have the same final use as the heat. This study explored different allocation options to apprehend what could be encountered in the literature for further comparisons. Energy efficiency allocation has been favored, in line with the guidelines from the delegated act EU 2015/2402 [52].
Although it was not possible in this study, dynamic or at least seasonal data should be preferred to annual average consumption data in order to gain a more accurate inventory of electricity use, which may influence the results, especially for seasonalized demands such as heating [70]. The data used in this study were annual data valid for the period 2015–2020; they did not represent a forecast study, and no dynamic emission factor was considered.
This study aimed to understand a wide panorama of DHSs across Europe and analyze them through different configurations, including different heat sources. It showed that district solutions had true environmental benefits for different impact categories compared to decentralized solutions, and that these benefits were not limited to climate change, as underlined by [1,14,31]. This is partially explained by the increased efficiency of the centralized equipment, as bigger equipment is usually more efficient (and includes filters, for instance, that lower direct pollutant emissions), and the maintenance is easier for a bigger installation. It must be highlighted that this scale effect is even more noticeable in real district heating systems, as the combination of different energy sources allows the efficiency to be enhanced through the modulation and supply chain of the different used fuels. This effect was not shown in this study, as it focused on theoretical cases across Europe (single energy source with a natural gas complement), but it was demonstrated in [75] for heat pumps and in [76] for solar-assisted groundwater sourced heat pumps.
For geothermal plants, the H2020 project GEOENVI engaged with all geothermal stakeholders to ensure the exchange of best practices and the test of harmonized methods in selected areas and then facilitated the replication of these methods across Europe. Further similar work is needed to harmonize the environmental performance of DHS across Europe.

Author Contributions

Conceptualization, C.J. and A.P.-V.; methodology, C.J. and J.-B.V.; software, C.J.; validation, C.J., J.-B.V. and A.P.-V.; formal analysis, C.J.; investigation, C.J.; resources, C.J. and J.-B.V.; data curation, C.J. and J.-B.V.; writing—original draft preparation, C.J.; writing—review and editing, C.J., J.-B.V. and A.P.-V.; visualization, C.J.; supervision, A.P.-V.; project administration, A.P.-V.; funding acquisition, A.P.-V. All authors have read and agreed to the published version of the manuscript.

Funding

This research received no external funding.

Institutional Review Board Statement

Not applicable.

Informed Consent Statement

Not applicable.

Data Availability Statement

The data presented in this study are available upon request from the corresponding author. The data are not publicly available due to a conditional request from the source.

Conflicts of Interest

The authors declare no conflict of interest.

Nomenclature

4GDHFourth generation district heat
APAcidification potential
CCClimate change
CHPCombined heat and power
CAPEXCapital expenditure
COPCoefficient of performance
DHSDistrict heating system
DHWDomestic hot water
EFEutrophication freshwater
EMEutrophication marine
ETEutrophication terrestrial
GHGGreenhouse gas
GWPGlobal warming potential
IRIonizing radiation
LCALife cycle assessment
NOxNitrogen oxides
NMVOCNonmethane volatile organic compound
ODOzone depletion
OPEXOperational expenditure
POCPPhotochemical ozone creation potential
RIRespiratory inorganics
SOxSulfur oxides
VOCVolatile organic compound

Appendix A

Figure A1. Sensitivity analysis carried out on the efficiency of the equipment.
Sustainability 13 11256 g0a1
Figure A2. Sensitivity analysis carried out on the complement rate and nature.
Sustainability 13 11256 g0a2
Figure A3. Sensitivity analysis carried out on accounting for waste heat.
Sustainability 13 11256 g0a3
Figure A4. Sensitivity analysis carried out on cogeneration allocation factors.
Sustainability 13 11256 g0a4

References

  1. Bartolozzi, I.; Rizzi, F.; Frey, M. Are district heating systems and renewable energy sources always an environmental win-win solution? A life cycle assessment case study in Tuscany, Italy. Renew. Sustain. Energy Rev. 2017, 80, 408–420. [Google Scholar] [CrossRef]
  2. Werner, S. International review of district heating and cooling. Energy 2017, 137, 617–631. [Google Scholar] [CrossRef]
  3. Weinberger, G.; Amiri, S.; Moshfegh, B. Investigating techno-economic effects and environmental impacts of energy renovation of residential building clusters on a district heating system. Energy Build. 2021, 251, 111327. [Google Scholar] [CrossRef]
  4. Sayegh, M.; Danielewicz, J.; Nannou, T.; Miniewicz, M.; Jadwiszczak, P.; Piekarska, K.; Jouhara, H. Trends of European research and development in district heating technologies. Renew. Sustain. Energy Rev. 2017, 68, 1183–1192. [Google Scholar] [CrossRef] [Green Version]
  5. Mazhar, A.R.; Liu, S.; Shukla, A. A state of art review on the district heating systems. Renew. Sustain. Energy Rev. 2018, 96, 420–439. [Google Scholar] [CrossRef]
  6. Bayer, P.; Saner, D.; Bolay, S.; Rybach, L.; Blum, P. Greenhouse gas emission savings of ground source heat pump systems in Europe: A review. Renew. Sustain. Energy Rev. 2012, 16, 1256–1267. [Google Scholar] [CrossRef]
  7. Jäger-Waldau, A.; Kougias, I.; Taylor, N.; Thiel, C. How photovoltaics can contribute to GHG emission reductions of 55% in the EU by 2030. Renew. Sustain. Energy Rev. 2020, 126, 109836. [Google Scholar] [CrossRef]
  8. Hoekman, S.K.; Broch, A. Environmental implications of higher ethanol production and use in the U.S.: A literature review. Part II—Biodiversity, land use change, GHG emissions, and sustainability. Renew. Sustain. Energy Rev. 2018, 81, 3159–3177. [Google Scholar] [CrossRef]
  9. Rubio, C.-L.; García-Alcaraz, J.L.; Martínez-Cámara, E.; Latorre-Biel, J.I.; Jiménez-Macías, E.; Blanco-Fernández, J. Replacement of electric resistive space heating by a geothermal heat pump in a residential application—Environmental amortisation. Sustain. Energy Technol. Assessments 2020, 37, 100567. [Google Scholar] [CrossRef]
  10. Caserini, S.; Livio, S.; Giugliano, M.; Grosso, M.; Rigamonti, L. LCA of domestical and centralized biomass combustion-the case of Lombardy (Italy). Biomass Bioenergy 2010, 34, 474–482. [Google Scholar] [CrossRef]
  11. Björnebo, L.; Spatari, S.; Gurian, P.L. A greenhouse gas abatement framework for investment in district heating. Appl. Energy 2018, 211, 1095–1105. [Google Scholar] [CrossRef]
  12. Ghafghazi, S.; Sowlati, T.; Sokhansanj, S.; Bi, X.; Melin, S. Particulate matter emissions from combustion of wood in district heating applications. Renew. Sustain. Energy Rev. 2011, 15, 3019–3028. [Google Scholar] [CrossRef]
  13. Miralles, J.A.L.; García, R.L.; Carnicero, J.M.P.; Martínez, F.J.R. Comparative study of heat pump system and biomass boiler system to a tertiary building using the Life Cycle Assessment (LCA). Renew. Energy 2020, 152, 1439–1450. [Google Scholar] [CrossRef]
  14. Parajuli, R.; Løkke, S.; Østergaard, P.A.; Knudsen, M.T.; Schmidt, J.H.; Dalgaard, T. Life Cycle Assessment of district heat production in a straw fired CHP plant. Biomass Bioenergy 2014, 68, 115–134. [Google Scholar] [CrossRef]
  15. Caputo, P.; Ferla, G.; Ferrari, S. Evaluation of environmental and energy effects of biomass district heating by a wide survey based on operational conditions in Italy. Energy 2019, 174, 1210–1218. [Google Scholar] [CrossRef]
  16. Guojonsdottir, S.R.; Eggertsson, V.; Guomundsdottir, M.; Johannesson, G. Panorama of Available Environmental Assessment Studies and Sustainability Assessment Studies for Geothermal Systems. 2020. Available online: https://www.geoenvi.eu/wp-content/uploads/2019/11/D3.1-Panorama-of-available-environmental-assessment-studies.pdf (accessed on 1 July 2021).
  17. Paulillo, A.; Cotton, L.; Law, R.; Striolo, A.; Lettieri, P. Geothermal energy in the UK: The life-cycle environmental impacts of electricity production from the United Downs Deep Geothermal Power project. J. Clean. Prod. 2020, 249, 119410. [Google Scholar] [CrossRef]
  18. Karlsdottir, M.R.; Lew, J.B.; Palsson, H.P.; Palsson, O.P. Geothermal District Heating System in Iceland: A Life Cycle Perspective with Focus on Primary Energy Efficiency and CO2 Emissions. In Proceedings of the 14th International Symposium on District Heating and Cooling, Stockholm, Sweden, 7–9 September 2014. [Google Scholar]
  19. McCay, A.T.; Feliks, M.E.; Roberts, J.J. Life cycle assessment of the carbon intensity of deep geothermal heat systems: A case study from Scotland. Sci. Total Environ. 2019, 685, 208–219. [Google Scholar] [CrossRef]
  20. Pratiwi, A.S.; Ravier, G.; Genter, A. Life-cycle climate-change impact assessment of enhanced geothermal system plants in the Upper Rhine Valley. Geothermics 2018, 75, 26–39. [Google Scholar] [CrossRef]
  21. Blanc, I.; Damen, L.; Douziech, M.; Fiaschi, D.; Manfrida, G.; Parisi, M.L.; Perez Lopez, P.; Ravier, G.; Tosti, L.; Mendecka, B. First Version of Harmonized Guidelines to Perform Environmental Assessment for Geothermal Systems Based on LCA and Non LCA Impact Indicators: LCA Guidelines for Geothermal Installations; European Project GEOENVI Task D3.2., France. 2020. Available online: https://www.geoenvi.eu/wp-content/uploads/2020/07/D3.2_Environmental-impact-and-LCA-Guidelines-for-Geothermal-Installations-v2.pdf (accessed on 1 July 2021).
  22. Lund, H.; Werner, S.; Wiltshire, R.; Svendsen, S.; Thorsen, J.E.; Hvelplund, F.; Mathiesen, B.V. 4th generation district heating (4GDH). Energy 2014, 68, 1–11. [Google Scholar] [CrossRef]
  23. Puettmann, M.E.; Lippke, B. Using Life-Cycle Assessments to Demonstrate the Impact of Using Wood Waste as a Renewable Fuel in Urban Settings for District Heating. For. Prod. J. 2013, 63, 24–27. [Google Scholar] [CrossRef]
  24. Oliver-Solà, J.; Gabarrell, X.; Rieradevall, J. Environmental impacts of the infrastructure for district heating in urban neighbourhoods. Energy Policy 2009, 37, 4711–4719. [Google Scholar] [CrossRef]
  25. Fröling, M.; Holmgren, C.; Svanström, M. Life cycle assessment of the district heat distribution system. Int. J. Life Cycle Assess. 2004, 9, 130–136. [Google Scholar] [CrossRef]
  26. Fröling, M.; Svanström, M. Life Cycle Assessment of the District Heat Distribution System—Part 2: Network Construction (11 pp). Int. J. Life Cycle Assess. 2005, 10, 425–435. [Google Scholar] [CrossRef]
  27. Eriksson, O.; Finnveden, G.; Ekvall, T.; Björklund, A. Life cycle assessment of fuels for district heating: A comparison of waste incineration, biomass- and natural gas combustion. Energy Policy 2007, 35, 1346–1362. [Google Scholar] [CrossRef]
  28. Persson, C.; Fröling, M.; Svanström, M. Life Cycle Assessment of the District Heat Distribution System. Part 1 to 3. Int. J. Life Cycle Assess. 2006, 11, 437–446. [Google Scholar] [CrossRef]
  29. Lund, H.; Østergaard, P.A.; Chang, M.; Werner, S.; Svendsen, S.; Sorknæs, P.; Thorsen, J.E.; Hvelplund, F.; Mortensen, B.O.G.; Mathiesen, B.V.; et al. The status of 4th generation district heating: Research and results. Energy 2018, 164, 147–159. [Google Scholar] [CrossRef]
  30. JRC. Background Report on EU-27 District Heating and Cooling Potentials, Barriers, Best Practice and Measures of Promotion; Luxembourg Publications Office of the European Union, European Union: Luxembourg, 2012. [Google Scholar]
  31. Genon, G.; Torchio, M.F.; Poggio, A.; Poggio, M. Energy and environmental assessment of small district heating systems: Global and local effects in two case-studies. Energy Convers. Manag. 2009, 50, 522–529. [Google Scholar] [CrossRef]
  32. (International Organization for Standardization) ISO. ISO 14040:2006: Environmental Management—Life Cycle Assessment—Principles and Framework; ISO: Geneva, Italy, 2006. [Google Scholar]
  33. (International Organization for Standardization). ISO 14044:2006: Environmental Management—Life Cycle Assessment—Requirements and Guidelines; ISO: Geneva, Italy, 2006. [Google Scholar]
  34. JRC. LCD Handbook—General Guide for Life Cycle Assessment-Provisions and Actions Steps; Luxembourg Publications Office of the European Union, European Union: Luxembourg, 2010. [Google Scholar]
  35. ADEME; SOLINNEN; ENGIE Lab CRIGEN; TRACTEBEL. Analyse de Cycle de Vie des Systèmes Renouvelables de Production de Chaud et de Froid Grande Puissance; ADEME: Angers, France, 2020. [Google Scholar]
  36. Patureau, R.; Tran, C.T.; Gavan, V.; Stabat, P. The new generation of District heating & cooling networks and their potential development in France. Energy 2021, 236, 121477. [Google Scholar] [CrossRef]
  37. European Commission. Product Environmental Footprint Category Rules Guidance, Version 6.3. 2018. Available online: https://ec.europa.eu/environment/eussd/smgp/pdf/PEFCR_guidance_v6.3.pdf (accessed on 1 July 2021).
  38. CEREMA. Réseaux de Chaleur—Bases Techniques, 2014. Available online: http://reseaux-chaleur.cerema.fr/wp-content/uploads/140513_bases-techniques-cerema.pdf (accessed on 2 March 2020).
  39. Minister of Construction and Housing; Minister of Energy. Réglementation Thermique 2012 (RT2012), Arrêté du 26 Octobre 2010 Relatif Aux Caractéristiques Thermiques et Aux Exigences de Performance Energétique des Bâtiments Nouveaux et des Parties Nouvelles des Bâtiments. 2010. Available online: https://www.legifrance.gouv.fr/affichTexte.do?cidTexte=JORFTEXT000022959397&categorieLien=id (accessed on 15 September 2020).
  40. CPCU. Guide Technique: Le Poste De Livraison Vapeur. 2012. Available online: https://docplayer.fr/163179059-Edition-guide-technique-le-poste-de-livraison-vapeur.html (accessed on 1 September 2021).
  41. Despres, B. Etude de Faisaibilité et de Dimensionnement d’un Réseau de Chaleur avec Chaufferie Biomasse. 2011. Available online: https://hal.univ-lorraine.fr/hal-02093685/document (accessed on 10 September 2020).
  42. INDDIGO. Solutions Techniques pour Optimiser les Réseaux de Chaleur dans un Contexte de Développement de Bâtiments Basse Consommation. 2011. Available online: https://cibe.fr/wp-content/uploads/2017/02/51-rct34_optimisationrc.pdf (accessed on 1 March 2020).
  43. Mertz, T. Optimisation Simultanée de la Configuration et du Dimensionnement des Réseaux de Chaleur Urbains; Université de Pau: Pau, France, 2016. [Google Scholar]
  44. Lillqvist, R. Energy Efficient Design of District Heating Substations; Arcada: Espoo, Finland, 2017. [Google Scholar]
  45. AMF; IGD. Indicateurs de Performance pour les Réseaux de Chaleur et de Froid. 2009. Available online: https://amorce.asso.fr/publications/indicateurs-de-performance-pour-les-reseaux-de-chaleur-et-de-froid-rct31/download (accessed on 1 July 2020).
  46. European Commission. Directive (Eu) 2018/844 of the European Parliament and of the Council. 2018. Available online: https://eur-lex.europa.eu/legal-content/EN/TXT/PDF/?uri=CELEX:32018L0844&from=EN (accessed on 1 March 2021).
  47. Heat Network Partnership for Scotland. District Heating Strategy Factsheets—Application of Industrial Waste Heat Recovery. Available online: https://www.districtheatingscotland.com/wp-content/uploads/2017/10/Module-1-Heat-Recovery.pdf (accessed on 1 March 2021).
  48. Oldfield, T.; Holden, N.M. An Evaluation of Upstream Assumptions in Food-Waste Life Cycle Assessments. In Proceedings of the 9th International Conference LCA of Food, San Francisco, CA, USA, 8–10 October 2014. [Google Scholar]
  49. Oldfield, T.L.; White, E.; Holden, N.M. The implications of stakeholder perspective for LCA of wasted food and green waste. J. Clean. Prod. 2018, 170, 1554–1564. [Google Scholar] [CrossRef]
  50. European Commissions Directorate General for Energy. Mapping and Analyses of the Current and Future Heating/Cooling Fuel Deployment; European Commission, European Union: Brussels, Belgium, 2016. [Google Scholar]
  51. Martinopoulos, G.; Papakostas, K.; Papadopoulos, A.M. A comparative review of heating systems in EU countries, based on efficiency and fuel cost. Renew. Sustain. Energy Rev. 2018, 90, 687–699. [Google Scholar] [CrossRef]
  52. European Union. Commission Delegated Regulation Reviewing Harmonised Efficiency Reference Values for Separate Production of Electricity and Heat in Application of Directive 2012/27/EU of The European Parliament and of the Council; Official Journal of the European Union; European Union: Brussels, Belgium, 2015. [Google Scholar]
  53. JRC. Best Available Techniques Reference Document for Large Combustion Plants; Publications Office of the European Union: Luxembourg, 2017. [Google Scholar]
  54. Limberger, J.; Calcagno, P.; Manzella, A.; Trumpy, E.; Boxem, T.; Pluymaekers, M.P.D.; Van Wees, J.-D. Assessing the prospective resource base for enhanced geothermal systems in Europe. Geotherm. Energy Sci. 2014, 2, 55–71. [Google Scholar] [CrossRef] [Green Version]
  55. Longa, F.D.; Nogueira, L.P.; Limberger, J.; van Wees, J.-D.; van der Zwaan, B. Scenarios for geothermal energy deployment in Europe. Energy 2020, 206, 118060. [Google Scholar] [CrossRef]
  56. Nouvel, R.; Cortado, M.; Pietruschka, D. European Mapping of Seasonal Performance of Air-Source and Geothermal Heatpumps for Residential Applications. In Proceedings of the CISBAT 2015 International Conference on Future Buildings and Districts, Lausanne, Switzerland, 9–11 September 2015. [Google Scholar]
  57. Andric, Y. The Assessment of District Heating Potential in a Context of Climate Change and Building Renovation; Ecole Nationale Supérieure Mines-Télécom Atlantique Bretagne Pays de la Loire: Nantes, France, 2017. [Google Scholar]
  58. Energy Technology System Analysis Programme. District Heating. 2013. Available online: https://iea-etsap.org/E-TechDS/PDF/E16_DistrHeat_EA_Final_Jan2013_GSOK.pdf (accessed on 1 July 2020).
  59. Guest, G.; Bright, R.M.; Cherubini, F.; Michelsen, O.; Strømman, A.H. Life Cycle Assessment of Biomass-based Combined Heat and Power Plants. J. Ind. Ecol. 2011, 15, 908–921. [Google Scholar] [CrossRef]
  60. UNICLIMA. UNIC-00022-V01.01-FR—Chaudière à Condensation Gaz Collective Chauffage Seul; PEP Ecopassport: Paris, France, 2018. [Google Scholar]
  61. UNICLIMA. UNIC-00024-V01.01-FR—Chaudière Biomasse a Granulés de Bois Assurant le Chauffage Seul; PEP Ecopassport: Paris, France, 2018. [Google Scholar]
  62. UNICLIMA. UNIC-00028-V01.01-FR—Ballon de Stockage d’eau Chaud Sanitaire Collectif; PEP Ecopassport: Paris, France, 2010. [Google Scholar]
  63. UNICLIMA. Pompe à Chaleur Géothermie Non Réversible de Production de Chaud Collective; PEP Ecopassport: Paris, France, 2019. [Google Scholar]
  64. European Union. Directive (Eu) 2018/2001 of the European Parliament and of the Council on the Promotion of the Use of Energy from Renewable Sources; Publications Office of the European Union: Luxembourg, 2018. [Google Scholar]
  65. Guest, G.; Cherubini, F.; Strømman, A.H. The role of forest residues in the accounting for the global warming potential of bioenergy. GCB Bioenergy 2013, 5, 459–466. [Google Scholar] [CrossRef] [Green Version]
  66. Ilic, D.D.; Eriksson, O.; Trygg, L.; Åberg, M. No zero burden assumption in a circular economy. J. Clean. Prod. 2018, 182, 352–362. [Google Scholar] [CrossRef]
  67. Persson, U.; Münster, M. Current and future prospects for heat recovery from waste in European district heating systems: A literature and data review. Energy 2016, 110, 116–128. [Google Scholar] [CrossRef] [Green Version]
  68. European Union. Directive 2012/27/Eu of The European Parliament and of the Council on Energy Efficiency; Official Journal of the European Union; European Union: Luxembourg, 2012. [Google Scholar]
  69. Turconi, R. Life Cycle Assessment of Electricity Systems; DTU Environment: Kongens Lyngby, Denmark, 2014. [Google Scholar]
  70. Roux, C. Analyse de Cycle de Vie Conséquentielle Appliquée aux Ensembles Bâtis. Université Paris Sciences et Lettres: Paris, France, 2016. [Google Scholar]
  71. Tian, Z.; Zhang, S.; Deng, J.; Fan, J.; Huang, J.; Kong, W.; Perers, B.; Furbo, S. Large-scale solar district heating plants in Danish smart thermal grid: Developments and recent trends. Energy Convers. Manag. 2019, 189, 67–80. [Google Scholar] [CrossRef]
  72. Keçebaş, A. Energetic, exergetic, economic and environmental evaluations of geothermal district heating systems: An application. Energy Convers. Manag. 2013, 65, 546–556. [Google Scholar] [CrossRef]
  73. Hammar, T.; Levihn, F. Time-dependent climate impact of biomass use in a fourth generation district heating system, including BECCS. Biomass Bioenergy 2020, 138, 105606. [Google Scholar] [CrossRef]
  74. Torchio, M.F.; Genon, G.; Poggio, A.; Poggio, M. Merging of energy and environmental analyses for district heating systems. Energy 2009, 34, 220–227. [Google Scholar] [CrossRef]
  75. Pieper, H.; Ommen, T.; Elmegaard, B.; Markussen, W.B. Assessment of a combination of three heat sources for heat pumps to supply district heating. Energy 2019, 176, 156–170. [Google Scholar] [CrossRef]
  76. Huang, J.; Fan, J.; Furbo, S. Demonstration and optimization of a solar district heating system with ground source heat pumps. Sol. Energy 2020, 202, 171–189. [Google Scholar] [CrossRef]
Figure 1. System boundaries for the district system (a) and its standalone alternative (b).
Sustainability 13 11256 g001
Figure 2. Normalized results (EF 2.0) for different scenarios (CC: climate change, OD: ozone depletion, IR: ionizing radiation, POCP: photochemical ozone creation potentials, RI: respiratory inorganics, AP: acidification potential, EF: eutrophication freshwater, EM: eutrophication marine, ET: eutrophication terrestrial) expressed in equivalents of a world inhabitant in 2010.
Sustainability 13 11256 g002
Figure 3. Results for the very dense habitat in Western Europe (best case), DHS—District heating system.
Sustainability 13 11256 g003
Figure 4. Results for the less dense habitat in Eastern Europe (worst case), DHS—District heating system.
Sustainability 13 11256 g004
Figure 5. Impact of GWPbiogenic (global warming potential) on the climate change indicator.
Sustainability 13 11256 g005
Table 1. Scenarios of heat production.
ScenarioIndividual (I) or Collective (C)Energy SupplyDescription
S1CNatural gasNatural gas district heating system (DHS)
S2CBiomass + natural gasBiomass DHS, with a 10% natural gas complement for peaks and supply shortages
S3CWaste industrial heat recovery + natural gasWaste industrial heat recovery DHS, with a 60% natural gas complement, assuming the energy was available at some precise times of the year (not controllable)
S4CGeothermal + natural gasGeothermal heat for a district heating network with a 30% natural gas complement as analyzed through the viaSeva database, delivered by sorting networks supplying an average of 100 to 120 GWh of heat
S5CNatural gasNatural gas with cogeneration DHS
S6INatural gasIndividual (per building) natural gas heating
S7IBiomassIndividual (per building) biomass heating
S8IElectricityIndividual (per building) heat pump heating—individual heat pumps are interesting only in low-temperature-equipped buildings, or in other words, in new constructions. Hence, only new buildings (residential and offices) were considered to be equipped with such a system. Other buildings in the neighborhood were equipped with natural gas heating systems with noncondensing boilers. This scenario was thus composed with a 55% heat pump–45% noncondensing natural gas boiler repartition for the neighborhood, analyzed through the functional unit
Table 2. Countries considered for the four European areas studied.
North EuropeSouth EuropeWest EuropeEast Europe
FinlandSpainFranceSlovakia
SwedenPortugalGermanyEstonia
DenmarkItalyBelgiumPoland
Table 3. Heating degree days in the European areas.
NorthSouthWestEast
4601159926683574
Table 4. Installed powers for the various scenarios (in MW).
High DensityLow Density
North EuropeEast EuropeWest EuropeSouth EuropeNorth EuropeEast EuropeWest EuropeSouth Europe
Installed power in MW for district scenarios (S1–S5)72788392788993102
Table 5. Electricity sources for the European areas.
Coal and LigniteOilNatural GasBiofuelsNuclearHydroSolar PVWindWasteOther Sources
Northern Europe12%0%16%8%20%17%1%15%2%7%
Southern Europe18%4%21%4%7%22%3%15%1%5%
Western Europe17%1%11%4%43%6%3%6%2%7%
Eastern Europe48%12%3%6%18%6%1%3%0%3%
Table 6. Geothermal heat networks across Europe.
Europe ZoneCountryNetworkDepth (m)
SouthItalyVincenza2130
EastPolandPyrzyce1700
NorthDenmarkThisted1300
WestFranceRosny-sous-Bois1800
Table 7. Efficiencies and COP of the different equipment used in the different scenarios.
EquipmentUsed in Scenario(s)Efficiency in % of LHV or COP
Centralized gas boilerS1, S2, S3, S490–97%
Condensing standalone gas boilerS690%
Noncondensing standalone gas boilerS6, S880%
CHP GasS590%
Centralized biomass boilerS290%
Biomass standalone boilerS780%
Geothermal doublet coupled with heat pumpS46.3
Air/Water heat pumpS82.4–3.4
Table 8. Production inventory for the infrastructure used.
Infrastructure Used in Which ScenarioInfrastructure TypeBill Of Material SourceAdaptation WithFromLifetime (Years)
S1, S2, S3, S4High-power gas furnaceEcoinvent v3.5. Industrial furnace, natural gas GLOPower1 MW25
S6, S8Standalone gas boilerPEP UNIC-
00022-
V01.01-FR [60]
Power102 kW22
S2High-power biomass furnaceEcoinvent v3.5. Furnace, wood chips with silo GLOPower5 MW25
S7Standalone biomass boilerPEP UNIC-
00024-
V01.01-FR [61]
Power17 kW22
S1, S2, S3, S4, S5SubstationEcoinvent v3.5. Blower and heat exchange unit central, GLOPower120 kW25
S1, S2, S3, S4, S5Buffer storagePCR-ed3-FR-2015
04 02 [62]
Volume987.6 L20
S4Geothermal doubletOnsite dataDepth180030
S4Water/water heat pump for geothermal applicationOnsite dataPower5 MW22
S8Air/water heat pump for standalone solutionsPCR-ed3-FR-2015
04 02 [63]
Power46 kW22
S5Gas CHP plantEcoinvent v3.5. heat and power cogeneration unit, RERPower1 MW25
Table 9. Parameters used for the efficiency sensitivity analysis.
ReferencePessimistic
Gas-condensing furnace efficiency0.970.9
NOx, particulate, NMVOC and CO emission sourcesMeasured data from a mix of used biomass within ENGIE unitsEcoinvent data from a hardwood-chip-fed furnace
Table 10. Sensitivity analysis concerning the complement rate for district scenarios.
ReferenceOptimistic Case StudyPessimistic Case Study
S10%0%0%
S210%0%20%
S360%20%80%
S430%5%40%
S50%0%0%
Table 11. Allocation factors for heat used in the sensitivity analysis.
f H f H ,   e n e r g y f H , e x e r g y
0.530.70.24
Publisher’s Note: MDPI stays neutral with regard to jurisdictional claims in published maps and institutional affiliations.

