
Predicting the Potential Distribution of Hylomecon japonica in China under Current and Future Climate Change Based on Maxent Model


Abstract
:1. Introduction
2. Materials and Methods
2.1. Species Data
2.2. Variables
2.3. Maximum Entropy (Maxent) Model
2.4. Modeling Procedure
3. Results
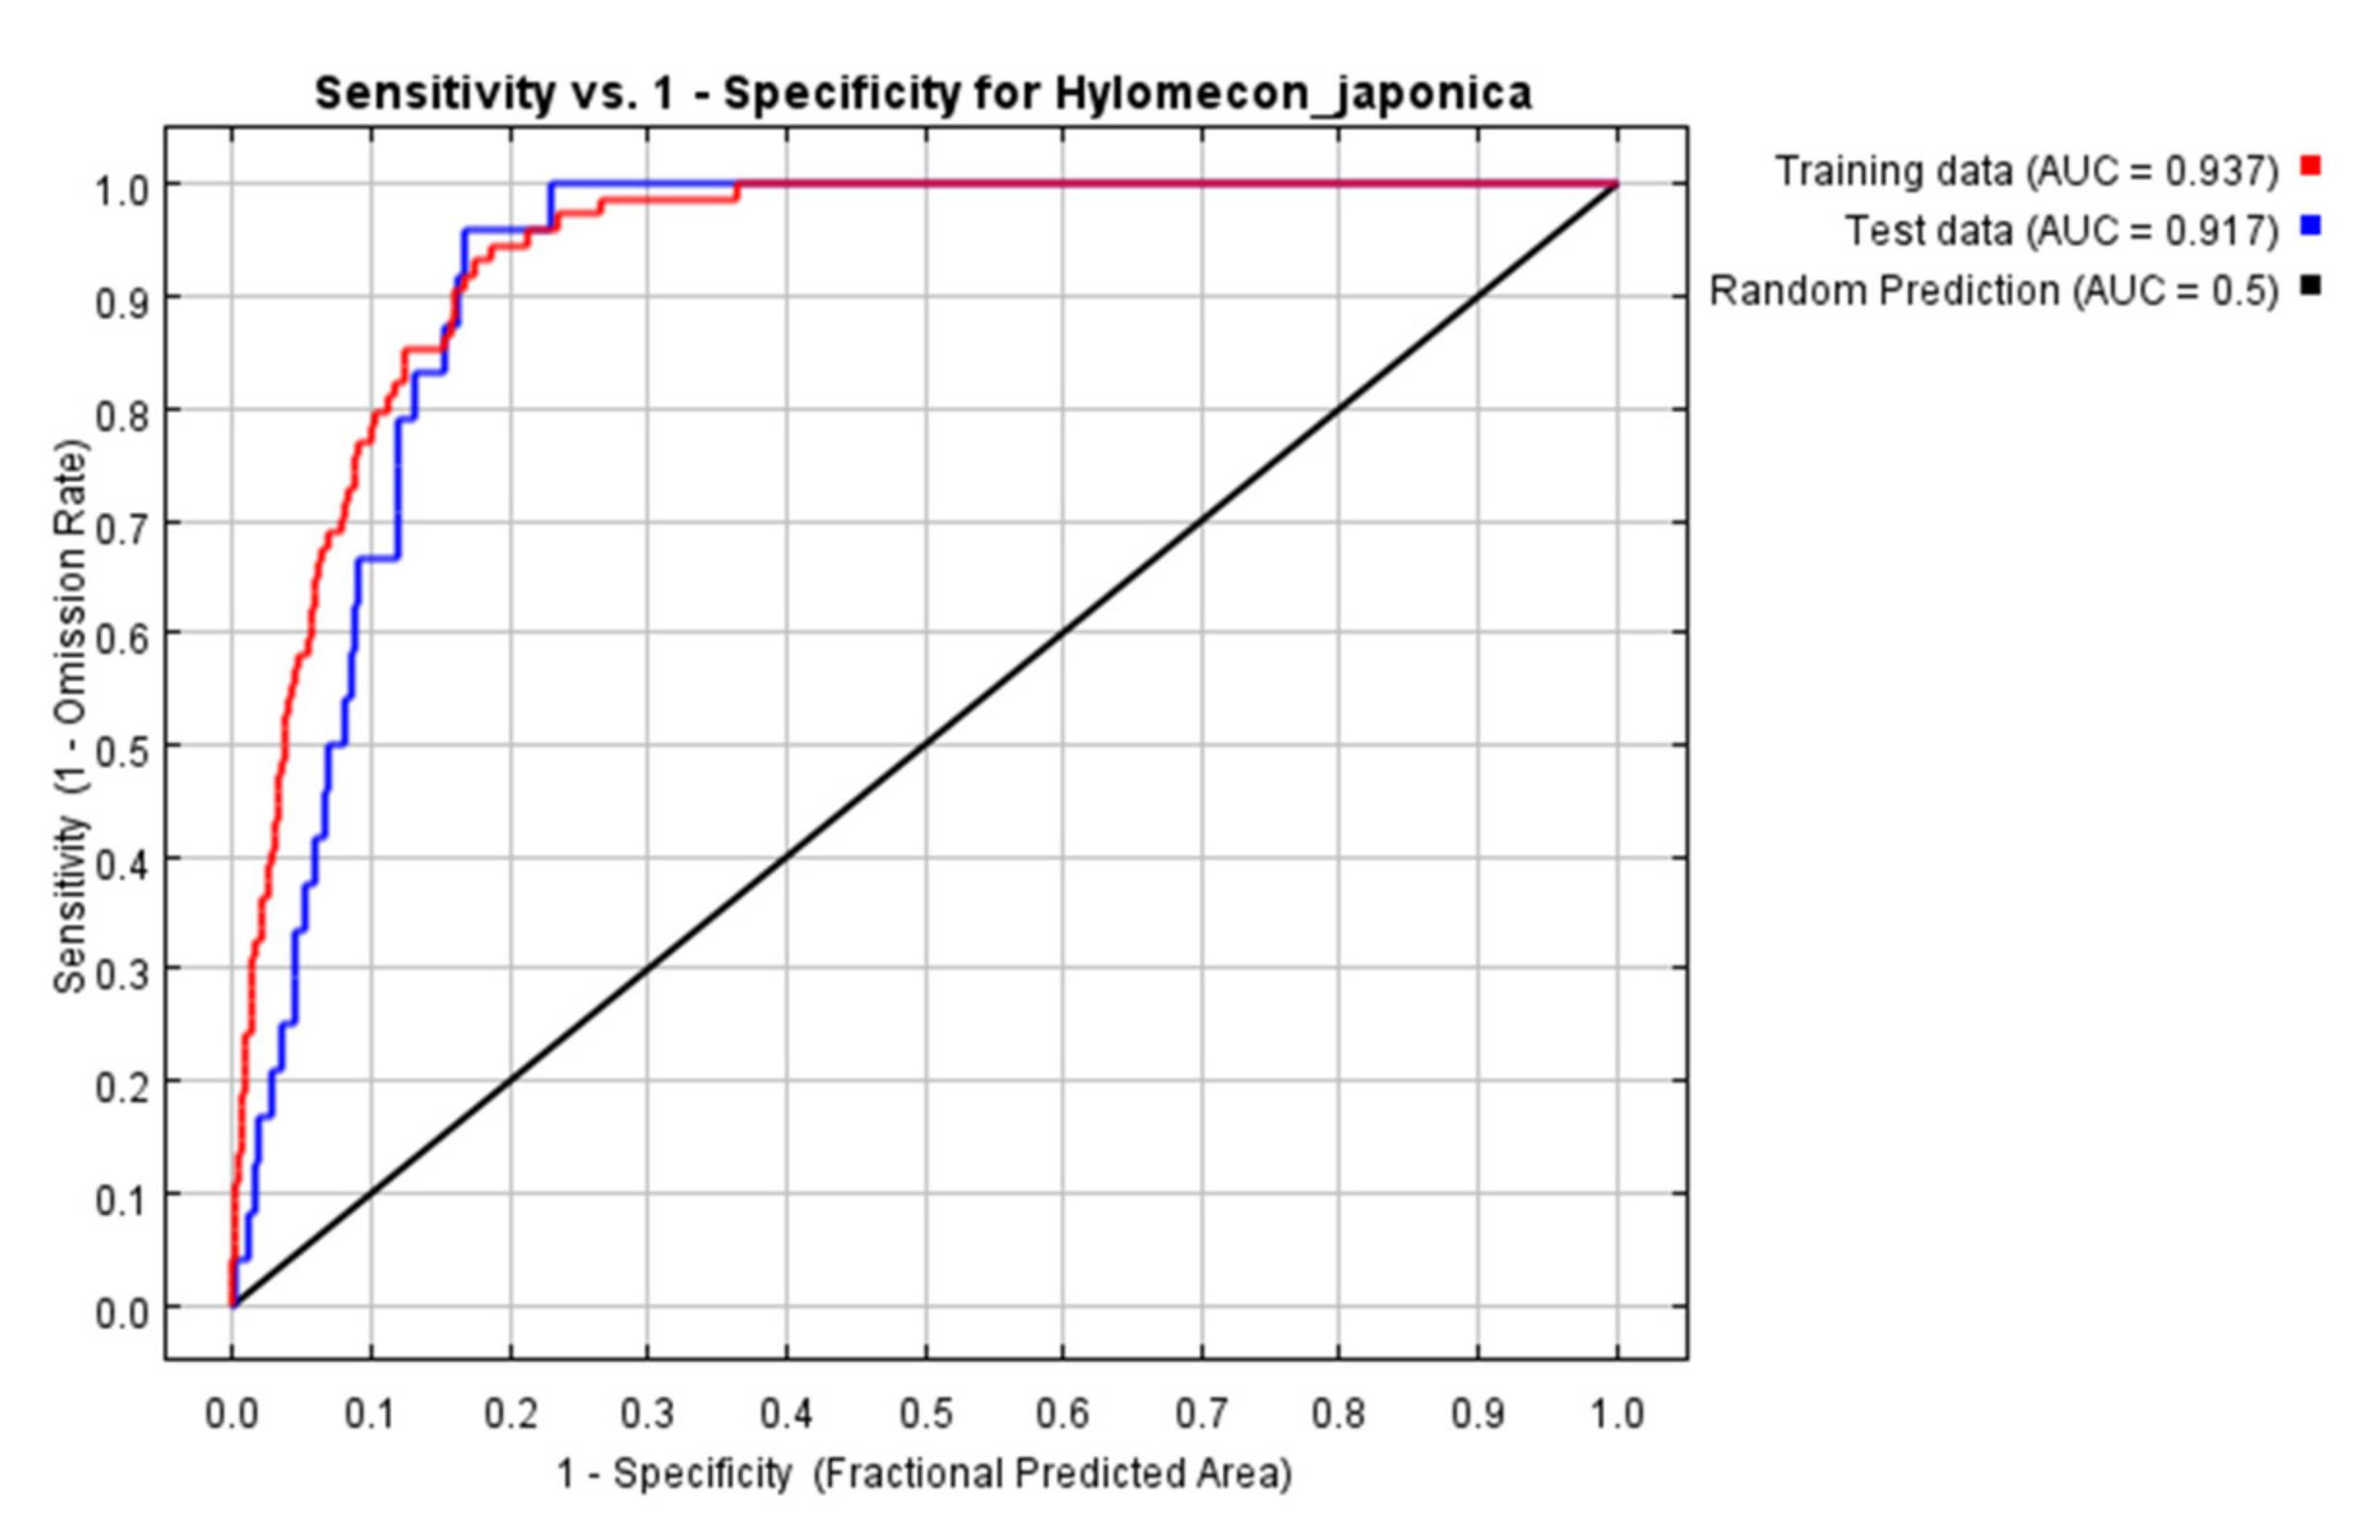
3.1. Accuracy Test
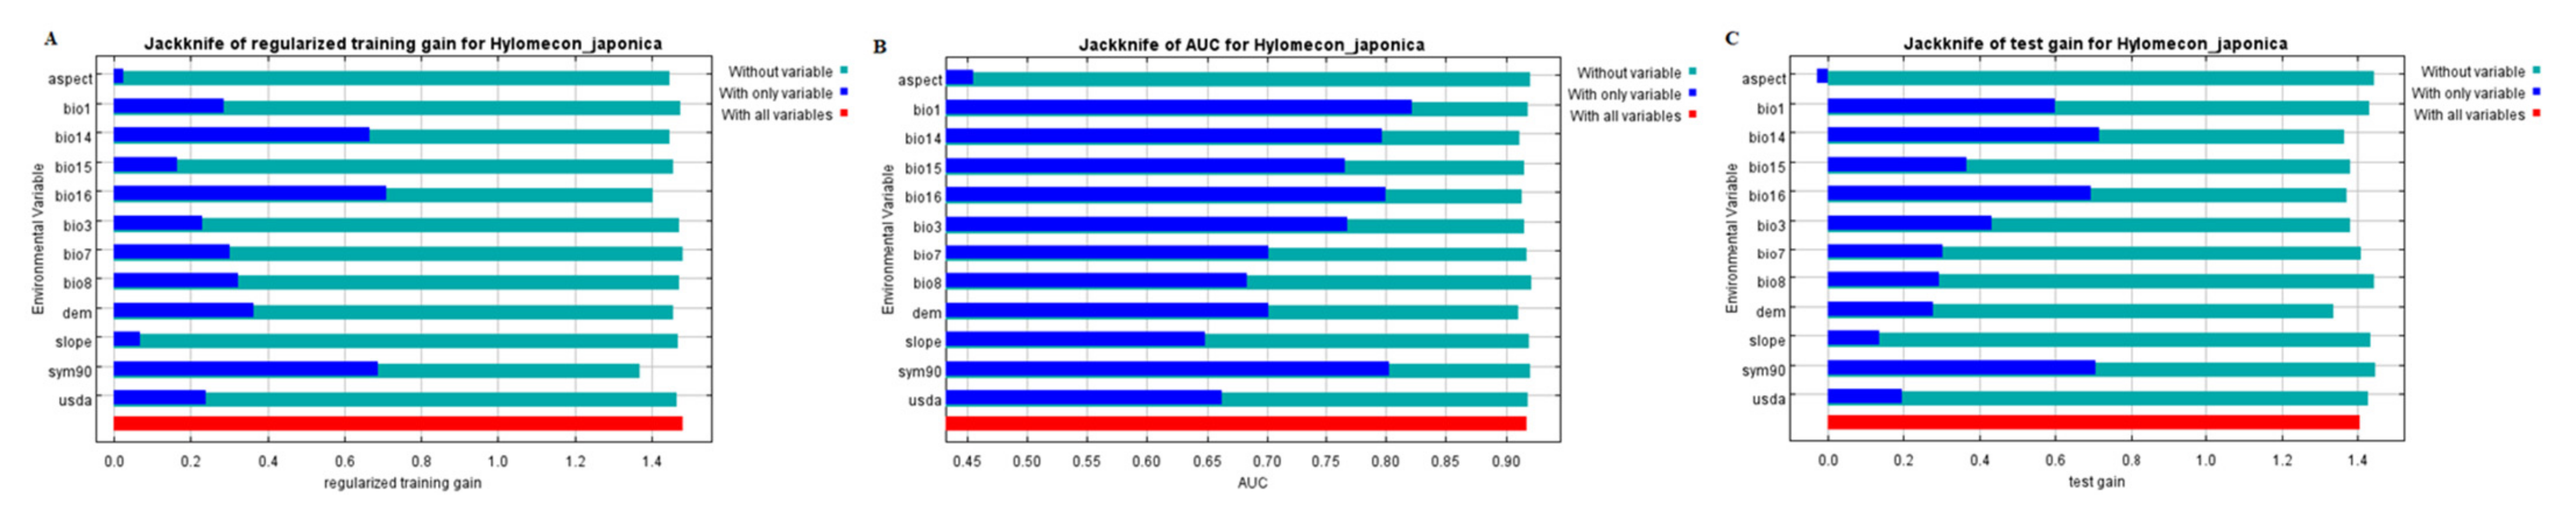
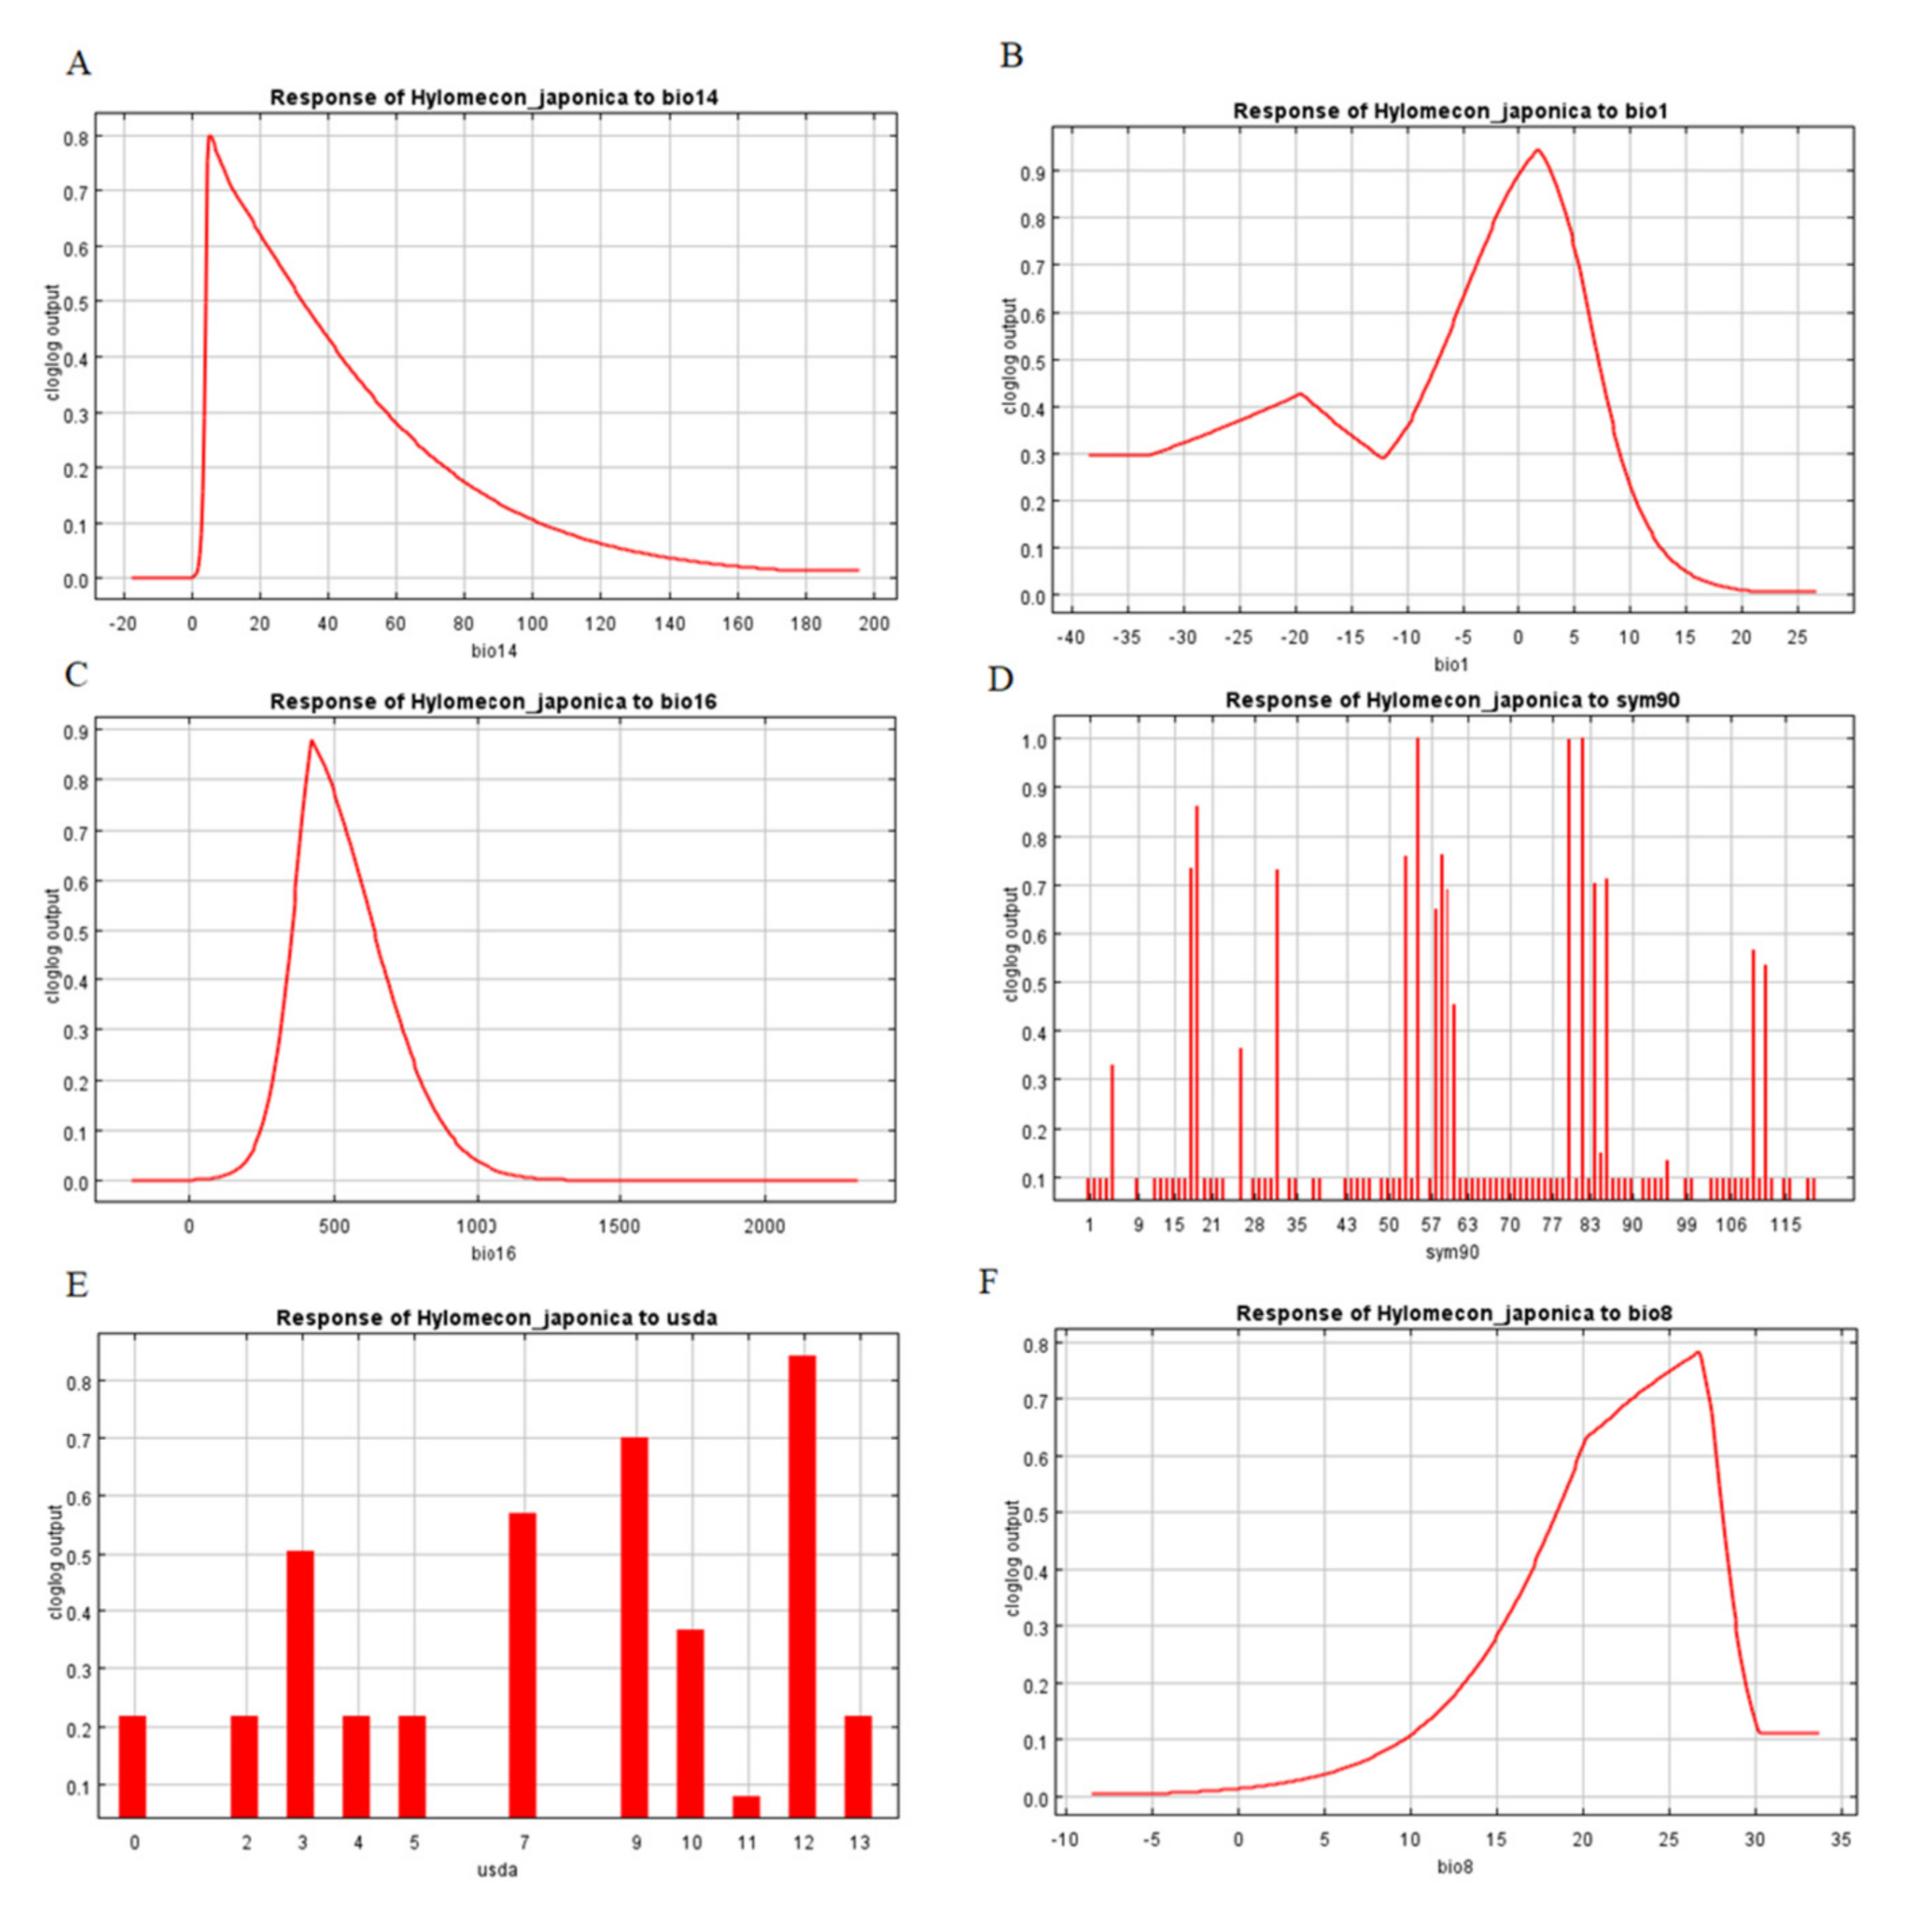
3.2. Contribution of Environmental Variables
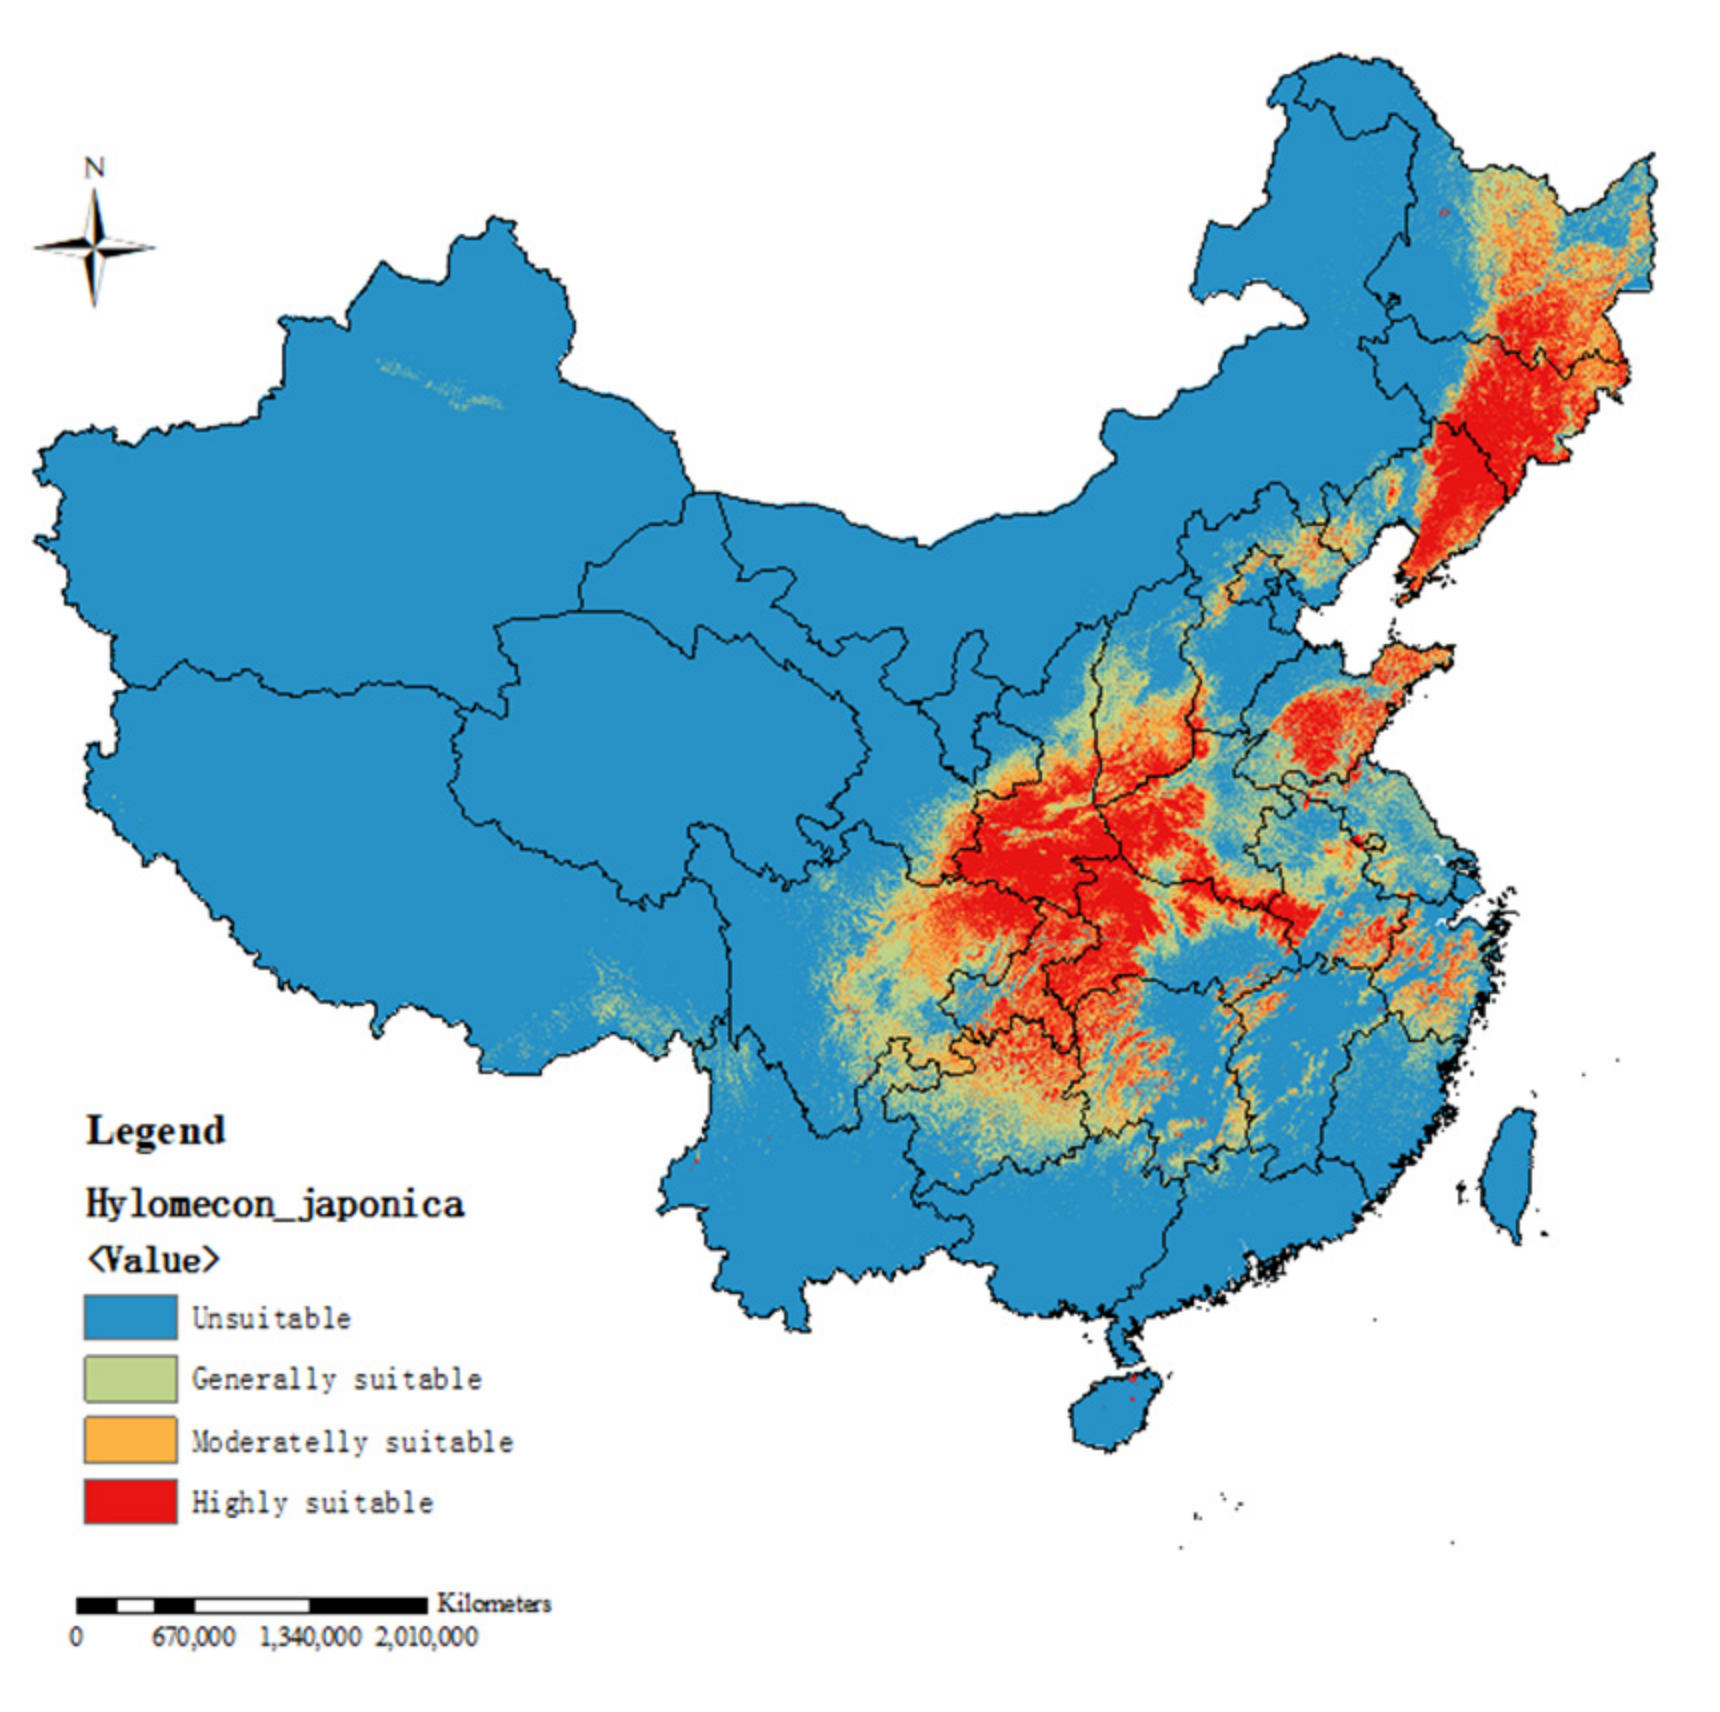
3.3. Current Potential Distribution
3.4. Future Changes in Suitable Habitat Areas of the H. japonica Species
4. Discussion
5. Conclusions
Author Contributions
Funding
Institutional Review Board Statement
Informed Consent Statement
Data Availability Statement
Acknowledgments
Conflicts of Interest
Abbreviations
| Maxent | Maximum entropy model |
| ArcGIS | Geographic information system |
| AUC | Area under the receiver operating characteristic curve |
| SSP | Shared socioeconomic pathway |
| TCM | Traditional Chinese medicine |
| SDM | Species Distribution Model |
| GARP | Genetic algorithm for rule set production |
| ROC | Receiver-operating characteristic |
| GBIF | Global Biodiversity Information Facility Data Portal |
| CVH | Chinese Virtual Herbarium |
| BCC-CSM2-MR | The second-generation National (Beijing) Climate Center moderate resolution climate system model |
| CMIP6 | The sixth phase of the Coupled Model Intercomparison Projects |
| RCP | Representative concentration paths |
| SD | Standard deviation |
References
- Xu, X.; Wang, D. Are there two varieties in Hylomecon japonica (Papaveraceae) Morphological and molecular evidence. Ann. Bot. Fenn. 2017, 54, 391–399. [Google Scholar] [CrossRef]
- Zhang, Y.; Lee, J.; Liu, X.; Sun, Z. The first complete chloroplast genome of Hylomecon japonica and its phylogenetic position within Papaveraceae. Mitochondrial DNA Part B. Resour. 2019, 4, 2349–2350. [Google Scholar] [CrossRef] [PubMed] [Green Version]
- Kim, S.W.; In, D.S.; Kim, T.J.; Liu, J.R. High frequency somatic embryogenesis and plant regeneration in petiole and leaf explant cultures and petiole-derived embryogenic cell suspension cultures of Hylomecon vernalis. Plant Cell Tissue Organ Cult. 2003, 74, 163–167. [Google Scholar] [CrossRef]
- Akbar, A.; Chen, C.; Zhu, L.; Xin, K.; Cheng, J.; Yang, Q.; Zhao, L.; Zhang, L.; Shen, X. Sphingomonas hylomeconis sp. nov., isolated from the stem of Hylomecon japonica. Int. J. Syst. Evol. Microbiol. 2015, 65, 4025–4031. [Google Scholar] [CrossRef]
- Lee, S.Y.; Kim, K.H.; Lee, I.K.; Lee, K.H.; Choi, S.U.; Lee, K.R. A new flavonol glycoside from Hylomecon vernalis. Arch. Pharm. Res. 2012, 35, 415–421. [Google Scholar] [CrossRef]
- Qu, Y.; Gao, J.; Wang, J.; Geng, Y.; Zhou, Y.; Sun, C.; Li, F.; Feng, L.; Yu, M.; Wang, G. New Triterpenoid Saponins from the Herb Hylomecon japonica. Molecules 2017, 22, 1731. [Google Scholar] [CrossRef] [Green Version]
- Chae, H.S.; Kang, O.H.; Keum, J.H. Anti-inflammatory effects of Hylomecon hylomeconoides in RAW 264.7 cells. Eur. Rev. Med. Pharm. Sci. 2012, 3, 121–125. [Google Scholar]
- Lee, H.; Cho, H.; Yu, R.; Lee, K.; Chun, H.; Park, J. Mechanisms Underlying Apoptosis-Inducing Effects of Kaempferol in HT-29 Human Colon Cancer Cells. Int. J. Mol. Sci. 2014, 15, 2722–2737. [Google Scholar] [CrossRef]
- Choi, J.; Kang, O.; Chae, H.; Obiang-Obounou, B.; Lee, Y.; Oh, Y.; Kim, M.; Shin, D.; Kim, J.; Kim, Y.; et al. Antibacterial Activity of Hylomecon hylomeconoides against Methicillin-Resistant Staphylococcus aureus. Appl. Biochem. Biotechnol. 2010, 160, 2467–2474. [Google Scholar] [CrossRef]
- Liu, X. Cultural Regionalization for Coptis Chinensis Based on 3S Technology Platform; Hubei University of Chinese Medicine: Wuhan, China, 2015. [Google Scholar]
- Chen, L.; Hu, W.; Li, D.; Cheng, D.; Zhong, A. Prediction of suitable distribution areas of the endangered plant wild Nelumbo nucifera Gaertn. in China. Plant Sci. J. 2019, 37, 731–740. [Google Scholar]
- Yin, Z.; Zhang, J.; Xie, H. Study on the prediction of the Chinese medicinal plant V. taliense Loes. F in China. Lishizhen Med. Mater. Med. Res. 2014, 25, 2762–2763. [Google Scholar]
- Sun, L.; Jiang, Z.; Liu, C.; Yin, Z. Analysis of the adaptive and geographical distribution of Yulania liliflora based on DIVA-GIS. Plant Sci. J. 2018, 36, 804–811. [Google Scholar]
- Feng, L.; Sun, J.; Shi, Y.; Wang, G.; Wang, T. Predicting Suitable Habitats of Camptotheca acuminata Considering Both Climatic and Soil Variables. Forests 2020, 11, 891. [Google Scholar] [CrossRef]
- Pan, J.; Fan, X.; Luo, S.; Zhang, Y.; Yao, S.; Guo, Q.; Qian, Z. Predicting the Potential Distribution of Two Varieties of Litsea coreana (Leopard-Skin Camphor) in China under Climate Change. Forests 2020, 11, 1159. [Google Scholar] [CrossRef]
- Liu, H.; Jacquemyn, H.; He, X.; Chen, W.; Huang, Y.; Yu, S.; Lu, Y.; Zhang, Y. The Impact of Human Pressure and Climate Change on the Habitat Availability and Protection of Cypripedium (Orchidaceae) in Northeast China. Plants 2021, 10, 84. [Google Scholar] [CrossRef]
- Zhang, H.; Song, J.; Zhao, H.; Li, M.; Han, W. Predicting the Distribution of the Invasive Species Leptocybe invasa: Combining MaxEnt and Geodetector Models. Insects 2021, 12, 92. [Google Scholar] [CrossRef] [PubMed]
- Yan, H.; Zhang, X.; Zhu, S.; Qian, D.; Guo, L.; Huang, L.; Duan, J. Production regionalization study of Chinese angelica based on MaxEnt model. China J. Tradit. Chin. Med. 2016, 41, 3139–3147. [Google Scholar]
- Wang, D. Prediction of Bupleurum Marginatum Habitat Suitability and Influence of Climate Change on Its Spatial Pattern; Shaanxi Normal University: Xi’an, China, 2017. [Google Scholar]
- Lu, Y.; Zhang, X.; Yang, Y.; Ma, X.; Zhu, T.; Yu, X.; Jin, L. Quality regionalization study on Gentianae Macrophyllae Radix. China J. Chin. Mater. Med. 2016, 41, 3132–3138. [Google Scholar]
- Chen, T.; Zhang, T.; Fang, Q.; Wen, F.; Yang, Y.; Zhang, H.; Xue, D. Prediction of Paris polyphylla Smith var. chinensis (Franch.) Hara. habitat suitability based on MaxEnt and ArcGIS. J. Chin. Med. Mater. 2017, 40, 803–806. [Google Scholar]
- Zhang, Q. Quality Variation and Production Regionalization of Artemisia annua L.; Chinese Academy of Medical Sciences, Peking Union Medical College: Beijing, China, 2018. [Google Scholar]
- GBIF. Available online: https://www.gbif.org/ (accessed on 10 October 2020).
- The Specimen Resources Sharing Platform for Education. Available online: http://mnh.scu.edu.cn/ (accessed on 30 December 2019).
- CVH. Available online: http://www.cvh.org.cn/ (accessed on 12 October 2019).
- Chinese plant species information System. Available online: http://www.iplant.cn/ (accessed on 2 January 2020).
- Feng, L.; Li, F.; Yu, M.; Wei, E.; Wu, S.; Qu, M.; Wang, Y.; Wang, G. Isolation and Identification of Organic Components from Hy-lomecon Japonica. Spec. Wild Econ. Anim. Plant Res. 2019, 41, 72–74. [Google Scholar]
- Wang, M. Study on Plant Resources and Geographical Distribution of Qiyao in Qinling Mountains; Northwest A&F University: Yangling, China, 2014. [Google Scholar]
- ArcGIS. Available online: http://www.esri.com/ (accessed on 12 October 2019).
- National Basic Geographic Information System. Available online: http://bzdt.ch.mnr.gov.cn/index.jsp (accessed on 30 December 2019).
- Yang, X.; Kushwaha, S.P.S.; Saran, S.; Xu, J.; Roy, P.S. Maxent modeling for predicting the potential distribution of medicinal plant, Justicia adhatoda L. in Lesser Himalayan foothills. Ecol. Eng. 2013, 51, 83–87. [Google Scholar] [CrossRef]
- Wang, Y.; Zhang, L.; Du, Z.; Pei, J.; Huang, L. Chemical Diversity and Prediction of Potential Cultivation Areas of Cistanche Herbs. Sci. Rep. 2019, 9, 19737. [Google Scholar] [CrossRef] [PubMed]
- Sun, H. Quantitative Methodology on the Quality Assessment and Functional Regionalization Evaluation of Notopterygii Rhizoma et Radix; Guangdong Pharmaceutical University: Guangzhou, China, 2016. [Google Scholar]
- WorldClim-Global Climate Database. Available online: http://worldclim.org/ (accessed on 6 April 2021).
- Li, S.; Miao, L.; Jiang, Z.; Wang, G.; Gnyawali, K.R.; Zhang, J.; Zhang, H.; Fang, K.; He, Y.; Li, C. Projected drought conditions in Northwest China with CMIP6 models under combined SSPs and RCPs for 2015–2099. Adv. Clim. Chang. Res. 2020, 11, 210–217. [Google Scholar] [CrossRef]
- Saha, A.; Rahman, S.; Alam, S. Modeling current and future potential distributions of desert locust Schistocerca gregaria (Forskål) under climate change scenarios using MaxEnt. J. Asia-Pac. Biodivers. 2021, 14, 399–409. [Google Scholar] [CrossRef]
- Song, C.; Liu, H. Habitat differentiation and conservation gap of Magnolia biondii, M. denudata, and M. sprengeri in China. PeerJ 2019, 6, e6126. [Google Scholar] [CrossRef] [Green Version]
- Harmonized World Soil Database. Available online: https://iiasa.ac.at/ (accessed on 30 December 2019).
- Data Center of Resources and Environment Science of Chinese Academy of Sciences. Available online: http://www.resdc.cn/ (accessed on 30 December 2019).
- Phillips, S.J.; Anderson, R.P.; Schapire, R.E. Maximum entropy modeling of species geographic distributions. Ecol. Model. 2006, 190, 231–259. [Google Scholar] [CrossRef] [Green Version]
- Qu, Y.; Sun, G.; Li, Z. The Maximum entropy principle and its application. J. Qingdao Inst. Archit. Eng. 1996, 17, 94–100. [Google Scholar]
- Yang, Q. Research on Pepper Identification Based on Maximum Entropy Model and Multi-Temporal Sentinel-2 Images; Southwest University: Chongqing, China, 2019. [Google Scholar]
- Zhai, X.; Shen, F.; Zhu, S.; Tu, Z.; Zhang, C.; Li, H. Potential Impacts of Climate Change in Future on the Geographical Distributions of Relic Liriodendron chinense. J. Trop. Subtrop. Bot. 2020, 29, 151–161. [Google Scholar]
- Yao, X. Predicting the Suitable Habitats of Relic Plants Ginkgo Biloba and Davidia Involucrata; North China Electric Power University: Zhengzhou, China, 2019. [Google Scholar]
- Yi, Y.; Cheng, X.; Yang, Z.; Zhang, S. Maxent modeling for predicting the potential distribution of endangered medicinal plant (H. riparia Lour) in Yunnan, China. Ecol. Eng. 2016, 92, 260–269. [Google Scholar] [CrossRef]
- Urbani, F.; Alessandro, P.D.; Frasca, R.; Biondi, M. Maximum entropy modeling of geographic distributions of the flea beetle species endemic in Italy (Coleoptera: Chrysomelidae: Galerucinae: Alticinae). Zool. Anz. A J. Comp. Zool. 2015, 258, 99–109. [Google Scholar] [CrossRef]
- Zhang, H.; Zhao, H.; Xu, C. The potentia geographical distribution of Alsophila spinulosain under climate change in China. Chin. J. Ecol. 2021, 40, 968–979. [Google Scholar]
- Maxent Software. Available online: http://www.cs.princeton.edu/schapire/maxent (accessed on 12 October 2019).
- Shen, L.; Xu, J.; Luo, L.; Hu, H.; Meng, X.; Li, X.; Chen, S. Predicting the potential global distribution of diosgenin-contained Dioscorea species. Chin. Med. 2018, 13, 58. [Google Scholar] [CrossRef]
- Jiang, H.; Liu, T.; Li, L.; Zhao, Y.; Pei, L.; Zhao, J. Predicting the Potential Distribution of Polygala tenuifolia Willd. under Climate Change in China. PLoS ONE 2016, 11, e163718. [Google Scholar] [CrossRef]
- Remya, K.; Ramachandran, A.; Jayakumar, S. Predicting the current and future suitable habitat distribution of Myristica dactyloides Gaertn. using MaxEnt model in the Eastern Ghats, India. Ecol. Eng. 2015, 82, 184–188. [Google Scholar] [CrossRef]
- Li, J.; Fan, G.; He, Y. Predicting the current and future distribution of three Coptis herbs in China under climate change conditions, using the MaxEnt model and chemical analysis. Sci. Total Environ. 2020, 698, 134141. [Google Scholar] [CrossRef] [PubMed]
- Du, Z.; He, Y.; Wang, H.; Wang, C.; Duan, Y. Potential geographical distribution and habitat shift of the genus Ammopiptanthus in China under current and future climate change based on the MaxEnt model. J. Arid. Environ. 2021, 184, 104328. [Google Scholar] [CrossRef]
- Hong, D. Study on the Resources and Quality Analysis of Tib Etan Medicine Rhordiola Kirilowii; Chengdu University of Traditional Chinese Medicine: Chengdu, China, 2018. [Google Scholar]
- Wu, Z.; Zhou, Z.; Li, D. The Areal-types of the World Families of Seed Plants. Acta Bot. Yunnanica 2003, 25, 245–257. [Google Scholar]
- Xuan, Z. The taxonomic and evolution and distribution of Papaveraceae. Acta Bot. Yunnanica 1993, 15, 137–148. [Google Scholar]
- Root, T.L.; Price, J.T.; Hallt, K.R.; Schneiders, S.H. Fingerprints of global warming on wild animals and plants. Nature 2003, 421, 57–60. [Google Scholar] [CrossRef] [PubMed]
- Zhao, H.; Zhang, H.; Xu, C. Study on Taiwania cryptomerioides under climate change: MaxEnt modeling for predicting the potential geographical distribution. Glob. Ecol. Conserv. 2020, 24, e1313. [Google Scholar] [CrossRef]
- Ma, Y.; Lu, X.; Li, K.; Wang, C.; Guna, A.; Zhang, J. Prediction of Potential Geographical Distribution Patterns of Actinidia arguta under Different Climate Scenarios. Sustainability 2021, 13, 3526. [Google Scholar] [CrossRef]

| Classification | Factors | Name | Unit |
|---|---|---|---|
| Meteorological factors | bio1 | Mean annual temperature | °C |
| bio2 | Mean of monthly (max temperature–min temperature) | °C | |
| bio3 | Isothermality (bio2/bio7x100) | 1 | |
| bio4 | Standard deviation (SD) of temperature seasonality | 1 | |
| bio5 | Max temperature of warmest month | °C | |
| bio6 | Min temperature of coldest month | °C | |
| bio7 | Temperature annual range (bio5-bio6) | °C | |
| bio8 | Mean temperature of wettest quarter | °C | |
| bio9 | Mean temperature of driest quarter | °C | |
| bio10 | Mean temperature of warmest quarter | °C | |
| bio11 | Mean temperature of coldest quarter | °C | |
| bio12 | Annual precipitation | mm | |
| bio13 | Precipitation of wettest month | mm | |
| bio14 | Precipitation of driest month | mm | |
| bio15 | Coefficient of variation of precipitation seasonality | 1 | |
| bio16 | Precipitation of wettest quarter | mm | |
| bio17 | Precipitation of driest quarter | mm | |
| bio18 | Precipitation of warmest quarter | mm | |
| bio19 | Precipitation of coldest quarter | mm | |
| Precipitation factors | pre1-pre12 | Monthly precipitation from January to December | mm |
| The temperature factors | tmean1-tmean12 | Average monthly temperature from January to December | °C |
| Soil factors | ph | T_PH_H2O (the soil reaction of topsoil) | 1 |
| cec | T_CEC_SOIL (the cation exchange capacity in topsoil) | cmol/kg | |
| sand | T_SAND (percentage sand in the topsoil) | % | |
| clay | T_CLAY (percentage clay respectively in the topsoil) | % | |
| sym90 | SU_SYM90 (name of soil in FAO90 Soil Classification System) | /* | |
| awc | AWC_CLASS (soil available water content grade) | /* | |
| usda | T_USDA_TEX (texture class name and code) | /* | |
| oc | T_OC (the percentage of organic carbon in topsoil) | % | |
| Terrain factors | dem | Alt | m |
| slope | Slope | ° | |
| aspect | Aspect | /* |
| Factors | Percent Contribution (%) |
|---|---|
| bio14 | 35.6 |
| bio16 | 13.4 |
| bio1 | 7.8 |
| sym90 | 7.8 |
| dem | 6.6 |
| bio9 | 5.0 |
| usda | 4.8 |
| bio17 | 3.6 |
| slope | 2.9 |
| bio8 | 2.8 |
| bio7 | 2.7 |
| aspect | 2.0 |
| bio3 | 1.3 |
| bio15 | 0.8 |
| bio19 | 0.7 |
| bio11 | 0.6 |
| bio12 | 0.6 |
| tmean8 | 0.3 |
| pre8 | 0.1 |
| tmean7 | 0.1 |
| cec | 0.1 |
| pre11 | 0.1 |
| pre9 | 0.1 |
| Classification | Factors | Name | Unit |
|---|---|---|---|
| The temperature factors | bio1 | Mean annual temperature | °C |
| bio3 | Isothermality (bio2/bio7x100) | 1 | |
| bio7 | Temperature annual range (bio5-bio6) | °C | |
| bio8 | Mean temperature of wettest quarter | °C | |
| bio14 | Precipitation of driest month | mm | |
| bio15 | Coefficient of variation of precipitation seasonality | 1 | |
| bio16 | Precipitation of wettest quarter | mm | |
| Soil factors | sym90 | SU_SYM90 (name of soil in FAO90 Soil Classification System) | /* |
| usda | T_USDA_TEX (texture class name and code) | /* | |
| Terrain factors | dem | Alt | m |
| slope | Slope | ° | |
| aspect | Aspect | /* |
Publisher’s Note: MDPI stays neutral with regard to jurisdictional claims in published maps and institutional affiliations. |
© 2021 by the authors. Licensee MDPI, Basel, Switzerland. This article is an open access article distributed under the terms and conditions of the Creative Commons Attribution (CC BY) license (https://creativecommons.org/licenses/by/4.0/).
Share and Cite
Cao, Z.; Zhang, L.; Zhang, X.; Guo, Z. Predicting the Potential Distribution of Hylomecon japonica in China under Current and Future Climate Change Based on Maxent Model. Sustainability 2021, 13, 11253. https://doi.org/10.3390/su132011253
Cao Z, Zhang L, Zhang X, Guo Z. Predicting the Potential Distribution of Hylomecon japonica in China under Current and Future Climate Change Based on Maxent Model. Sustainability. 2021; 13(20):11253. https://doi.org/10.3390/su132011253
Chicago/Turabian StyleCao, Zhen, Lei Zhang, Xinxin Zhang, and Zengjun Guo. 2021. "Predicting the Potential Distribution of Hylomecon japonica in China under Current and Future Climate Change Based on Maxent Model" Sustainability 13, no. 20: 11253. https://doi.org/10.3390/su132011253
APA StyleCao, Z., Zhang, L., Zhang, X., & Guo, Z. (2021). Predicting the Potential Distribution of Hylomecon japonica in China under Current and Future Climate Change Based on Maxent Model. Sustainability, 13(20), 11253. https://doi.org/10.3390/su132011253