Article

Environmental Sustainability Assessment of Pig Farms in Selected European Countries: Combining LCA and Key Performance Indicators for Biodiversity Assessment

1
Division of Livestock Sciences, Department of Sustainable Agricultural Systems, University of Natural Resources and Life Sciences, Gregor-Mendel-Str. 33, 1180 Vienna, Austria
2
Friedrich-Loeffler-Institut, Institute of Animal Welfare and Animal Husbandry, Dörnbergstr. 25/27, 29223 Celle, Germany
3
Institute of Management, Warsaw University of Life Sciences, Nowoursynowska 166, 02-787 Warszawa, Poland
4
Food and Rural Development, School of Agriculture, Newcastle University, Kings Road, Newcastle upon Tyne NE1 7RU, UK
5
Wageningen University & Research, De Elst 1, P.O. Box 338, 6700 AH Wageningen, The Netherlands
6
FiBL Deutschland e.V., Kasseler Str. 1a, PF 90 01 63, 60486 Frankfurt am Main, Germany
*
Authors to whom correspondence should be addressed.
Sustainability 2021, 13(20), 11230; https://doi.org/10.3390/su132011230
Submission received: 22 July 2021 / Revised: 1 October 2021 / Accepted: 8 October 2021 / Published: 12 October 2021
(This article belongs to the Special Issue Sustainable Pig Production)

Abstract

:
The aim of this study was to combine Life Cycle Assessment (LCA) with a Key Performance Indicator (KPI) assessment focusing on biodiversity in order to examine the environmental impacts of different pig farm types (13 breeding, 23 finishing and 27 breeding-to-finishing farms) in seven European countries. In addition, the relationship between environmental impacts and selected farm management characteristics was explored. Fossil energy depletion (FED), global warming (GWP), acidification (AP) as well as marine (MEP) and fresh water (FEP) eutrophication potential were assessed by an attributional LCA and expressed per kilogram body mass net sold (BMNS). In addition, the potential biodiversity performance of all crop-livestock farms within the sample (n = 56) was evaluated with a KPI assessment of biodiversity-related field management characteristics. We found no relationship between LCA results and biodiversity scores (KPI). LCA and biodiversity performance varied more within than across farm types (breeding, finishing, breeding-to-finishing). For example, the GWP expressed per kg BMNS of the breeding unit of breeding-to-finishing farms was on average (median) 2.77 (range: 1.40–4.78) and of breeding farms 2.57 (range: 1.91–3.23) kg CO2-eq. The average (median) biodiversity theme score for breeding farms was 51% (range: 36–70%), for breeding-to-finishing farms 38% (range: 30–68%) and for finishing farms 43% (range: 28–67%). Several farm management characteristics (e.g., FCR, productivity, proportion of solid manure) correlated with all/some LCA results. Biodiversity performance depended especially on KPIs related to ecological focus areas, fertiliser management and GMO crops. The large range regarding environmental performance in both LCA and KPI assessment across farm types indicates that farm-specific improvement measures should be implemented to enhance overall environmental sustainability on farm. In conclusion, combining LCA with KPI assessment provides a more comprehensive environmental impact assessment of pig farms.

1. Introduction

Sustainability has become an important aspect of livestock production in Europe. It is defined as “… the ability to make development sustainable to ensure that it meets the needs of the present without compromising the ability of future generations to meet their own needs” [1] and is often described to include three dimensions: economy, environment and social sustainability. The EU Commission has launched its Green Deal, which aims for Europe to be the first climate-neutral continent and includes a farm-to-fork strategy to accelerate the transition to sustainable food systems. This addresses several environmental aspects, such as “to have neutral or positive environmental impacts, to help to mitigate climate change and adapt to its impacts and to reverse the loss of biodiversity” [2]. Therefore, the EU has clearly stated the need for environmentally friendly agriculture practices.
However, livestock production can have detrimental effects on the environment by producing large amounts of greenhouse gas and ammonia emissions and thus contributing to global warming, acidification and eutrophication. Global pork production is estimated to emit 668 megatons of carbon dioxide equivalent (CO2-eq) greenhouse gases annually [3]. Although this is lower than the beef and dairy cattle sectors combined (4623 megatons CO2-eq annually [3]), global pork production is forecast to grow by 11 Mt (+10%) until 2029, especially in developing countries [4]. Further, agricultural expansion and intensification is one of the main drivers for land-use change (e.g., deforestation of large areas in the Amazonas) and biodiversity loss due to increasing demand for animal feed (e.g., soybean, pastures) [5]. Therefore, environmental assessment of different pig farms and a deeper understanding of underlying driving factors are highly relevant to support strategies for limiting adverse effects on the environment.
One systematic assessment method to quantify the potential environmental impacts of complex systems is the Life Cycle Assessment (LCA), which aims to evaluate the environmental impact generated during the entire life cycle of a product [6]. In the past years, LCA of pig production systems were used to investigate potential environmental impacts related to farm performance [7,8], manure management [9], or pig diet e.g., crude protein content or amino acid supplementation [10,11,12]. The results are required to support farm management decisions regarding mitigation strategies. However, LCA has limitations. Various environmentally relevant aspects are hard to quantify and are therefore mostly not included in the assessment. Biodiversity, for example, is often omitted [13] despite its crucial global role [14,15]. Therefore, a combination with other environmental assessment methods are needed to address environmental impacts more comprehensively.
Key-Performance-Indicator (KPI) assessment, a semi-quantitative method, is a suitable approach to address such topics. A number of comprehensive sustainability or environmental impact assessment tools are fully or partially based on KPIs, e.g., “Sustainability Monitoring and Assessment RouTine” (SMART) [16], “Sustainability Assessment of Food and Agriculture Systems” (SAFA) [17] or the “Response-Inducing Sustainability Evaluation” (RISE) [18]. KPIs are especially useful for assessing field management measures to promote biodiversity, such as cultivation of endangered crops or growing catch crops. These measures improve the environment locally as well as globally and can directly be implemented on-farm. Some studies have already assessed environmental performance as part of a sustainability assessment using the SAFA tool, for example on organic livestock farming in Sicily [19] or beef cattle farming in Indonesia [20]. Others used the SMART tool, for example on coffee farms in Uganda [21]. However, a combination and on-farm application of LCA and KPI assessment has yet to be undertaken.
Therefore, a novel methodological approach is to combine quantitative LCA assessment with KPI assessment, in order to complement the LCA with a biodiversity assessment. This can serve as a hot-spot analysis for farmers and provide a first overview as the basis for improvements.
Thus, the overall aim of this study was to undertake a methodological evaluation of two environmental sustainability assessments, namely LCA and KPI assessment based on selected European pig farms. Specific objectives of this study were to (1) calculate environmental impacts using LCA methodology considering three different farm types (specialized breeding farms, finishing farms and breeding-to-finishing farms) and to analyse variation within farm types, (2) assess biodiversity performance at farm level using KPIs considering the three farm types and analyse variation, (3) investigate associations between LCA and KPI results and (4) investigate associations between farm management characteristics and environmental impacts (LCA and KPI).
We hypothesized that variation within farm types would be higher than across farm types for both LCA and KPI assessment, since the farm sample included very different production systems. Further, we hypothesized that farms with good LCA impacts would have poor performance on biodiversity based on a KPI assessment. The assumption was that farms with good LCA results manage their pig farm on a high productivity and efficiency level, which might be also reflected in intensive field management to produce crops to feed the pigs, which might have few biodiversity measures in place. Furthermore, we hypothesized that combining LCA and KPI assessment provides a more comprehensive environmental sustainability assessment.

2. Materials and Methods

2.1. On-Farm Data Collection

Data were collected on 63 commercial farms of three farm types across seven countries (Table 1). The farms included conventional and organic pig production systems within each country, as well as farms with other labels regarding e.g., GMO-free feed or higher animal welfare standards than the minimum requirements of the EU. A large variety of farms were included to obtain a more heterogeneous sample. Some farm systems combined pig farming with production of crops, often to be used as raw materials for pig feed or sold as cash crops; these farms are referred to as “crop-livestock farms”. Farms were assessed as part of the ERA-Net SusAn project “Sustainable pig production systems” (SusPigSys; complete assessment protocol in [22]).
Farms were visited between May and October 2018, with the calendar year 2017 used as the reference period for analysis of farm records data. Farm visits were conducted according to a standard operation protocol [22]. One national assessor per country interviewed the farm manager and summarised data from farm records using a standardized questionnaire. One of two trained and tested for reliability assessors (AR, JH) conducted direct observations of animals and facilities on each farm. The farm manager and the interviewer signed a confidentially agreement before assessment started. Data were collected on paper and subsequently transferred to Microsoft® Excel files.

2.2. Life Cycle Assessment: Scope and Methodology

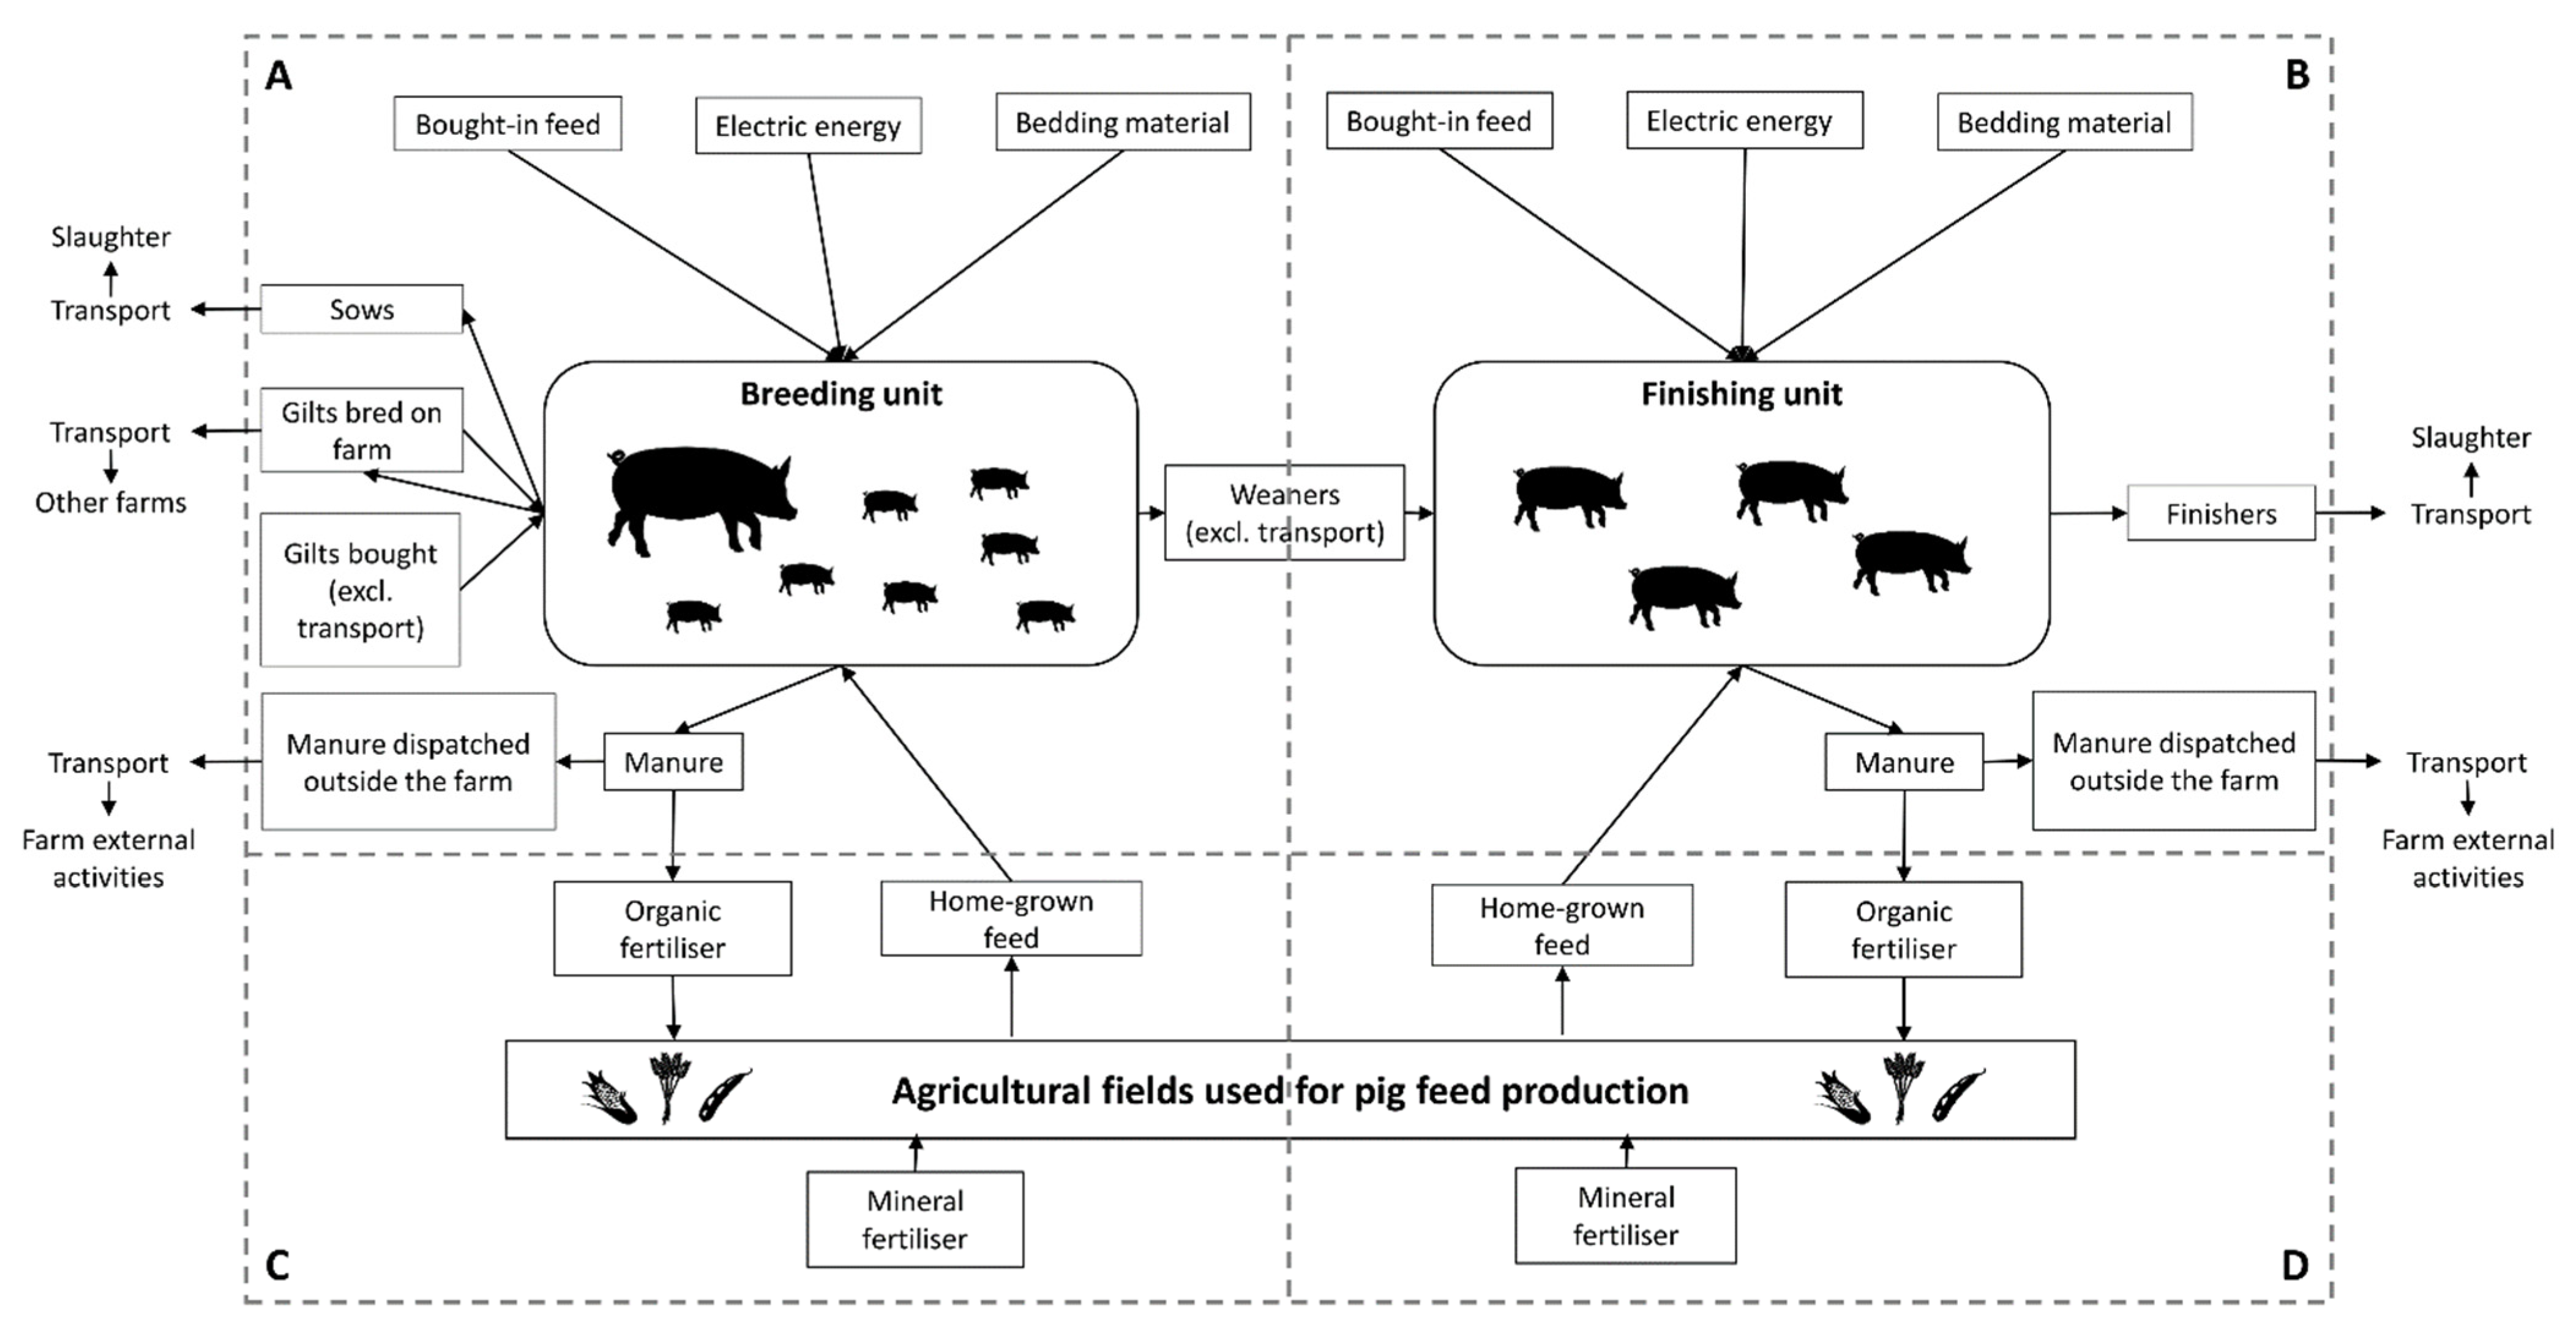
2.2.1. System Boundaries and Functional Units

The system boundary for the LCA calculations was from the ‘cradle’, or the production of input materials, to the farm gate. Breeding-to-finishing farms were divided into a breeding and a finishing unit to obtain one value for their breeding and one for their finishing stage. Amounts of feed and straw were collected separately for each animal category and could therefore be split easily. Electricity usage was allocated to the breeding and the finishing units based on the farmers’ records. In this way, it was possible to create a larger sample to compare specialized breeding and finishing farms with the respective stage of breeding-to-finishing farms. Weaners up to 30 kg live weight were considered as part of the breeding unit. In addition, system boundaries depended on whether the farm produced feed for its own pigs or not (Figure 1). Impacts of pigs after they left the farm gate were not considered (i.e. transport of animals to and from all farms, and the slaughter process).
The functional unit was 1 kg of body mass net sold (BMNS). Total amount of body mass net sold was defined as the difference between total live weight output and input of the respective unit (breeding and finishing). LCA impact categories were calculated for breeding and finishing units separately. For breeding-to-finishing farms, LCA impacts were additionally calculated per kg BMNS throughout the whole process, i.e. from piglet birth to finishing pig leaving the farm. All bought-in pigs such as replacement gilts were considered indirectly through subtracting their body mass from the total output.

2.2.2. Impact Categories

The following LCA impact categories relevant for pig production [6,23,24] were calculated (method in brackets):
  • Fossil energy depletion in mega joules (FED; Cumulative energy demand v1.10)
  • Global warming potential in kilograms of CO2-equivalents (GWP; GWP-100 v1.03)
  • Acidification potential in kilograms of sulphate SO2-equivalents (AP; CML-IA non-baseline v3.04/EU25)
  • Fresh water eutrophication potential in P-equivalents (FEP; ILCD 2011 Midpoint+ v1.10/EC-JRC Global)
  • Marine water eutrophication potential in N-equivalents (MEP; ILCD 2011 Midpoint+ v1.10/EC-JRC Global)

2.2.3. Life Cycle Assessment Tool

A LCA assessment tool for calculating farm-specific LCA impacts was constructed in Microsoft® Excel. In principle, this study was based on the four phases of the LCA, which are defined in the ISO standard 14040 [25]. Those phases are: (1) the goal and scope definition, which defines the aims of the analysis and for instance the functional unit, the system boundaries and the allocation procedure; (2) the life cycle inventory analysis that assembles inputs and outputs and their associated environmental impacts; (3) the life cycle impact assessment, which calculates environmental impacts based on the inventory for each pig unit (farm); (4) additionally, results are interpreted to derive conclusions for the analysed farm types within this study. The following steps explain the development of the LCA tool in more detail:
(1)
Data sheets for farm-specific primary (foreground) data were designed and filled in with data collected during the farm visits. Data sources included productivity records from the management information system, slaughter remarks and invoices. The following farm management characteristics were used (for more detailed information see Supplementary Material Table S2):
  • Farm size and productivity numbers
  • Bought-in pigs per annum
  • Sold pigs per annum
  • Feed management
  • Manure management
  • Bedding material
  • Electric energy
(2)
For data that were not possible to collect on all farms, default values were defined and added to the LCA assessment tool as follows:
  • Composition of fifteen compound feeds (five different feeds regarding energy and protein content, each with three variations for conventional, regional and organic feed; details of their compositions are given in Supplementary Material Table S3) based on feed formulations with typical protein and metabolizable energy content, using data from the Swiss FEEDBASE [26]
  • Nitrogen excretion per sow including piglets up to 30 kg (34.5 kg sow−1 year−1) and per finishing pig place per year (12.1 kg pig−1 year−1), based on EMEP EEA [27]
  • Country-specific electricity mixes, based on Ecoinvent data [28]
(3)
LCA impacts (FED, AP, GWP, FEP and MEP) of background data were calculated with SimaPro version 9 and implemented as impact factors in the LCA assessment tool. The impacts of infrastructure were excluded from calculations as recommended e.g., by British PAS 2050 [29]. Impact factors were calculated for the following background data:
  • Forty-six bought-in feed components expressed per kilogram feed component based on Ecoinvent data [28] whenever no allocation was needed (for grains or legumes). Additionally, when economic allocation was needed, data on feedstuffs were also derived from Agribalyse data [30] and Agri-footprint data [31,32]. Sources and impact factors of each feed component are presented in Supplementary Material Tables S4 and S5.
  • Twelve variable impact factors for home-grown feed components, which allow for changing parameters for yields and N- and P-fertilisation expressed per kilogram of feed component, based on Ecoinvent data [28]
  • Four mineral nitrogen and two phosphorous fertilisers expressed per kilogram of fertiliser, based on Ecoinvent data [28]
  • Seven country-specific electric energy mixes expressed per kilowatt hour, based on Ecoinvent data [28]
  • Straw expressed per kilogram of straw, based on Ecoinvent data [28]
(4)
Formulae that connect farm-specific primary data, default values and impact factors to calculate LCA impacts per kg BMNS of the different emission sources were implemented in the tool and LCA results calculated for:
  • Bought-in feed
  • Home-grown feed, taking farm-specific yield and fertilising management for nitrogen and phosphate into account
  • Manure, includingimpacts from manure (incl. spreading) and enteric fermentation based on IPCC [33] and EMEP EEA [27] guidelines
  • Electric energy
  • Bedding material
(5)
Impacts from the different sources were summed up to generate one result for each LCA impact category for each farm (per kg of BMNS).

2.3. Biodiversity Performance Based on Key Performance Indicator Assessment

For agricultural activities, KPIs are useful for assessing important environmental impacts mainly based on farm-individual field management characteristics (e.g., cultivation of catch crops, use of pesticides). The KPIs used in this study were based on the SAFA guidelines and tool [17,34] as well as the SMART tool [16] and adapted to address the specifics of pig farms. These tools are designed to evaluate farm-specific sustianability scores per theme. According to the SAFA guidelines and tool, KPIs were allocated to subthemes (e.g., ecosystem diversity, water quality, land degradation), which were then grouped into themes (e.g., atmosphere, water, soil, biodiversity as well as material and energy) [17,34]. The focus of this study was the biodiversity theme, specifically the subthemes “ecosystem (habitat) diversity (ED)”, “species (flora and fauna; number of species and abundance) diversity (SD)” and “genetic diversity (GD)”. This was not covered by the LCA method used in this publication, nor was it addressed in previous LCA studies focusing on European pig production e.g., [6,23,24].
The format of KPI answers included numbers, proportions and categorical data (see Table 2). Thus, for analysis, it was necessary to scale all KPI to values ranging from 0% to 100%, representing the lowest to the highest score. This was done by recoding “yes”/”no” answers as 0% and 100%, “yes/”maybe”/”no” answers as 0%, 50% and 100% or vice versa. Numerical answers were converted by applying linear functions between minimum and maximum values (thresholds) based on literature.
The converted answers were then multiplied with expert weightings representing the respective contribution of each KPI to each subtheme, and the products summed up to one value per subtheme for each farm (Table 2). The three subtheme values were further aggregated into a biodiversity theme score for each farm by calculating the mean of the subthemes. Weights were set based on an expert survey through a Delphi-like approach [35], closely following the methodology of [36] on the use of experts to evaluate animal welfare indicators. This approach was conducted for all four sustainability dimensions, namely environment, economy, social wellbeing and animal health and welfare similar to [16]. Experts were selected based on their documented experience in the respective sustainability area from within and outside the SusPigSys consortium. Out of the 36 participating experts, six were experts (researchers) in biodiversity and conducted the weighing procedure within the biodiversity theme. The expert survey consisted of two rounds and was undertaken in an anonymous way. In the first round, all experts were asked to allocate weights independently. All answers were then collected and a median calculated which was presented to the same experts in a second round. Experts were able to agree or to revise the presented weights. The final weights (median) were calculated based on the results from the second round. The process from indicator selection to the aggregated values including the expert survey is described in detail elsewhere [37].
For the specialized livestock farms without their own agricultural land, KPIs related to agricultural land could not be assessed due to the system boundaries (crops are grown on other farms) nor could any aggregation be made for subtheme (ecosystem, genetic and species diversity) and theme scores. Thus, these farms had to be excluded from this part of the analysis.

2.4. Statistical Analyses

Statistical analysis were undertaken in SAS 9.4 [38], with p-values ≤ 0.05 considered to indicate significant differences. Non-parametric tests were used since data were not normally distributed. LCA results of breeding and finishing farms were compared with the respective production stage of breeding-to-finishing farms using a Wilcoxon two sample rank-sum test. Since farms were not a representative sample, production standards (conventional, organic, other label) and country were not tested. Biodiversity performance results based on the KPI assessment were compared between the three farm types (breeding, finishing and breeding-to-finishing) using a Kruskal-Wallis test. Spearman correlation coefficients (rs) were calculated to investigate associations between farm management characteristics (listed in Table 3) and results for the environmental impacts FED, GWP, AP, FEP and MEP, ED, GD, SP. Absolute rs values greater than 0.4 were regarded as indicating a relevant association.

3. Results

3.1. Farm Management Characteristics

Farm management characteristics of the 63 pig farms are summarized in Table 3. The sample included farms of a large variety of production systems within all farm types. On average (median), specialized breeding farms were numerically larger than the breeding units of breeding-to-finishing farms (419 vs. 150 sows per farm), as were specialized finishing farms compared to the finishing units of breeding-to-finishing farms (4035 vs. 2867 finishers sold to slaughter).
Out of 63 farms, 56 farms (89%) had agricultural land (including grassland and arable land), with the lowest value found in breeding farms (65%), followed by finishing farms (91.3%) and the highest in breeding-to-finishing farms (96%). Details about the field management can be found in Supplementary Material Table S6. Breeding-to-finishing farms produced on average (median) 21.2% of the feed for the breeding unit and 15.9% for the finishing unit on their own fields, whereas an average (median) breeding and finishing farms did not produce any of the feed from their own fields (Table 3).

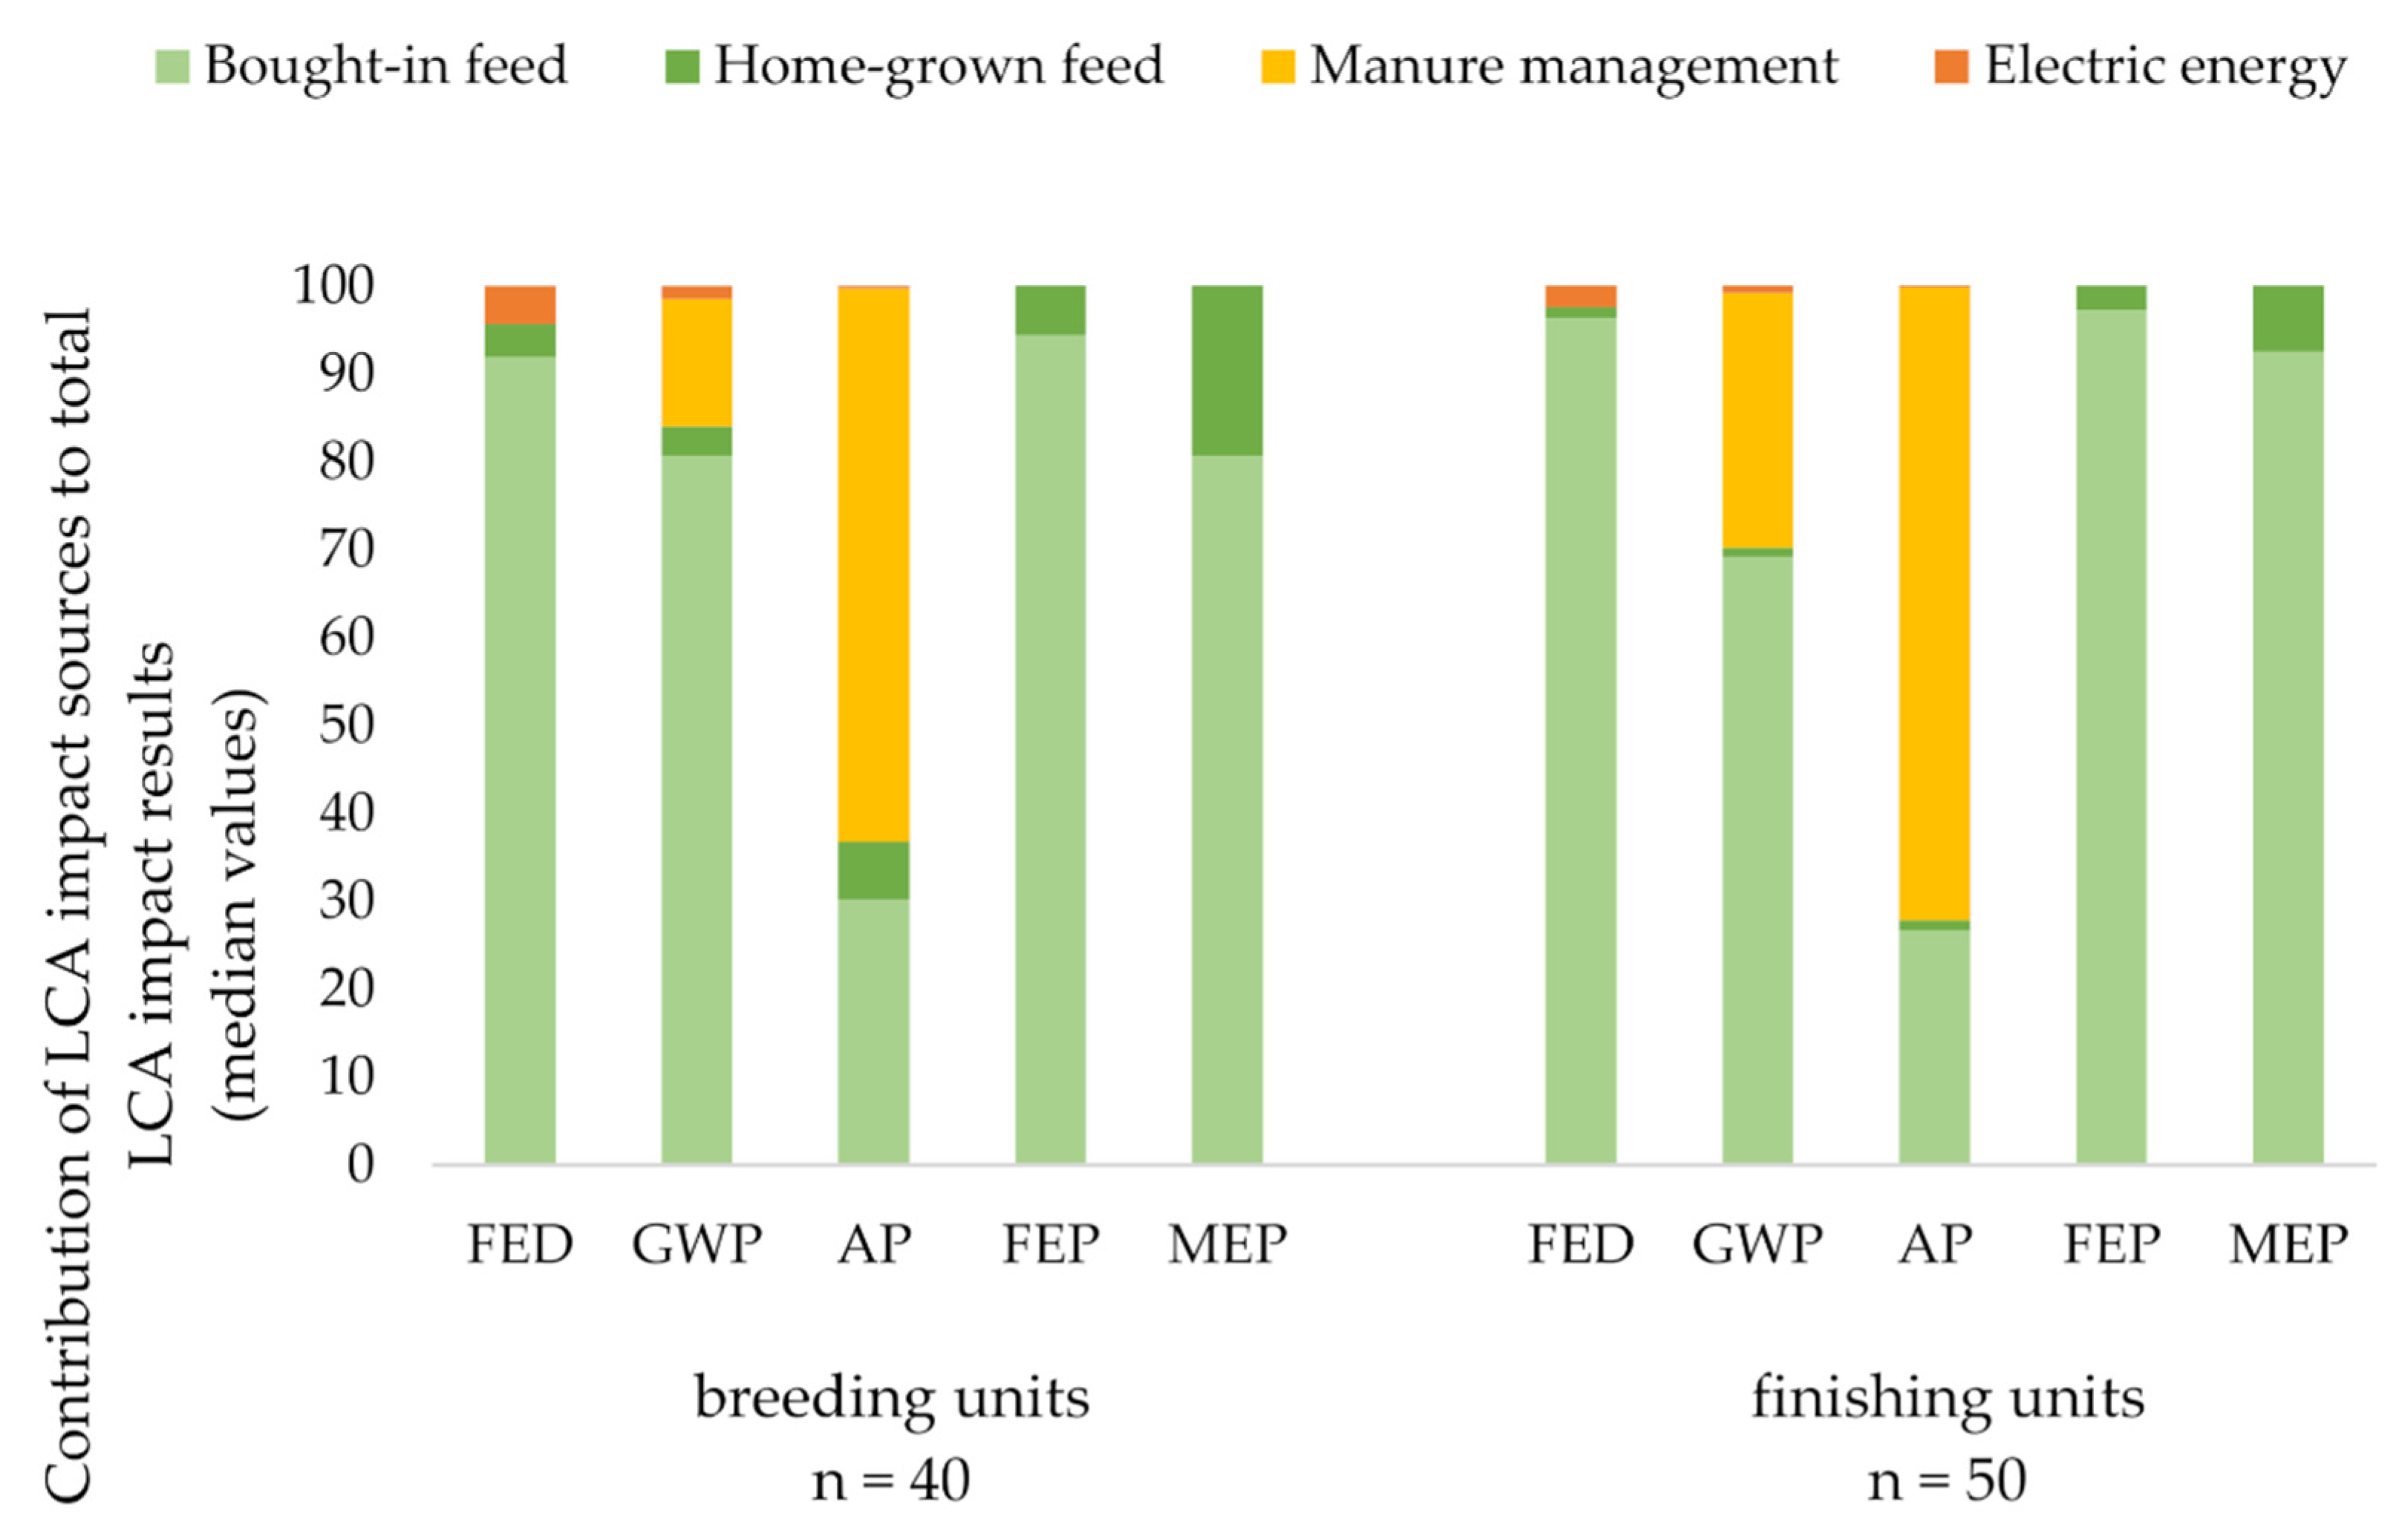
3.2. Results from Life Cycle Assessment (LCA)

Total environmental impacts (FEP, GWP, AP, FEP, MEP) based on LCA and expressed per kg BMNS for the three different farm types (breeding farms, finishing farms and breeding-to-finishing farms) are shown in Table 4.
Results of the respective breeding and finishing unit of breeding-to-finishing farms are presented separately as well as combined for the whole farm. Median values of FED were between 12.9 and 16.1 MJ kg−1 BMNS, GWP between 2.57 and 2.93 kg CO2-eq kg−1 BMNS, AP between 41.0 and 48.5 g SO2-eq kg−1 BMNS, FEP between 0.50 and 0.60 g PO4-eq kg−1 BMNS and MEP between 19.1 and 23.5 g N-eq. kg−1 BMNS. Environmental impacts of breeding farms and the breeding units of breeding-to-finishing farms and finishing farms and the finishing units of breeding-to-finishing farms were very similar (all p-values > 0.2). Variation within breeding and finishing units was large, e.g., GWP results of breeding units ranged from 1.40 to 4.78 kg CO2-eq kg−1 BMNS and AP results from 17.5 to 166.1 g SO2-eq kg−1 BMNS.
Bought-in feed contributed highest to FED (91.1% and 94.1%), GWP (79.1% and 64.7%), FEP (93.8% and 97.4%) and MEP (84.4% and 93.3%) for both breeding and finishing units (Figure 2). Manure management (housing, storage and spreading) had the highest impact on AP for both breeding units (60.9%) and finishing units (68.6%). Electric energy contributed less than 4% to all impact categories. Straw contributed less than 0.001% to impacts and was thus excluded from Figure 2.

3.3. Key-Performance Indicator and Biodiversity Results

The lowest/worst performing KPIs across all farm types with a median of 0% were: High precision application of nitrogen (N) fertiliser, calculation of humus balances for farmland, presence of ecological focus areas and growing rare and endangered agricultural crops (see Supplementary Material Table S7).
Results of aggregated KPIs on subtheme level (ecosystem, species and genetic diversity) and biodiversity theme level for farms with agricultural land are shown in Table 5. No significant differences were found between the three farm types regarding any diversity subtheme or theme scores (biodiversity). In all three farm types, lowest median subtheme scores were found for genetic diversity, with 35%, 25% and 27% for breeding, breeding-to-finishing and finishing farms, respectively.

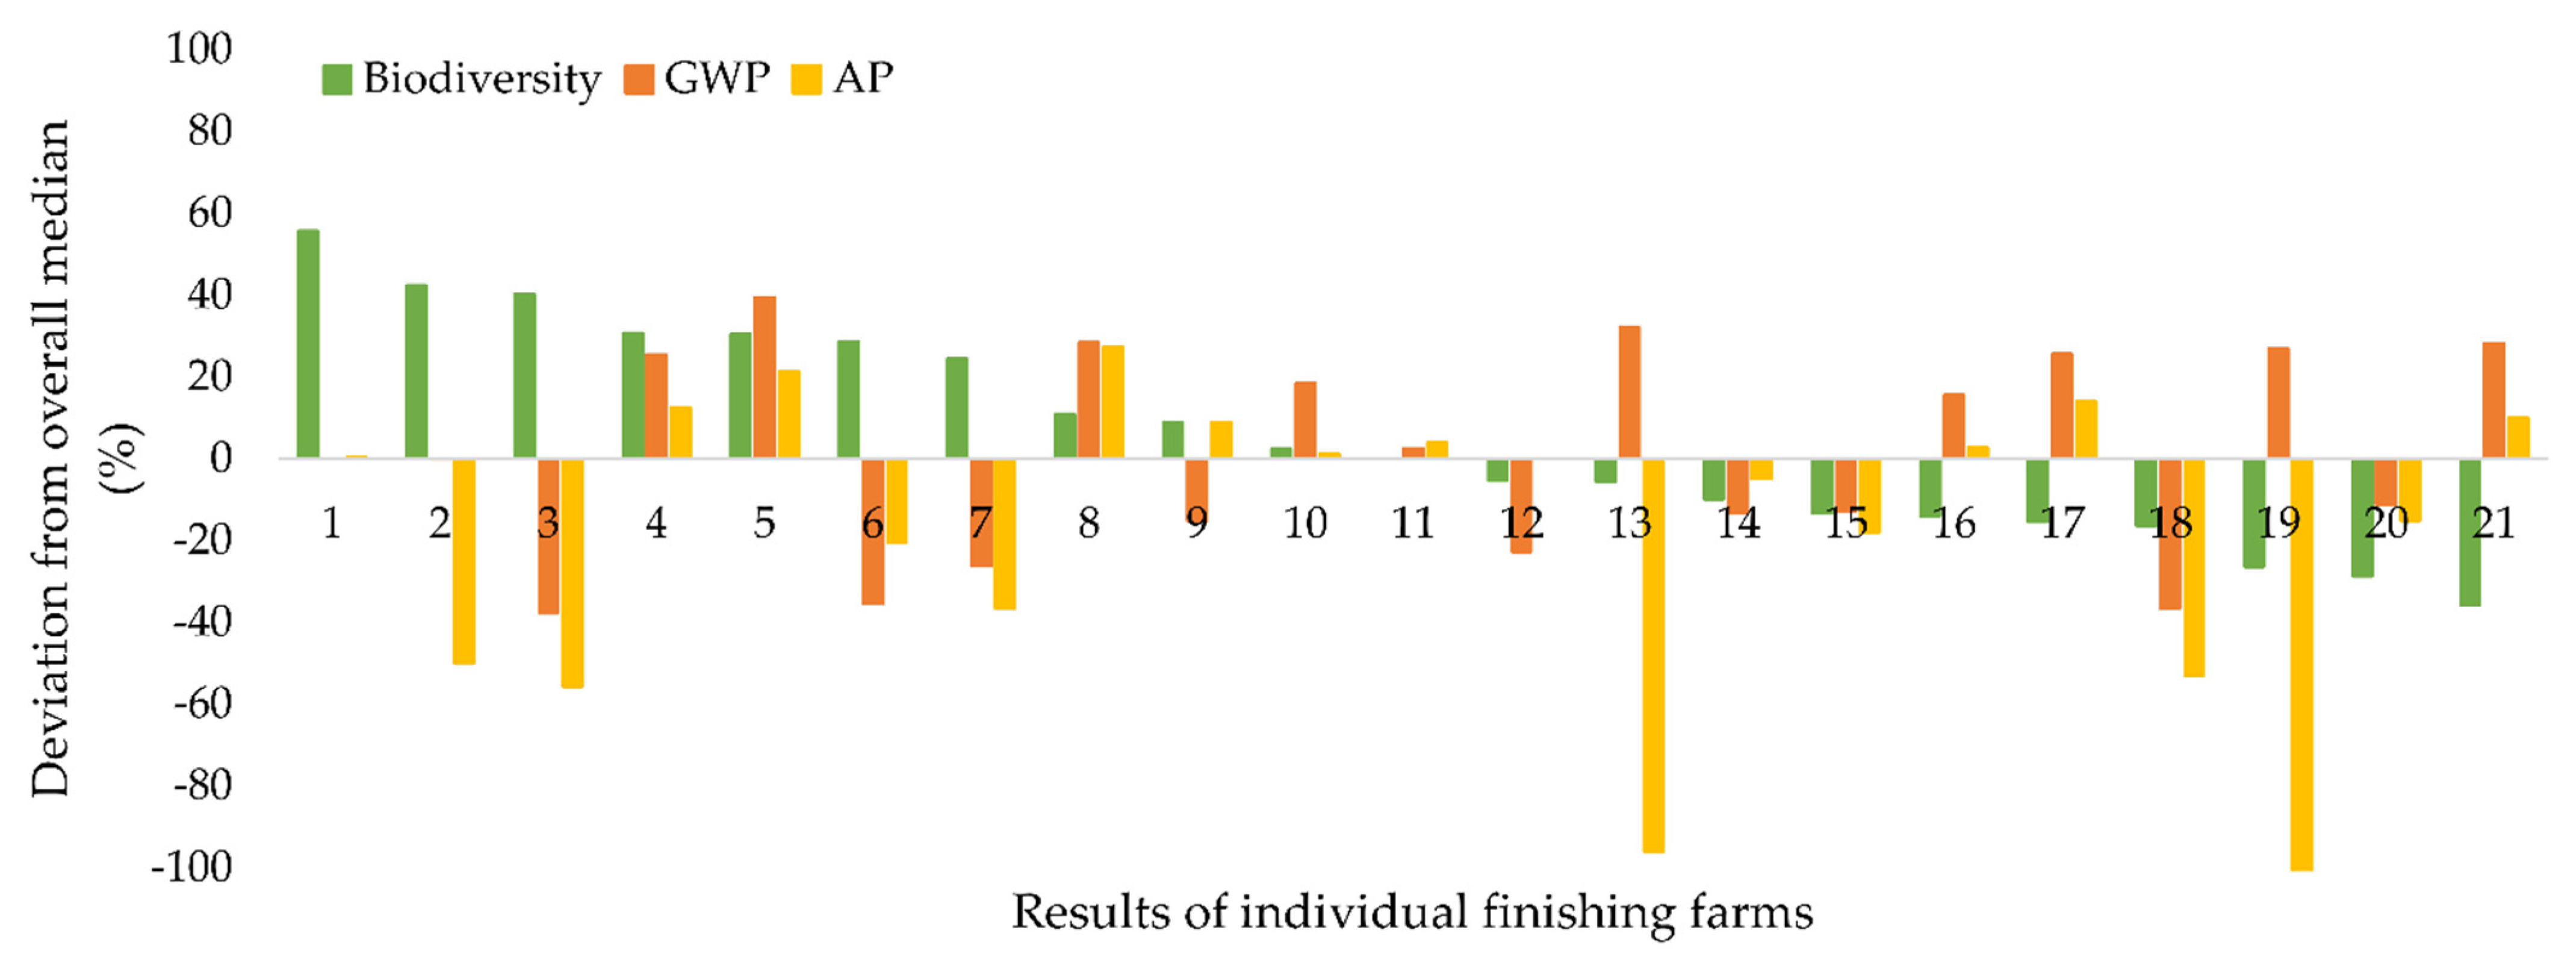
3.4. Correlations between LCA and Biodiversity Results

None of the environmental impacts from the LCA were correlated with any of the biodiversity subthemes (ecosystem, species and genetic diversity) or the aggregated biodiversity theme scores (see Supplementary Material Table S8).
The same was visible when combining overall biodiversity (KPI), global warming potential and acidification potential (LCA) results in one graph expressed in percentage deviation from overall median for finishing farms (Figure 3). Some farms (e.g., 4 and 5) were performing better than the median in all three categories, some farms (e.g., 18 and 20) were performing worse than the median in all categories, whereas others were performing good in biodiversity (e.g., 6 and 7) but worse in GWP and AP or vice versa (e.g., 17 and 21).

3.5. Correlation of Farm Management Characteristics with LCA and Biodiversity Results

Correlations between farm management characteristics and LCA results and biodiversity results based on KPIs are shown in Table 6. Most farm management characteristics (e.g., FCR, piglets weaned per sow and year, percentage of solid manure) correlated with LCA results only. Only three farm management characteristics correlated with results from both LCA and KPI assessment: Litters per sow and year correlated negatively with AP (rs = −0.43) as well as the subthemes species diversity (−0.40) and genetic diversity (−0.42) and the overall theme biodiversity scores (−0.41). Lactation length correlated positively with AP (0.48), MEP (0.69) and genetic diversity (0.45). In finishing units, number of finishing pigs sold for slaughter per year correlated negatively with AP (−0.61), MEP (−0.47) and genetic diversity (−0.47).

4. Discussion

So far, environmental impacts of pig farms have been mainly analysed by LCA [4] and to our knowledge, no study exists that has analysed environmental impacts of a comparable, diverse sample of European pig farms with a KPI assessment based on SAFA guidelines [17,34] or the SMART tool [16]. Therefore, this study combined for the first time quantitative LCA results with a semi-quantitative KPI assessment based on field management characteristics focusing on biodiversity to achieve a more comprehensive and holistic assessment of environmental performance of European pig farms.

4.1. Life Cycle Assessment (LCA)

The first aim was to quantify the environmental impacts of the 63 pig farms surveyed with an attributional LCA and to assess differences between farm types and variability within farm types. As expected, values did not only vary widely within farm types, but also the overall variation was similar for all farm types, i.e. specialized breeding or finishing farms and the respective stage of combined breeding-to-finishing farms (Table 4). This is in line with a previous study that did not compare different farm types but different organic systems (indoor with outdoor run, partly access to pasture and pasture pigs) and also came to the conclusion that variation was higher within farm systems than between them [24]. Findings from the current survey can be explained by the large variety of production systems within each farm type expressed in different farm management characteristics including different husbandry, feeding and manure management systems (Table 3). This inclusion of various, very different farms is in contrast to many other LCA studies, which focused either on environmental impacts of a rather homogenous sample of farms, e.g., conventional farms [39], organic farms [24] or traditional Iberian farms [40], or analysed different management aspects or feeding practices through scenarios based on average values [8,12,41].
Furthermore, we decided to use kilogram body mass net sold as the functional unit, whereas other studies often used kg live weight [23,24] or kg pork [8,12]. We chose kilogram body mass net sold as the LCA functional unit, since this allowed us to compare specialized pig farms (breeding, finishing) with the respective stage of breeding-to-finishing farms. Additionally, this functional unit is referring to the main product of pig farms and is therefore of high relevance for farmers from the environmental and economic (gross margin) point of view. However, it has to be kept in mind that using other functional units in LCA might results in different outcomes. For example, the unit “hectare of cultivated land”, might have shown increased LCA results for more intensive farms [23]. Indeed, including this unit in the present study would have been interesting to avoid one-sided evaluations based on product-related LCA results only. However, in the end we decided not to use the functional unit of ha of cultivated land, as it would have led to higher uncertainty due to the inclusion of a high proportion of default values for crop yields. Furthermore, in most cases pig farmers do not have the possibility to decide on the origin of the bought-in feed.
Since we used a different functional unit and also the methodologies and system boundaries are also slightly different, direct comparison with other studies is not possible [42]. Nevertheless, it is possible for the results for breeding-to-finishing farms to be set against the range of values found in other studies that focused on this farm type only. For breeding-to-finishing farms in the present study, their functional unit “per kg BMNS” can be compared with the functional unit “per kg live weight” used in most other studies, since for breeding-to-finishing farms it includes the whole process from piglets being born to finishers leaving the farm including bought-in gilts. The results found in the current study were in the same range as described in other studies. For example, GWP and AP (median) of breeding-to-finishing farms were 2.67 kg CO2-eq and 46.3 g SO2-eq per kg BMNS (Table 4), whereas other studies report values ranging from 2.2 to 4.4 kg CO2-eq per kg live weight (GWP) and from 23 to 186 g SO2-eq. per kg live weight (AP) [6,23,24,39,40,41].
When looking at the emission sources we found that feed (bought-in and home-grown) had the highest contribution to almost all impact categories, except for AP (Figure 2), which is similar to other studies [8,24]. This was also reflected in the correlations between farm management characteristics and the LCA results (Table 6). Thus, FED, GWP and FEP can be especially mitigated by an improved feed conversion ratio, whereas AP and MEP can also be reduced by management improvements regarding the reproductive performance of the farm and emissions deriving from manure.
On the other hand, focusing on management improvements to mitigate LCA results might have negative impacts (trade-offs) on other dimensions of sustainability such as animal welfare [43]. A shorter lactation can result in better LCA results, but increases stress and health issues (e.g., diarrhoea) in early weaned piglets [44]. Therefore, management improvements to mitigate LCA results should always be improved with due regard to the possible effects on the other sustainability dimensions (economy, social sustainability, animal health and welfare).

4.2. Biodiversity Assessment Based on Key Performance Indicators

The second aim of this study was to undertake a detailed KPI assessment with a focus on biodiversity, which broadened the environmental perspective compared to other studies. Variation in biodiversity subtheme and theme scores was larger within farm types than across farm types, similar to the LCA results (Table 5). This can also be explained by the large variety of production systems. Nevertheless, across all 56 crop-livestock farms regardless of farm type, scores for ecosystem, species and genetic diversity were scored on a low level so that the overall biodiversity theme score was between 38% and 43% (Table 5). Another study, assessing biodiversity on various organic farms (farms with different livestock species, mixed crop-livestock farms and crop farms) in Switzerland found median values within the “Good” category (theme scores were between 61% and 80%) [45]. The lower values found in the present study can be explained by the inclusion of mostly conventional and pig farms of some labels (except organic), many of which have also adopted conventional field management (e.g., use of pesticides). Nevertheless, the large variation with some relatively high values indicates that there is a large potential to implement measures to promote biodiversity on the majority of crop-livestock pig farms. Especially measures such as providing ecological focus areas on agricultural fields [46], fertilizing based on plant and soil analysis [47] and growing rare or endangered agricultural crops can be improved on the majority of crop-livestock pig farms in the present study to improve biodiversity.
Improving biodiversity is needed, since biodiversity is highly relevant for food security (e.g., supporting populations of pollinators) but has decreased rapidly in the last decades [15]. Therefore, biodiversity has been targeted in Sustainable Development Goal #15 of the United Nations, which states to “protect, restore and promote sustainable use of terrestrial ecosystems, sustainably manage forests, combat desertification, and halt and reverse land degradation and halt biodiversity loss” [48]. It is even hypothesised that with increasing biodiversity on the fields, inputs such as artificial pesticides can be reduced whilst maintaining yield through ecological control (i.e. with beneficial insects) [40]. Furthermore, the positive effects of measures to promote biodiversity, such as providing opportunities for pollination or biological pest control, can positively impact crop yields and even farm incomes [49,50].
These effects are part of an ecological intensification, which has received more attention in the last decades, since it is known that conventional intensification leads to a loss of biodiversity [51]. Ecological intensification is described as “a nature-based alternative that complements or (partially) replaces external inputs, such as agrochemicals, with production-supporting ecological processes, to sustain agricultural production while minimising adverse effects on the environment” [52]. Ecological intensification makes use of biodiversity and other ecosystem services of agricultural fields. This emphasises to highlight the diversity of ecosystem services so that farmers are aware of the potential benefits that nature provides and thus are willing to implement respective measures [53].
Therefore, projects to develop biodiversity assessment schemes, user-friendly tools, education and advice are necessary to raise understanding about the potential benefits of ecosystem services and to engage farmers in biodiversity improvement. Conducting a KPI assessment is one approach, since these measure-orientated indicators are easy to communicate to farmers, as they focus on information, which is known and understood by farmers [54]. In this way, farmers may be encouraged to implement some steps to promote biodiversity in the future. For further research it would be interesting to also include result-orientated indicators of biodiversity, such as counting numbers of different species [54,55]. However, counting species diversity is time- and resource-intensive [54] and was therefore not suitable for the scope of the current project.

4.3. Correlation of Farm Management Characteristics with LCA and Biodiversity Results

Most farm management characteristics correlated only with the LCA impact categories (as discussed in Section 4.1. above). Only three farm management characteristics, namely number of litters per sow per year, lactation length and number of finishers sold for slaughter correlated with both LCA and KPI results.
A longer lactation resulted in a higher AP (rs = 0.45) and MEP (rs = 0.69) and at the same time higher genetic diversity scores (rs = 0.45; Table 6). A longer lactation period results in fewer litters per sow per year, which explains why both lactation length and number of litters per sow per year were correlated in the same direction. The effect of improved productivity on the LCA impacts has already been described above. Our explanation for the correlation between a longer lactation period and genetic diversity scores is that organic farms are required to have a lactation length of at least 40 days (Council Directives 2007/834/EC and 2008/889/EC) and at the same time they have to implement several measures regarding genetic diversity, e.g., not allowed to feed GMO feed, must not use chemical pesticides and have to provide ecological focus areas. Such measures highly contribute to the subtheme genetic diversity (Table 2), whereas species diversity and ecosystem diversity can also be improved by other measures (e.g., cultivation of leguminous or leguminous grassland, forest) and therefore the link with longer lactation length was not confirmed statistically through a significant correlation.
Nevertheless, lactation length is a farm management decision, which reflects the intensity of a pig farm and thus partly confirmed our hypothesis that farms managed on a high productivity and efficiency level might also manage their fields more intensively, which might be less effective concerning biodiversity measures. However, it has to be kept in mind that this relationship was only found with genetic diversity, and the underlying reasons may be likely due to the effect of the organic regulations on both topics.

4.4. Correlation between LCA and Biodiversity Results

Against our hypothesis, no correlations were found between environmental impacts from the LCA and any of the biodiversity subthemes (ecosystem, species and genetic diversity) or the overall biodiversity theme scores (Supplementary Material Table S8). This shows that farms with a more intensive pig production system and therefore lower LCA impacts (Table 6) do not necessarily differ from less intensive farms in terms of their field management to promote biodiversity. This can be explained by the fact that many KPIs not only address ecosystem services, e.g., ecological focus areas, but also equally important other field management aspects (e.g., application of fertiliser based on plant or soil analysis). In summary, good management of the pig farm and the associated crop production leads to a reduction of negative and an enhancement of positive environmental impacts.
This clearly emphasises the need to assess environmental sustainability and provide feedback (e.g., in form of benchmarking with peers) to farmers on their farm-specific performance based on both LCA and KPI assessment. Indeed, this was the intention of the SusPigSys project. Farm-specific LCA results, however, should always be provided with information about the main (emission and resource use) sources, in order that farmers can see where the majority of impacts come from (e.g., feed, mortality, electricity) and how they can improve their LCA results [56]. This is needed, since to the non-specialists, LCA results are complex, so that farmers may not understand the underlying calculations and sources. Making farmers aware of where resources are being wasted is not only important from an environmental point of view, but also critical from an economical point of view [57]. Such analysis might therefore serve as incentives for improvements to reduce losses and improve efficiency in the short term, whereas bigger investments (e.g., covering slurry tanks to reduce emissions) may need financial support or incentives (subsidies) from government. Similar, since the benefits of an ecological intensification (e.g., natural pest control) may only be reaped in the long-term, financial support (subsidies) of biodiversity measures and regulatory instruments are complementary pathways to accelerate an ecological intensification [52].

4.5. Uncertainity and Other Limitations

Performing LCA and KPI assessments also give rise to a degree of uncertainty in the results. One strengths of the present study presents the use of primary data collected on farm, whenever available. However, this was not possible for all data. For example, we did not calculate the N-balance based on farm-specific data, since we rarely obtained data on feed quality (e.g., on crude protein content). Also, data about the origin and therefore the yield of bought-in feed components were missing on most farms, which also forced us to use default values. Furthermore, LCA impact categories such as toxicity were not included in the present study due to missing and a high uncertainty in LCA back-ground data sets.
Uncertainty in the KPI assessment derived mainly through scaling of indicators and the weighing procedure (Delph-like approach) that was used to aggregate the KPIs on theme level. This uncertainty was addressed in the study of [58], who found that the variability of weights given for theme biodiversity was intermediate. Due to similar use of the Delphi-like approach, uncertainty introduced by subjective expert weights in the current study is expected to be similar to that in [58].
Nevertheless, we suggest to include an uncertainty analysis for both LCA and KPI assessment, in the further development of the SusPigSys tool.

5. Conclusions

Our comprehensive approach to evaluate the environmental performance of diverse European pig farms through combining LCA and KPI assessment showed that the two methods complement and can therefore not replace each other. The LCA gives insights into each farms’ contribution to highly discussed topics such as (fossil) energy demand, global warming, acidification and eutrophication potential. KPI assessment on the other hand supplements the analysis regarding impacts on a local, but no less relevant topic, namely biodiversity based on the farms’ field management. Since no correlations between LCA and biodiversity results were found, it is possible to perform well in both LCA and KPI assessments. The LCA and KPI assessment results showed that variation within farm types was larger than across farm types, indicating that there is still a potential to improve environmental sustainability regardless of the farm type. The farm-specific results serve as a hot-spot analysis for farmers and demonstrate that enhancing farm and field management is crucial to simultaneously reduce environmental impacts and promote biodiversity in European pig production.

Supplementary Materials

The following are available online at https://www.mdpi.com/article/10.3390/su132011230/s1, Table S1: Abbreviations, Table S2: Farm-specific primary (foreground) data used for LCA calculations, Table S3: Composition of compound feed, Table S4: Impact factors of bought-in feed components, Table S5: Impact factors of bought-in compound feed, Table S6: Characteristics of the agricultural fields managed by the pig farmers, Table S7: Scaled Key-Performance-Indicators, Table S8: Spearman correlations (rs) between environmental impacts calculated using LCA (rows) and the biodiversity theme and its three subthemes (ecosystem, species and genetic diversity; columns) for breeding units and finishing units of crop-livestock farms.

Author Contributions

Conceptualization, A.K.R., C.L. and S.H.; Data curation, A.K.R., S.D., N.D. and J.H.; Formal analysis, A.K.R. and S.H.; Funding acquisition, S.D., M.G., J.G., C.L., H.V. and S.H.; Investigation, A.K.R., M.G., J.H. and H.V.; Methodology, A.K.R., S.D. and S.H.; Project administration, S.D. and C.L.; Software, A.K.R. and S.H.; Supervision, S.D., C.L. and S.H.; Validation, A.K.R. and N.D.; Visualization, A.K.R.; Writing—original draft, A.K.R. and S.H.; Writing—review & editing, S.D., N.D., M.G., J.G., J.H., S.H., C.L., A.K.R. and H.V. All authors have read and agreed to the published version of the manuscript.

Funding

This research was made possible by funding from SusAn, an ERA-Net co-funded under European Union’s Horizon 2020 research and innovation programme (www.era-susan.eu, accessed on 1 October 2021), under Grant Agreement n°696231.

Institutional Review Board Statement

Ethical review and approval were waived for this study, because farmer participation was informed and voluntary, and animal observations were non-invasive. Farmers were interviewed during farm visits, and farmers and other stakeholders took part in workshops. All participation was voluntary, and participants could choose to end the interview/ visit/ workshop at any time. Participants were made clearly aware of the aims and contents of workshops and farm visits, and informed according to GDPR. All data were anonymised before storage on European servers. Only the national contact person knew the identity of a farm. During farm assessment, pigs were scored for validated animal-based indicators in their home pens. Only non-invasive animal-based measures were used. Observers were experienced with pigs and instructed to behave in a calm manner around the pigs. Observations in a group of pigs were cancelled, if it became apparent that the group was stressed or agitated by the presence of the observer.

Informed Consent Statement

Informed consent was obtained from all subjects involved in the study.

Data Availability Statement

The data presented in this study are available on request from the corresponding author. The data are not publicly available due to privacy reasons.

Acknowledgments

Direct observation data were collected by Juliane Helmerichs (in DE, IT, NL and UK) and Antonia Ruckli (in AT, FI and PL). Interview data were collected by Rachel Chapman (UK), Paolo Ferrari (IT), Monika Gebska and Agata Malak-Rawlikowska (PL), Juliane Helmerichs (DE), Antonia Ruckli (AT), Kirsi Swan (FI), and Herman Vermeer (NL).

Conflicts of Interest

The authors declare no conflict of interest. The funders had no role in the design of the study, nor in the collection, analyses, or interpretation of data, nor in the writing of the manuscript or in the decision to publish the results.

References

  1. Brundtland, G.H. Our Common Future: (“The Brundtland Report”): World Commission on Environment and Development; United Nations: Oslo, Norway, 1987. [Google Scholar]
  2. European Union. Farm to Fork Strategy. For a Fair, Healthy and Environmentally-Friendly Food System. 2020. Available online: https://ec.europa.eu/food/system/files/2020-05/f2f_action-plan_2020_strategy-info_en.pdf (accessed on 11 October 2021).
  3. Gerber, P.J.; Steinfeld, H.; Henderson, B.; Mottet, A.; Opio, C.; Dijkman, J.; Falcucci, A.; Tempio, G. Tackling Climate Change through Livestock: A Global Assessment of Emissions and Mitigation Opportunities; Food and Agriculture Organization of the United Nations (FAO): Rome, Italy, 2013. [Google Scholar]
  4. OECD/FAO. OECD-FAO Agricultural Outlook 2020–2029; FAO: Rome, Italy; OECD Publishing: Paris, France, 2020. [Google Scholar] [CrossRef]
  5. Mbow, H.-O.P.; Reisinger, A.; Canadell, J.; O’Brien, P. Special Report on Climate Change, Desertification, Land Degradation, Sustainable Land Management, Food Security, and Greenhouse Gas Fluxes in Terrestrial Ecosystems (SR2); IPCC: Geneva, Switzerland, 2017. [Google Scholar]
  6. de Vries, M.; de Boer, I.J.M. Comparing environmental impacts for livestock products: A review of life cycle assessments. Livest. Sci. 2010, 128, 1–11. [Google Scholar] [CrossRef]
  7. McAuliffe, G.A.; Takahashi, T.; Mogensen, L.; Hermansen, J.E.; Sage, C.L.; Chapman, D.V.; Lee, M.R.F. Environmental trade-offs of pig production systems under varied operational efficiencies. J. Clean. Prod. 2017, 165, 1163–1173. [Google Scholar] [CrossRef]
  8. Reckmann, K.; Krieter, J. Environmental impacts of the pork supply chain with regard to farm performance. J. Agric. Sci. 2015, 153, 411–421. [Google Scholar] [CrossRef]
  9. Nguyen, T.L.T.; Hermansen, J.E.; Mogensen, L. Fossil energy and GHG saving potentials of pig farming in the EU. Energy Policy 2010, 38, 2561–2571. [Google Scholar] [CrossRef]
  10. Monteiro, A.; Garcia-Launay, F.; Brossard, L.; Wilfart, A.; Dourmad, J.-Y. Effect of feeding strategy on environmental impacts of pig fattening in different contexts of production: Evaluation through life cycle assessment. J. Anim. Sci. 2016, 94, 4832–4847. [Google Scholar] [CrossRef] [PubMed]
  11. Monteiro, A.N.T.R.; Dourmad, J.-Y.; Fachinello, M.R.; Diaz-Huepa, L.M.; Sitanaka, N.Y.; Partyka, A.V.S.; Pozza, P.C. Effect of observed individual data of performance and excretion on life cycle assessment of piglets. Sci. Agric. 2019, 76, 102–111. [Google Scholar] [CrossRef] [Green Version]
  12. Reckmann, K.; Blank, R.; Traulsen, I.; Krieter, J. Comparative life cycle assessment (LCA) of pork using different protein sources in pig feed. Arch. Anim. Breed. 2016, 59, 27–36. [Google Scholar] [CrossRef] [Green Version]
  13. Kok, A.; de Olde, E.M.; de Boer, I.J.M.; Ripoll-Bosch, R. European biodiversity assessments in livestock science: A review of research characteristics and indicators. Ecol. Indic. 2020, 112. [Google Scholar] [CrossRef]
  14. Steffen, W.; Richardson, K.; Rockstrom, J.; Cornell, S.E.; Fetzer, I.; Bennett, E.M.; Biggs, R.; Carpenter, S.R.; de Vries, W.; de Wit, C.A.; et al. Sustainability. Planetary boundaries: Guiding human development on a changing planet. Science 2015, 347, 6223. [Google Scholar] [CrossRef] [Green Version]
  15. Cardinale, B.J.; Duffy, J.E.; Gonzalez, A.; Hooper, D.U.; Perrings, C.; Venail, P.; Narwani, A.; Mace, G.M.; Tilman, D.; Wardle, D.A.; et al. Biodiversity loss and its impact on humanity. Nature 2012, 486, 59–67. [Google Scholar] [CrossRef]
  16. Schader, C.; Baumgart, L.; Landert, J.; Muller, A.; Ssebunya, B.; Blockeel, J.; Weisshaidinger, R.; Petrasek, R.; Mészáros, D.; Padel, S.; et al. Using the Sustainability Monitoring and Assessment Routine (SMART) for the Systematic Analysis of Trade-Offs and Synergies between Sustainability Dimensions and Themes at Farm Level. Sustainability 2016, 8, 274. [Google Scholar] [CrossRef] [Green Version]
  17. Food and Agriculture Organisation (FAO). Sustainability Assessment of Food and Agriculture Systems (SAFA): Indicators. Available online: http://www.fao.org/fileadmin/templates/nr/sustainability_pathways/docs/SAFA_Indicators_final_19122013.pdf (accessed on 17 June 2021).
  18. Grenz, J.; Thalmann, C.; Stämpfli, A.; Studer, C.; Häni, F. RISE—A method for assessing the sustainability of agricultural production at farm level. Rural Dev. News 2009, 1, 5–9. [Google Scholar]
  19. Cammarata, M.; Timpanaro, G.; Scuderi, A. Assessing Sustainability of Organic Livestock Farming in Sicily: A Case Study Using the FAO SAFA Framework. Agriculture 2021, 11, 274. [Google Scholar] [CrossRef]
  20. Gayatri, S.; Gasso-tortajada, V.; Vaarst, M. Assessing Sustainability of Smallholder Beef Cattle Farming in Indonesia: A Case Study Using the FAO SAFA Framework. J. Sustain. Dev. 2016, 9, 236. [Google Scholar] [CrossRef]
  21. Ssebunya, B.R.; Schader, C.; Baumgart, L.; Landert, J.; Altenbuchner, C.; Schmid, E.; Stolze, M. Sustainability Performance of Certified and Non-certified Smallholder Coffee Farms in Uganda. Ecol. Econ. 2019, 156, 35–47. [Google Scholar] [CrossRef]
  22. The SusPigSys Team. Condensed Protocol from Era-Net SusAn Project “Sustainable Pig Production Systems” (SusPigSys)—A Starting Point for Connecting Data Bases for Integrated Sustainability Assessment. 2020. Available online: https://www.researchgate.net/publication/348466379_Condensed_protocol_from_Era-Net_SusAn_project_Sustainable_pig_production_systems_SusPigSys (accessed on 11 October 2021). [CrossRef]
  23. Dourmad, J.Y.; Ryschawy, J.; Trousson, T.; Bonneau, M.; Gonzalez, J.; Houwers, H.W.J.; Hviid, M.; Zimmer, C.; Nguyen, T.L.T.; Morgensen, L. Evaluating environmental impacts of contrasting pig farming systems with life cycle assessment. Animal 2014, 8, 2027–2037. [Google Scholar] [CrossRef] [Green Version]
  24. Rudolph, G.; Hörtenhuber, S.; Bochicchio, D.; Butler, G.; Brandhofer, R.; Dippel, S.; Dourmad, J.; Edwards, S.; Früh, B.; Meier, M. Effect of Three Husbandry Systems on Environmental Impact of Organic Pigs. Sustainability 2018, 10, 3796. [Google Scholar] [CrossRef] [Green Version]
  25. ISO. Life Cycle Assessment—Principles and Framework, EN ISO 14040:2006; European Committee for Standardization: Brussels, Belgium, 2006; Available online: https://www.iso.org/standard/37456.html (accessed on 11 October 2021).
  26. Agroscope Liebefeld Posieux. FEEDBASE—The Swiss Feed Database. Available online: https://www.feedbase.ch/ (accessed on 7 October 2020).
  27. EMEP EEA. EMEP/EEA Air Pollutant Emission Inventory Guidebook 2016. Technical Guidance to Prepare National Emission Inventories. Available online: https://www.eea.europa.eu/publications/emep-eea-guidebook-2016 (accessed on 10 October 2020).
  28. Wernet, G.; Bauer, C.; Steubing, B.; Reinhard, J.; Moreno-Ruiz, E.; Weidema, B. The ecoinvent database version 3 (part I): Overview and methodology. Int. J. Life Cycle Assess. 2016, 21, 1218–1230. [Google Scholar] [CrossRef]
  29. BSI. PAS 2050 Research Report. Available online: https://shop.bsigroup.com/upload/Shop/Download/PAS/PAS2050-Research-ReportHelius.pdf (accessed on 7 October 2020).
  30. Koch, P.; Salou, T. AGRIBALYSE®: Rapport Méthodologique—Version 1.2. 2015, p. 393. Available online: https://www.ademe.fr/sites/default/files/assets/documents/agribalyse-methodology-v1_2.pdf (accessed on 11 October 2021).
  31. Durlinger, B.; Koukouna, E.; Broekema, R.; van Paassen, M.; Scholten, J. Agri-Footprint 4.0—Part 2: Description of Data. 2017. Available online: https://simapro.com/wp-content/uploads/2018/02/Agri-Footprint-4.0-Part-2-Description-of-data.pdf (accessed on 11 October 2021).
  32. Durlinger, B.; Koukouna, E.; Broekema, R.; Van Paassen, M.; Scholten, J. Agri-Footprint 4.0—Part 1: Methodology and Basic Principles. 2017. Available online: https://www.agri-footprint.com/wp-content/uploads/2018/03/Agri-Footprint-4.0-Part-1-Methodology-and-basic-principles-2018.pdf (accessed on 11 October 2021).
  33. IPCC. 2006 IPCC guidelines for national greenhouse gas inventories. In Prepared by the National Greenhouse Gas Inventories Programme; Eggleston, H.S., Buendia, L., Miwa, K., Ngara, T., Tanabe, K., Eds.; Institute for Global Environmental Strategies Hayama: Hayama, Japan, 2006; Volume 5, Available online: https://www.ipcc-nggip.iges.or.jp/public/2006gl/ (accessed on 11 October 2021).
  34. Food and Agriculture Organisation (FAO). Free and Open Access SAFA Tool 2.2.40. Available online: http://www.fao.org/nr/sustainability/sustainability-assessments-safa/safa-tool/en/ (accessed on 21 September 2020).
  35. Mukherjee, N.; Hugé, J.; Sutherland, W.J.; McNeill, J.; Van Opstal, M.; Dahdouh-Guebas, F.; Koedam, N.; Anderson, B. The Delphi technique in ecology and biological conservation: Applications and guidelines. Methods Ecol. Evol. 2015, 6, 1097–1109. [Google Scholar] [CrossRef] [Green Version]
  36. Averos, X.; Aparicio, M.A.; Ferrari, P.; Guy, J.H.; Hubbard, C.; Schmid, O.; Ilieski, V.; Spoolder, H.A. The Effect of Steps to Promote Higher Levels of Farm Animal Welfare across the EU. Societal versus Animal Scientists’ Perceptions of Animal Welfare. Animals 2013, 3, 786–807. [Google Scholar] [CrossRef]
  37. Hörtenhuber, S.; Kasperczyk, N.; Ruckli, A.K. Deliverable 4.5: Report on SusPigSys Toolbox for Integrative System Analysis. 2021. Available online: https://www.era-susan.eu/sites/default/files/SusPigSys_D4-5_Toolbox.pdf (accessed on 11 October 2021). [CrossRef]
  38. SAS Institute Inc. SAS, 9.4; SAS Institute Inc.: Cary, NC, USA, 2016; Available online: https://support.sas.com/software/94/ (accessed on 11 October 2021).
  39. Noya, I.; Villanueva-Rey, P.; González-García, S.; Fernandez, M.D.; Rodriguez, M.R.; Moreira, M.T. Life Cycle Assessment of pig production: A case study in Galicia. J. Clean. Prod. 2017, 142, 4327–4338. [Google Scholar] [CrossRef]
  40. García-Gudiño, J.; Monteiro, A.N.T.R.; Espagnol, S.; Blanco-Penedo, I.; Garcia-Launay, F. Life Cycle Assessment of Iberian Traditional Pig Production System in Spain. Sustainability 2020, 12, 627. [Google Scholar] [CrossRef] [Green Version]
  41. Pexas, G.; Mackenzie, S.G.; Wallace, M.; Kyriazakis, I. Environmental impacts of housing conditions and manure management in European pig production systems through a life cycle perspective: A case study in Denmark. J. Clean. Prod. 2020, 253. [Google Scholar] [CrossRef]
  42. Reckmann, K.; Traulsen, I.; Krieter, J. Environmental Impact Assessment--methodology with special emphasis on European pork production. J. Env. Manag. 2012, 107, 102–109. [Google Scholar] [CrossRef] [PubMed]
  43. McGlone, J.J. Farm animal welfare in the context of other society issues: Toward sustainable systems. Livest. Prod. Sci. 2001, 72, 75–81. [Google Scholar] [CrossRef]
  44. Campbell, J.M.; Crenshaw, J.D.; Polo, J. The biological stress of early weaned piglets. J. Anim. Sci. Biotechnol. 2013, 4, 19. [Google Scholar] [CrossRef] [Green Version]
  45. Curran, M.; Lazzarini, G.; Baumgart, L.; Gabel, V.; Blockeel, J.; Epple, R.; Stolze, M.; Schader, C. Representative Farm-Based Sustainability Assessment of the Organic Sector in Switzerland Using the SMART-Farm Tool. Front. Sustain. Food Syst. 2020, 4, 208. [Google Scholar] [CrossRef]
  46. Aschwanden, J.; Holzgang, O.; Jenni, L. Importance of ecological compensation areas for small mammals in intensively farmed areas. Wildl. Biol. 2007, 13, 150–158. [Google Scholar] [CrossRef] [Green Version]
  47. Diacono, M.; Rubino, P.; Montemurro, F. Precision nitrogen management of wheat. A review. Agron. Sustain. Dev. 2012, 33, 219–241. [Google Scholar] [CrossRef]
  48. United Nations. SDG 15—Protect, Restore and Promote Sustainable Use of Terrestrial Ecosystems, Sustainably Manage Forests, Combat Desertification, and Halt and Reverse Land Degradation and Halt Biodiversity Loss. Available online: https://sdgs.un.org/goals/goal15 (accessed on 18 September 2021).
  49. Kirchweger, S.; Clough, Y.; Kapfer, M.; Steffan-Dewenter, I.; Kantelhardt, J. Do improved pollination services outweigh farm-economic disadvantages of working in small-structured agricultural landscapes?—Development and application of a bio-economic model. Ecol. Econ. 2020, 169, 106535. [Google Scholar] [CrossRef]
  50. Bartomeus, I.; Potts, S.G.; Steffan-Dewenter, I.; Vaissiere, B.E.; Woyciechowski, M.; Krewenka, K.M.; Tscheulin, T.; Roberts, S.P.; Szentgyorgyi, H.; Westphal, C.; et al. Contribution of insect pollinators to crop yield and quality varies with agricultural intensification. PeerJ 2014, 2, e328. [Google Scholar] [CrossRef] [Green Version]
  51. Beckmann, M.; Gerstner, K.; Akin-Fajiye, M.; Ceausu, S.; Kambach, S.; Kinlock, N.L.; Phillips, H.R.P.; Verhagen, W.; Gurevitch, J.; Klotz, S.; et al. Conventional land-use intensification reduces species richness and increases production: A global meta-analysis. Glob. Chang. Biol. 2019, 25, 1941–1956. [Google Scholar] [CrossRef]
  52. Kleijn, D.; Bommarco, R.; Fijen, T.P.M.; Garibaldi, L.A.; Potts, S.G.; van der Putten, W.H. Ecological Intensification: Bridging the Gap between Science and Practice. Trends Ecol. Evol. 2019, 34, 154–166. [Google Scholar] [CrossRef] [Green Version]
  53. Richards, D.R.; Warren, P.H.; Maltby, L.; Moggridge, H.L. Awareness of greater numbers of ecosystem services affects preferences for floodplain management. Ecosyst. Serv. 2017, 24, 138–146. [Google Scholar] [CrossRef]
  54. Bockstaller, C.; Lasserre-Joulin, F.; Slezack-Deschaumes, S.; Piutti, S.; Villerd, J.; Amiaud, B.; Plantureux, S. Assessing biodiversity in arable farmland by means of indicators: An overview. Oléagineux Corps Gras Lipides 2011, 18, 137–144. [Google Scholar] [CrossRef] [Green Version]
  55. Lebacq, T.; Baret, P.V.; Stilmant, D. Sustainability indicators for livestock farming. A review. Agron. Sustain. Dev. 2012, 33, 311–327. [Google Scholar] [CrossRef]
  56. Meul, M.; Van Middelaar, C.E.; de Boer, I.J.M.; Van Passel, S.; Fremaut, D.; Haesaert, G. Potential of life cycle assessment to support environmental decision making at commercial dairy farms. Agric. Syst. 2014, 131, 105–115. [Google Scholar] [CrossRef]
  57. Malak-Rawlikowska, A.; Gębska, M.; Hoste, R.; Leeb, C.; Montanari, C.; Wallace, M.; de Roest, K. Developing a Methodology for Aggregated Assessment of the Economic Sustainability of Pig Farms. Energies 2021, 14, 1760. [Google Scholar] [CrossRef]
  58. Schader, C.; Curran, M.; Heidenreich, A.; Landert, J.; Blockeel, J.; Baumgart, L.; Ssebunya, B.; Moakes, S.; Marton, S.; Lazzarini, G.; et al. Accounting for uncertainty in multi-criteria sustainability assessments at the farm level: Improving the robustness of the SMART-Farm Tool. Ecol. Indic. 2019, 106, 105503. [Google Scholar] [CrossRef]
Figure 1. System boundaries for breeding units with land (A + C) or without (A only) for their own feed production and for finishing units with land (B + D) or without (B only) for their own feed production.
Sustainability 13 11230 g001
Figure 2. Median values of relative contribution (%) of bought-in feed, home-grown feed, manure management and electric energy to total amount of Fossil Energy Depletion (FED), Global Warming Potential (GWP), Acidification Potential (AP), Freshwater Eutrophication Potential (FEP) and Marine Eutrophication Potential (MEP) for breeding (n = 40) and finishing units (n = 50).
Sustainability 13 11230 g002
Figure 3. Relative deviation of biodiversity theme score, global warming potential (GWP) and acidification potential (AP) from the respective median of individual finishing farms (n = 21; crop-livestock farms only) included in the study. A value above 0 means “performing better than the average finishing farm (median; higher biodiversity scores, lower GWP and AP)”, whereas a score below 0 means “performing worse than the average (median)”.
Sustainability 13 11230 g003
Table 1. Overview of the 63 farms included in the present study with the production system in brackets (conventional/organic/other labels 1).
Farm TypeATDEFIITNLPLUKTotal
Breeding farms124420013
(1/0/0)(0/0/2)(4/0/0)(0/2/2)(1/0/1)(0/0/0)(0/0/0)
Breeding-to-finishing farms742044623
(1/2/4)(0/0/4)(2/0/0)(0/0/0)(0/2/2)(4/0/0)(1/1/4)
Finishing farms232636127
(1/0/1)(0/0/3)(2/0/0)(0/2/4)(1/0/2)(5/0/1)(0/0/1)
Total109810910763
1 Includes any kind of labels, e.g., GMO-free feeding, higher animal welfare standards than the minimum requirements of the EU.
Table 2. Key Performance Indicators contributing to ecosystem, species and genetic diversity. Possible answers of KPIs are presented with their respective scaling (0%: minimum score = poor performance, 100% maximum score = best performance) in the second row. The three last rows show the respective weights assigned by experts for KPI contributions to the three subthemes.
Key Performance Indicator 1Possible Answers and Scaling (%)Expert Weighting
Ecosystem DiversitySpecies DiversityGenetic Diversity
Cultivating/harvesting crops and/or keeping animals on riparian stripsyes: 00.140.13
no: 100
On-farm cultivation of GMO cropsyes: 00.040.04
no: 100
Feeding GMO cropsyes: 00.040.030.18
no: 100
High precision application of nitrogen (N) fertiliseryes0.040.04
+ based on plant demand: 100
+ not based on plant demand: 50
no
+ based on plant demand: 50
+ not based on plant demand: 0
Amount of nitrogen (N) fertiliser based on demand on soil- or plant analysesyes: 1000.040.03
no: 0
Phosphorous (P) and potassium (K) fertilisers amounts based on the results of soil or plant analysisyes: 1000.040.04
no: 0
Proportion of agricultural land with chemical synthetic pesticides0–100% → 100–0 (linear)0.040.080.15
Average pesticide treatment frequencynever: 1000.020.010.13
one or two times: 50
more than two times: 0
Calculation of humus balances for farmlandyes: 1000.020.04
no: 0
Proportion of arable land with leguminous crops or leguminous grassland0–100% → 0–100 (linear)0.050.1
Proportion of permanent grassland or pasture converted to arable land in the past 20 years>=20–0% → 0–100 (linear)0.080.040.18
Proportion of woodland on farm0–10% → 0–100 (linear)0.10.08
Proportion of woodland deforested and converted to grassland, arable land or buildings in the past 20 years>=10–0% → 0–100 (linear)0.10.03
Proportion of catch crops0–100% → 0–100 (linear)0.050.08
Proportion of ecological focus areas0–>=25% → 0–100 (linear)0.10.080.18
Proportion of agricultural land on drained moorland100–0% → 0–100 (linear)0.10.15
Growing rare or endangered agricultural cropsyes: 100 0.18
no: 0
1 The complete assessment protocol can be found in [22].
Table 3. Farm management characteristics of 63 pig farms in Austria (10 farms), Finland (8), Germany (9), Italy (10), Netherlands (9), United Kingdom (7), and Poland (10).
Breeding FarmsBreeding-to-Finishing FarmsFinishing Farms
Q25MQ75Q25MQ75Q25MQ75
Farms (n)132723
Size
Sows in production (n)29141994658150287
Finishers sold for slaughter (n) 106128675284150040356411
Productivity
Sow replacement rate (%)404350354453
Litters sow−1 y−1 (n)2.22.42.42.12.32.3
Piglets born alive sow−1 y−1 (n)293536242935
Piglets weaned sow−1 y−1 (n)252830212529
Lactation length (d)242828272833
Mortality suckling piglets (%)11.215.116.89.613.416.7
Mortality weaners (%)1.83.03.81.72.94.8
Mortality finishers (%) 1.22.03.01.51.82.3
Live weight at slaughter (kg) 111118122118127168
Daily gain finishers (g day−1) 7008108557808461000
Feed
FCR BU (kg feed kg−1 BM−1)2.83.03.73.03.64.6
FCR FU (kg feed kg−1 BM−1) 2.73.03.72.83.03.8
Home-grown feed BU (% of FW)001102133
Home-grown feed FU (% of FW) 016430020
Bedding, manure management system and electricity
Bedding (kg sow−1 year−1)0138076248
Bedding (kg weaner−1 year−1)00260055
Bedding (kg finisher−1 year−1) 0037005
Solid manure (%) vs liquid BU094402052
Solid manure (%) vs liquid FU 00600031
Electricity (kWh sow−1 year−1)46107194145217348
Electricity (kWh finisher−1 year−1) 7111461013
n = number; M = median, Q25 = lower quartile; Q75 = upper quartile. FCR = feed conversion ratio. BU = breeding unit, FU = finishing unit. BM = body mass, FW = fresh weight.
Table 4. Environmental impacts of 13 breeding, 23 finishing and 27 breeding-to-finishing farms expressed per kg body mass net sold on farm. The results for the breeding and finishing units of breeding-to-finishing farms are presented separately (per kg body mass net sold during breeding and finishing stage, respectively), as well as combined for the whole farm (per kg body mass net sold from piglet to finishing pig).
Unit per kg BMNSBreeding FarmsBreeding-to-Finishing Farmsp
MinQ25MQ75MaxMinQ25MQ75Max
Breeding units (n) 13 27
FEDMJ10.413.615.317.120.08.812.516.120.431.20.45
GWPkg CO2-eq1.912.232.572.783.231.402.242.773.564.780.20
APg SO2-eq28.133.641.051.279.417.539.943.052.5166.10.27
FEPg P-eq0.410.510.590.671.030.320.420.600.831.290.89
MEPg N-eq10.317.120.726.446.88.318.723.632.576.10.24
Finishing FarmsBreeding-to-Finishing Farmsp
Finishing units (n) 23 27
FEDMJ8.411.312.915.921.14.410.613.716.738.10.73
GWPkg CO2-eq1.822.242.933.464.131.642.282.663.065.500.51
APg SO2-eq28.242.648.566.4165.532.138.247.363.194.60.50
FEPg P-eq0.280.470.540.671.040.200.360.500.681.390.60
MEPg N-eq9.513.820.525.347.25.413.719.127.2100.00.91
Breeding-to-Finishing Farmsp
Breeding-to-Finishing farms overall (n) 27
FEDMJ 6.811.313.917.435.1n.a.
GWPkg CO2-eq 1.932.282.673.185.07n.a.
APg SO2-eq 31.336.746.358.896.5n.a.
FEPg P-eq 0.260.390.540.701.24n.a.
MEPg N-eq 10.214.220.630.086.3n.a.
BMNS = body mass net sold; n = number; Min = minimum, Q25 = lower quartile, M = median, Q75 = upper quartile, Max = maximum. FED = fossil energy depletion; GWP = global warming potential; AP = acidification potential; FEP = fresh water eutrophication potential; MEP = marine eutrophication potential. p = p-value results of global Wilcoxon rank sum test. n.a. = not applicable. MJ = megajoule; CO2-eq = carbon dioxide equivalents; SO2-eq = sulphur dioxide equivalents; P-eq = phosphorous equivalents; N-eq = nitrogen equivalents.
Table 5. Comparison of KPI subtheme and theme scores related to the on-farm biodiversity potential of the three farm types: breeding, breeding-to-finishing and finishing farms. Values are between 0% (lowest/worst) and 100% (highest/best value) based on the scaling by experts.
Breeding FarmsBreeding-to-Finishing FarmsFinishing Farmsp
MinQ25MQ75MaxMinQ25MQ75MaxMinQ25MQ75Max
Farms (n) 9 26 21
Subtheme
ED (%)4953566568424855627342535861830.55
SD (%)4749525965344044596835475157770.21
GD (%)7273558811122543685112741640.34
Theme
BD (%)3642515970303538516828374356670.21
ED = ecosystem diversity, SD = species diversity, GD = genetic diversity, BD = biodiversity. n = number; M = median, Q25 = lower quartile; Q75 = upper quartile. p = p-value results of global Kruskal-Wallis test.
Table 6. Spearman correlations (rs) of farm management characteristics (rows) with LCA impacts (columns) and with biodiversity subtheme and theme scores (columns) based on KPI assessment. Correlations with an absolute rs ≥ 0.4 and p-value ≤ 0.5 are shown in bold font.
LCA SubthemeTheme
FEDGWPAPFEPMEPEDSDGDBD
MJCO2-eq.SO2-eq.P-eq.N-eq.%%%%
Breeding units (n)All 40 breeding units35 breeding units of crop-livestock farms35
Sows per farm (n)−0.01−0.14−0.58−0.08−0.42−0.09−0.10−0.25−0.18
Litters sow−1 year−1 (n)0.03−0.07−0.43−0.17−0.36−0.37−0.40−0.42−0.41
Piglets born sow−1 year−1 (n)−0.08−0.22−0.68−0.09−0.54−0.27−0.34−0.30−0.31
Piglets weaned sow−1 year−1 (n)−0.01−0.18−0.630.00−0.47−0.25−0.32−0.32−0.32
Lactation length (n)0.250.320.480.200.690.120.180.450.37
Replacement rate (%)0.04−0.02−0.40−0.090.010.140.110.030.12
Mortality weaners (%)0.060.14−0.020.00−0.150.000.01−0.20−0.15
FCR (kg feed kg−1 BM−1)0.850.900.490.670.70−0.08−0.010.140.10
Home-grown feed (%)−0.010.080.53−0.170.410.030.00−0.04−0.05
Solid manure (%)0.090.120.430.150.330.000.100.320.21
Finishing units (n)All 50 finishing units47 finishing units of crop-livestock farms47
Finishers sold for slaughter (n)−0.11−0.15−0.61−0.03−0.47−0.27−0.27−0.47−0.39
Slaughter weight (kg)0.030.120.280.010.15−0.010.100.120.12
Mortality finishers (%)0.160.33−0.130.12−0.13−0.09−0.06−0.09−0.12
Average daily gain (kg d−1)−0.26−0.14−0.23−0.23−0.030.03−0.05−0.26−0.15
FCR (kg feed kg−1 BM−1)0.720.660.330.500.540.230.280.360.34
Home-grown feed (%)−0.16−0.080.29−0.330.31−0.01−0.06−0.07−0.08
Solid manure (%)0.03−0.160.520.090.22−0.010.030.270.16
FED = Fossil energy depletion, GWP = Global warming potential, AP = Acidification potential, FEP = Fresh water eutrophication potential, MEP = Marine eutrophication potential, ED = Ecosystem diversity, SD = Species diversity, GD = Genetic diversity, BD = Biodiversity. FCR = feed conversion ratio, BM = body mass.
Publisher’s Note: MDPI stays neutral with regard to jurisdictional claims in published maps and institutional affiliations.

