
Epiphytic Cryptogams as Bioindicators of Air Quality in a Tropical Andean City


Abstract
:1. Introduction
2. Materials and Methods
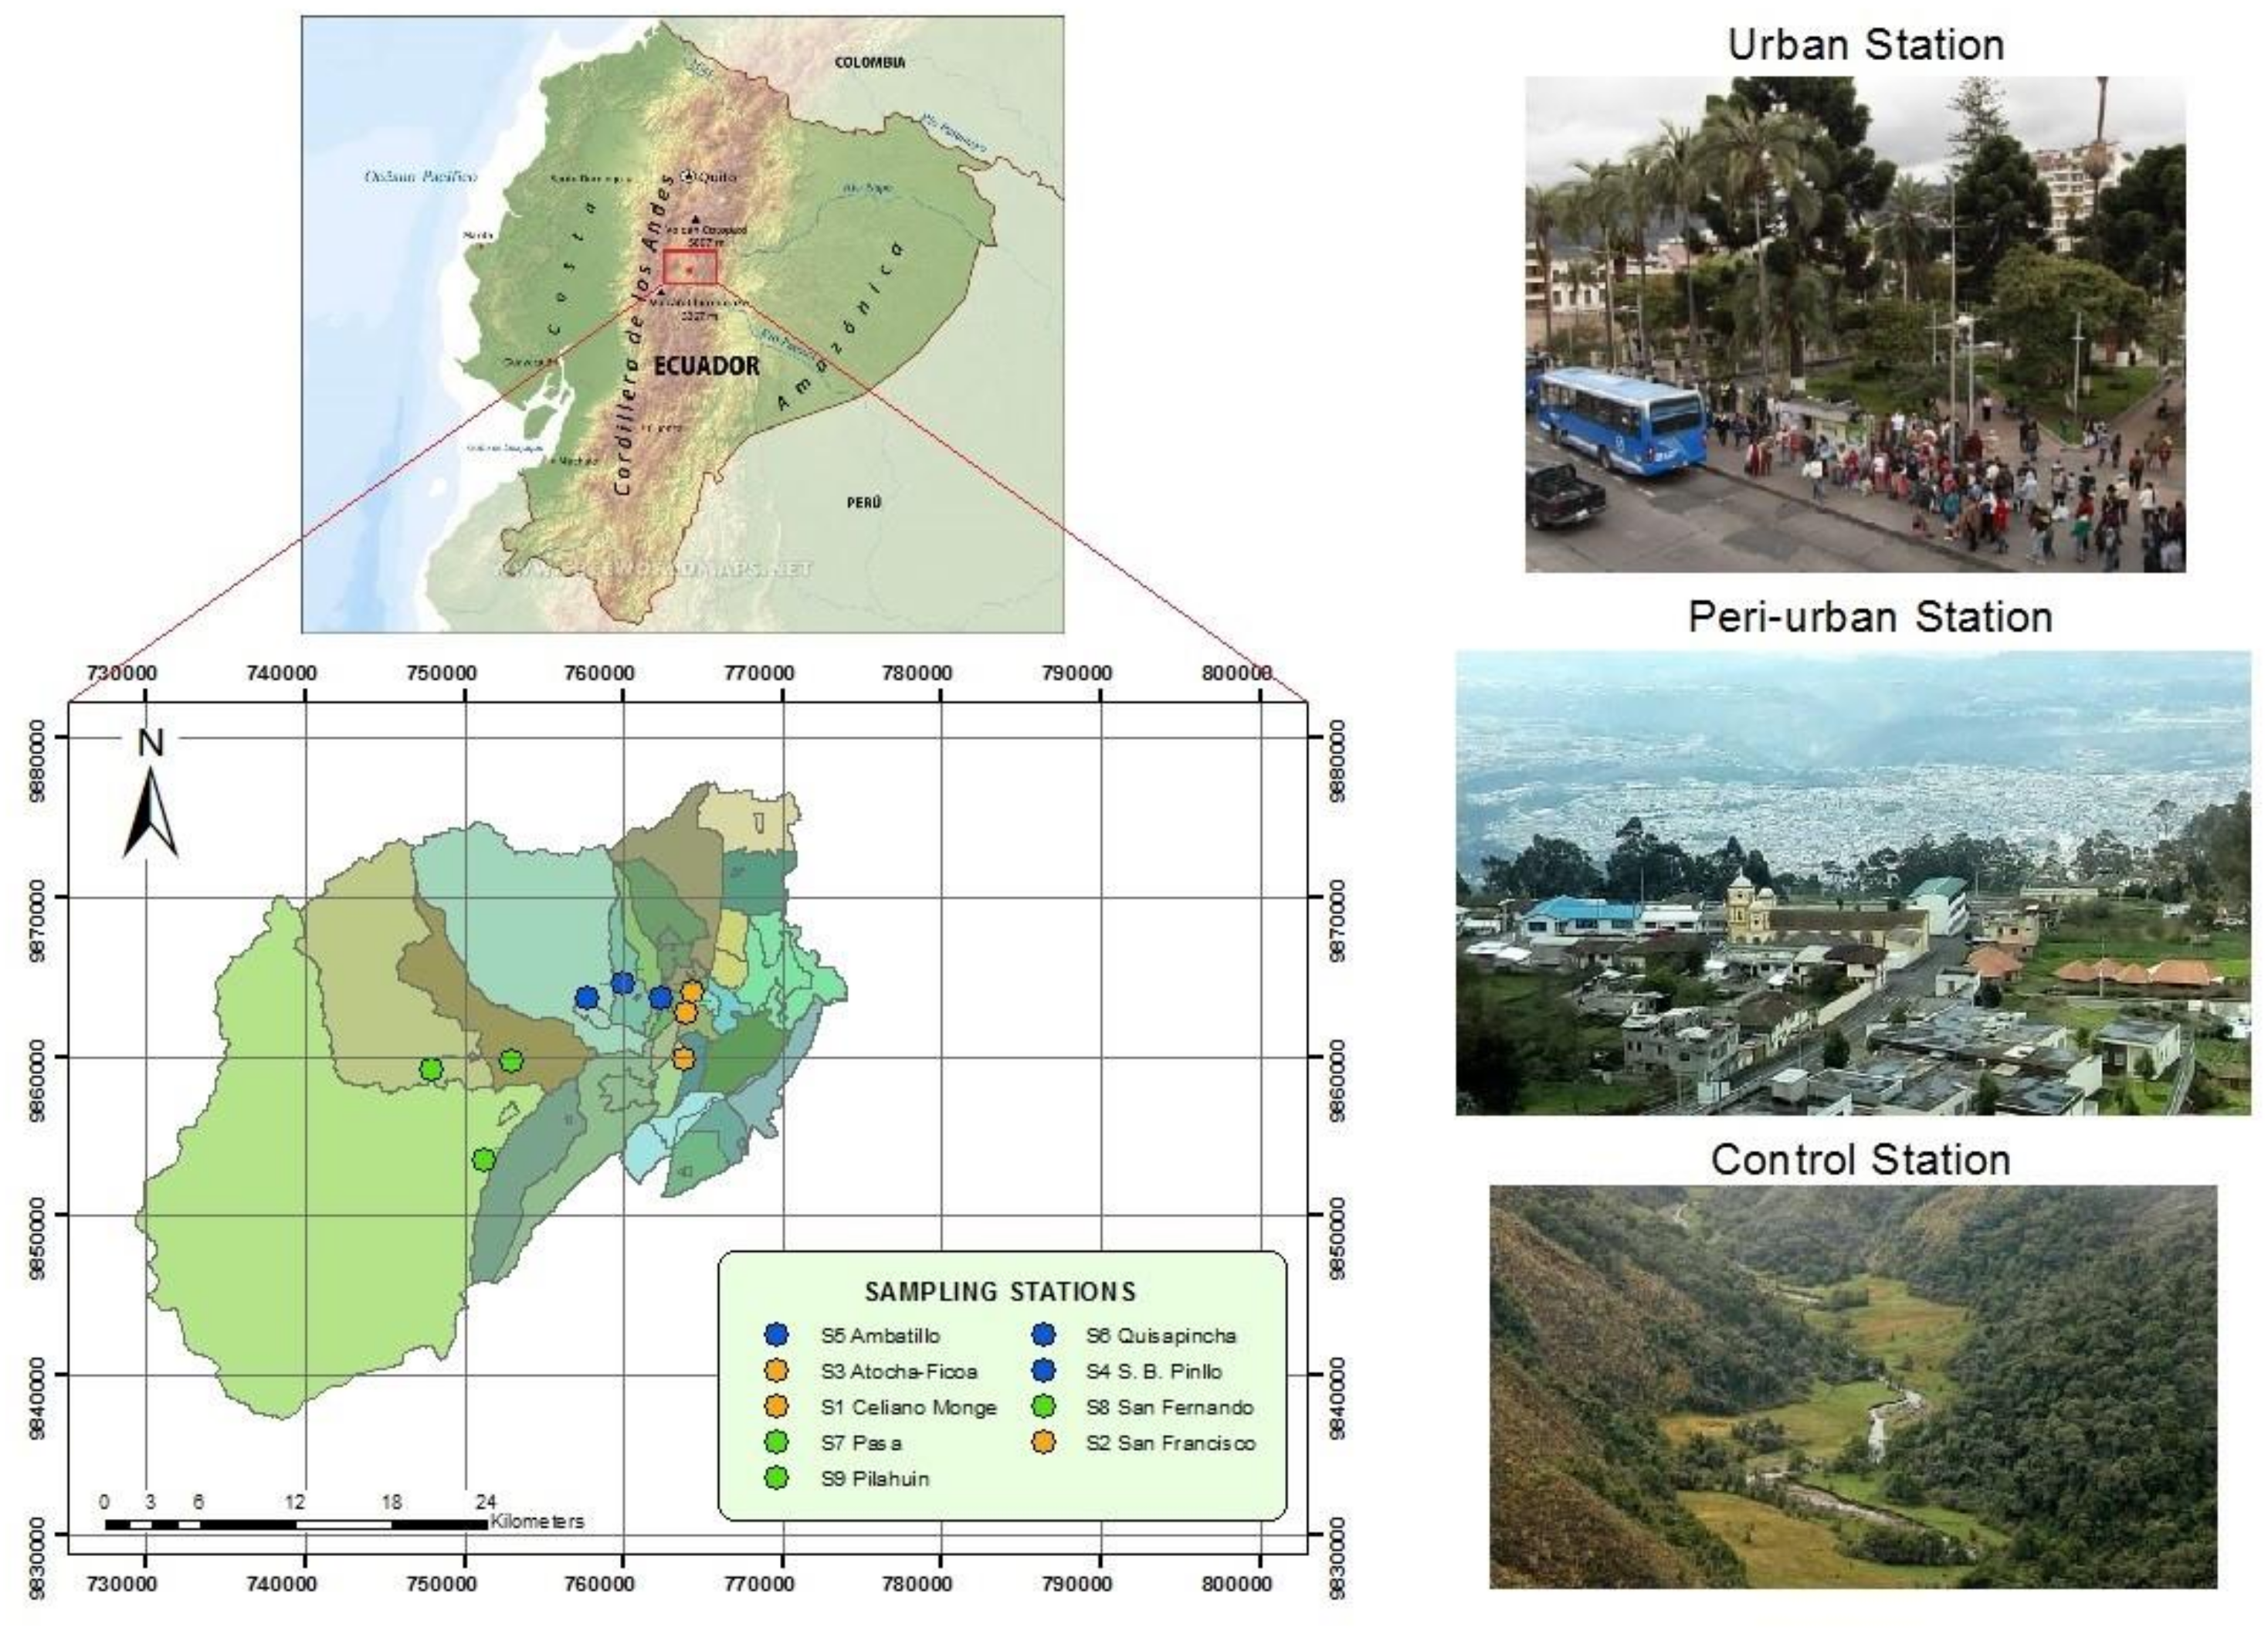
2.1. Study Area
2.2. Design and Data Collection
2.3. Data Analysis
3. Results
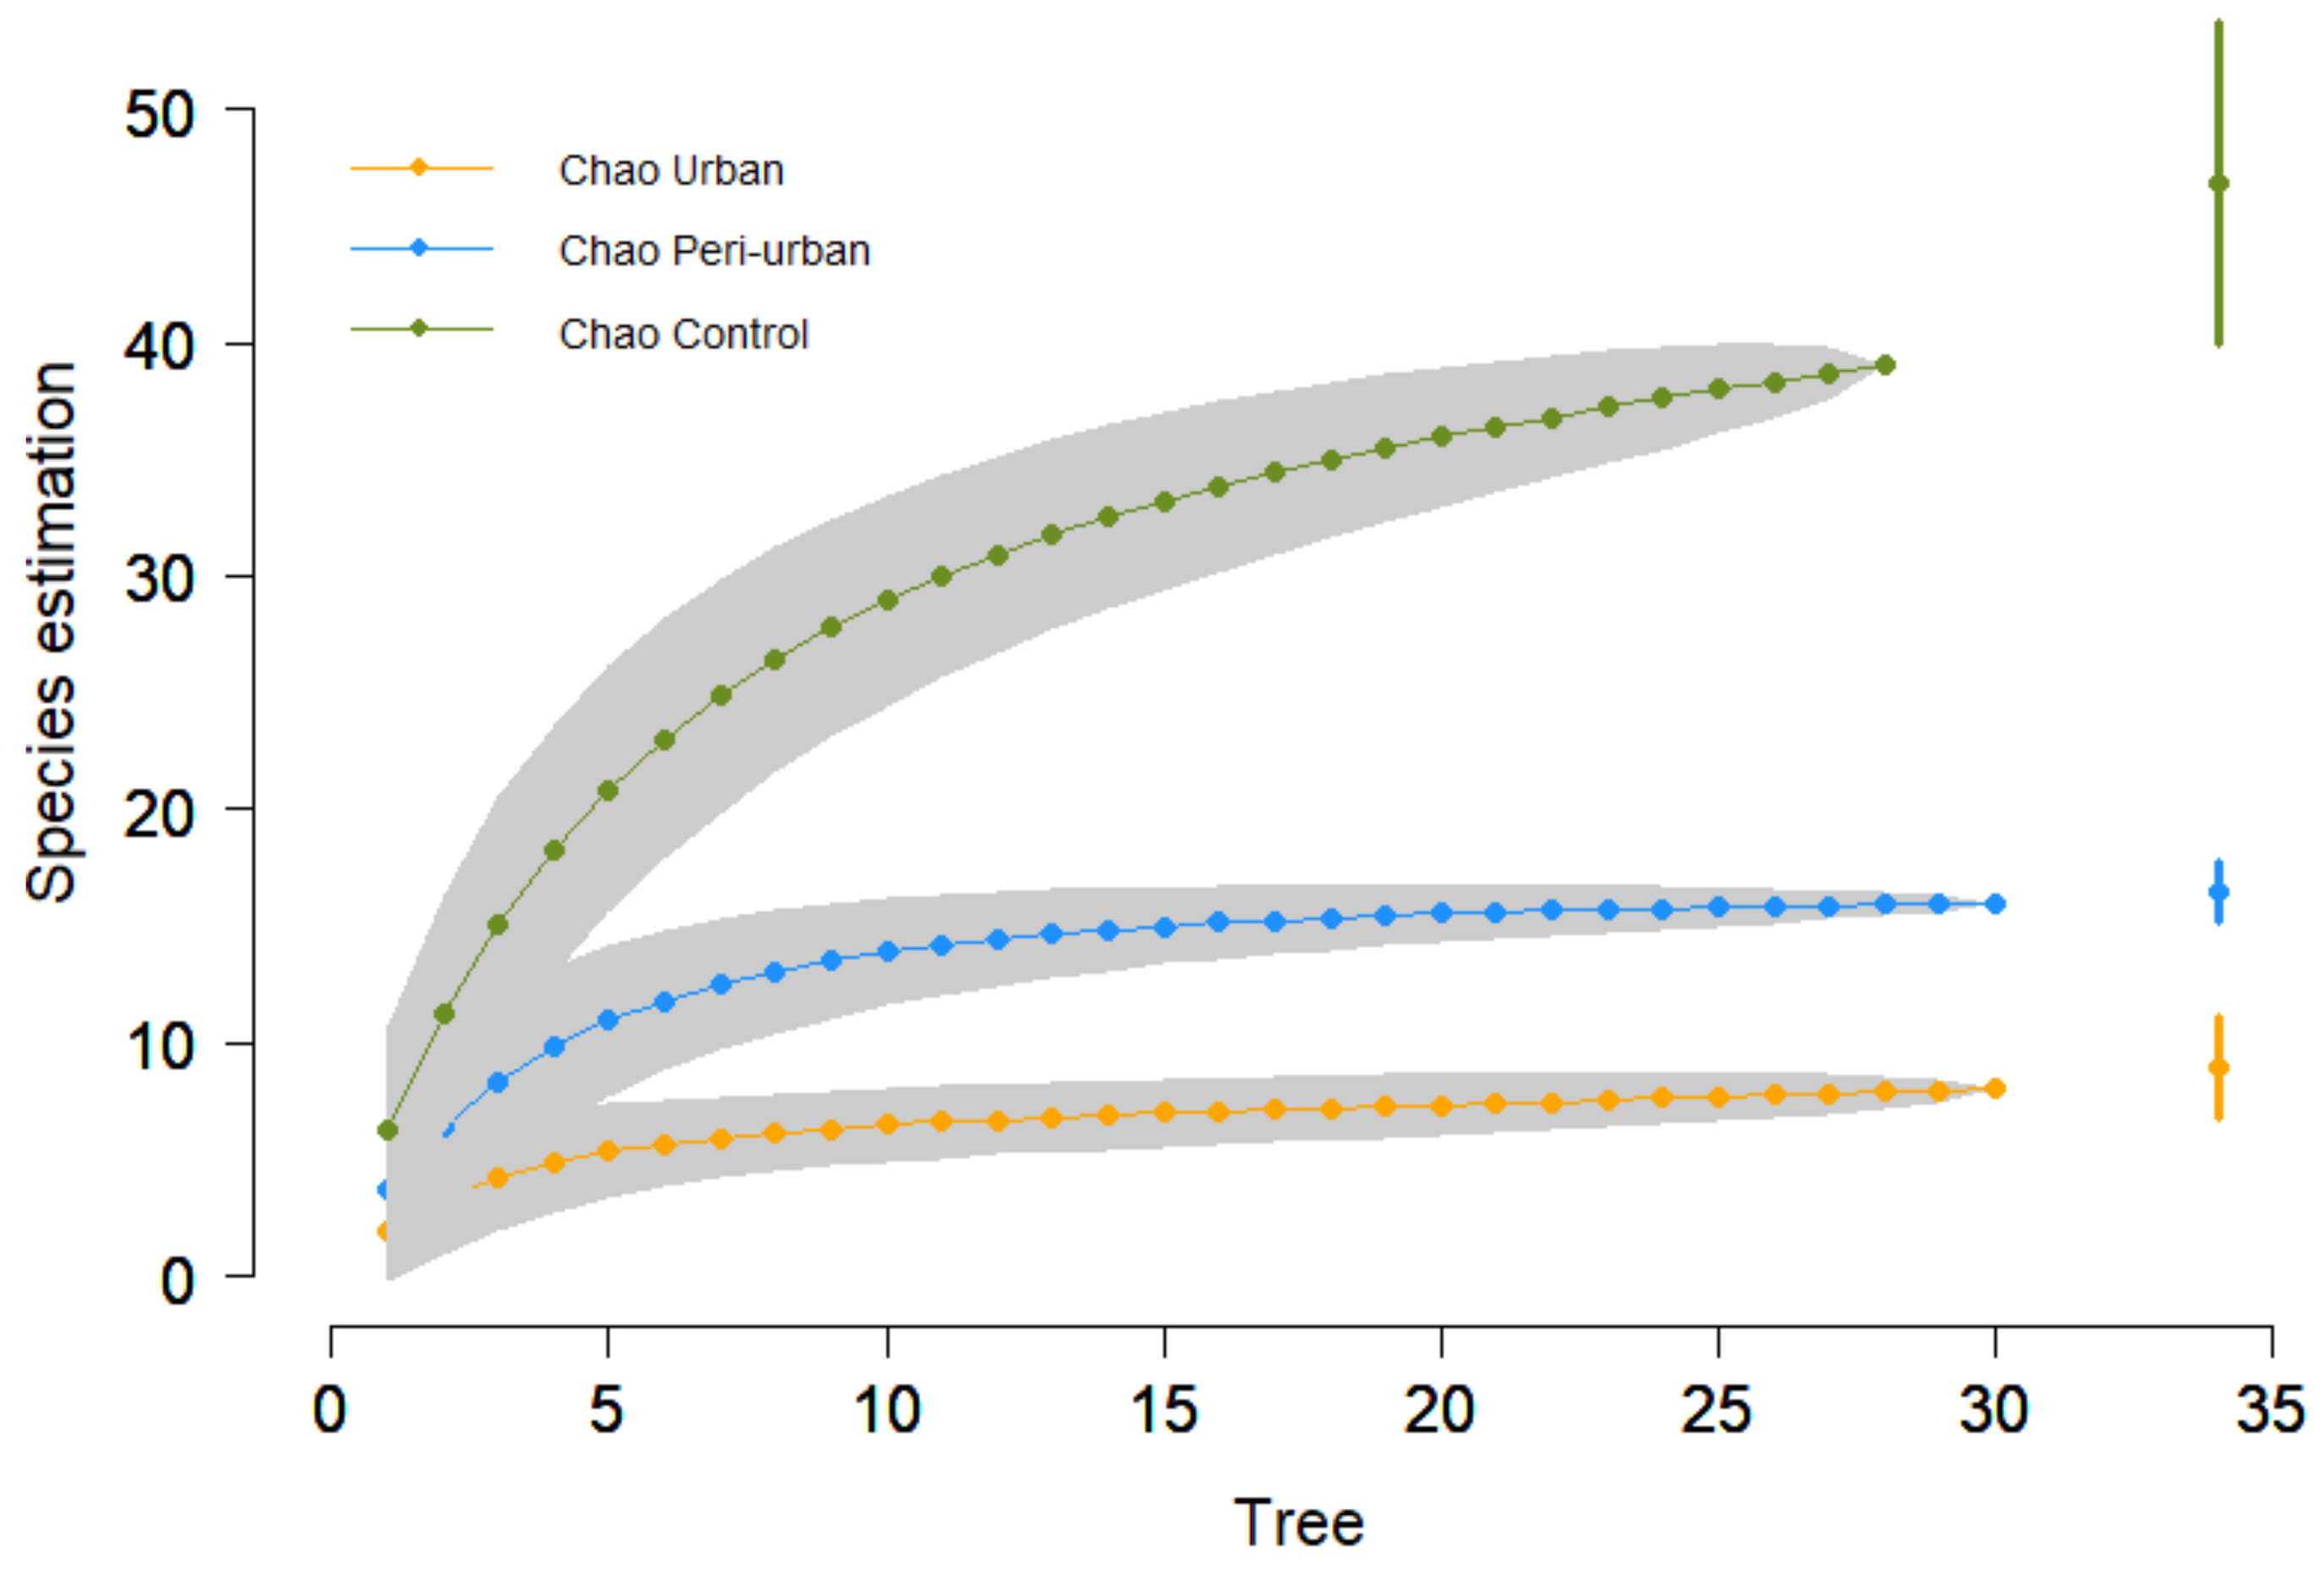
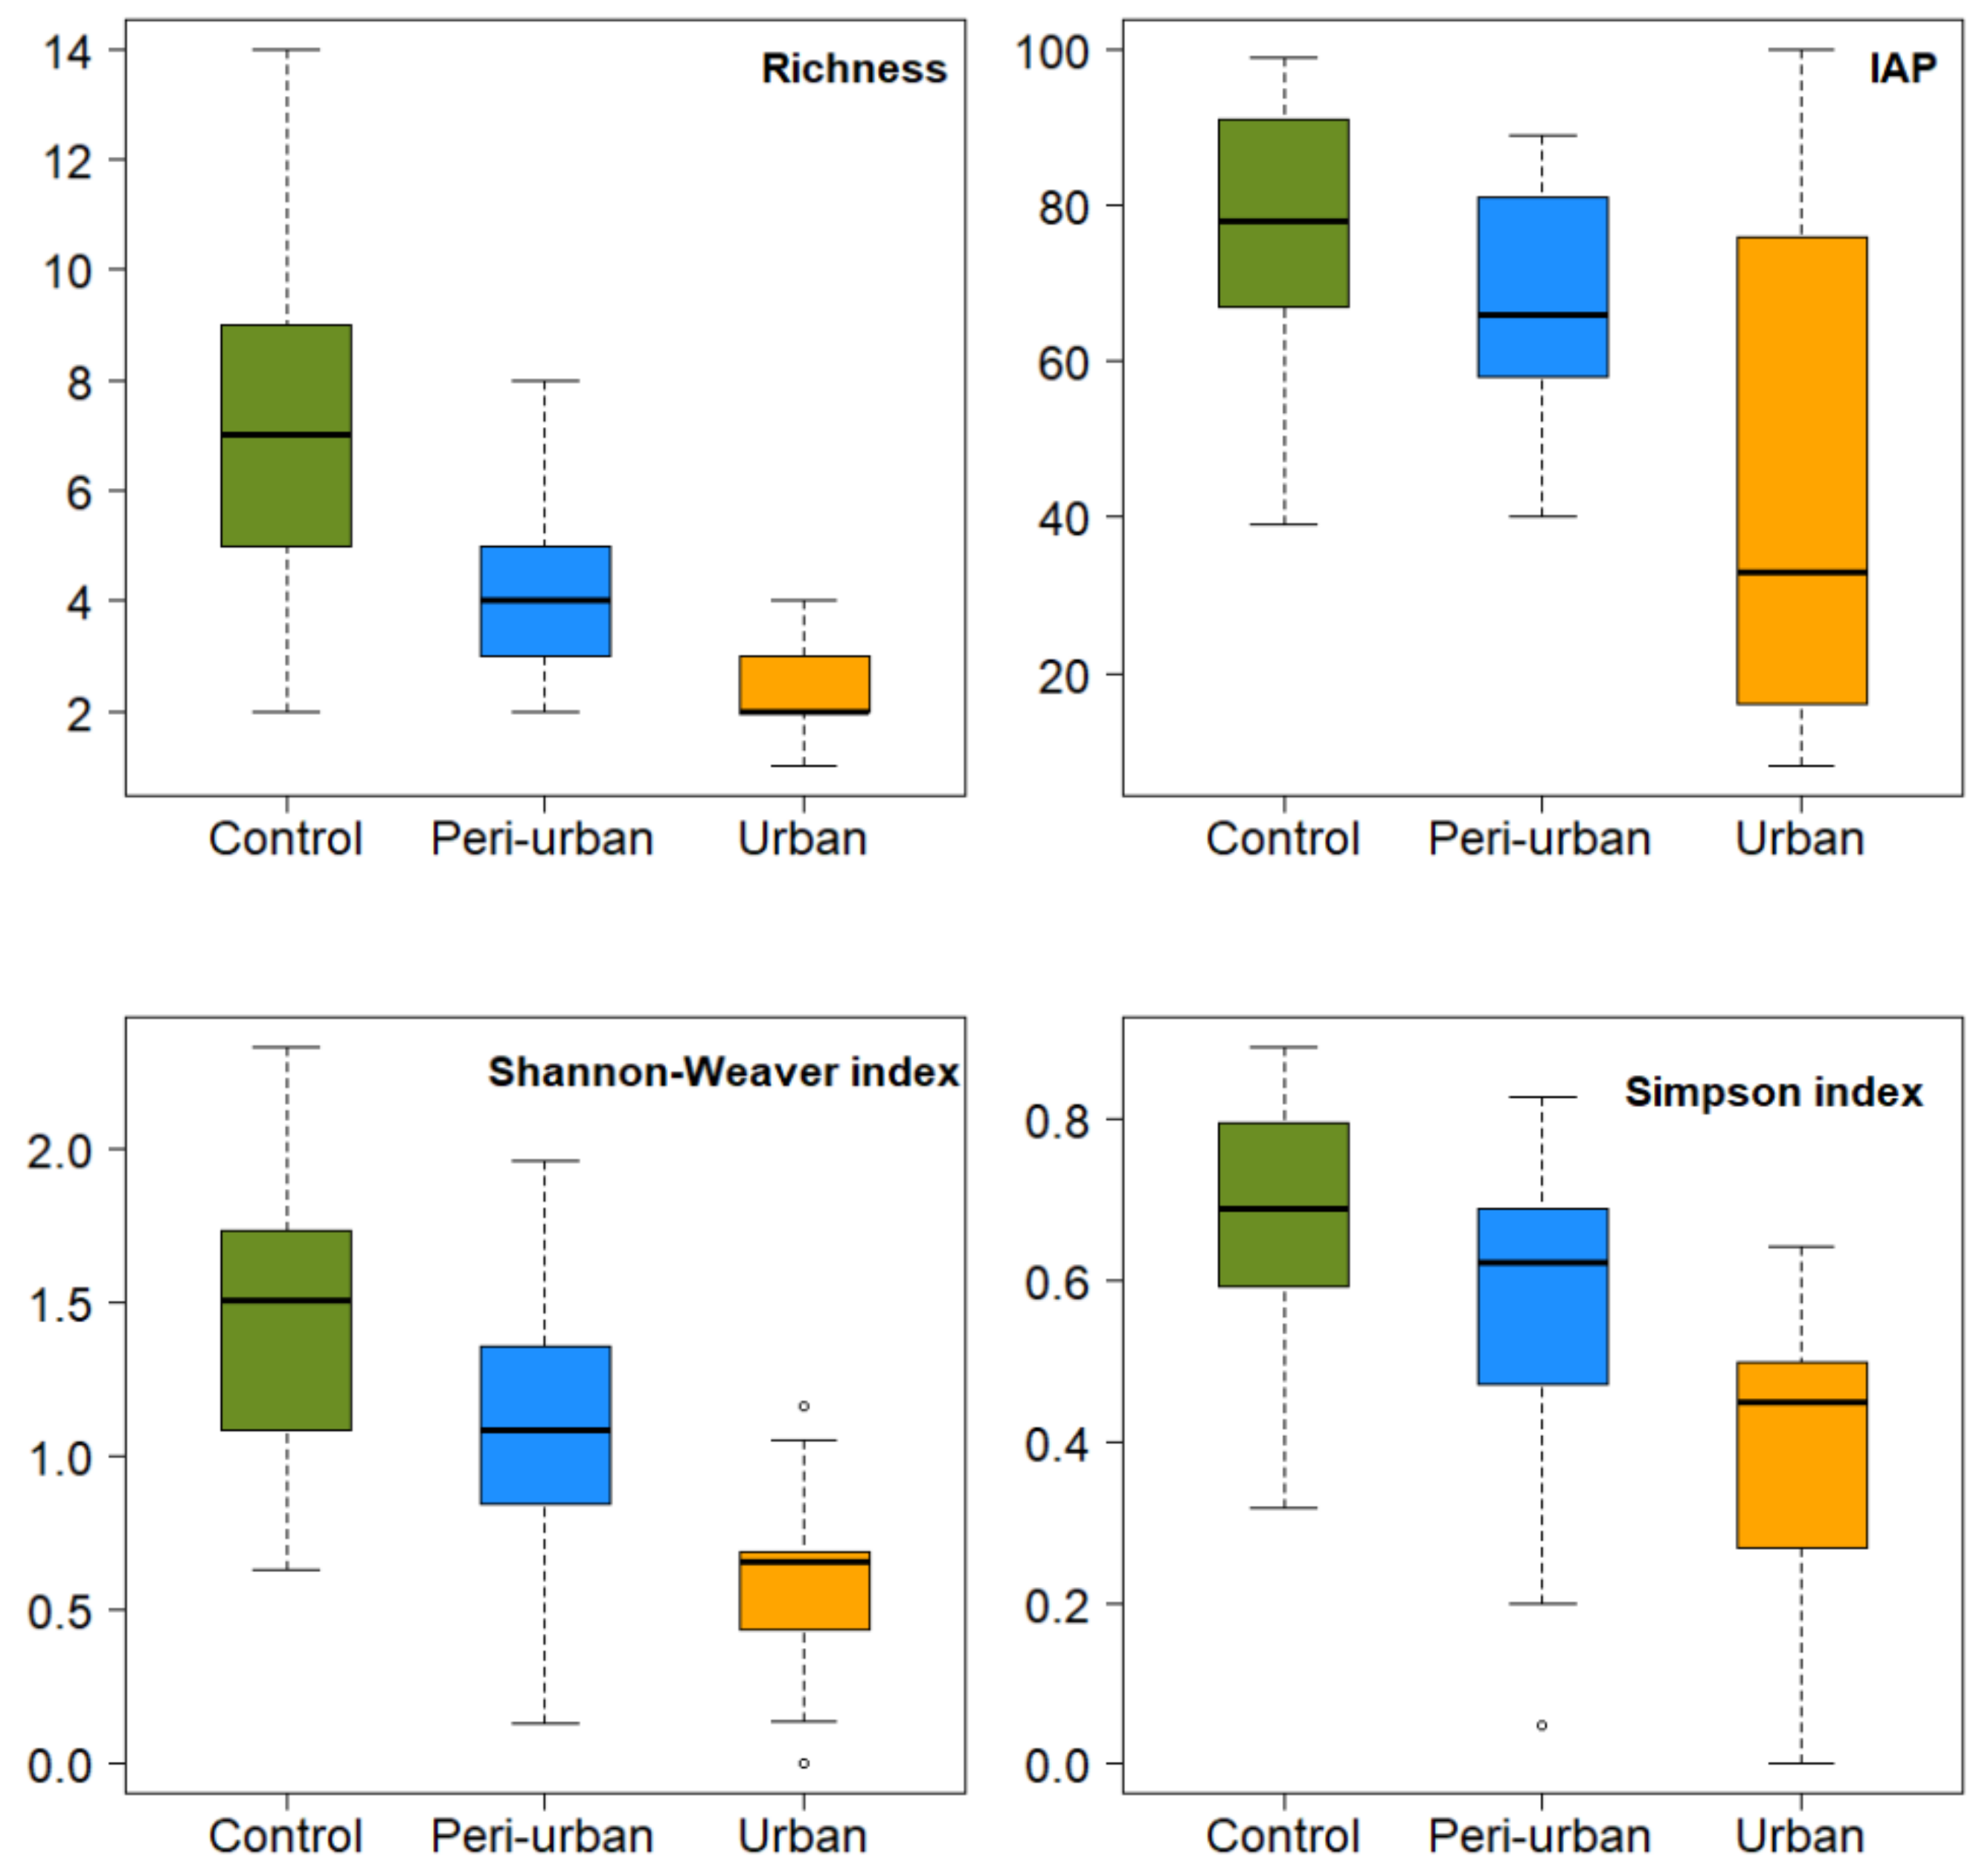
3.1. Alfa Diversity
3.2. Beta Diversity
4. Discussion
5. Conclusions
Author Contributions
Funding
Institutional Review Board Statement
Informed Consent Statement
Data Availability Statement
Acknowledgments
Conflicts of Interest
Appendix A

| Taxa | Code | S1 | S2 | S3 | S4 | S5 | S6 | S7 | S8 | S9 |
|---|---|---|---|---|---|---|---|---|---|---|
| Bryophytes | Coverage % | |||||||||
| Archilejeunea sp. | Arch_sp | - | - | - | - | - | - | - | 0.80 | 0.90 |
| Cryphaea sp. | Cryp_sp | - | - | - | - | - | - | - | 0.40 | - |
| Fabronia ciliaris (Brid.) Brid. | Fabr_cil | - | - | - | 0.10 | - | 1.40 | - | - | 0.70 |
| Frullania ericoides (Nees) Mont. | Frulla_eri | - | - | - | - | - | 1.90 | 0.90 | 2.80 | - |
| Frullania riojaneirensis (Raddi) Spruce | Frulla_rio | - | - | - | - | - | - | - | 2.70 | - |
| Macromitrium sp. | Macro_sp | - | - | - | - | - | - | - | 5.00 | 6.20 |
| Metzgeria sp. | Metz_sp | - | - | - | - | - | - | 0.30 | 0.50 | 0.10 |
| Microlejeuneabullata (Taylor) Steph. | Micro_bu | - | - | - | - | - | - | - | - | 8.80 |
| Neckeropsis undulata (Hedw.) Reichardt | Necke_undu | - | - | - | - | - | - | - | 2.40 | 5.30 |
| Orthotrichum diaphanum Schrad. ex Brid. | Ortho_dia | - | - | - | 18.90 | - | 1.00 | 0.80 | - | 1.50 |
| Prionodon densus (Sw. ex Hedw.) Müll. Hal. | Prio_den | - | - | - | - | - | - | 0.10 | 0.30 | - |
| Sematophyllum sp. | Sema_sp | - | - | - | - | - | - | - | - | 2.20 |
| Syntrichia fragilis (Taylor) Ochyra | Syntr_fra | - | 2.80 | 2.40 | - | 0.10 | 2.60 | 2.20 | 5.80 | 15.90 |
| Syntrichia sp. | Syntr_sp | - | - | 8.30 | 5.40 | - | 3.50 | 2.40 | 0.10 | - |
| Lichens | ||||||||||
| Buellia sp. | Buell_sp | - | - | - | - | - | - | - | 0.10 | 1.40 |
| Candelaria concolor (Dicks.) Arnold | Can_col | 5.40 | 8.90 | 0.20 | 1.50 | 47.10 | - | - | - | 18.90 |
| Candelaria sp. | Can_sp | - | - | 2.60 | - | - | - | - | - | 1.50 |
| Caloplaca aff. ferruginea (Huds.) Th.Fr. | Calo_ferr | - | - | - | - | - | - | - | - | 2.90 |
| Caloplaca sp. | Calo_sp | - | - | - | - | - | - | - | - | 2.10 |
| Chrysothrix candelaris (L.) J. R. Laundon | Chry_can | - | - | - | - | - | - | 2.50 | - | - |
| Heterodermia galactophylla (Tuck.) W.L.Culb. | Het_gala | - | - | - | - | - | - | - | 0.10 | - |
| Hypotrachyna sp. | Hyp_sp | - | - | - | - | - | - | 3.50 | 1.70 | - |
| Lecanora sp. | Leca_sp | - | - | - | - | - | 2.80 | 2.70 | 0.10 | - |
| Lepraria sp. | Lepr_sp | - | - | - | - | - | - | - | - | 0.90 |
| Leptogium marginellum (Sw.) Gray | Lept_mar | - | - | - | - | - | - | - | - | 0.10 |
| Leucodermia leucomelos (L.) Kalb | Leu_leuco | - | - | - | - | - | - | - | - | 0.40 |
| Normandina pulchella (Borrer) Nyl. | Norm_pul | - | - | - | - | - | - | - | - | 0.10 |
| Parmotrema arnoldii (Du Rietz) Hale | Parm_arn | 0.20 | - | 39.50 | - | 0.80 | 12.30 | 16.30 | 9.50 | 5.40 |
| Physcia aipolia (Ehrh. ex Humb.) Fürnr. | Phys_aip | 0.10 | 6.20 | 12.70 | 1.60 | - | - | - | - | 0.80 |
| Physcia sorediosa (Vain.) Lynge | Phys_sor | 13.10 | 12.30 | 0.60 | 21.40 | 17.10 | - | - | - | 2.60 |
| Punctelia borreri (Sm.) Krog | Punc_borr | 0.50 | - | 18.20 | 16.90 | 1.00 | 24.30 | 39.00 | 1.60 | - |
| Ramalina celastri (Spreng.) Krog & Swinscow | Ramal_cel | - | - | - | - | 2.10 | - | 1.80 | 1.50 | - |
| Ramalina sp. | Ramal_sp | - | - | - | - | - | - | - | - | 0.10 |
| Teloschistes chrysophthalmus (L.) Beltr. | Telos_chry | - | - | - | - | - | - | 2.20 | - | - |
| Teloschistes exilis (Michx.) Vain. | Telos_exi | - | - | - | - | - | 3.80 | 2.70 | - | - |
| Teloschistes flavicans (Sw.) Norman | Telos_flav | - | - | - | - | - | 12.10 | 3.80 | 0.10 | - |
| Usnea sp. | Usn_sp | - | - | - | - | 1.00 | 1.50 | 1.50 | 0.20 | |
| Usnea sp. 1 | Usn_sp1 | - | - | - | - | - | 1.10 | 0.80 | 30.00 | - |
| Usnea sp. 2 | Usn_sp2 | - | - | - | - | - | - | 0.60 | 0.20 | - |
| Species richness | 5 | 4 | 8 | 7 | 7 | 12 | 18 | 20 | 23 | |
References
- Bell, M.L.; Cifuentes, L.A.; Davis, D.; Cushing, E.; Telles, A.G.; Gouveia, N. Environmental health indicators and a case study of air pollution in Latin American cities. Environ. Res. 2011, 111, 57–66. [Google Scholar] [CrossRef] [PubMed]
- Cevallos, V.; Diaz, V.; Sirois, C. Particulate matter air pollution from the city of Quito, Ecuador, activates inflammatory signaling pathways in vitro. Innate Immun. 2017, 23, 392–400. [Google Scholar] [CrossRef] [PubMed] [Green Version]
- Alexandrino, K.; Viteri, F.; Rybarczyk, Y.; Andino, J.E.G.; Zalakeviciute, R. Biomonitoring of metal levels in urban areas with different vehicular traffic intensity by using Araucaria heterophylla needles. Ecol. Indic. 2020, 117, 106701. [Google Scholar] [CrossRef]
- Madaniyazi, L.; Xerxes, S. Outdoor air pollution and the onset and exacerbation of asthma. Chronic. Dis. Transl. Med. 2021, 7, 100–106. [Google Scholar] [CrossRef] [PubMed]
- Rodriguez, J.; Weller, S.; Wannaz, E.; Klumpp, A.; Pignata, M. Air quality biomonitoring in agricultural áreas narby to urban and industrial emission sources in Córdoba province, Argentina, employing the bioindicator Tillandsia capillaris. Ecol. Indic. 2011, 1, 1673–1680. [Google Scholar] [CrossRef]
- Sanchez, A. Biomonitoring potential of five sympatric Tillandsia species for evaluating urban metal pollution (Cd, Hg and Pb). Atmos. Environ. 2016, 131, 352–359. [Google Scholar] [CrossRef]
- Jacome, H.; King, K. Estudios Industriales de la Micro, Pequeña y Mediana Empresa FLACSO; Ministerio de Industrias y Productividad (MIPRO): Quito, Ecuador, 2013. [Google Scholar]
- Villacís, M. Valoración de la Campaña de Monitoreo Pasivo de Gases en la Ciudad de Ambato para el Diseño del Sistema de Calidad de Aire de la Ciudad 2013–2014. Master’s Thesis, Universidad Internacional SEK, Quito, Ecuador, 2015. [Google Scholar]
- Salazar, R. Valoración Ecológica Ambiental del Parque Provincial de la Familia de la Parroquia Ambatillo del Cantón Ambato. Master’s Thesis, Universidad Técnica de Ambato, Quito, Ecuador, 2017. [Google Scholar]
- Conti, M.E.; Cecchetti, G. Biological monitoring: Lichens as bioindicators of air pollution assessment—A review. Environ Pollut. 2001, 114, 471–492. [Google Scholar] [CrossRef]
- Rubiano, L. Delimitación de áreas de isocontaminación en Cali y Medellín utilizando líquenes como bioindicadores. Pérez Arbelaezia 1987, 1, 7–41. [Google Scholar]
- Sim-Siam, M.; Carvalho, P.; Sérgio, C. Cryptogamic epiphytes as indicators of air quality around an industrial complex in the Tagus valley, Portugal. Factor analysis and environmental variables. Cryptogam. Bryol. 2000, 21, 153–170. [Google Scholar] [CrossRef]
- Friedel, A.; Müller, F. Bryophytes and lichens as indicators for changes of air pollution in the Serrahn Natural Forest Reserve (Mueritz National Park). Herzogia 2004, 17, 279–286. [Google Scholar]
- Santoni, C.; Lijteroff, R. Evaluación de la calidad del aire mediante el uso de bioindicadores en la provincia de San Luis, Argentina. Rev. Int. Contam. Ambient. 2006, 22, 49–58. [Google Scholar]
- Das, P.; Joshi, S.; Rout, J.; Upreti, D.K. Lichen diversity for environmental stress study: Application of index of atmospheric purity (IAP) and mapping around a paper mill in Barak Valley, Assam, northeast India. Trop. Ecol. 2013, 54, 355–364. [Google Scholar]
- Simijaca, D.; Vargas, D.; Morales, M. Uso de organismos vegetales no vasculares como indicadores de contaminación atmosférica urbana (Tunja, Boyacá, Colombia). Acta Biol. Colomb. 2014, 9, 221–232. [Google Scholar] [CrossRef]
- Munzi, S.; Correia, O.; Silva, P.; Lopes, N.; Freitas, C.; Branquinho, C.; Pinho, P. Lichens as ecological indicators in urban areas: Beyond the effects of pollutants. J. Appl. Ecol. 2014, 51, 1750–1757. [Google Scholar] [CrossRef] [Green Version]
- Escandón, D.D.; Medina, E.S.; Luecking, R.; Sopkin, P.A.S. Corticolous lichens as environmental indicators of natural sulphur emissions near the sulphur mine El Vinagre (Cauca, Colombia). Lichenologist 2016, 48, 147–159. [Google Scholar] [CrossRef]
- Abas, A. A systematic review on biomonitoring using lichen as the biological indicator: A decade of practices, progress and challenges. Ecol. Indic. 2021, 121, 107197. [Google Scholar] [CrossRef]
- Asta, J.; Erhardt, W.; Ferretti, M.; Fornasier, F.; Kirschbaum, U.; Nimis, P.L.; Wirth, V. Mapping lichen diversity as an indicator of environmental quality. In Monitoring with Lichens—Monitoring Lichens; Springer: Dordrecht, The Netherlands, 2002; pp. 273–279. [Google Scholar]
- Hawksworth, D.L.; Iturriaga, T.; Crespo, A. Líquenes como bioindicadores inmediatos de contaminación y cambios medio-ambientales en los trópicos. Rev. Iberoam. Micol. 2005, 22, 71–82. [Google Scholar] [CrossRef]
- Gombert, A.; Seaward, M.R.D. Lichens and tobacco plants as complementary biomonitors of air pollution in the Grenoble area (Isère, southeast France). Ecol. Indic. 2006, 429–443. [Google Scholar] [CrossRef]
- Poličnik, H.; Simončič, P.; Batič, F. Monitoring air quality with lichens: A comparison between mapping in forest sites and in open areas. Environ. Pollut. 2008, 151, 395–400. [Google Scholar] [CrossRef]
- Jayalal, U.; Oh, S.O.; Park, J.S.; Sung, J.H.; Kim, S.H.; Hur, J.S. Evaluation of air quality using lichens in three different types of forest in Korea. For. Sci. Technol. 2016, 12, 1–8. [Google Scholar] [CrossRef]
- Tanona, M.; Czarnota, P. Index of Atmospheric Purity reflects the ecological conditions better than the environmental pollution in the Carpathian forests. J. Mt. Sci. 2020, 17, 2691–2706. [Google Scholar] [CrossRef]
- Käffer, M.; Azevedo, S.; Alves, C.; Camejo, V.; Fachel, J.; Ferrão, V. Corticolous lichens as environmental indicators in urban areas in southern Brazil. Ecol. Indic. 2011, 11, 1319–1332. [Google Scholar] [CrossRef]
- Correa-Ochoa, M.A.; Vélez-Monsalve, L.C.; Saldarriaga-Molina, J.C.; Jaramillo-Ciro, M.M. Evaluation of the Index of Atmospheric Purity in an American tropical valley through the sampling of corticulous lichens in different phorophyte species. Ecol. Indic. 2020, 115, 106355. [Google Scholar] [CrossRef]
- Canseco, A.; Anze, R.; Franken, M. Comunidades de líquenes: Indicadores de la calidad del aire en la ciudad de La Paz, Bolivia. Acta Nova 2006, 3, 286–307. [Google Scholar]
- Anze, R.; Franken, M.; Zaballa, M.; Pinto, M.; Zeballos, G.; Cuadros, M.; Canseco, A.; De La Rocha, A.; Estellano, V.; Del Granado, S. Bioindicadores en la detección de la contaminación atmosférica en Bolivia. Rev. Virtual REDESMA 2007, 1, 54–74. [Google Scholar]
- Lijteroff, R.; Lima, L.; Prieri, B. Uso de líquenes como bioindicadores de contaminación atmosférica en la ciudad de San Luis, Argentina. Rev. Int. Contam. Ambient. 2009, 25, 111–120. [Google Scholar]
- Estrabou, C.; Filippini, E.; Soria, J.; Schelotto, G.; Rodriguez, J. Air quality monitoring system using lichens as bioindicators in Central Argentina. Environ. Monit. Assess. 2011, 182, 375–383. [Google Scholar] [CrossRef]
- Ochoa-Jimenez, D.; Cueva, A.; Prieto, M.; Aragón, G.; Benítez, Á. Cambios en la composición de líquenes epífitos relacionados con la calidad del aire en la ciudad de Loja (Ecuador). Caldasia 2015, 37, 333–343. [Google Scholar] [CrossRef]
- Aspiazu, J.; Cervantes, J.; Ramírez, J.; López, R.; Ramos, R.; Muñoz, P.; Villaseñor, P. Temporal and spatial trends studied by lichen analysis: Atmospheric deposition of trace elements in Mexico. Rev. Mex. Fís. 2008, 53, 87–96. [Google Scholar]
- Neurohr, E.; Monge-Nájera, J.; González, M.I. Air pollution in a tropical city: The relationship between wind direction, season and lichen bio-indicators in San José, Costa Rica. Rev. Biol. Trop. 2011, 59, 899–905. [Google Scholar]
- Gómez, H.; Fernández, R.; Benzo, Z.; Galarraga, F.; Hernández, J.; Roschman, G. Líquenes como biomonitores de la contaminación atmosférica por hidrocarburos aromáticos policíclicos (HAP): Revisión. Rev. Fac. Ing. UCV 2015, 28, 45–58. [Google Scholar]
- Quispe, K.; Ñique, M.; Chuquilin, E. Líquenes como bioindicadores de la calidad del aire en la ciudad de Tingo María. RevIA 2013, 3, 99–104. [Google Scholar]
- Benítez, Á.; Medina, J.; Vásquez, C.; Loaiza, T.; Luzuriaga, Y.; Calva, J. Lichens and bromeliads as bioindicators of heavy metal deposition in Ecuador. Diversity 2019, 11, 28. [Google Scholar] [CrossRef] [Green Version]
- Benítez, Á.; Armijos, L.; Calva, J. Monitoring Air Quality with Transplanted Bryophytes in a Neotropical Andean City. Life 2021, 11, 821. [Google Scholar] [CrossRef]
- Churchill, S.P.; Linares, E.L. Prodomus Bryologie Novo Granatensis. Introducción a la Flora de Musgos de Colombia: Tomos I y II; Instituto de Ciencias Naturales, Facultad de Ciencias, Universidad Nacional de Colombia: Bogotá, Colombia, 1995. [Google Scholar]
- Gradstein, S.R.; Churchill, S.P.; Salazar, N. Guide to the Bryophytes of Tropical America; Memoirs of the New York Botanical Garden; New York Botanical Garden Press: Bronx, NY, USA, 2001; Volume 86, pp. 1–577. [Google Scholar]
- Gradstein, S.R. The Liverworts and Hornworts of Colombia and Ecuador; New York Botanical Garden: Bronx, NY, USA, 2020. [Google Scholar]
- Brodo, I.M.; Sharnoff, S.D.; Sharnoff, S. Lichens of North America; Yale University Press: New Haven, AZ, USA; London, UK, 2001. [Google Scholar]
- Nash, T.H.; Ryan, B.D.; Gries, C.; Bungartz, F. Lichen Flora of the Greater Sonoran Desert Region; Lichens Unlimited: Tempe, AZ, USA, 2002; Volume 1. [Google Scholar]
- Nash, T.H.; Ryan, B.D.; Diederich, P.; Gries, C.; Bungartz, F. Lichen Flora of the Greater Sonoran Desert Region; Lichens Unlimited: Tempe, AZ, USA, 2004; Volume 2. [Google Scholar]
- Nash, T.H.; Gries, C.; Bungartz, F. Lichen Flora of the Greater Sonoran Desert Region; Lichens Unlimited: Tempe, AZ, USA, 2007; Volume 3. [Google Scholar]
- Zuur, A.F.; Ieno, E.N.; Smith, G.M. Analysing Ecological Data; Statistics for Biology and Health; Springer: New York, NY, USA, 2007. [Google Scholar]
- R Team Development Core Team. R: A Language and Environment for Statistical Computing; R Foundation for Statistical Computing: Vienna, Austria, 2020. [Google Scholar]
- Oksanen, J.; Blanchet, F.G.; Friendly, M.; Kindt, R.; Legendre, P.; Mcglinn, D.; Minchin, P.R.; O’hara, R.B.; Simpson, G.L.; Solymos, P.; et al. Package “vegan”. Community Ecol. Package 2013, 2, 1–295. Available online: https://cran.r-project.org/web/packages/vegan/ (accessed on 17 January 2019).
- Rubiano, L. Monitoria de áreas de isocontaminación en la región de influencia de la Central Termoeléctrica Martín del Corral utilizando líquenes como bíoindicadores. Perez Arbelaezia 2002, 13, 91–104. [Google Scholar]
- Méndez, V.; Monge, J. El uso de líquenes como biomonitores para evaluar el estado de la contaminación atmosférica a nivel mundial. Biocenosis 2011, 25, 51–67. [Google Scholar]
- Monge-Nájera, J.; Gonzales, M.; Rivas, M. Un nuevo método para evaluar la contaminación del aire utilizando líquenes como bioindicadores. Rev. Biol. Trop. 2002, 50, 321–325. [Google Scholar]
- Koch, N.M.; Matos, P.; Branquinho, C.; Pinho, P.; Lucheta, F.; de Azevedo Martins, S.M.; Vargas, V.M.F. Selecting lichen functional traits as ecological indicators of the effects of urban environment. Sci. Total Environ. 2019, 654, 705–713. [Google Scholar] [CrossRef]
- Chuquimarca, L.; Gaona, F.P.; Iñiguez-Armijos, C.; Benítez, Á. Lichen responses to disturbance: Clues for biomonitoring land-use effects on riparian Andean ecosystems. Diversity 2019, 11, 73. [Google Scholar] [CrossRef] [Green Version]
- Lucheta, F.; Koch, N.M.; Käffer, M.I.; Riegel, R.P.; de Azevedo Martins, S.M.; Schmitt, J.L. Lichens as indicators of environmental quality in southern Brazil: An integrative approach based on community composition and functional parameters. Ecol. Indic. 2019, 107, 105587. [Google Scholar] [CrossRef]


| Richness | Index of Atmospheric Purity | Shannon-Weaver Index | Simpson Index | |||||
|---|---|---|---|---|---|---|---|---|
| Estimate | p Value | Estimate | p Value | Estimate | p Value | Estimate | p Value | |
| Control | 1.8245 | <0.0001 | 4.18358 | <0.0001 | 1.3274 | <0.0001 | 0.6523 | <0.0001 |
| Peri-urban | −0.7691 | <0.0001 | −0.22552 | <0.0001 | −0.3486 | 0.0212 | −0.0190 | <0.0001 |
| Urban | −0.7598 | 0.0007 | 0.25908 | <0.0001 | −0.8322 | <0.0001 | −0.3651 | <0.0001 |
| S5 | 0.1973 | 0.4939 | 0.27895 | 0.0002 | −0.3047 | 0.1501 | −0.2654 | 0.0067 |
| S1 | −0.2662 | 0.3597 | −1.5647 | <0.0001 | 0.1188 | 0.4378 | 0.1159 | 0.0980 |
| S7 | 0.2796 | 0.0967 | 0.24962 | <0.0001 | 0.1109 | 0.4565 | −0.0138 | 0.8384 |
| S9 | 0.1633 | 0.3443 | 0.19344 | 0.0002 | 0.2053 | 0.17 | 0.0586 | 0.3870 |
| S6 | 0.8009 | 0.0025 | 0.26586 | 0.0004 | 0.5401 | 0.0118 | 0.0904 | 0.3458 |
| S2 | −0.1304 | 0.6226 | −1.02642 | <0.0001 | 0.1948 | 0.1826 | 0.1428 | 0.03301 |
| Factor | Df | SS | MS | F | R2 | p Value |
|---|---|---|---|---|---|---|
| Station | 5 | 10.053 | 2.0106 | 12.01 | 0.3087 | 0.001 |
| Vehicular traffic | 1 | 3.911 | 3.9111 | 23.36 | 0.1201 | 0.001 |
| Zone | 2 | 5.038 | 2.5188 | 15.04 | 0.1547 | 0.001 |
| Residuals | 81 | 13.563 | 0.1674 | 0.4165 | ||
| Total | 89 | 32.564 | 1 |
Publisher’s Note: MDPI stays neutral with regard to jurisdictional claims in published maps and institutional affiliations. |
© 2021 by the authors. Licensee MDPI, Basel, Switzerland. This article is an open access article distributed under the terms and conditions of the Creative Commons Attribution (CC BY) license (https://creativecommons.org/licenses/by/4.0/).
Share and Cite
Díaz, J.; Montaño, L.; Salinas, P.; Benítez, Á. Epiphytic Cryptogams as Bioindicators of Air Quality in a Tropical Andean City. Sustainability 2021, 13, 11218. https://doi.org/10.3390/su132011218
Díaz J, Montaño L, Salinas P, Benítez Á. Epiphytic Cryptogams as Bioindicators of Air Quality in a Tropical Andean City. Sustainability. 2021; 13(20):11218. https://doi.org/10.3390/su132011218
Chicago/Turabian StyleDíaz, Juan, Luis Montaño, Paul Salinas, and Ángel Benítez. 2021. "Epiphytic Cryptogams as Bioindicators of Air Quality in a Tropical Andean City" Sustainability 13, no. 20: 11218. https://doi.org/10.3390/su132011218
APA StyleDíaz, J., Montaño, L., Salinas, P., & Benítez, Á. (2021). Epiphytic Cryptogams as Bioindicators of Air Quality in a Tropical Andean City. Sustainability, 13(20), 11218. https://doi.org/10.3390/su132011218