Article

Mitigating Spatial Conflict of Land Use for Sustainable Wetlands Landscape in Li-Xia-River Region of Central Jiangsu, China

1
School of Public Administration, Hohai University, Nanjing 210098, China
2
College of Hydrology and Water Resources, Hohai University, Nanjing 210098, China
3
School of Public Policy and Management, China University of Mining and Technology, Xuzhou 221116, China
4
Geospatial Science, College of Science, Engineering and Health, RMIT University, Melbourne 3000, Australia
*
Author to whom correspondence should be addressed.
Sustainability 2021, 13(20), 11189; https://doi.org/10.3390/su132011189
Submission received: 9 August 2021 / Revised: 23 September 2021 / Accepted: 9 October 2021 / Published: 11 October 2021
(This article belongs to the Special Issue Sustainable Land Use Change)

Abstract

:
Li-Xia-river Wetlands make up the biggest freshwater marsh in East China. Over the last decades, social and economic developments have dramatically altered the natural wetlands landscape. Mitigating land use conflict is beneficial to protect wetlands, maintain ecosystem services, and coordinate local socioeconomic development. This study employed multi-source data and GIS-based approaches to construct a composite index model with the purpose of quantitatively evaluating the intensity of land use conflict in Li-Xia-river Wetlands from 1978 to 2018. The results showed that the percentage of the wetlands’ area declined from 20.3% to 15.6%, with an overall reduction rate of 23.2%. The mean index of land use conflict increased from 0.15 to 0.35, which suggests that the conflict intensity changed from “no conflict” to “mild conflict.” The number of severe conflict units increased by about 25 times. A conspicuous spatial variation of land use conflict was observed across different periods, although taking land for agricultural activities was the overriding reason for wetlands reduction. However, in recent years, urban sprawl has posed the greatest threat to Li-Xia-river Wetlands. Coordinating land use conflict and formulating a practical strategy are the initial imperative steps to mitigate the threat to wetlands.

1. Introduction

Wetlands play a pivotal role in the global ecosystem, especially in biodiversity protection [1,2,3]. Although wetlands account for less than 3% of the earth’s total land surface, they contribute about 40% of the global ecological service value [4]. Acting as the most important carbon pool [5,6,7], wetlands are also playing the following important roles: reducing flood threats [8], regulating regional microclimates [9,10], facilitating nutrient cycles [11,12], mitigating water environment pollution [13,14], and improving water quality [15,16]. However, wetland ecosystems are now facing much more serious threats than other ecological types [17]. The recession of coastal mangroves in tropical regions [18] and disappearance of mid-latitude plateau lakes [19] and high-latitude peatlands [20] are all part of the emblematic picture of global wetland loss.
Food demand and urban sprawl have always come at the expense of natural landscape in the past 100 years. Consequently, the natural ecological process has been drastically changed, and the loss of biodiversity is shocking [21,22,23]. This occurrence is regarded as land use conflict, manifested as the spatial scarcity of land resources and spatial externality [24,25,26,27,28]. Human activities are considered the main reason for wetland recession [29,30,31,32]. More intensive human activities often result in more pronounced manifestations and more complex forming mechanisms of land use conflict [33,34,35]. Since the 1980s, remote sensing technology has become a powerful tool for wetland monitoring and assessment [36,37,38,39]. The Conventions on Wetlands provide classifications for global wetlands [40]. The list of important wetlands together with their area, soil types, and vegetation are included in the global wetland database [41] and the first global wetland map has been recently published [42]. Although these efforts contribute to global wetland protection, the recession is ongoing [43,44,45].
China has been greatly compromised by land use conflict caused by the fast-growing population and urbanization. China’s population has increased from 963 million in 1978 to 1.37 billion in 2015, with the expansion of urban built-up area about 10 times greater [46]. Jiangsu Province, as a region of abundant wetland resources, is one of the most economically developed provinces in China. In order to meet food demand, coastal beaches with 200,100 ha of area have been reclaimed from 1949 to 1998 in Jiangsu Province [47]. Land acquired for urban development and agricultural production, pollution from industrial wastewater, encroachment by aquiculture industries, and reallocation of water resources for irrigation have increasingly endangered the wetlands [48,49,50,51]. Wetland landscape changes are hard to characterize with a certain driver, but these changes often gather to form spatial hot spots [52,53,54]. A quantitative assessment of land use conflict can grant an understanding of wetland change drivers. Li-Xia-river Wetlands, as the largest freshwater marsh in East China, has been severely impacted by human activities [55,56,57,58] but, until now, only limited attention has been given to their critical state [59,60,61]. In this study, a database of Li-Xia-river Wetlands covering three time periods (1978, 1998, and 2018) was built to provide a quantitative assessment of land use conflict between wetland and other competing land uses. The hot spots of land use conflict were identified to provide a guide for wetland protection planning and ecosystem services maintenance.

2. Methodology and Data

2.1. Study Area

Li-Xia-river Wetlands (E119°03′–120°07′, N32°36′–33°93′) is located in Central Jiangsu, a coastal region in East China (Figure 1a). Belonging to a subtropical monsoon climate, average annual temperature is 14.3 °C, with an annual average precipitation of 1010.3 mm. The precipitation of the flood season (June to August) accounts for about 70.5% of the total annual rainfall [62]. Li-Xia-river Wetlands (shaded area) covers a total area of about 11,300 km2, which is surrounded by Xia River in the east, Han River in the south, Li River in the west, and Huai River in the north. Li-Xia-river Wetlands is especially vulnerable to flooding associated with topographic features (Figure 1b). Therefore, people rely on the surrounding river embankments and sluice gates to prevent the transit water from flowing into a low-lying terrain, otherwise the whole Li-Xia-river area will become a water body which will seriously affect the livelihood of 11.3 million people. Li-Xia-river Wetland covers the whole area around the Paleo-Sheyang Lake, which evolved from the lagoon. Historically, the Yellow River crossed the course of Huai River several times, and the rich yellow silt it carried facilitated the disappearance of the Paleo-Sheyang Lake. After the Ming Dynasty, the Paleo-Sheyang Lake began to diminish and morph into several lakes of varying sizes, which later evolved into the marshes seen today [63] (Figure 1c).

2.2. Research Methods

2.2.1. Analytical Framework of Land Use Conflict

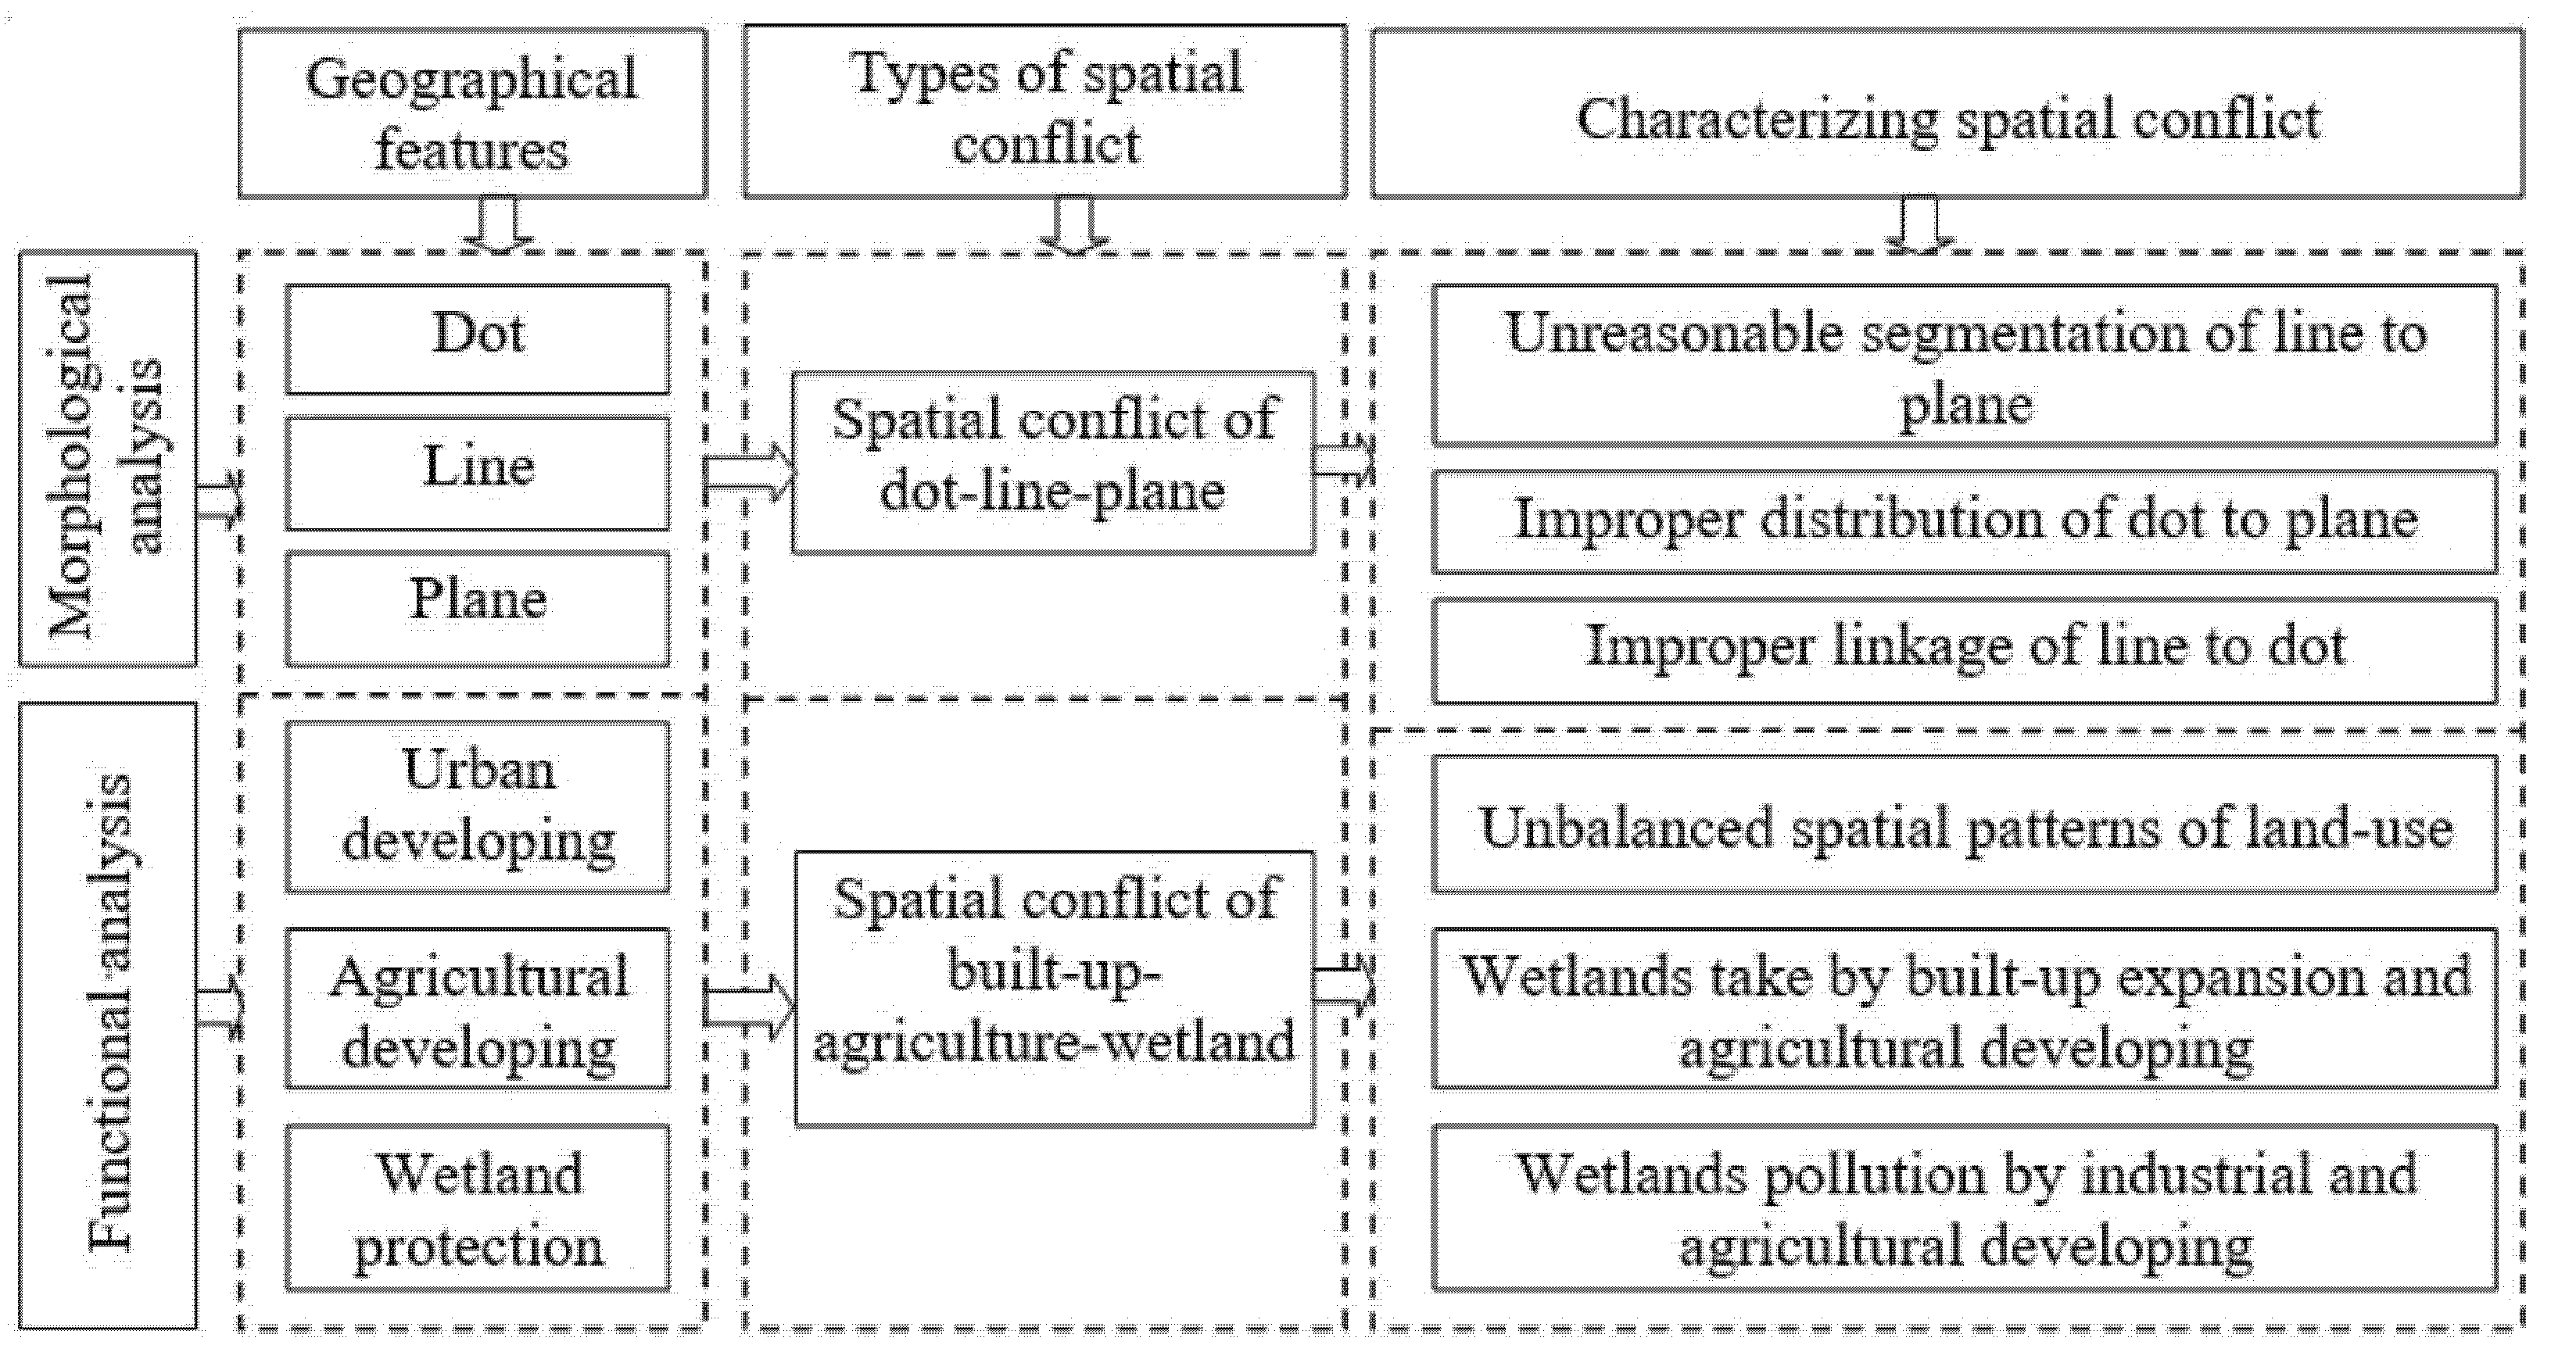
Land use conflict is generally spatial competition at a certain location, such as wetland, agriculture, and urban development. The contradictions between different land use purposes are aggravated by spatial externalities which, in turn, prompt the occurrence and development of land use conflict. Hence, land use conflicts lead to encroachment, occupation, transformation, or pollution. Rapid urban expansion and food demand have increased the intensity of people’s utilization of space resources, thus changing the structure and function of the regional ecosystem and affecting regional ecological security. Ecological risks are generally thought to consist of sources, victims, and risk effects [64,65]. The sources of risk were characterized by the external pressure factor related to land use intensity. The victims of risk were characterized by the level of risk exposure related to resource vulnerability (spatial vulnerability). The risk effects were characterized by the stability of spatial units. The greater the external pressure imposed on the spatial units, the higher the risk exposure and the lower the internal stability and hence the greater the possibility of ecological risk. This also meant a greater disturbance to the wetland ecosystem and a more intense land use conflict. From the perspective of ecological security, the smaller the negative effect (or positive effect) of spatial pattern change on regional ecosystem function, indicating the smaller the spatial ecological risk caused by land use, the lower the level of regional spatial conflict (Figure 2).

2.2.2. A Composite Index Model of Land Use Conflict

The essence of space conflict is the game between the conflicting parties on the occupation of space resources. Space conflict is bound to accompany the process of land development and utilization, which will inevitably lead to changes in regional spatial pattern and spatial functions and then change the regional material cycle and ecosystem structure effect by affecting the original regional hydrological process, geomorphic process, and ecological process. Once the ecological threshold is broken, various negative aspects of space conflict will be highlighted, such as soil erosion, water pollution, air pollution, solid waste pollution, habitat fragmentation, biodiversity reduction, etc., thus endangering the ecological security of the whole region. Therefore, we believe that the spatial conflict of land use can be characterized by the impact of spatial pattern change on regional ecological security.
The conceptual model of relative ecological risk assessment is a composite index model of land use conflict based on ecological risks from three dimensions, namely, sources of risk, victims of risk, and effects of risk at the evaluation endpoint [64,65]. According to the above analytical framework for land use conflict in Li-Xia-river Wetlands, a composite index model is developed to reveal land use conflict. The intensity of land use conflict (LC) of an evaluation unit (EU) was calculated using the following equation [12,66,67]:
A W M P F D = i = 1 m j = 1 n [ 2 ln ( 0.25 P i j ) ln a i j ( a i j A i ) ]
A C = α L w c L c + L w + β L w a L a + L w
P = AWMPFD + AC
E = i = 1 n F i × a i S
P D i = n i A
S = 1 P D i P D min P D max P D min
where Pij is the perimeter of the j-th patch type in the i-th patch type; aij is the area of the j-th patch type in the i-th patch type; Ai is the total area of the i-th landscape type; m is equal to 3, representing 3 landscape types (i.e., wetlands, agricultural land, built-up land); and n is the number of patches undergoing the transformation. The value of the area-weighted mean patch fractal dimension ranges between 1 and 2, where 1 represents a square or circular patch and 2 represents a patch with a more complicated perimeter [54]. Lwc is the total length of boundaries between wetland and built-up land in the EU; Lwa is the total length of boundaries between wetland and agriculture in the EU; Lc is the total perimeter length of the patches of built-up land in the EU; Lw is the total perimeter length of the patches of wetlands in the EU; La is the total perimeter length of the patches of agriculture in the EU; α is the coefficient of the influence from the built-up land on the wetlands (the value is recommended as 1); and β is the coefficient of the influence from agriculture on wetlands (the value is recommended as 0.5). Fi is the landscape vulnerability index of the type-i landscape (the values of wetland, agricultural land, and built-up land were recommended as 0.1, 0.4, and 1.0, respectively); ai is the area of type-i landscape; S is the total area of the EU. PDi is the landscape fragmentation index of the i-th EU; ni is the number of patches in the i-th EU; and A is the area of the EU. PDmax and PDmin are the maximum and minimum patch density index in the EU, respectively [57].
Then, calculate the relevant landscape ecological indexes such as external pressure, spatial exposure, and spatial stability of each EU, respectively, and then substitute it into Formula (7). The specific formula is as follows [66]:
LC = P + ES
where LC represents the intensity of land use conflict; P represents external pressure; E represents risk exposure; S represents the internal stability of EUs. The calculation results are standardized to the range of (0, 1), and the spatial conflict level value of each EU is obtained. The values of LC were divided into different intervals by frequency natural breaking point. Based on the inverted U-shaped trajectory of evolution of spatial conflict and correlation analysis [66,68,69,70], the intervals represent no conflict, mild conflict, moderate conflict, and severe conflict, respectively.

2.3. Data Synthesis and Processing

Landsat TM images (NASA, Washington, DC, USA) were collected (Table 1). Radiometric enhancements were performed on the Landsat TM images, geometric correction, image mosaic, projection transformation, followed by supervised classification and artificial visual interpretation. The procedures of the interpretation were described by Niu et al. [47]. The fall images ensured an accurate interpretation of water bodies such as the wetlands, but the floodplain wetlands were hard to distinguish in summer. The land use maps of 1999 and 2019 were compared and revised. Finally, the following simplified landscape types were identified according to the regulations of the third national land and resources survey in 2018: built-up zone (high-density built-up land, low-density built-up land, and linear transport site), agricultural zone (farmland, shelterbelt and sporadic forest land, and sporadically-distributed bare land), and wetlands (water bodies, marshes, aquaculture areas, and floodplain wetlands) with a Kapper coefficient of 0.82, 0.85, and 0.86 in 1978, 1998, and 2018, respectively.
A vector database was built using ArcGIS 10.2 software (ESRI, Sacramento, CA, USA). A grid measuring 1000 m × 1000 m was chosen for the division of the spatial units based on considerations for scale, data types, patch status, and resolution [47]. With this, a total of 11,363 evaluation units (EUs) were obtained according to the land use type with the largest area in each unit. Next, the perimeter and area of the EUs were estimated with Patch Analyst, an extension of the ArcGIS 10.2 software. The composite index of spatial conflict within each EU was calculated using Region Analyst, which met the precision requirements of the analysis of land use spatial conflict. A digital elevation model was automatically generated from the 1:50,000 topographic map of 1974 and compared against the data provided by the geospatial data cloud (http://www.gscloud.cn/ accessed date 1 September 2021). Meteorological data, such as precipitation, were obtained from 13 local weather stations. The socioeconomic statistics of population and GDP were obtained from Bureau of Statistics of Jiangsu Province [71].

3. Results

3.1. Dynamic Changes of Landscape Pattern in Li-Xia-River Wetlands over the Last 40 Years

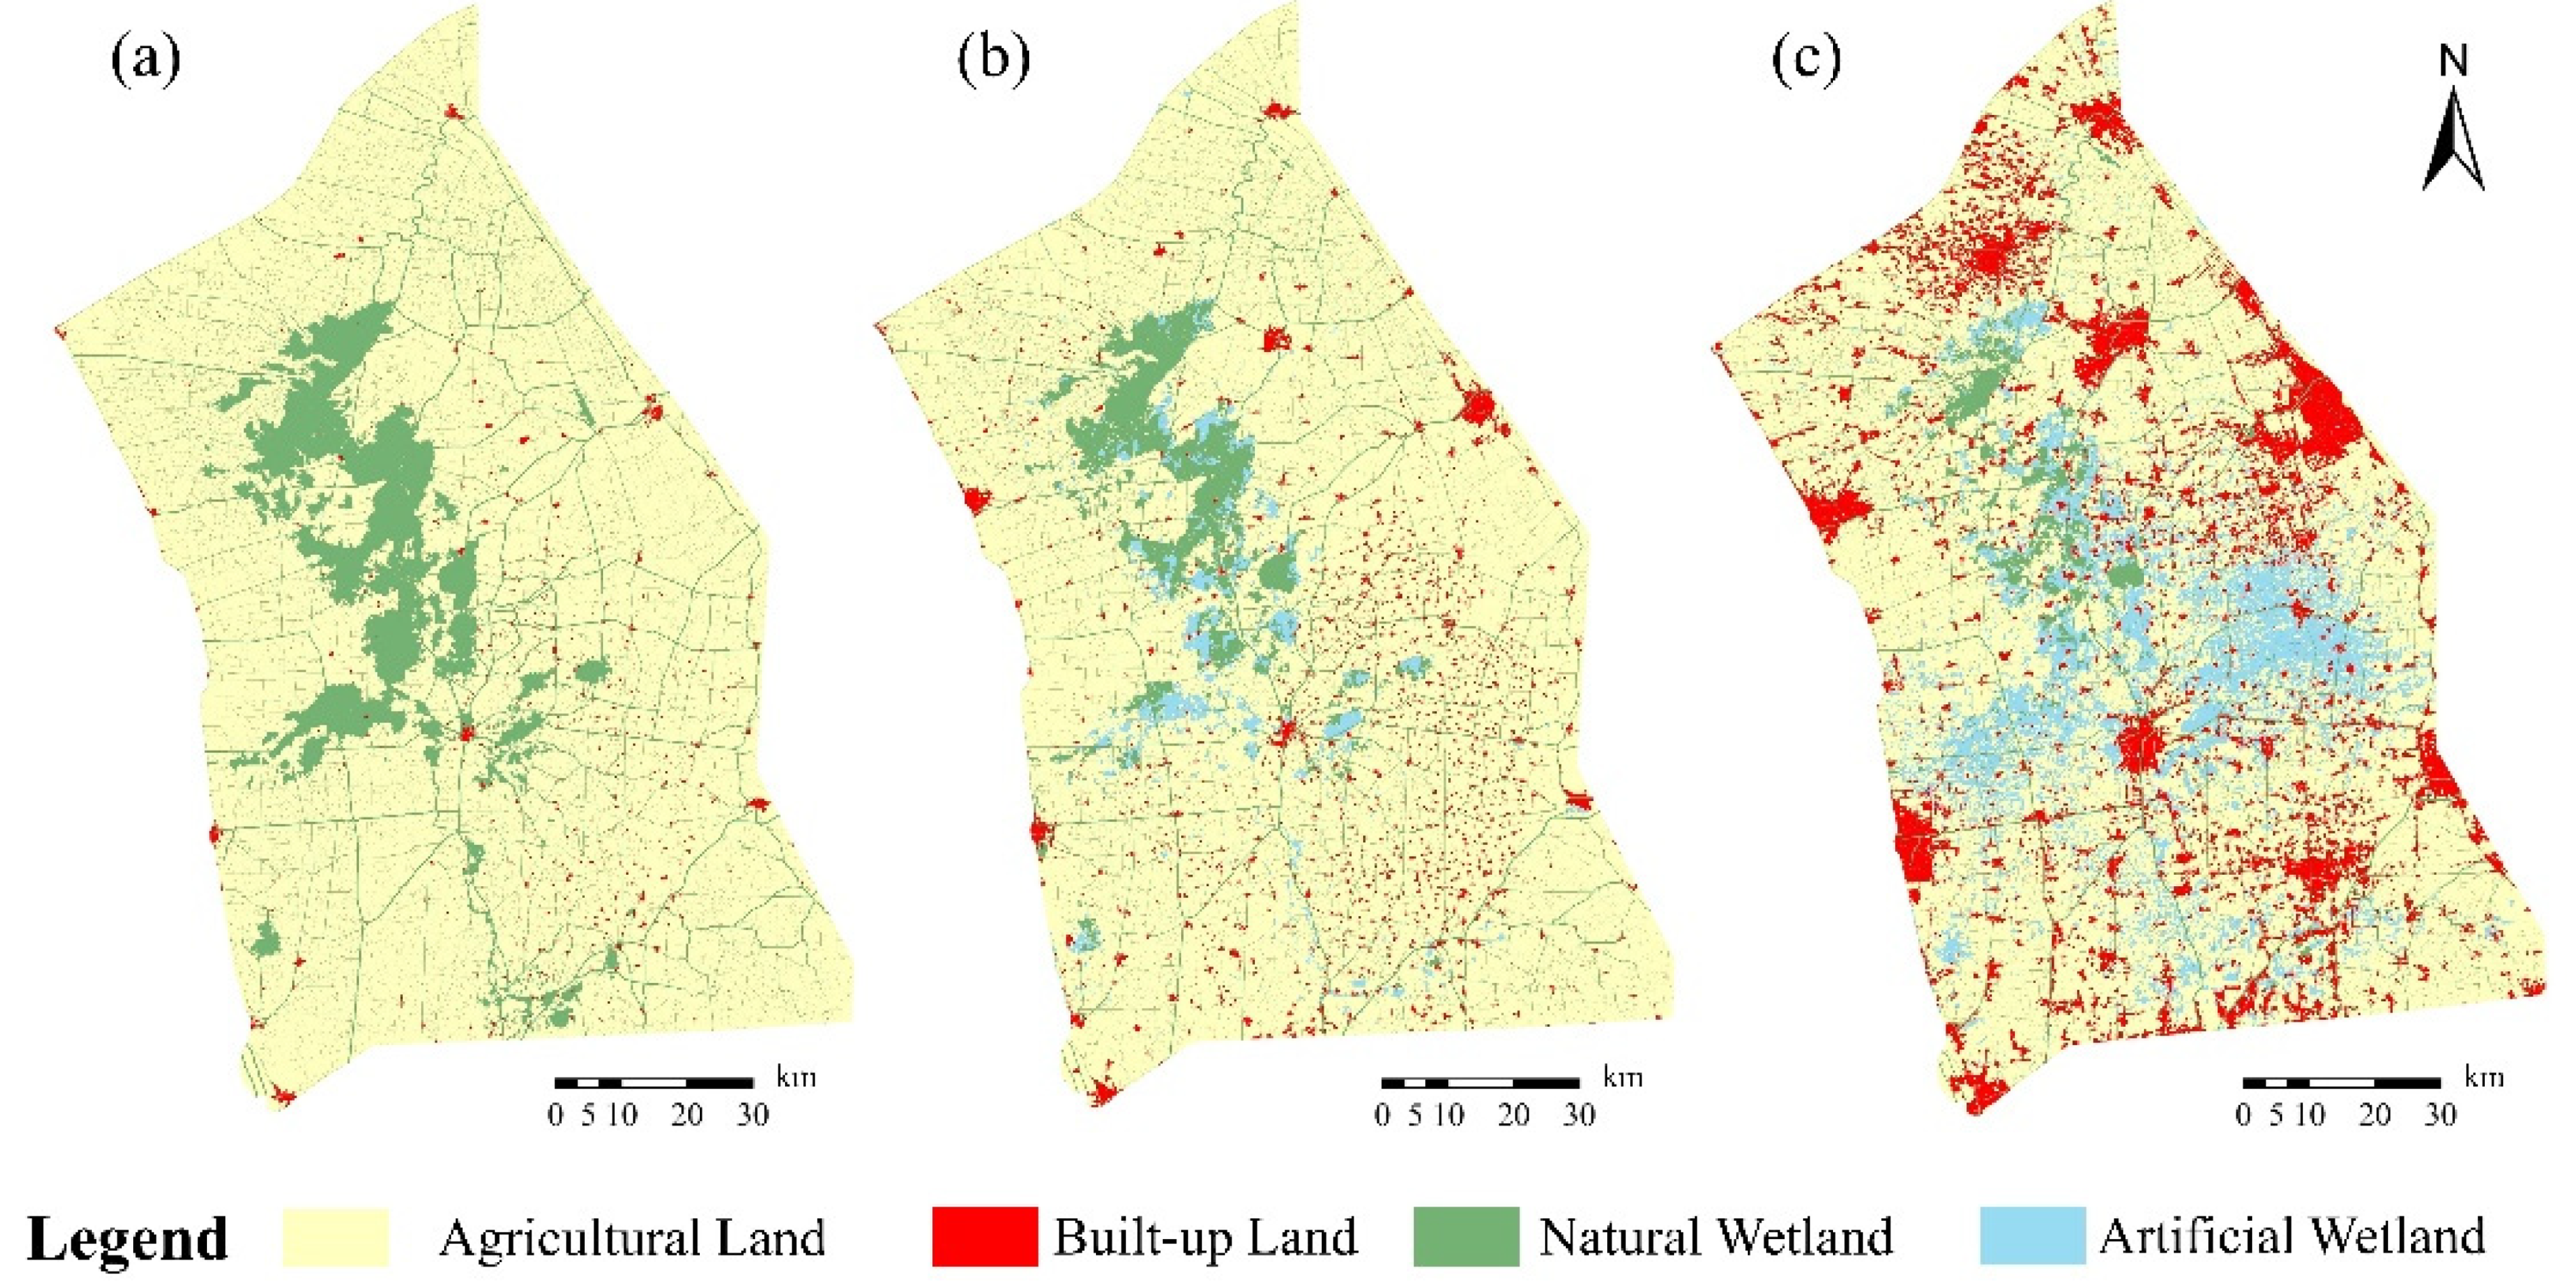
The wetlands accounted for as much as 20.3% of the study area in 1978, after which the wetland area declined (Figure 3). Fortunately, the rate of decline has slowed in the past 20 years due to greater efforts for wetland protection. The wetland area has decreased by 14.3% over the last 40 years. As the leading cause, agriculture accounts for 82.8% of wetland loss. Unrestrained agricultural development was responsible for the fastest reduction of wetlands, which occurred in the period between 1978 and 1998. To solve food shortages in the 1970s, large-scale land reclamation from the lake area and new land reclamation for crop planting wielded considerable effects. At the same time, the process of transforming the uplands into paddy fields was devastating to the wetlands. In recent years, a portion of the agricultural land has been converted back to wetlands under the land use policy of returning farmland to lakes. The built-up land continued to expand from 1978 (Figure 3a) to 2018 (Figure 3c). In the period between 1998 (Figure 3b) and 2018, built-up land increased by 268.5%. In fact, more worrying is the change of the internal structure of the wetland. The natural wetland decreased from 20.3% to 8.8%. At the same time, the artificial wetland (aquaculture areas) increased by 8.6% (Figure 4).

3.2. Characteristic Changes of Land Use Conflict from 1978 to 2018

According to Formula 7, the value of the composite index of EU was calculated and then divided into the following four intervals by frequency natural breaking point method: (0, 0.30), [0.30, 0.60), [0.60, 0.85), and [0.85, 1.0). In 1978, 1998, and 2018, the composite index is 0.15, 0.26, and 0.35, respectively. Along with the area’s rapid economic growth, the intensity of the spatial conflict continuously increases, even today. As shown in Table 2, Li-Xia-river Wetlands had essentially no conflict based on the average value of the composite index in 1978. In 2018, it was upgraded to mild conflict. The number of EUs with no conflict (0–0.30) declined over the years, from 88.34% in 1978 to 71.90% in 2018. No-conflict EUs provide major resilience to the relentless encroachment of wetlands amidst the land use conflict. Put another way, about 30% of the Li-Xia-river Wetlands suffer from ecological risks. The number of EUs with severe conflict has increased significantly, from 0.15% in 1978 to 3.78% in 2018. The percentages of EUs with mild and moderate levels of conflict also increased in varying degrees.

3.3. Spatial Variation of Characteristics of Land Use Conflict

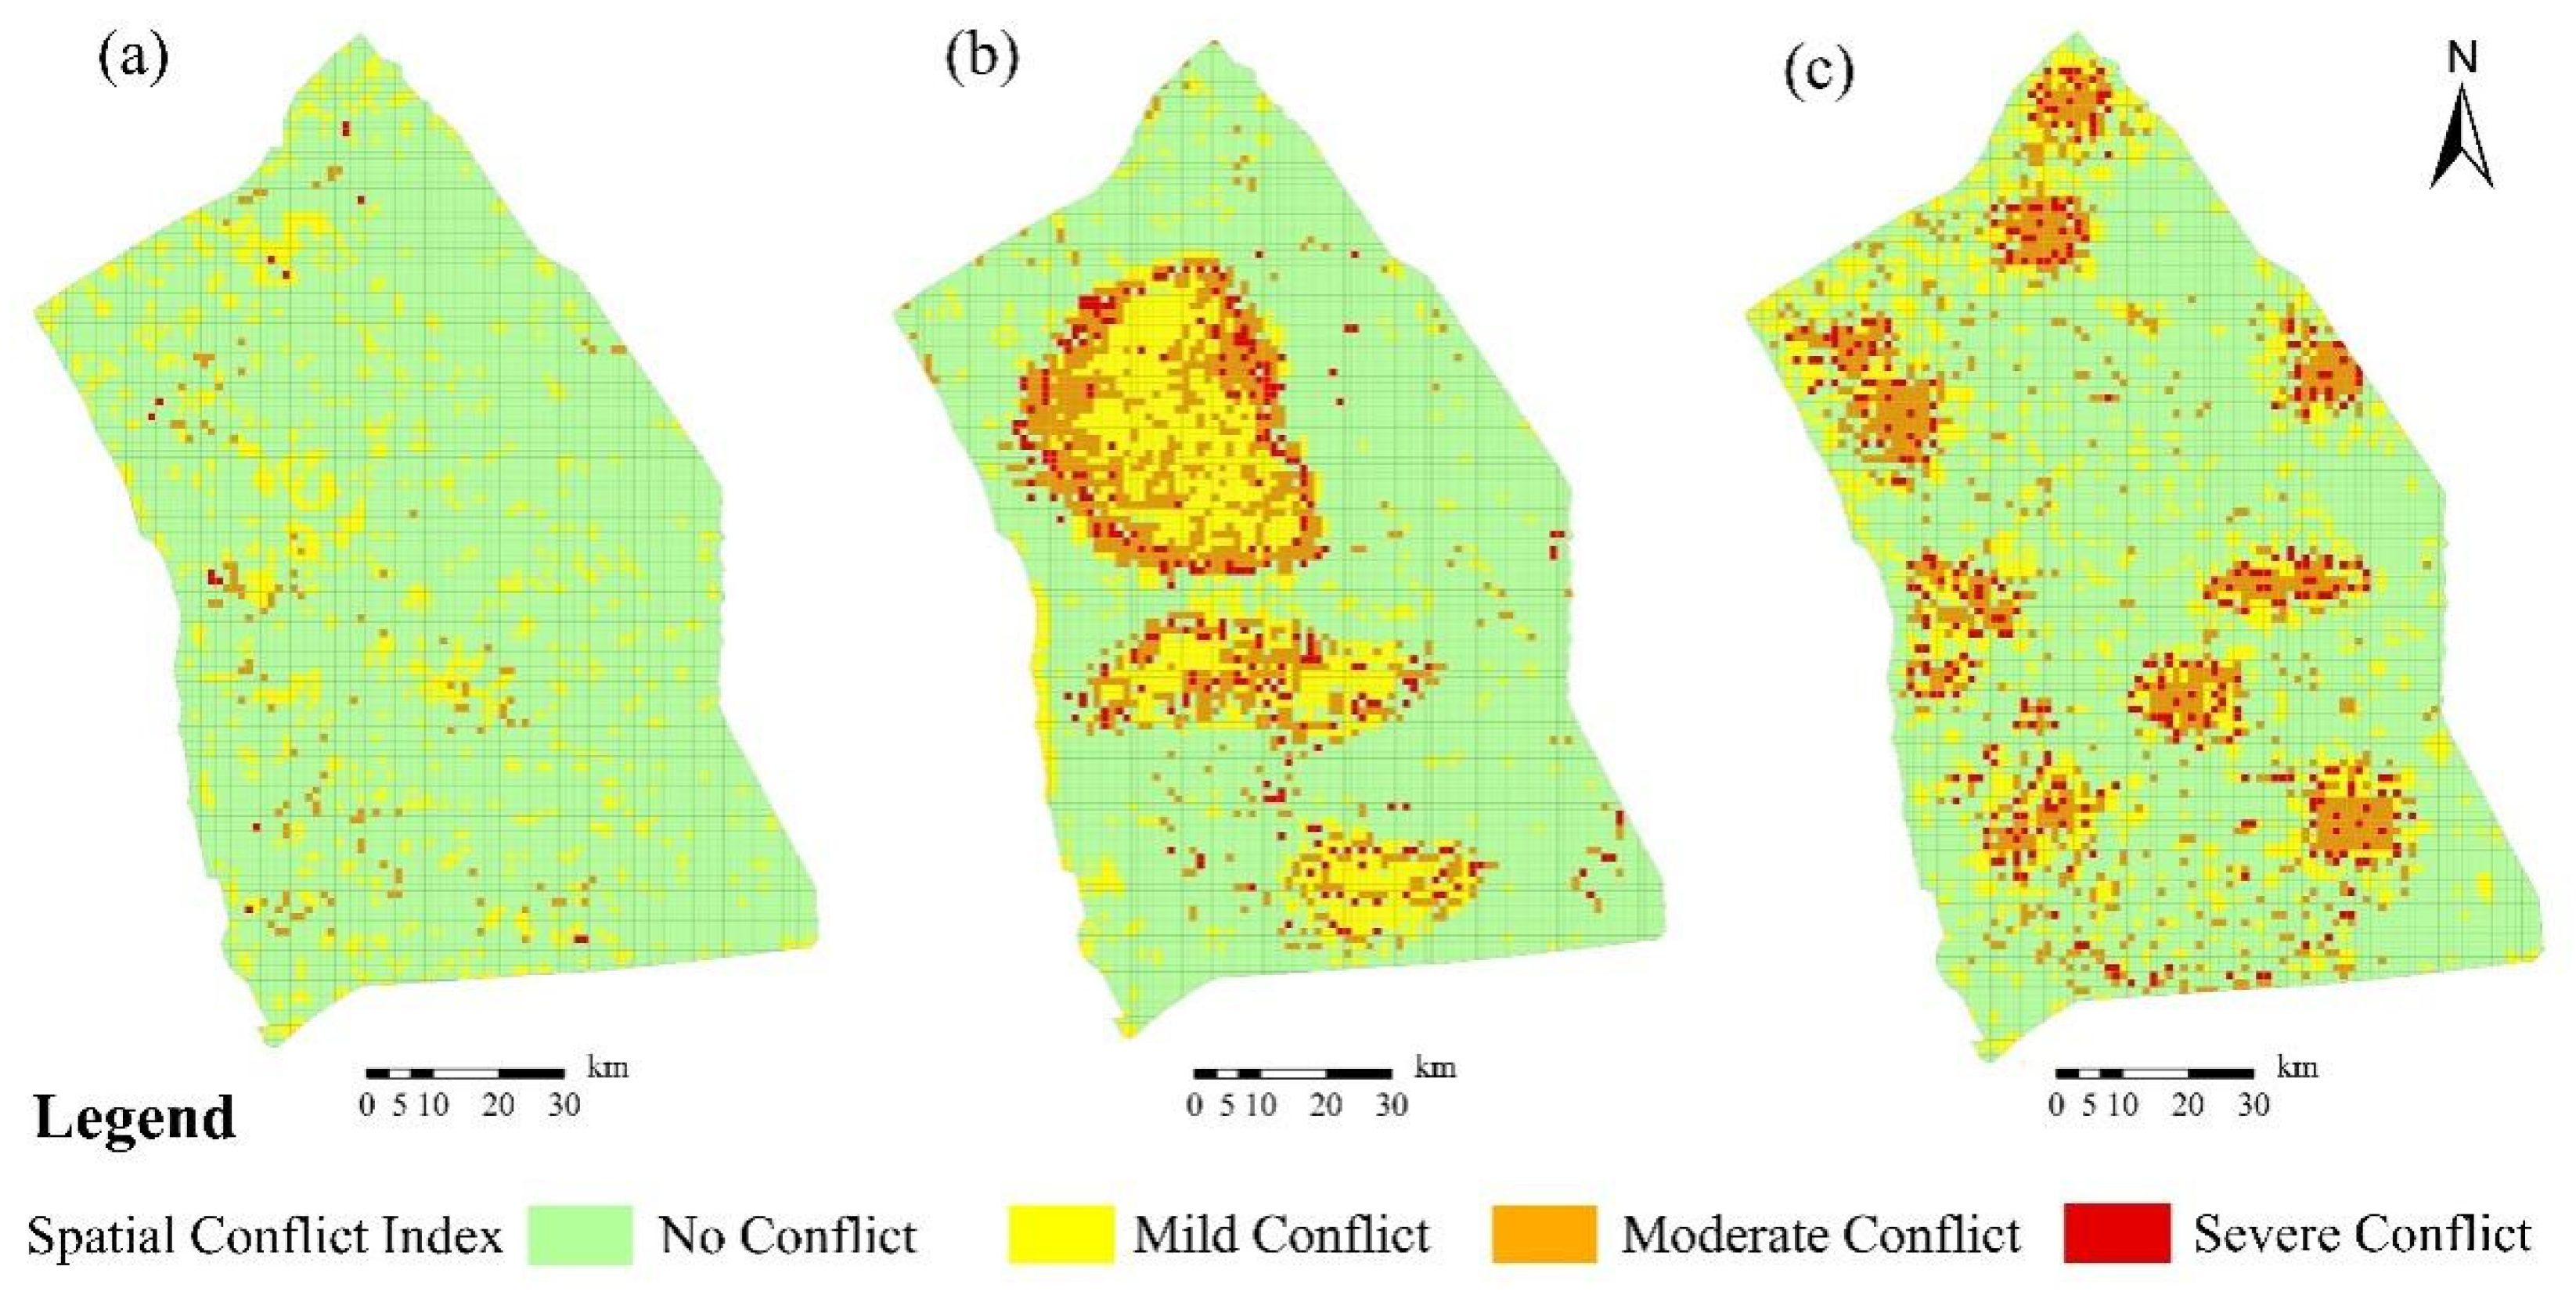
Compared with 1978, land use spatial conflict in 1998 and 2018 is more intense. Only a few conflict hotspots were randomly distributed throughout the region in 1978, as can be seen in Figure 5a. However, in 1998, land use spatial conflict areas became concentrated and showed as a ring around the Paleo-Sheyang Lake. These hotspots are mainly attributed to the land use conflict formed by reclaiming land from wetlands in the 1990s (Figure 5b). In 2018, a multi-center distribution pattern of land use spatial conflict hot spots was observed; the conflict intensity displayed a more scattered distribution with many more hotspots appearing. These hot spots were mainly EUs around the built-up land and where the wetlands were sporadically located. From 1998 to 2018, the hot spots showed a more complex distribution pattern, which evolved from a single-center pattern to a multi-center pattern. This revealed that direct occupation of the wetlands had given way to gradual penetration (Figure 5c).
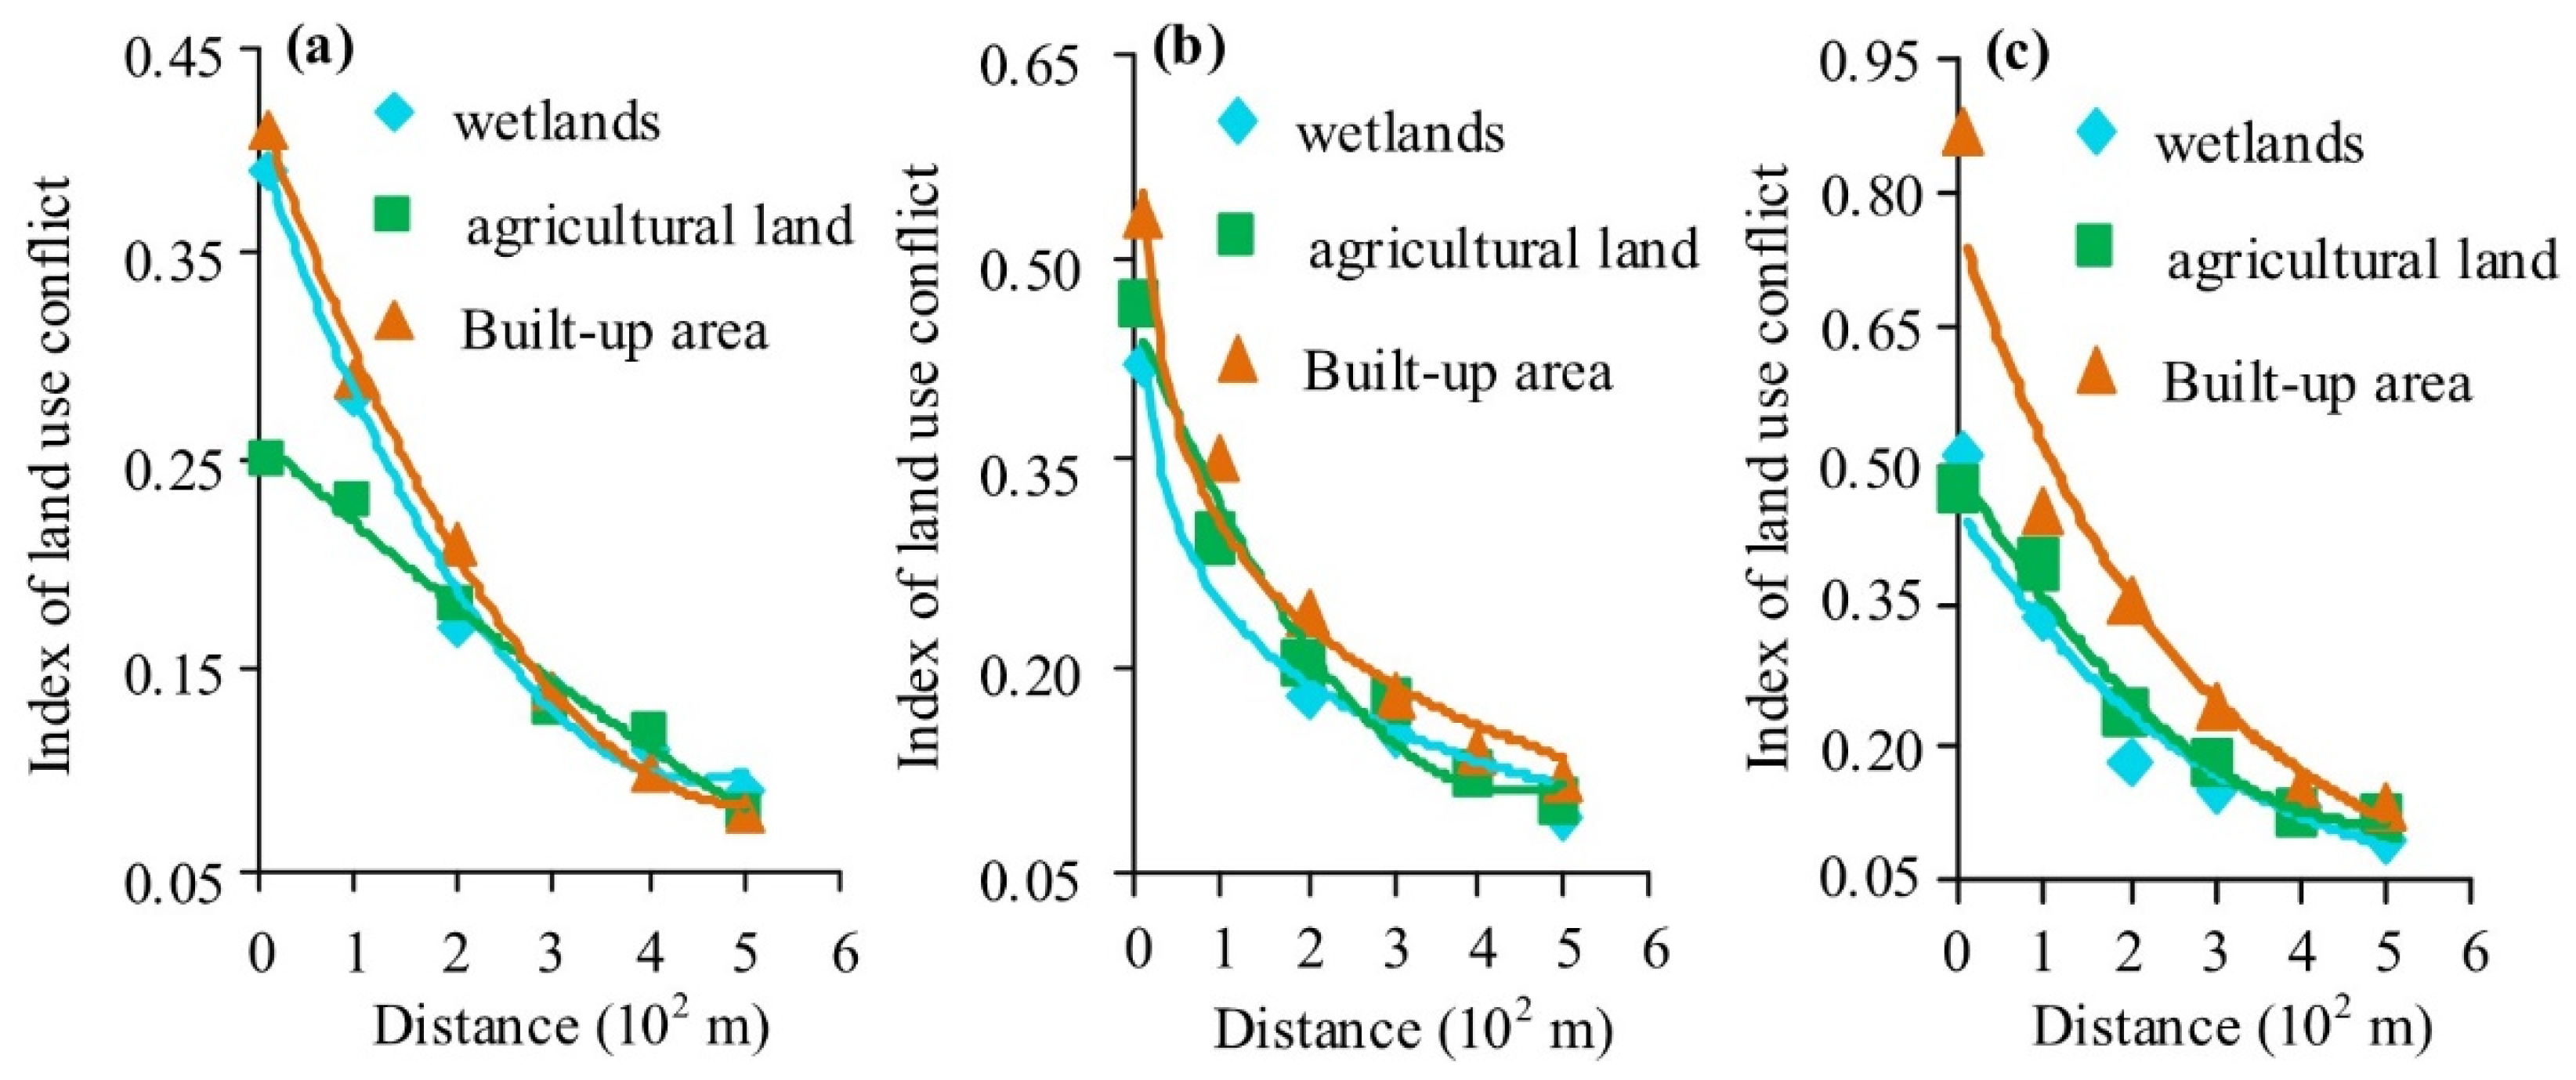
In order to visualize spatial variations of the land use spatial conflict, the characteristics of the distance between the hot spots of the land use spatial conflict to wetlands, built-up land, and agricultural land were assessed. As shown in Figure 6, as the distance increased the composite index of land use spatial conflict decreased and an apparent edge effect was discovered. The land use spatial conflict mainly occurred in the areas where different landscape types overlapped; within the region of homogeneous landscape, conflict was nearly non-existent. In 1978, the composite index was extremely low within a distance of 100 m, which indicated a no-conflict zone (Figure 6a). However, in 1998, the composite index within a distance of 100 m increased considerably. The conflict reached a moderate level, the most significant, at the margins between the wetlands and the agricultural land. The average composite index in the EUs closest to the built-up land was the highest and the pressure exerted by the expansion of the built-up land on other landscape types began to manifest (Figure 6b). The average composite index in the EUs within a distance of 100 m reached the highest level in 2018 when it was severe (Figure 6c). While construction activities became the primary cause of land use spatial conflict, the contradiction between agricultural production and wetland projects was eased.

4. Discussion

4.1. Situation of Wetland Loss in Li-Xia-River Region in the Past 40 Years

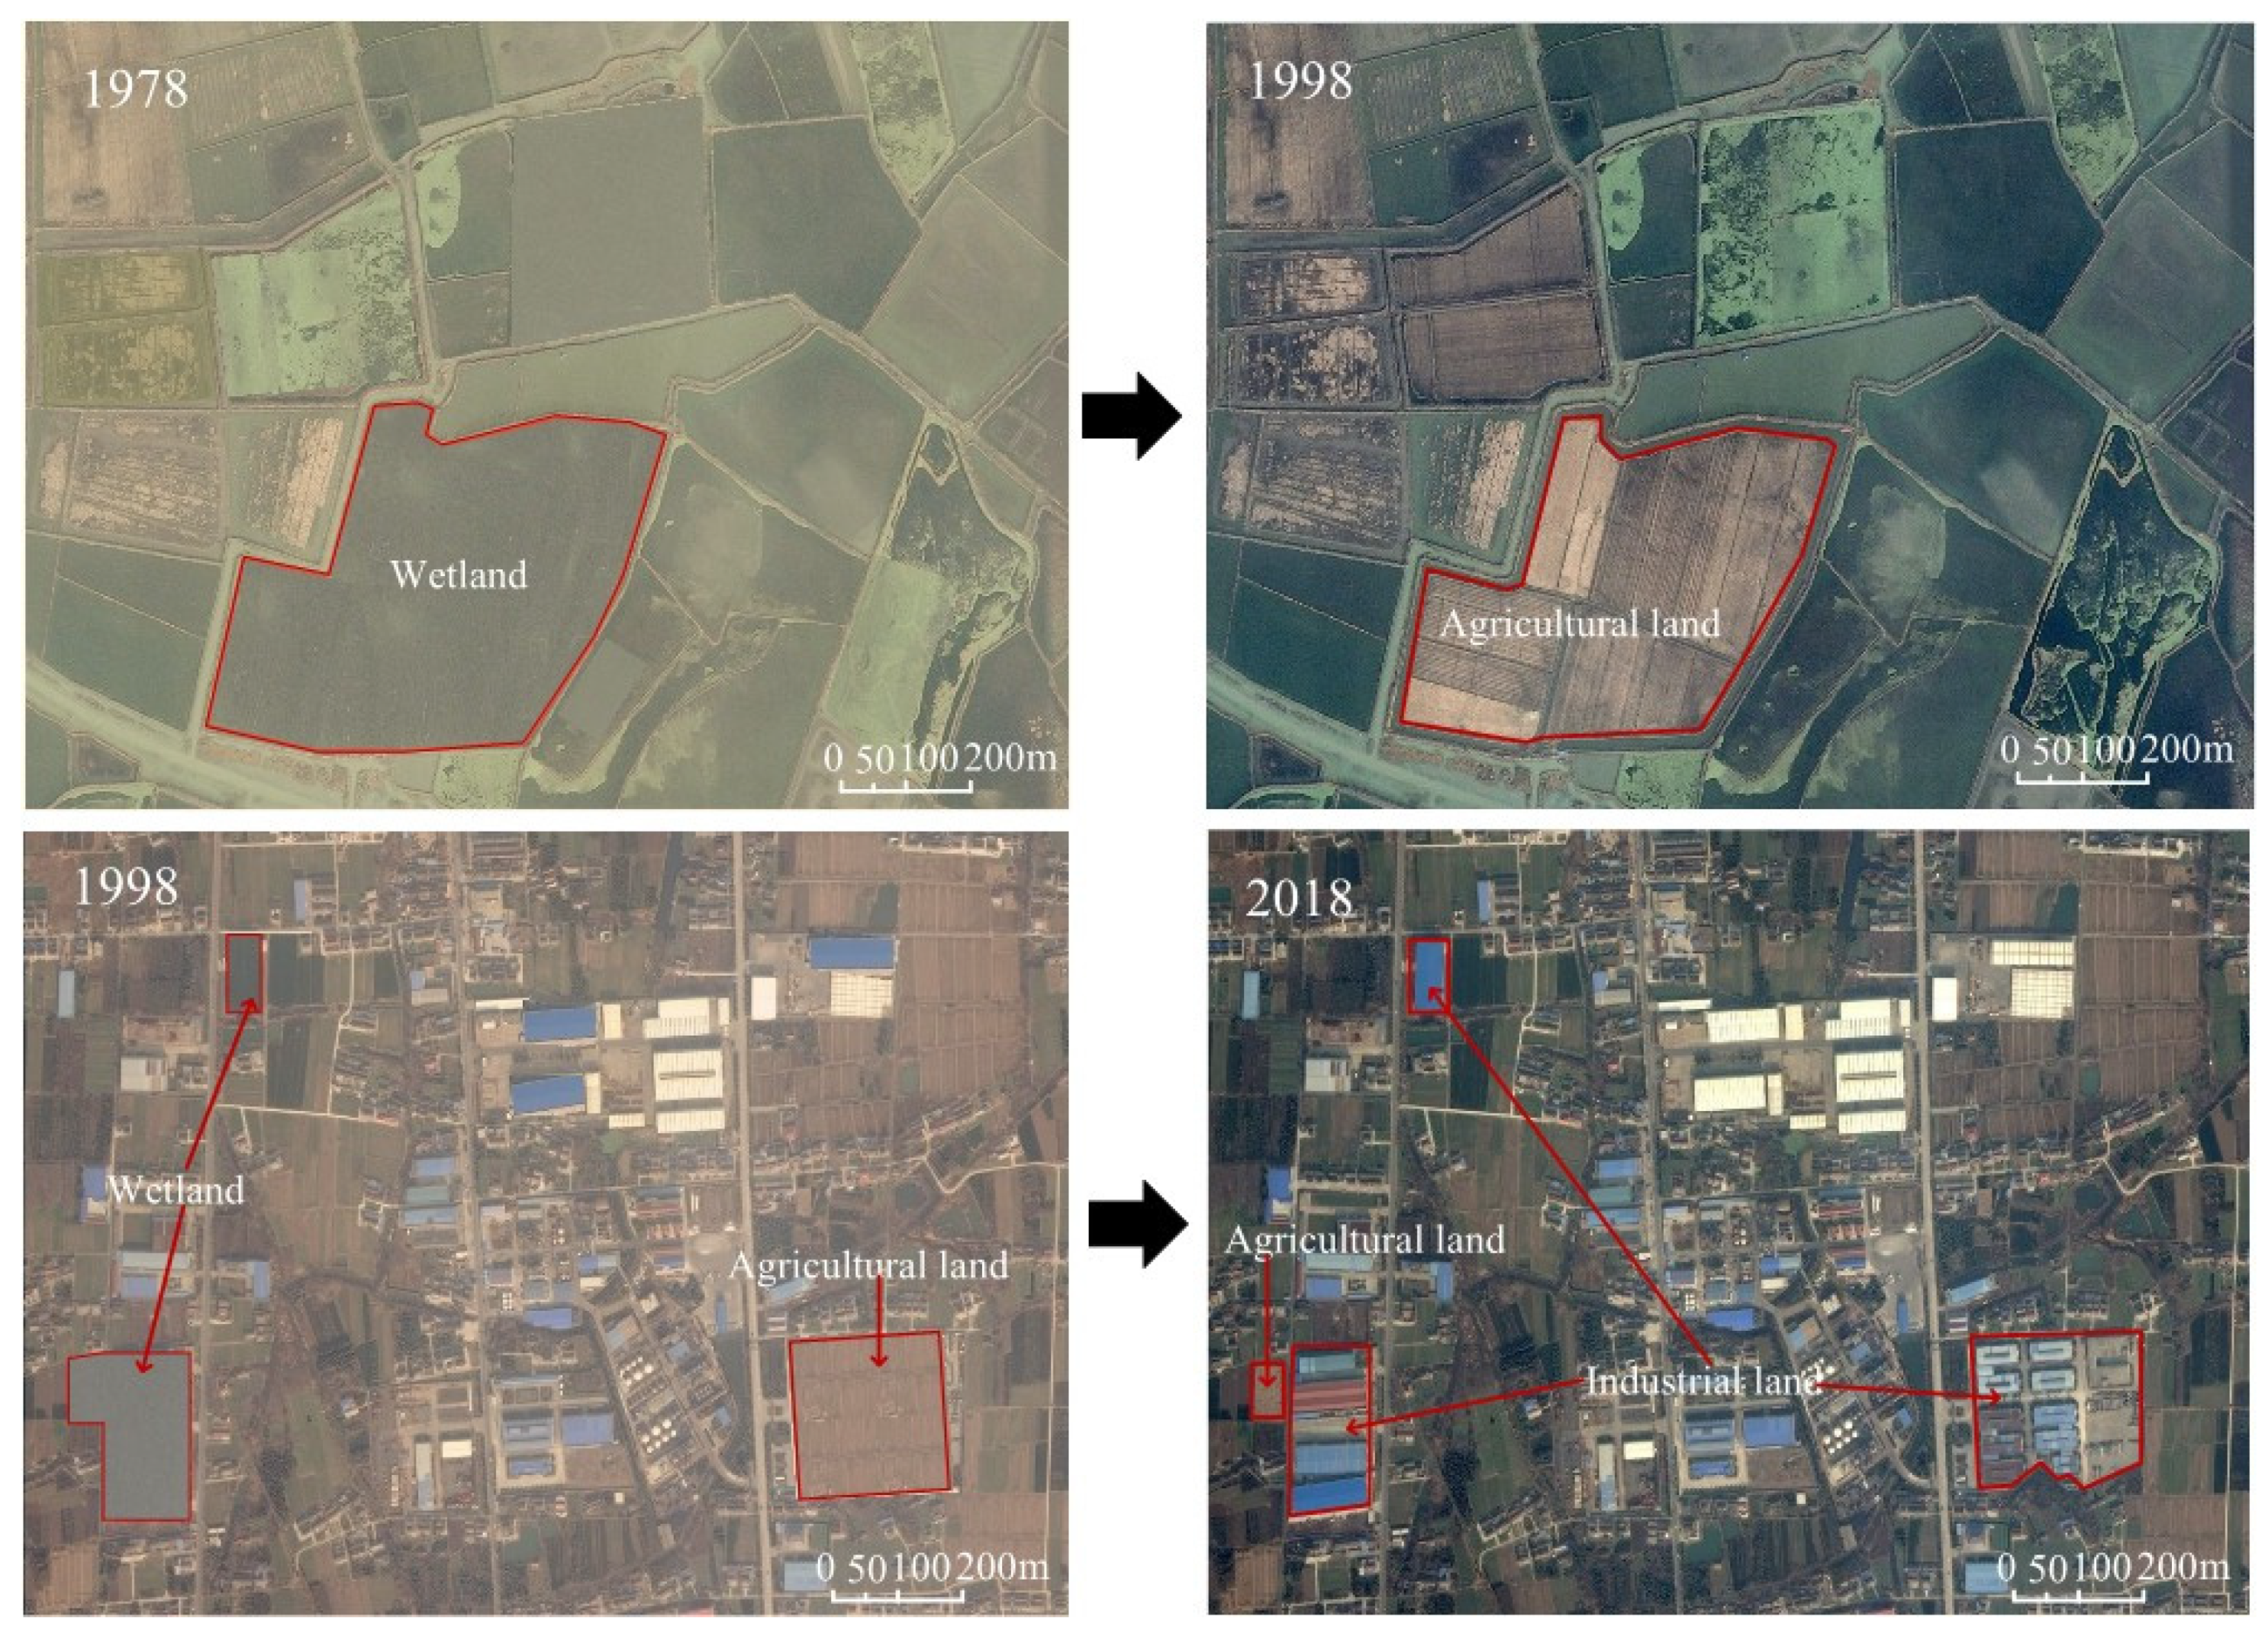
Land use conflict is a widespread problem in the man–land relationship, which results from competition for the limited land resources or the imbalance of land allocation [24,72]. A composite index model of LC considering the factors of external pressure, risk exposure, and internal stability of the landscape was built to estimate the intensity of land use spatial conflict over the years. This model provided an objective depiction of the evolution of land use patterns from 1978 to 2018. In terms of temporal and spatial characteristics, conflict evolved from a balanced distribution pattern with a single source of risk to a more diffuse distribution with multiple sources of risks. Although it was difficult to reproduce LC in history, remote sensing images provided a realistic record of what happened by checking them against identified hot spots of land use spatial conflict (Figure 7). High-level conflict has frequently been attributed to an invasion of a different landscape or dramatic change of land use types. This fact proved the reliability of the composite index model proposed in this study. Land use spatial conflict is a very complex issue that is profoundly impacted by institutional, social, and cultural factors [25,73]. How to use the proposed composite index model to quantitatively account for the complexity of the land use spatial conflict represents an important future topic of research.
An existing study showed that from 1978 to 2008, China’s natural wetlands decreased by 49.3% [47]. In Jiangsu Province alone, the coastal wetlands shrunk by as much as 75.5% [42]. Li-Xia-river Wetlands is located in the center of Jiangsu Province, which is one of the most economically developed areas in China. The land use spatial conflict and ecological risks of Li-Xia-river Wetlands are sometimes staggeringly high in the context of China’s rapid economic development. Although showing a below-average reduction in wetlands compared with other parts of China, 14.3% of Li-Xia-river Wetlands was lost between 1978 and 2018. At the same time, natural wetlands have decreased by 56.7% over the past 40 years. Analysis of the land use spatial conflict can enhance an understanding of the driving forces behind the wetland loss as well as propel the formulation of scientific wetland management strategies.

4.2. Complex Influencing Factors of Land Use Spatial Conflict in Li-Xia-River Wetland

The changes seen in Li-Xia-river Wetlands are resulting from complex interactions between socioeconomic, topographic, climate, and policy factors. As shown in Figure 4 and Figure 5, occupation for agricultural and aquaculture purposes is the main driver of natural wetland loss. As of 2018, the population density of Li-Xia-river Wetlands was 788 people per square kilometer, comparable to the level of a large international metropolis [74]. Constant population growth incurs huge food demands. Under the land use policy that placed food demand as the top concern in the 1980s, extensive areas of land were reclaimed from the wetlands for agricultural production. In the 1980s, the uplands were transformed into paddy fields in a project that was premised upon the diversion of water from the wetlands. The household responsibility contract system provided a solid guarantee of food security. When food shortage was no longer a major concern, national development priorities shifted toward industrialization. Since household-based agricultural producers could not afford the project of reclaiming land from the lakes, the encroachment of wetlands was greatly eased. However, the occurrence of taking water from the wetlands for agricultural production continued and was accompanied by wetland pollution from industrial discharge. Beginning in 1996, China began to implement a socialist market economy. To pursue higher economic benefits, some natural wetlands were transformed into aquaculture areas and artificial wetlands were exploited for lotus plants. These changes aggravated the risk of swamp formation in Li-Xia-river Wetlands [59]. As previously mentioned, land occupation for construction purposes became the leading cause of land use spatial conflict with the trend of industrialization and urbanization. However, after the year 2000, land consolidation projects were fervently carried out. Some water bodies were filled over to form farmland and wetland loss was inevitable [75].
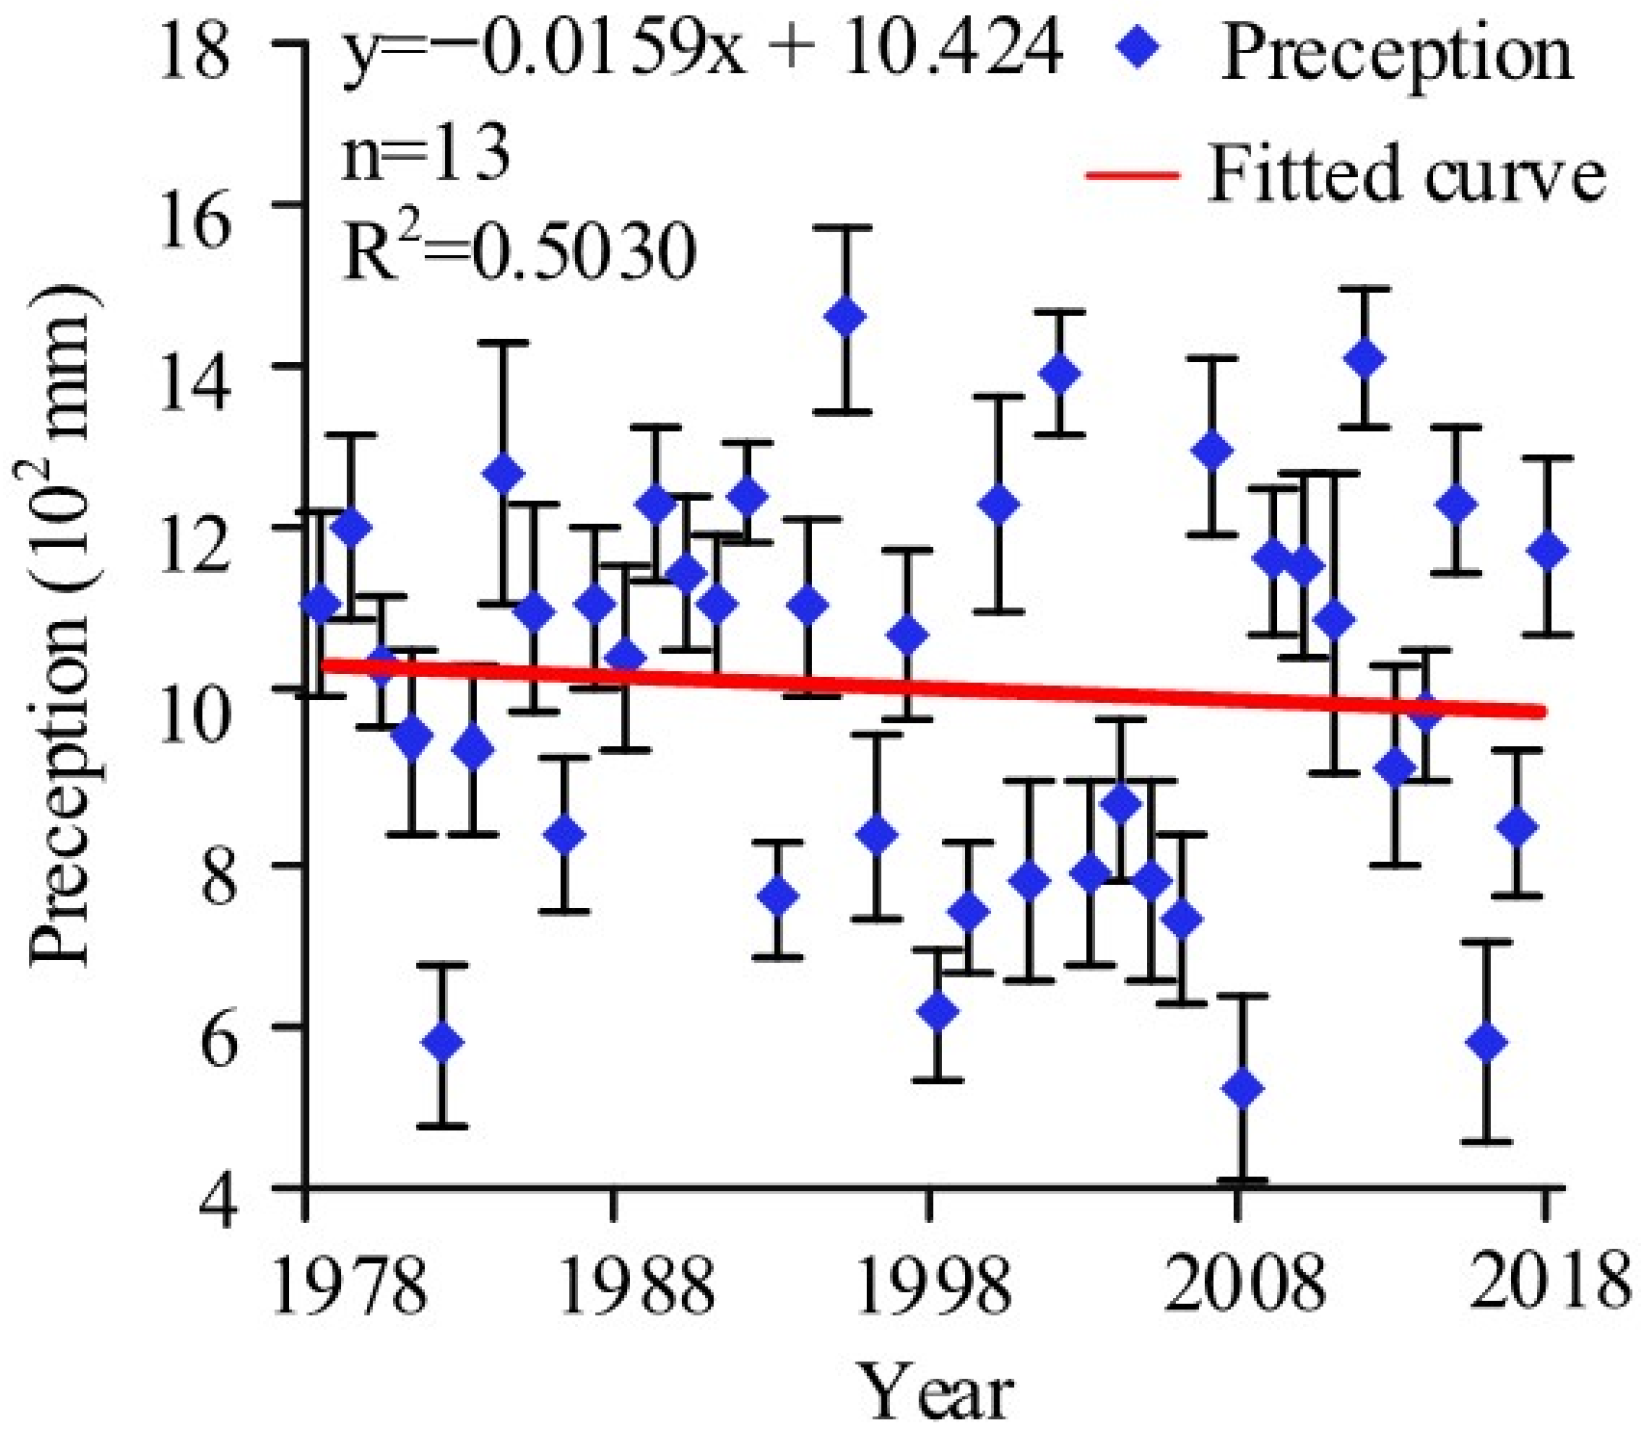
Precipitation is the most important climate factor affecting Li-Xia-river Wetlands. Based on the precipitation records from 13 weather stations during the years of 1978 to 2018, there was a mild decline of precipitation (Figure 8). However, in the past 20 years, the drop in precipitation has become more significant compared with 20 years ago, and global climate change is directly responsible for the precipitation variation. Excessive land reclamation from the lakes has led to their shrinkage and impairment to the regulation and storage capacity of the wetlands. Industrialization and urbanization have altered the properties of the underlying surfaces and amplified the risk of flooding. The construction of sluice gates and dams is likely to cause river channel sedimentation and reduction of the waterlogging drainage capacity. Floods and droughts create greater risks for wetland protection and regional economic development.

4.3. Uncertainty Analysis of Land Use Spatial Conflict and Expectation

Although many landscape indexes have been developed previously, it is difficult to directly reflect the spatial conflict of land use [64,66,67]. In this study, the spatial conflict is summarized as external pressure + spatial exposure—spatial stability, and the ecological risk assessment and landscape ecological index method are introduced into the land use spatial conflict estimation model. This not only increases the objectivity and repeatability of the evaluation results, but also makes them more rapid, visual, and less effort. However, the model needs long time series and high-precision land use data, which limits its applicability to a certain extent. Remote sensing images can help it play a role in large-scale land use planning and ecological protection.
In addition, a wetlands protection policy is the most important non-technical means to reduce land use conflict. The Ministry of Environmental Protection formulated the China National Wetland Conservation Action Plan in 2000, along with 18 regulations and laws involving natural resource protection. In June 2004, the General Office of the State Council issued the Notice on Strengthening the Management of Wetland Protection. These efforts collectively contribute to wetland conservation. A comprehensive ecological conservation plan for Li-Xia-river Wetlands is currently under discussion in response to our suggestion in 2021. The next steps towards implementation for sustainable wetland management and protection is to change the existing planting structure, boost efforts to return marshes to lakes, flush away the silt by means of diversion of the Yangtze River, and build an effective management system for the river ecosystem. The new conservation strategy is expected to serve as a feasibility plan for landscape protection and regional sustainable development of Li-Xia-river Wetlands.

5. Conclusions

Li-Xia-river Wetlands are the most important freshwater marsh in East China and serves as an overwintering site for migrant birds from the north. With a population of 11 million people, the Li-Xia-river Wetlands is not only important for biodiversity conservation but also for ensuring the welfare of residents and future sustainable development. A composite index model of land use spatial conflict for Li-Xia-river Wetlands was constructed using a conceptual model of risk assessment, which was based on the sources, victims, and effects of the risk. This model successfully assessed the level of land use spatial conflict in Li-Xia-river Wetlands for the years 1978 to 2018 and accurately traced the hot spots of spatial conflict for the past 40 years. These research findings can provide support for formulating wetland protection strategies and to ensure regional sustainable development in this region in the future.

Author Contributions

Conceptualization, F.C.; data curation, X.G. and J.L.; funding acquisition, F.C.; investigation, J.L. and Y.C.; methodology, J.L. and Y.C.; project administration, F.C.; software, X.G.; supervision, F.C.; visualization, G.-J.L.; writing—original draft, Y.S. and Y.C.; writing—review and editing, G.-J.L. and F.C. All authors have read and agreed to the published version of the manuscript.

Funding

This work was supported by the Key Projects in the National Science & Technology Pillar Program during the Twelfth Five-year Plan Period (2015BAD06B02). In addition, the authors would like to thank the Bureau of Land and Resources of Jiangsu Province for the support during the research. There is no conflict of interest in this manuscript.

Institutional Review Board Statement

Not applicable.

Informed Consent Statement

Not applicable.

Data Availability Statement

Not applicable.

Conflicts of Interest

The authors declare no conflict of interest.

References

  1. Gibbs, J.P. Wetland loss and biodiversity conservation. Conserv. Biol. 2000, 14, 314–317. [Google Scholar] [CrossRef] [Green Version]
  2. Trebitz, A.S.; Morrice, J.A.; Taylor, D.L.; Anderson, R.L.; West, C.W.; Kelly, J.R. Hydromorphic determinants of aquatic habitat variability in Lake Superior coastal wetlands. Wetlands 2005, 25, 505–519. [Google Scholar] [CrossRef]
  3. De Jong, L.; De Bruin, S.; Knoop, J.; van Vliet, J. Understanding land-use change conflict: A systematic review of case studies. J. Land Use Sci. 2021, 16, 223–239. [Google Scholar] [CrossRef]
  4. Costanza, R.; d’Arge, R.; de Groot, R.; Farber, S.; Grasso, M.; Hannon, B.; Limburg, K.; Naeem, S.; O’Neill, R.V.; Paruelo, J.; et al. The value of the world’s ecosystem services and natural capital. Nature 1997, 387, 253–260. [Google Scholar] [CrossRef]
  5. Kayranli, B.; Scholz, M.; Mustafa, A.; Hedmark, Å. Carbon Storage and Fluxes within Freshwater Wetlands: A Critical Review. Wetlands 2010, 30, 111–124. [Google Scholar] [CrossRef]
  6. Mukherjee, K.; Pal, S. Hydrological and landscape dynamics of floodplain wetlands of the Diara region, Eastern India. Ecol. Indic. 2021, 121, 106961. [Google Scholar] [CrossRef]
  7. Festus, O.O.; Ji, W.; Zubair, P.A. Characterizing the Landscape Structure of Urban Wetlands Using Terrain and Landscape Indices. Land 2020, 9, 29. [Google Scholar] [CrossRef] [Green Version]
  8. Hey, D.L.; Philippi, N.S. Flood reduction through wetland restoration: The upper Mississippi river basin as a case history. Restor. Ecol. 1995, 3, 4–17. [Google Scholar] [CrossRef]
  9. Zou, L.L.; Liu, Y.S.; Wang, J.Y.; Yang, Y.Y. An analysis of land use conflict potentials based on ecological-production-living function in the southeast coastal area of China. Ecol. Indic. 2021, 122, 107297. [Google Scholar] [CrossRef]
  10. Kelvin, J.; Acreman, M.C.; Harding, R.J.; Hess, T.M. Micro-climate influence on reference evapotranspiration estimates in wetlands. Hydrolog. Sci. 2017, 62, 378–388. [Google Scholar] [CrossRef] [Green Version]
  11. Bunn, S.E.; Davies, P.M.; Mosisch, T.D. Ecosystem measures of river health and their response to riparian and catchment degradation. Freshwater Biol. 1999, 41, 333–345. [Google Scholar] [CrossRef] [Green Version]
  12. Tian, P.; Cao, L.D.; Li, J.L.; Pu, R.L.; Gong, H.B.; Li, C.D. Landscape Characteristics and Ecological Risk Assessment Based on Multi-Scenario Simulations: A Case Study of Yancheng Coastal Wetland, China. Sustainability 2021, 13, 149. [Google Scholar] [CrossRef]
  13. Samsó, R.; Garcia, J. BIO_PORE, a mathematical model to simulate biofilm growth and water quality improvement in porous media: Application and calibration for constructed wetlands. Ecol. Eng. 2013, 54, 116–127. [Google Scholar] [CrossRef]
  14. Jiang, S.; Meng, J.J.; Zhu, L.K. Spatial and temporal analyses of potential land use conflict under the constraints of water resources in the middle reaches of the Heihe River. Land Use Policy 2020, 97, 104773. [Google Scholar] [CrossRef]
  15. Jeng, H.; Hong, Y. Assessment of a natural wetland for use in wastewater remediation. Environ. Monit. Assess. 2005, 111, 113–131. [Google Scholar] [CrossRef]
  16. Guidolini, J.; Ometto, J.; Arcoverde, G.; Giarolla, A. Environmental Land Use Conflicts in a Macroscale River Basin: A Preliminary Study Based on the Ruggedness Number. Water 2020, 12, 1222. [Google Scholar] [CrossRef]
  17. Finlayson, M.; Cruz, R.D.; Davidson, N.; Alder, J.; Cork, S.; de Groot, R.S.; Lévêque, C.; Milton, G.R.; Peterson, G.; Pritchard, D.; et al. Millennium Ecosystem Assessment. Ecosystems and Human Well-Being: Wetlands and Water Synthesis; World Resources Institute: Washington, DC, USA, 2005. [Google Scholar]
  18. Richards, D.R.; Friessa, D.A. Rates and drivers of mangrove deforestation in Southeast Asia, 2000–2012. Proc. Natl. Acad. Sci. USA 2016, 113, 344–349. [Google Scholar] [CrossRef] [Green Version]
  19. Tao, S.; Fang, J.; Zhao, X.; Zhao, S.; Shen, H.; Hu, H.; Tang, Z.; Wang, Z.; Guo, Q. Rapid loss of lakes on the Mongolian Plateau. Proc. Natl. Acad. Sci. USA 2015, 112, 2281–2286. [Google Scholar] [CrossRef] [Green Version]
  20. Treat, C.C.; Wollheim, W.M.; Varner, R.K.; Grandy, A.S.; Talbot, J.; Frolking, S. Temperature and peat type control CO2 and CH4 production in Alaskan permafrost peats. Glob. Chang. Biol. 2014, 20, 2674–2686. [Google Scholar] [CrossRef]
  21. McCauley, L.A.; Jenkins, D.G.; Quintana-Ascencio, P.F. Isolated wetland loss and degradation over two decades in an increasingly urbanized landscape. Wetlands 2013, 33, 117–127. [Google Scholar] [CrossRef]
  22. Sica, Y.V.; Quintana, R.D.; Radeloff, V.C.; Gavier-Pizarro, G.I. Wetland loss due to land use change in the Lower Paraná River Delta, Argentina. Sci. Total Environ. 2016, 568, 867–978. [Google Scholar] [CrossRef]
  23. Ahani, S.; Dadashpoor, H. Land conflict management measures in peri-urban areas: A meta-synthesis review. J. Environ. Plan. Manag. 2021, 64, 1909–1939. [Google Scholar] [CrossRef]
  24. Fang, C.; Liu, H. The spatial privation and the corresponding controlling paths in China’s urbanization process. Acta Geogr. Sin. Chin. Ed. 2007, 62, 67–78. [Google Scholar]
  25. Campbell, D.J.; Gichohi, H.; Mwangi, A.; Chege, L. Land use conflict in Kajiado district, Kenya. Land Use Policy 2000, 17, 337–348. [Google Scholar] [CrossRef]
  26. Brown, G.; Raymond, C.M. Methods for identifying land use conflict potential using participatory mapping. Landsc. Urban Plan. 2014, 122, 196–208. [Google Scholar] [CrossRef]
  27. Jing, W.L.; Yu, K.H.; Wu, L.; Luo, P.P. Potential Land Use Conflict Identification Based on Improved Multi-Objective Suitability Evaluation. Remote Sens. 2021, 13, 2416. [Google Scholar] [CrossRef]
  28. Kristina, D.; Bettina, E. Analysing land conflicts in times of global crises. Geoforum 2020, 111, 208–217. [Google Scholar]
  29. Schnaiberg, J.; Riera, J.; Turner, M.G.; Voss, P.R. Explaining human settlement patterns in a recreational lake district: Vilas County, Wisconsin, USA. J. Environ. Manag. 2002, 30, 24–34. [Google Scholar] [CrossRef]
  30. Zedler, J.B.; Kercher, S. Wetland resources: Status, trends, ecosystem services and restorability. Annu. Rev. Envrion. Resour. 2005, 30, 39–74. [Google Scholar] [CrossRef] [Green Version]
  31. Yang, M.; Gong, J.G.; Zhao, Y.; Wang, H.; Zhao, C.P.; Yang, Q.; Yin, Y.S.; Wang, Y.; Tian, B. Landscape Pattern Evolution Processes of Wetlands and Their Driving Factors in the Xiong’an New Area of China. Int. J. Environ. Res. Public Health 2021, 18, 4403. [Google Scholar] [CrossRef]
  32. Zhang, X.J.; Wang, G.Q.; Xue, B.L.; Zhang, M.X.; Tan, Z.X. Dynamic landscapes and the driving forces in the Yellow River Delta wetland region in the past four decades. Sci. Total Environ. 2021, 787, 147644. [Google Scholar] [CrossRef]
  33. Lu, Q.; Kang, L.; Shao, H.; Zhao, Z.; Chen, Q.; Bi, X.; Shi, P. Investigating marsh sediment dynamics and its driving factors in Yellow River delta for wetland restoration. Ecol. Eng. 2016, 90, 307–313. [Google Scholar] [CrossRef]
  34. Zeng, X.T.; Huang, G.H.; Yang, X.L.; Wang, X.; Fu, H.; Li, Y.P.; Li, Z. A developed fuzzy-stochastic optimization for coordinating human activity and eco-environmental protection in a regional wetland ecosystem under uncertainties. Ecol. Eng. 2016, 97, 207–230. [Google Scholar] [CrossRef]
  35. Ma, W.Q.; Jiang, G.G.; Chen, Y.H.; Qu, Y.B.; Zhou, T.; Li, W.Q. How feasible is regional integration for reconciling land use conflicts across the urban–rural interface? Evidence from Beijing–Tianjin–Hebei metropolitan region in China. Land Use Policy 2020, 92, 104433. [Google Scholar] [CrossRef]
  36. Davidson, N.C.; Finlayson, C.M. Earth observation for wetland inventory, assessment and monitoring. Aquat. Conserv. Mar. Freshw. Ecosyst. 2007, 17, 219–228. [Google Scholar] [CrossRef]
  37. Brown, G.; Fagerholm, N. Empirical PPGIS/PGIS mapping of ecosystem services: A review and evaluation. Ecosyst. Serv. 2015, 13, 119–133. [Google Scholar] [CrossRef]
  38. Qin, P.; Zhang, Z.H. Evolution of wetland landscape disturbance in Jiaozhou Gulf between 1973 and 2018 based on remote sensing. Eur. J. Remote Sens. 2021, 54, 145–154. [Google Scholar] [CrossRef]
  39. Chan, K.K.Y.; Xu, B. Perspective on remote sensing change detection of Poyang Lake wetland. Ann. GIS 2013, 19, 231–243. [Google Scholar] [CrossRef]
  40. Scott, D.A.; Jones, T.A. Classification and inventory of wetlands: A global overview. Vegetatio 1995, 118, 3–16. [Google Scholar] [CrossRef]
  41. Lehner, B.; Döll, P. Development and validation of a global database of lakes, reservoirs and wetlands. J. Hydrol. 2004, 296, 1–22. [Google Scholar] [CrossRef]
  42. Gong, P.; Wang, J.; Yu, L.; Zhao, Y.; Zhao, Y.; Liang, L.; Niu, Z.; Huang, X.; Fu, H.; Liu, S.; et al. Finer resolution observation and monitoring of global land cover: First mapping results with Landsat TM and ETM+ data. Int. J. Remote Sens. 2013, 34, 2607–2654. [Google Scholar] [CrossRef] [Green Version]
  43. Davidson, N.C. How much wetland has the world lost? Long-term and recent trends in global wetland area. Mar. Freshw. Res. 2014, 65, 934–941. [Google Scholar] [CrossRef]
  44. Heffernan, J.B.; Soranno, P.A.; Angilletta Jr, M.J.; Buckley, L.B.; Gruner, D.S.; Keitt, T.H.; Kellner, J.R.; Kominoski, J.S.; Rocha, A.V.; Xiao, J.; et al. Macrosystems ecology: Understanding ecological patterns and processes at continental scales. Front. Ecol. Environ. 2014, 12, 5–14. [Google Scholar] [CrossRef] [Green Version]
  45. Susman, R.; Gütte, A.M.; Weith, T. Drivers of Land Use Conflicts in Infrastructural Mega Projects in Coastal Areas: A Case Study of Patimban Seaport, Indonesia. Land 2021, 10, 615. [Google Scholar] [CrossRef]
  46. Kuang, W.; Liu, J.; Dong, J.; Chi, W.; Zhang, C. The rapid and massive urban and industrial land expansions in China between 1990 and 2010: A CLUD-based analysis of their trajectories, patterns, and drivers. Landsc. Urban Plan. 2016, 145, 21–33. [Google Scholar] [CrossRef]
  47. Niu, Z.; Zhang, H.; Wang, X.; Yao, W.; Zhou, D.; Zhao, K.; Zhao, H.; Li, N.; Huang, H.; Li, C.; et al. Mapping wetland changes in China between 1978 and 2008. Chin. Sci. Bull. 2013, 57, 2813–2823. [Google Scholar] [CrossRef] [Green Version]
  48. An, S.; Li, H.; Guan, B.; Zhou, C.; Wang, Z.; Deng, Z.; Zhi, Y.; Liu, Y.; Xu, C.; Fang, S.; et al. China’s natural wetlands: Past problems, current status, and future challenges. AMBIO J. Hum. Environ. 2007, 36, 335–342. [Google Scholar] [CrossRef] [Green Version]
  49. Xu, C.; Sheng, S.; Zhou, W.; Cui, L.; Liu, M. Characterizing wetland change at landscape scale in Jiangsu Province, China. Environ. Monit. Assess. 2011, 179, 279–292. [Google Scholar] [CrossRef]
  50. Cui, L.L.; Li, G.S.; Chen, Y.H.; Li, L.G. Response of Landscape Evolution to Human Disturbances in the Coastal Wetlands in Northern Jiangsu Province, China. Remote Sens. 2021, 13, 2030. [Google Scholar] [CrossRef]
  51. Cui, J.X.; Kong, X.S.; Chen, J.; Sun, J.W.; Zhu, Y.Y. Spatially Explicit Evaluation and Driving Factor Identification of Land Use Conflict in Yangtze River Economic Belt. Land 2021, 10, 43. [Google Scholar] [CrossRef]
  52. Bossuyt, F.; Meegaskumbura, M.; Beenaerts, N.; Gower, D.J.; Pethiyagoda, R.; Roelants, K.; Mannaert, A.; Wilkinson, M.; Bahir, M.M.; Manamendra-Arachchi, K.; et al. Local endemism within the Western Ghats-Sri Lanka biodiversity hotspot. Science 2004, 306, 479–481. [Google Scholar] [CrossRef] [Green Version]
  53. Nelson, T.A.; Boots, B. Detecting spatial hot spots in landscape ecology. Ecography 2008, 31, 556–566. [Google Scholar] [CrossRef]
  54. Herold, M.; Goldstein, N.C.; Clarke, K.C. The spatiotemporal form of urban growth: Measurement, analysis and modeling. Remote Sens. Environ. 2003, 86, 286–302. [Google Scholar] [CrossRef]
  55. Jiangsu Forestry Bureau. Report of Wetland Inventory of Jiangsu Province. Jiangsu Forestry Bureau. Available online: http://lyj.jiangsu.gov.cn/art/2010/3/22/art_7147_3003201.html. (accessed on 22 March 2010).
  56. Gao, Y.; Wang, J.M.; Zhang, M.; Li, S.J. Measurement and prediction of land use conflict in an opencast mining area. Resour. Policy 2021, 71, 101999. [Google Scholar] [CrossRef]
  57. Hargis, C.D.; Bissonette, J.A.; David, J.L. The behavior of landscape metrics commonly used in the study of habitat fragmentation. Landsc. Ecol. 1998, 13, 167–186. [Google Scholar] [CrossRef]
  58. Aronson, J.; Clewell, A.; Moreno-Mateos, D. Ecological restoration and ecological engineering: Complementary or indivisible? Ecol. Eng. 2016, 91, 392–395. [Google Scholar] [CrossRef] [Green Version]
  59. Sheng, S.; Xu, C.; Zhang, S.; An, S.; Liu, M.; Yang, X. Hot spots of wetland vegetation reduction in relation to human accessibility: Differentiating human impacts on natural ecosystems at multiple scales. Environ. Earth Sci. 2012, 65, 1965–1975. [Google Scholar] [CrossRef]
  60. Cong, P.F.; Chen, K.X.; Qu, L.M.; Han, J.B.; Yang, Z.X. Determination of landscape ecological network of wetlands in the Yellow river delta. Wetlands 2020, 40, 2729–2739. [Google Scholar] [CrossRef]
  61. Guo, H.G.; Cai, Y.P.; Yang, Z.F.; Zhu, Z.C.; Ouyang, Y.R. Dynamic simulation of coastal wetlands for Guangdong-Hong Kong-Macao Greater Bay area based on multi-temporal Landsat images and FLUS model. Ecol. Indic. 2021, 125, 107559. [Google Scholar] [CrossRef]
  62. Huang, D.P.; Liu, C.; Fang, H.J.; Peng, S.F. Assessment of waterlogging risk in LiXiahe region of Jiangsu Province based on AVHRR and MODIS image. Chin. Geogr. Sci. 2008, 18, 178–183. [Google Scholar] [CrossRef] [Green Version]
  63. Ling, S. Study on changes of sheyang lake in historical periods. J. Lake Sci. 1993, 5, 225–233. [Google Scholar]
  64. Obery, A.M.; Landis, W.G. A regional multiple stressor risk assessment of the Codorus creek watershed applying the relative risk model. Hum. Ecol. Risk Assess. 2002, 8, 405–428. [Google Scholar] [CrossRef]
  65. Serveiss, V.B. Applying ecological risk principles to watershed assessment and management. Environ. Manag. 2002, 29, 145–154. [Google Scholar] [CrossRef]
  66. Peng, J.; Zhou, G.; Tang, C.; He, Y. The analysis of spatial conflict measurement in fast urbanization region based on ecological security: A case study of Changsha-Zhuzhou-Xiangtan urban. J. Nat. Resour. 2012, 27, 1507–1519. [Google Scholar]
  67. Peterseil, J.; Wrbka, T.; Plutzar, C.; Schmitzberger, I.; Kiss, A.; Szerencsits, E.; Reiter, K.; Schneider, W.; Suppan, F.; Beissmann, H. Evaluating the ecological sustainability of Austrian agricultural landscapes—The SINUS approach. Land Use Policy 2004, 21, 307–320. [Google Scholar] [CrossRef]
  68. Swanström, N.L.P.; Weissmann, M. Conflict, Conflict Prevention, Conflict Management and Beyond: A Conceptual Exploration; Central Asia-Caucasus Institute & Silk Road Studies Program: Washington, DC, USA, 2005. [Google Scholar]
  69. Barnaud, C.; Page, C.L.; Dumrongrojwatthana, P.; Trébuil, G. Spatial representations are not neutral: Lessons from a participatory agent-based modelling process in a land-use conflict. Environ. Modell. Softw. 2013, 45, 150–159. [Google Scholar] [CrossRef]
  70. Dai, X.; Zhou, Y.; Ma, W.; Zhou, L. Influence of spatial variation in land-use patterns and topography on water quality of the rivers inflowing to Fuxian Lake, a large deep lake in the plateau of southwestern China. Ecol. Eng. 2017, 99, 417–428. [Google Scholar] [CrossRef]
  71. NSBC. China Statistical Yearbook. National Bureau of Statistics of China. Available online: http://www.stats.gov.cn/tjsj/ndsj/2016/indexch.htm (accessed on 1 September 2021).
  72. Chen, W.; Sun, W.; Zhao, H. The spatial imbalanced pattern and state assessment of regional development. Acta Geogr. Sin. 2010, 65, 1209–1217. [Google Scholar]
  73. Zhou, D.; Xu, J.; Lin, Z. Conflict or coordination? Assessing land use multi-functionalization using production-living-ecology analysis. Sci. Total Environ. 2017, 577, 136–147. [Google Scholar] [CrossRef]
  74. Batty, M. The Size, Scale, and Shape of Cities. Science 2008, 319, 769–771. [Google Scholar] [CrossRef] [Green Version]
  75. Zhang, Z.; Zhao, W.; Gu, X. Changes resulting from a land consolidation project (LCP) and its resource–environment effects: A case study in Tianmen City of Hubei Province, China. Land Use Policy 2014, 40, 74–82. [Google Scholar] [CrossRef]
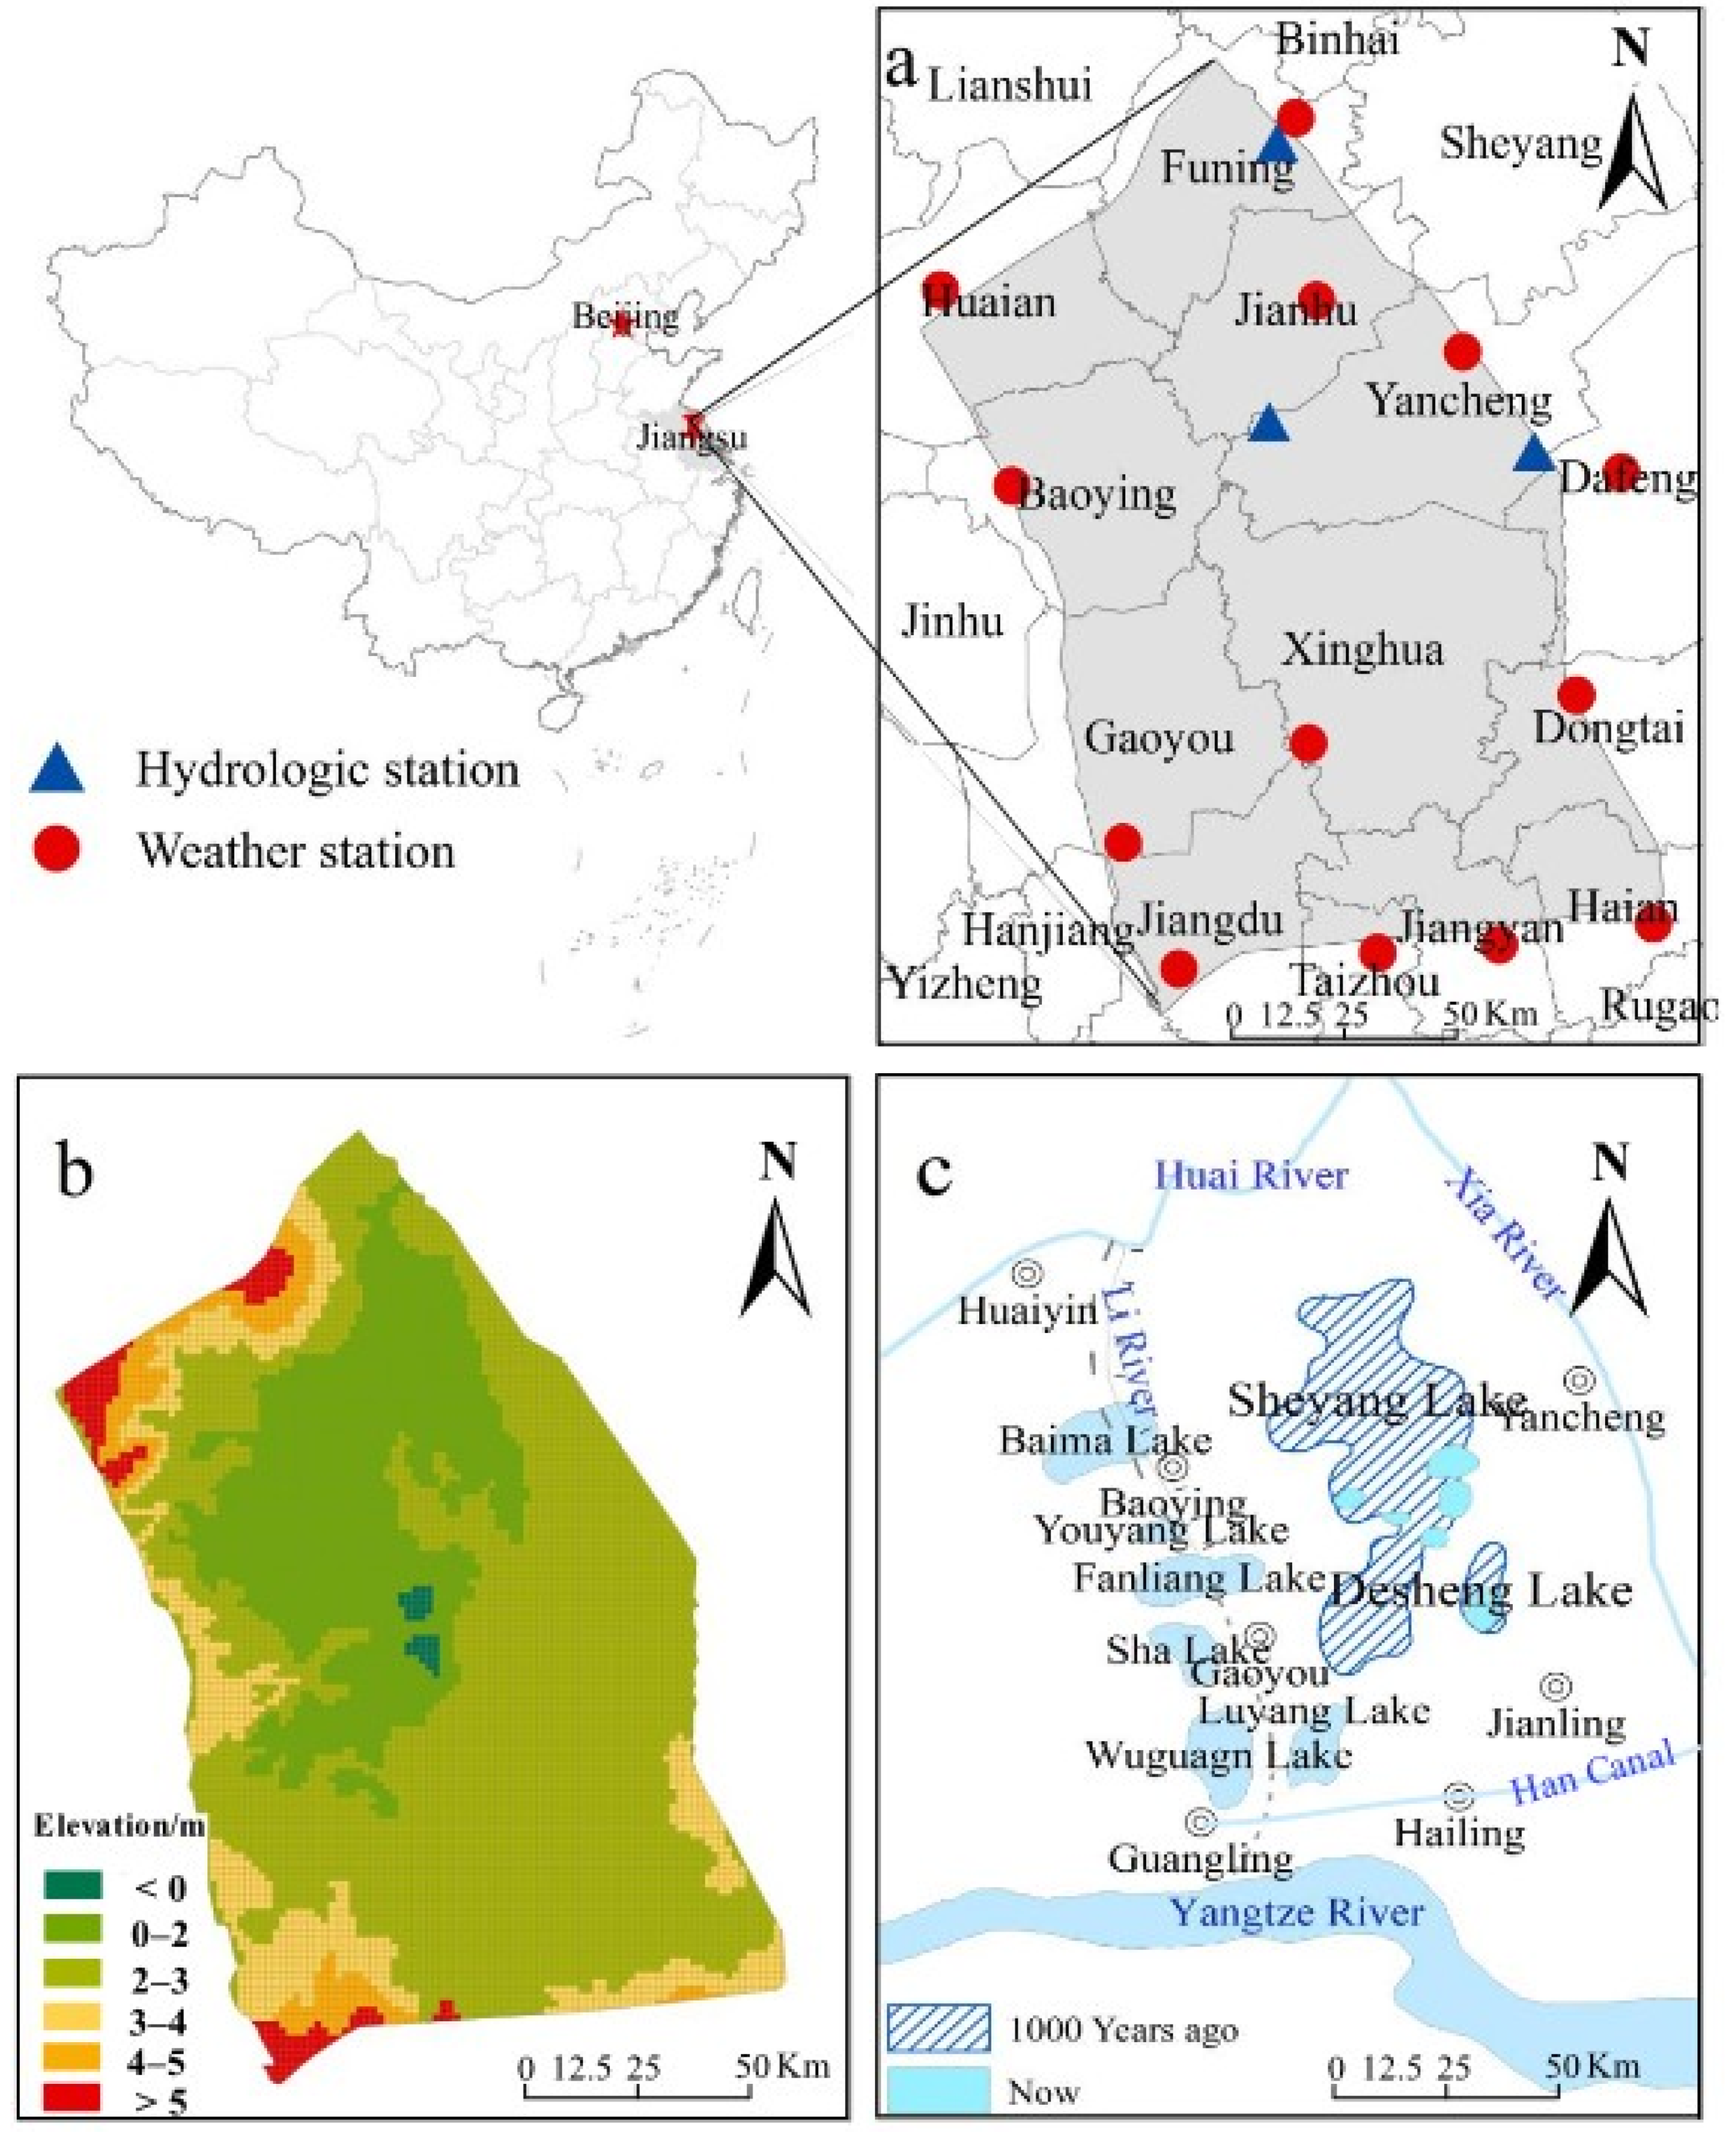
Figure 1. Location map (a), topographic characteristics (b), and river system (c) of the study area.
Sustainability 13 11189 g001
Figure 2. Analytical framework for land use conflict in Li-Xia-river Wetlands.
Sustainability 13 11189 g002
Figure 3. Landscape types of Li-Xia-river Wetlands in 1978 (a), 1998 (b), and 2018 (c).
Sustainability 13 11189 g003
Figure 4. Chord plot of the landscape changes matrix in Li-Xia-river Wetlands from 1978 to 2018. Note: AL represents agricultural land, BL represents built-up land, WL represents wetland, and – represents land use conversion.
Sustainability 13 11189 g004
Figure 5. Changes of land use spatial conflict index in 1978 (a), 1998 (b), and 2018 (c).
Sustainability 13 11189 g005
Figure 6. Changes of composite index of spatial conflict in 1978 (a), 1998 (b), and 2018 (c).
Sustainability 13 11189 g006
Figure 7. Comparison of representative hotspots of land use conflict against remote sensing images.
Sustainability 13 11189 g007
Figure 8. The mean precipitation change of 13 weather stations in Li-Xia-river Wetlands.
Sustainability 13 11189 g008
Table 1. Information of Landsat images.
Date of ImagingStripe Number (Path/Row)Sensor TypeResolution (m)
1978-07-05, 1978-09-16 128/37, 129/37 Landsat MSS 79
1998-05-30, 1998-07-26 120/37, 119/37 Landsat TM 30
2018-08-02, 2018-10-12 119/37, 120/37 Landsat OLI 30
Table 2. The index of land use conflict in Li-Xia-river Wetlands from 1978 to 2018.
Value Range of EUs197819982018Level of Conflict
Number%Number%Number%
0–0.3010,03888.34853273.52817071.90No conflict
0.30–0.60116110.22133915.50159314.02Mild conflict
0.60–0.851471.2911449.30117010.30Moderate conflict
0.85–1.0170.153481.684303.78Severe conflict
Average0.150.260.35
Sum11,36310011,36310011,363100
Publisher’s Note: MDPI stays neutral with regard to jurisdictional claims in published maps and institutional affiliations.