Article

Culturally Diverse Street-Level Urban Activities through the Lens of Digital Footprints

by
Pablo Martí
1,
Leticia Serrano-Estrada
1,* and
Mohsen Aboutorabi
2
1
Urban Design and Regional Planning Unit, Building Sciences and Urbanism Department, University of Alicante, 03690 San Vicente del Raspeig, Alicante, Spain
2
School of Architecture, Faculty of Arts, Design, and Media, Birmingham City University, Birmingham B5 5JU, UK
*
Author to whom correspondence should be addressed.
Sustainability 2021, 13(20), 11141; https://doi.org/10.3390/su132011141
Submission received: 1 September 2021 / Revised: 2 October 2021 / Accepted: 6 October 2021 / Published: 9 October 2021

Abstract

:
Acknowledging and sustaining the ethnic and cultural diversity that the phenomenon of globalization has brought to the urban environment is one of the target objectives to seek spatial and social sustainability in today’s cities. This study aims to build upon previous research approaches that sought to characterize culturally diverse, urban public spaces. For this purpose, a method that encompasses digital and physical layers of information has been proposed to gather signs of culturally diverse, street-level urban and economic activities. Geolocated data from three social media platforms, as well as field-work observations, were collected from two case study street segments with different socio-cultural, demographic profiles. The findings suggest that economic activities related to retail and restaurants, and especially those with higher levels of personalization that reflect “cultural specialisms”, have a significative relevance in both the physical and virtual domains. However, unlike the case study area with the higher socio-economic profile, the urban vibrancy observed through field work throughout the more culturally diverse street segment was not found to be fully represented by social media data. There is still much room for research on the extent to which these sources are useful for characterizing fine-grain street-scale phenomena.

1. Introduction

Globalization is a trend that is intensifying, while the urban environment is becoming ever more diverse with the flow of immigrants. However, more than ever, urban environments are experiencing homogeneity and vernacularisation [1]. There is a need to engage with these rapidly evolving changes, aiming, on the one hand, to create socially sustainable communities where locals integrate with the diversity brought by other ethnic groups and cultures from abroad and, on the other, to assume the challenge for urban designers and planners to create or preserve unique and appealing spaces for the various cultures represented in the population.
From this viewpoint, it is worth distinguishing between the concepts of culture and ethnicity. Culture is often defined by the social behaviour that is followed by people, while ethnicity is the fact of belonging to a group of people that share biological characteristics, common food habits, nationality, language, culture, physical attributes, and/or ancestry. Evidently, with the increase of ethnic diversity in cities, “the chances that different cultures will share public spaces have also increased” [2]. Therefore, creating socially sustainable and liveable urban spaces requires a context-specific understanding of the relationship between human behaviour and the physical setting. In line with this notion, and among the features that define this relationship, the authors recognise that culture, in particular, determines a good part of human behaviour in the space [3,4]. In order to achieve urban landscapes that foster integration among the varied cultural and ethnic values that coexist in city spaces, it is necessary, although challenging, to recognise and promote those aspects in the physical setting that construct a shared identity and sense of belonging. In this respect, new skills and methods in professional practice are required to make modern cities work and find new forms of “intercultural dialogue”, planning for diversity, inclusion, and choice in cities [5].
With the above in mind, this study aimed to build on existing research that explores methods for characterising local features in physical environments. Specifically, an approach that adopts both digital and physical measurements of a case study has been proposed, supporting the notion that “combining the results of each method could provide a database that serves as a comprehensive spatial design for multicultural public spaces” [6]. On the one hand, social media data from Foursquare, Google Places, and Twitter were used as digital traces for identifying signs of cultural diversity in street-level urban and economic activities. Specifically, in this study, the types of these urban and economic activities were used as proxy indicators of multicultural urban contexts. On the other hand, field-work annotations and mapping, as the physical measurements, were used for validating, comparing, and discussing the findings obtained from online data. Through the intertwining of the digital and the physical representations of the urban reality, this research contributes to the understanding of (i) how user-generated social media data can be useful for urban- and field-related researchers and practitioners to characterise culturally diverse street-level urban activities and (ii) the extent to which the cultural features in the physical layer of urban environments are reflected in digital footprints.

1.1. Streets as the Physical Manifestation of the Socio-Cultural Context

Urban public spaces are containers of cultural, social, and individual relationships. These relationships promote the attachment of people to spaces [7,8]. This attachment, therefore, indicates people’s association with the space “either as a memory of direct experience of being there or indirect experience through words, stories, and images” [9]. The character and uniqueness of urban spaces are defined by the combination of social, spatial, and cultural features [10]. At the same time, this character often represents the cultural identity of the different groups that frequent the space [11,12]. In other words, each space embodies a set of meanings and symbols expressing its uniqueness in relation to the cultural identity of a group, which is a reference point to which they may belong [10,13]. In the city experience, streets are the basic unit of space [3] and the “vital container of the public life” [14]. They are “symbols of community and of its history; they represent a public memory” [15]. The direct experience of streets that have “strong local flavour, visual character, and clear boundaries” enables emotion and a “warm sentiment” [16]. These streets become more of a place than a path, and the movement of people is constantly being negotiated, especially when they begin to attract social life. Examples of these types of streets are those where there is a good quantity and variety of independently owned small businesses, or there is a physical manifestation of different cultures through storefronts and product display personalization that offers high levels of sensory stimuli to pedestrians [3]. Such stimuli are critical for communicating the socio-cultural context of the space [17]. Therefore, it is necessary to acknowledge and preserve the “symbolic ways of communicating cultural meanings” [1] in order to promote and sustain cultural diversity in urban public spaces. For this study, the “symbolic ways of communicating” are the culturally diverse urban and economic activities that offer spatial and social integrity [3] and have the potential to create opportunities for “local identity and for local people to influence the external image-creation process” [18]. These businesses and services reinforce the multicultural identity of the streets through their personalization: the fact that businesses express their “territorial claim” by personalizing their street interfaces with canopies, signs, planters, wares, etc. and the way the products are displayed [3].

1.2. Digital Footprints for the Study of Urban Phenomena

Nowadays, everyday behavioural patterns are highly influenced by mobile communication [19], just as social technologies have transformed spatiotemporal connections between people. This transformation, which has reconfigured the “forms and practices through which the collective memory is transmitted”, has had a profound impact on social relations [20] and on the human–urban environment interaction.
Indeed, the development of technology and the spread of social media have created a new virtual environment for social life. These online social interactions leave digital footprints (spatiotemporal user-generated opinions, check-ins, photographs), which, once interpreted, are highly valuable for urban research purposes [21] and for informing decision-making processes. It has now been over a decade since the footprints generated by users of virtual social media platforms have proved to be useful for detecting key physical and behavioural aspects of the urban environment [22,23,24] and discerning phenomena that are hard to appreciate directly by the human senses: people′s perceptual responses to the environment [25,26], the cultural diversity of an urban setting [27], and other complex non-physical phenomena, such as the sense of place [28] and the character and vibrancy of local urban life [29,30,31,32].
Social media data have been used for analysing a wide variety of geographical scales. However, there is a recognised trend in research using these sources of information to cover extensive areas and, thus, use substantial datasets (Big Data) that require sophisticated software, or skills that are often beyond social science researchers, for pre-processing and conducting any type of analysis [33]. For instance, Palazzo et al. [34], Maurer [35], and Lv et al. [36] adopted, respectively, Instagram, Twitter, and Baidu datasets to assess global, cross-country and country-wide geographical scales of analysis.
Likewise, studies concerned with the cultural character of cities are often conducted in large geographical areas. For instance, the study by Wu et al. [27] analysed the cultural diversity of an entire country (328 cities in China), and the research by Hochman and Manovich [31] and Hochman and Schwartz [37] developed a city-scale computational analysis of user-generated social networks to study social and cultural urban phenomena [38].
Although there are some examples dealing with smaller scales, which focus on the analysis of specific public spaces through social media [39,40], there is still much to be learned about the extent to which these sources are useful for characterising street scale phenomena and, more specifically, for revealing signs of cultural diversity embedded in the urban environment.
In light of these facts, studies such as those proposed by López Baeza et al. [41] and Huang et al. [42], which incorporate mixed-method approaches combining digital layers (social media data sources) and physical layers (fieldwork), have proved effective for conducting fine-grain urban analysis. While comparisons between the digital and physical layers of information have long been commonplace for theoretical and empirical research [43,44], more, and ongoing, work is certainly needed in this area for several reasons: (i) field study sources allow verification of whether online user-generated data corresponds to reality; (ii) the amount and types of social media sources and, consequently, the opportunities for their use in the analysis of different urban phenomena, are constantly increasing; and (iii) the access to social media data, as well as their penetration in society, granularity of the information, and functionality are in constant change, allowing new methods of analysis to emerge.
This study contributes to the existing body of research in two main directions: firstly, it proposes a method for characterising cultural diversity of street-level urban and economic activities through digital and physical sources of information, and secondly, the digital footprints from different sources are explored to understand their potential and limitations for the analysis of public spaces and the extent to which the cultural diversity of cities is represented online.

2. Case Study

Stratford Road was selected as the case study. It is one of the main arteries of the southern part of the West Midlands conurbation area, connecting the city centre of Birmingham, with a population of 1,073,045 [45], with the Solihull metropolitan borough in the south, where popular residential localities such as Shirley are located. Along this axis, both continuous and discontinuous settlements can be identified. The same patterns are followed by the presence of urban and economic activity along the axis. Specifically, this study focused on two segments of Stratford Road, where a significant amount of clustered economic activity is located. The spatial delimitation of these two case study segments was part of the actual research procedure and will be covered in the following Section 3.2.1 (Delimitation of Study Areas). One of the selected segments was located in Sparkhill, a suburban area belonging to Hall Green, one of the 10 council constituencies of Birmingham metropolitan borough. The other segment was the street portion that divides Shirley East and Shirley West in the Solihull constituency. These two case study areas have visible and recognizable differences in their socio-economic status, which have been reflected in the use, behaviour, and activities that take place in the public space, including identifiable characteristics that provide useful clues for depicting the socio-cultural nature of the space [3]. These differences have been further supported by socio-economic indicators, such as the Index of Multiple Deprivation (IMD) [46], which evidenced the fact that neighbourhoods within Shirley East and West areas are amongst the 20% and 40% least deprived in the country respectively, whereas those in Sparkhill are amongst the 10% and 20% most deprived. Furthermore, although these areas are similar in population size and age group distribution, the population density is more than double for Sparkhill, and the ethnic distribution differs substantially. In Sparkhill, almost 80% of the population is Asian, whereas in Shirley East and Shirley West, 86% of the total population is white (Table 1).

3. Sources and Method

3.1. Digital Footprints

As previously mentioned, this study considered both online and offline layers of information. The social media platforms Google Places, Foursquare, and Twitter were adopted as the online layer, whereas fieldwork observations were gathered as the offline layer, which allowed verification and validation of online collected data.
Even though each of the selected social media platforms meet very specific purposes, different from that of this study, they were selected for several reasons: (i) they include geolocated user-generated information, which means that the users’ contributions are associated with a specific geographical space; (ii) their data are rich in spatiotemporal content, which allows a characterization of the data in a specific time frame; (iii) they are representative of different types of social media sources [47], thereby offering diverse information from the same geographical context; and (iv) although they have different functionalities, the three sources have proven to be complementary to each other for both analysing and diagnosing temporal and socio-spatial urban dynamics [48,49,50].
Google Places [51] is a place-based database linked to Google Maps’ listing of points of interest (POIs), referred to as places by the platform. This source has become very popular among researchers for the collection of POIs, as it includes a rich list of commercial businesses, transit stations, landmarks, government buildings, etc. Specifically, this study focused on those locations that represent economic urban activities allocated inside buildings. Google Places prompts users to rate and/or review a place. This collaborative feature, which characterises social media platforms [47], allows users to connect and share opinions and feedback, which is why Google Places was considered a social media platform in this study.
Foursquare [52] and Twitter [53] are similar in the sense that they combine people’s social and spatial behavioural information. Although Foursquare is a place-based platform, like Google Places, its functionality differs in two aspects. First, one of the main functionalities of Foursquare is that once in a venue, as referred to by the platform, users can check in to broadcast their presence at a physical location. Second, Foursquare’s listing of venues includes only those in which users have checked-in at least once. Therefore, not all economic and urban activities are listed in the platform database. Twitter is a micro-blogging service where users can broadcast posts limited to 280 characters (tweets) related to news, opinions, etc. to a public feed. Twitter users decide whether the shared tweets should include the exact location from which they have been sent. For this study, only geolocated tweets were considered.
With the above in mind, for the scope of this research, Google Places places represented the urban and economic activities on offer; Foursquare checked-in venues represented the urban activities on demand; and the geolocated tweets from Twitter were indicative of the presence of people at certain locations.

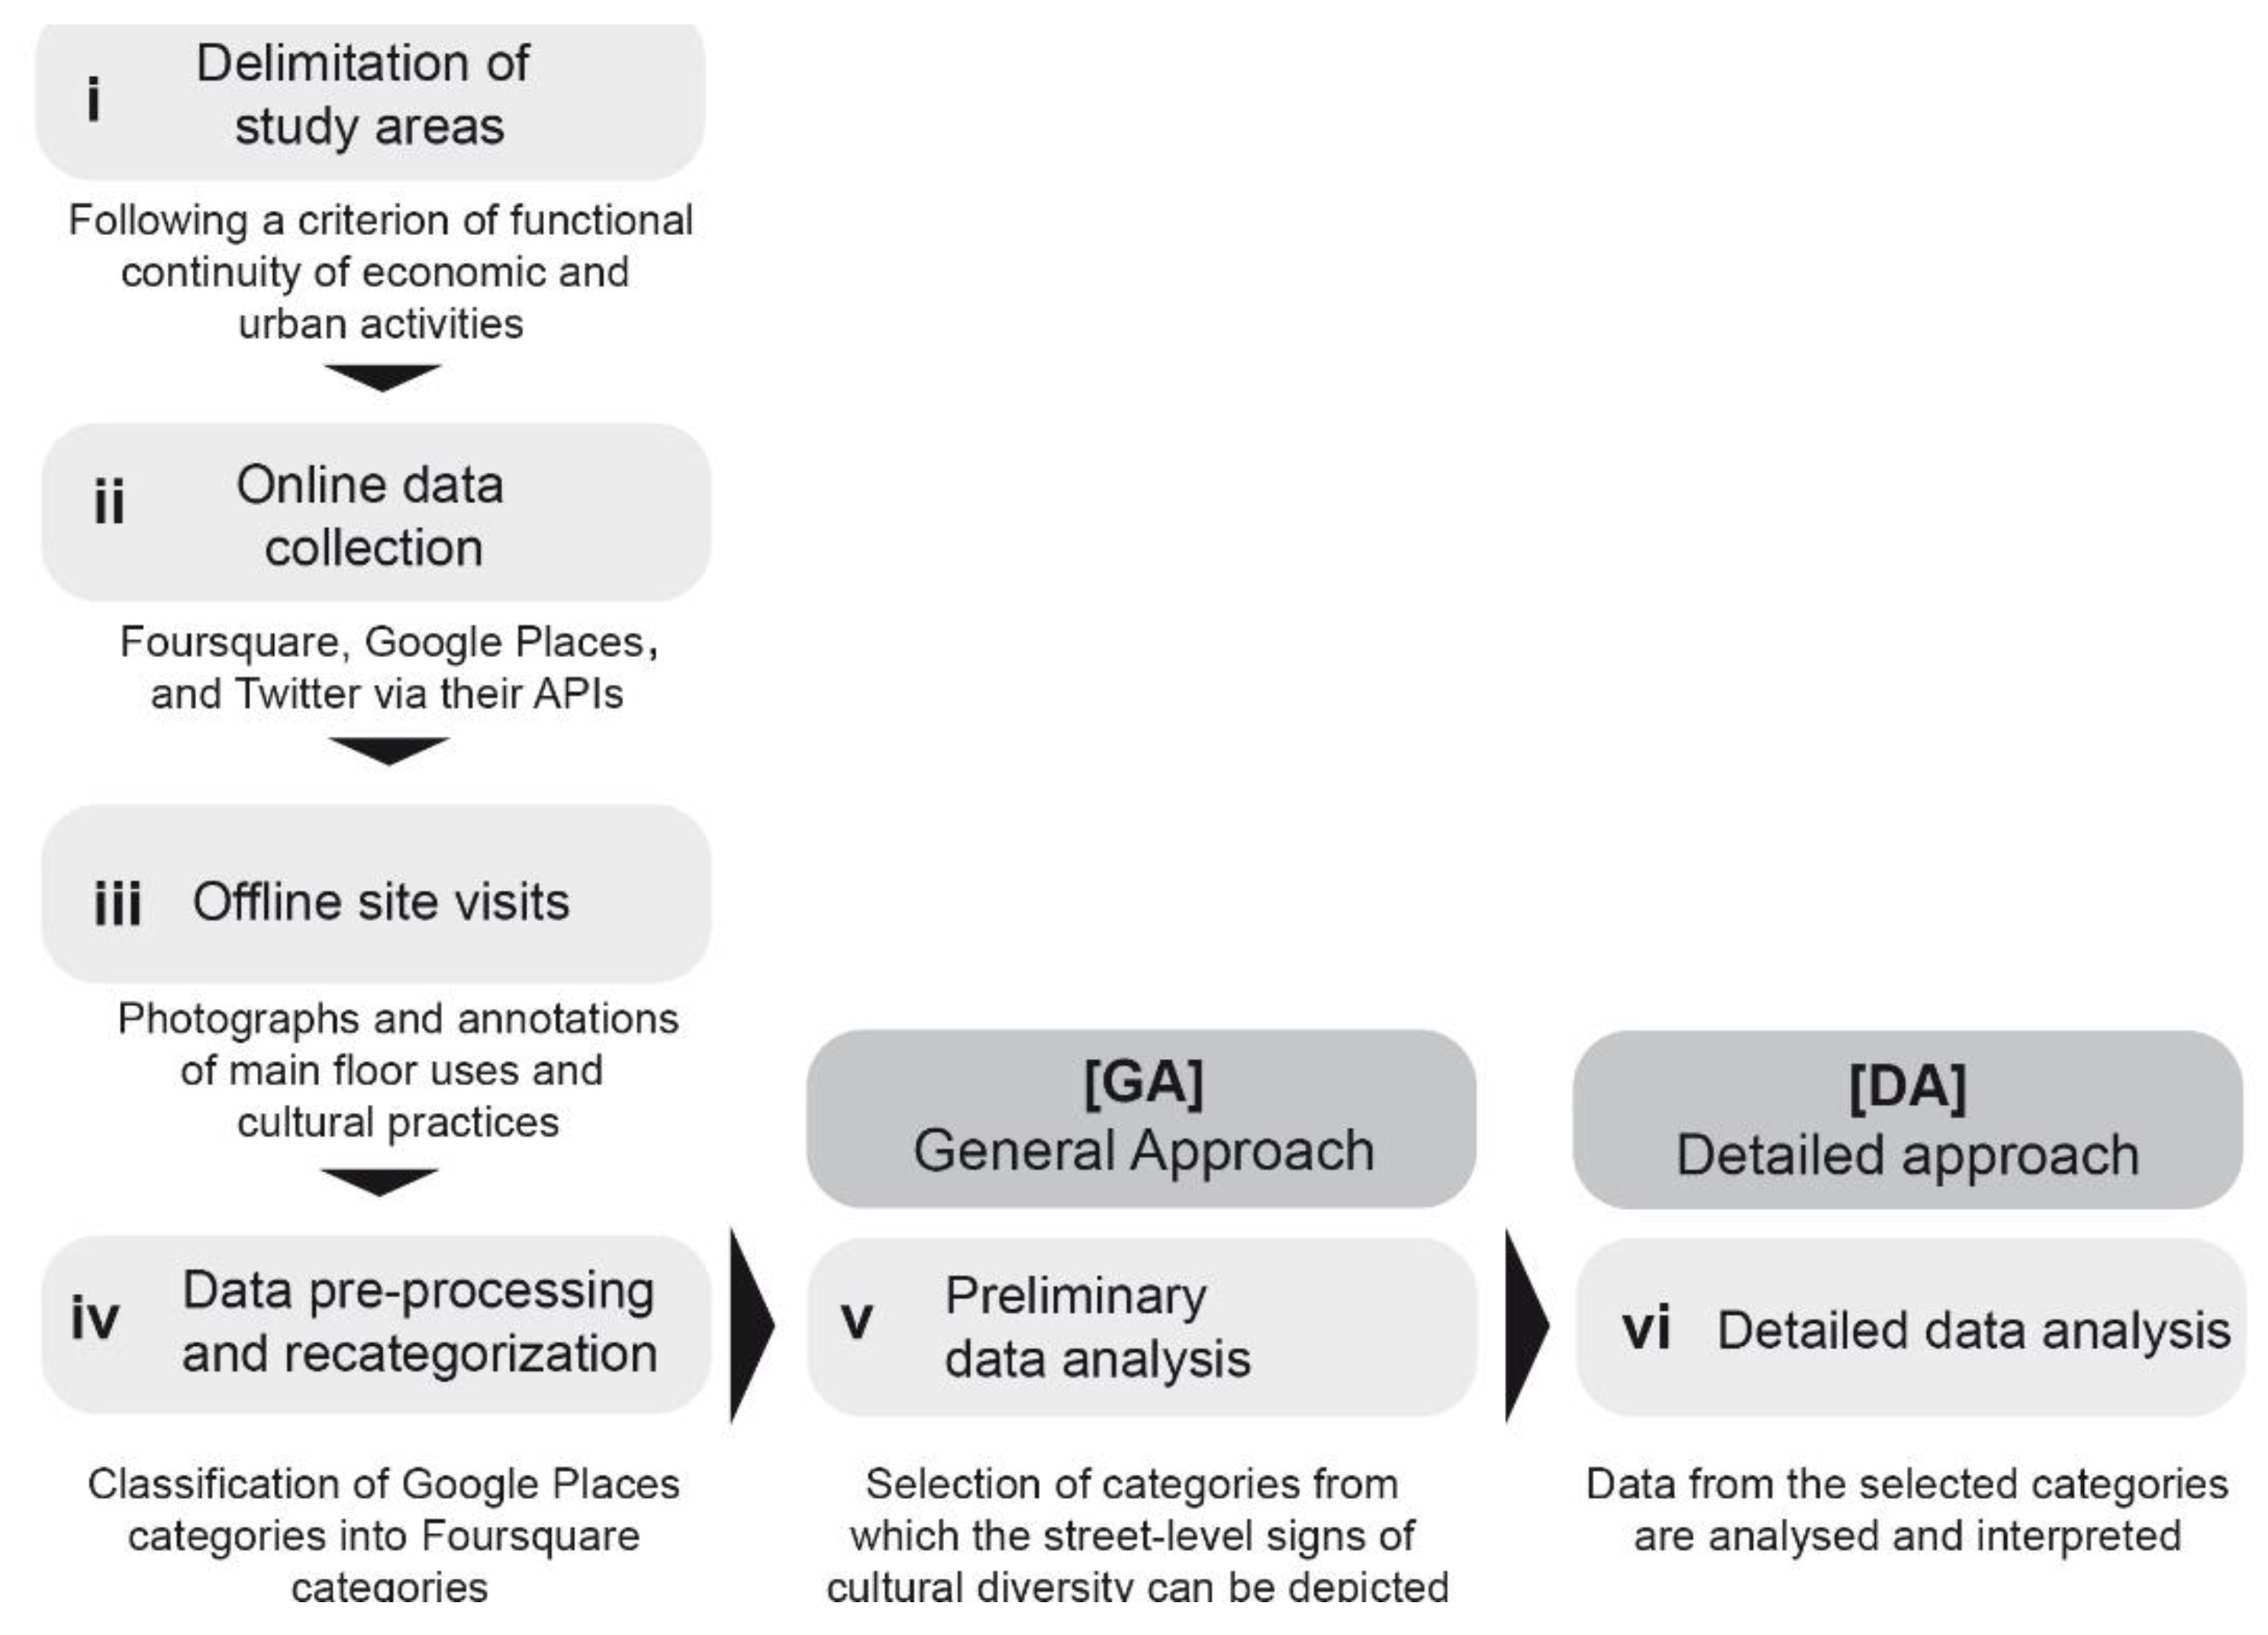
3.2. Research Procedure

A six-stage methodological approach was adopted: (i) the delimitation of study areas; (ii) online data collection and curation; (iii) offline data collection; (iv) data pre-processing and recategorization; (v) preliminary data analysis ([GA] General Approach); and (vi) detailed data analysis ([DA] Detailed Approach). Stages ii to iv consisted of preparing data for analysis, and stages v and vi included both a broad and a more detailed analysis and interpretation of data, respectively (Figure 1). Specifically, the General Approach [GA] stage provided an overall picture of urban activity and social patterns present within the space, and the findings from this stage guided further interpretation of data at the Detailed Approach stage [DA].

3.2.1. Delimitation of Study Areas

Two representative road segments of Stratford Road were selected as study areas (Figure 2, upper left). The selection of these two area samples followed the criterion of functional continuity of street-level urban and economic activities, that is, the spatial clustering of Google Places datapoints. The procedure followed began with the visualization of Google Places datapoints in a Geographical Information System, considering an area spanning a one-kilometre distance from both sides of Stratford Road’s central axis. Secondly, for determining the length of the road segments selected as sample areas, each datapoint was surrounded by different radius area sizes (25 m, 50 m, and 100 m) to identify clustering patterns (Figure 2, bottom left). Thirdly, the clustering patterns forming a continuous shape were closely analysed. Finally, the two longest road segments with the highest concentration of urban activities were selected, considering the 25m radius representation. This radius size criterion appeared to be more appropriate for the small street-scale analysis for two reasons. First, at a distance of 22–25 m, human vision is able to accurately read facial expression and dominant emotions. Short messages can be exchanged (hearing and seeing others), and so a degree of basic social interaction can happen [54]. Second, close observation of the clusters generated by the three radii sizes showed that with the 50 m and 100 m radius, there were cases in which two economic activities that appeared to be clustered together were too far from each other (up to a distance of 200 m) and thus did not meet the functional continuity criterion.
Once the length of the two sample road segments was defined (2478 linear metres for Cluster 1 and 1745 linear metres for Cluster 2), the width of the street area and adjacent urban blocks included on both sides was superimposed (Figure 2, right), as per the method proposed by Serrano-Estrada et al. [55].

3.2.2. Online Data Collection and Curation

Data from the three selected social networks (Foursquare, Google Places, and Twitter) were collected via their public Application Programming Interface (API) by means of a self-developed web application, SMUA (Social Media Urban Analyser). This application allows the delimitation of a geographical polygon area, within which all data are collected and then exported into a .csv file. The procedure for collecting data as well as the advantages and limitations of this application have been extensively covered in a previous work [48]. However, from the data collection process, there are a few aspects that should be noted. Only geolocated data available from the social networks are collected. Therefore, while all available Foursquare and Google Places registers are retrieved, only geopositioned tweets are queried by SMUA. Moreover, the data collection from Foursquare and Google Places is conducted through single requests to the REST API, meaning that datasets include the cumulative registers available up to the date of retrieval (whereas the data collected for Twitter is performed through the Twitter Streaming API), so real-time tweets are collected during a specific timeframe. For this study, Google Places and Foursquare datasets were collected on 30 September 2019, whereas the Twitter dataset included all those geolocated tweets generated between the 21 September 2018 and the 14 March 2019.
From the broad range of metadata offered by these platforms, the raw datasets retrieved from the three social networks only included very specific metadata (Table 2).
In the case of Foursquare and Google Places, the metadata comprised, respectively, the listing of venues and places, their predefined hierarchical classification into venue categories [56] and place types [57], the geographical coordinates, and the ID or identification number of each register. Foursquare datasets also included three other different metadata variables: users, visits, and check-ins. Firstly, the users value corresponds to the total number of unique individuals registered in the social network that have ever checked in at a venue. Therefore, in this study, the users value suggests whether the venue is popular or not. Secondly, the visits value refers to the total number of times that users pass by a venue. These registers are possible due to the fact that Foursquare tracks user whereabouts through location services; thus, the visits value provides an indication as to whether the area surrounding a venue is popular or not. Lastly, the check-in value represents the total number of times that users have voluntarily broadcast their presence in a venue through Foursquare’s Swarm mobile application [58].
The metadata collected from Twitter included the ID or identification number, the geographical coordinates, the tweet language, and the temporal information (date and time the tweet was posted).
The data curation process consisted of removing duplicate records from the three social media raw datasets, as well as the retweets and tweets generated by bots (messages shared by automated accounts) in the case of Twitter. Only those tweets that were likely to have been shared by individuals were manually selected and kept as part of the dataset for further analysis.

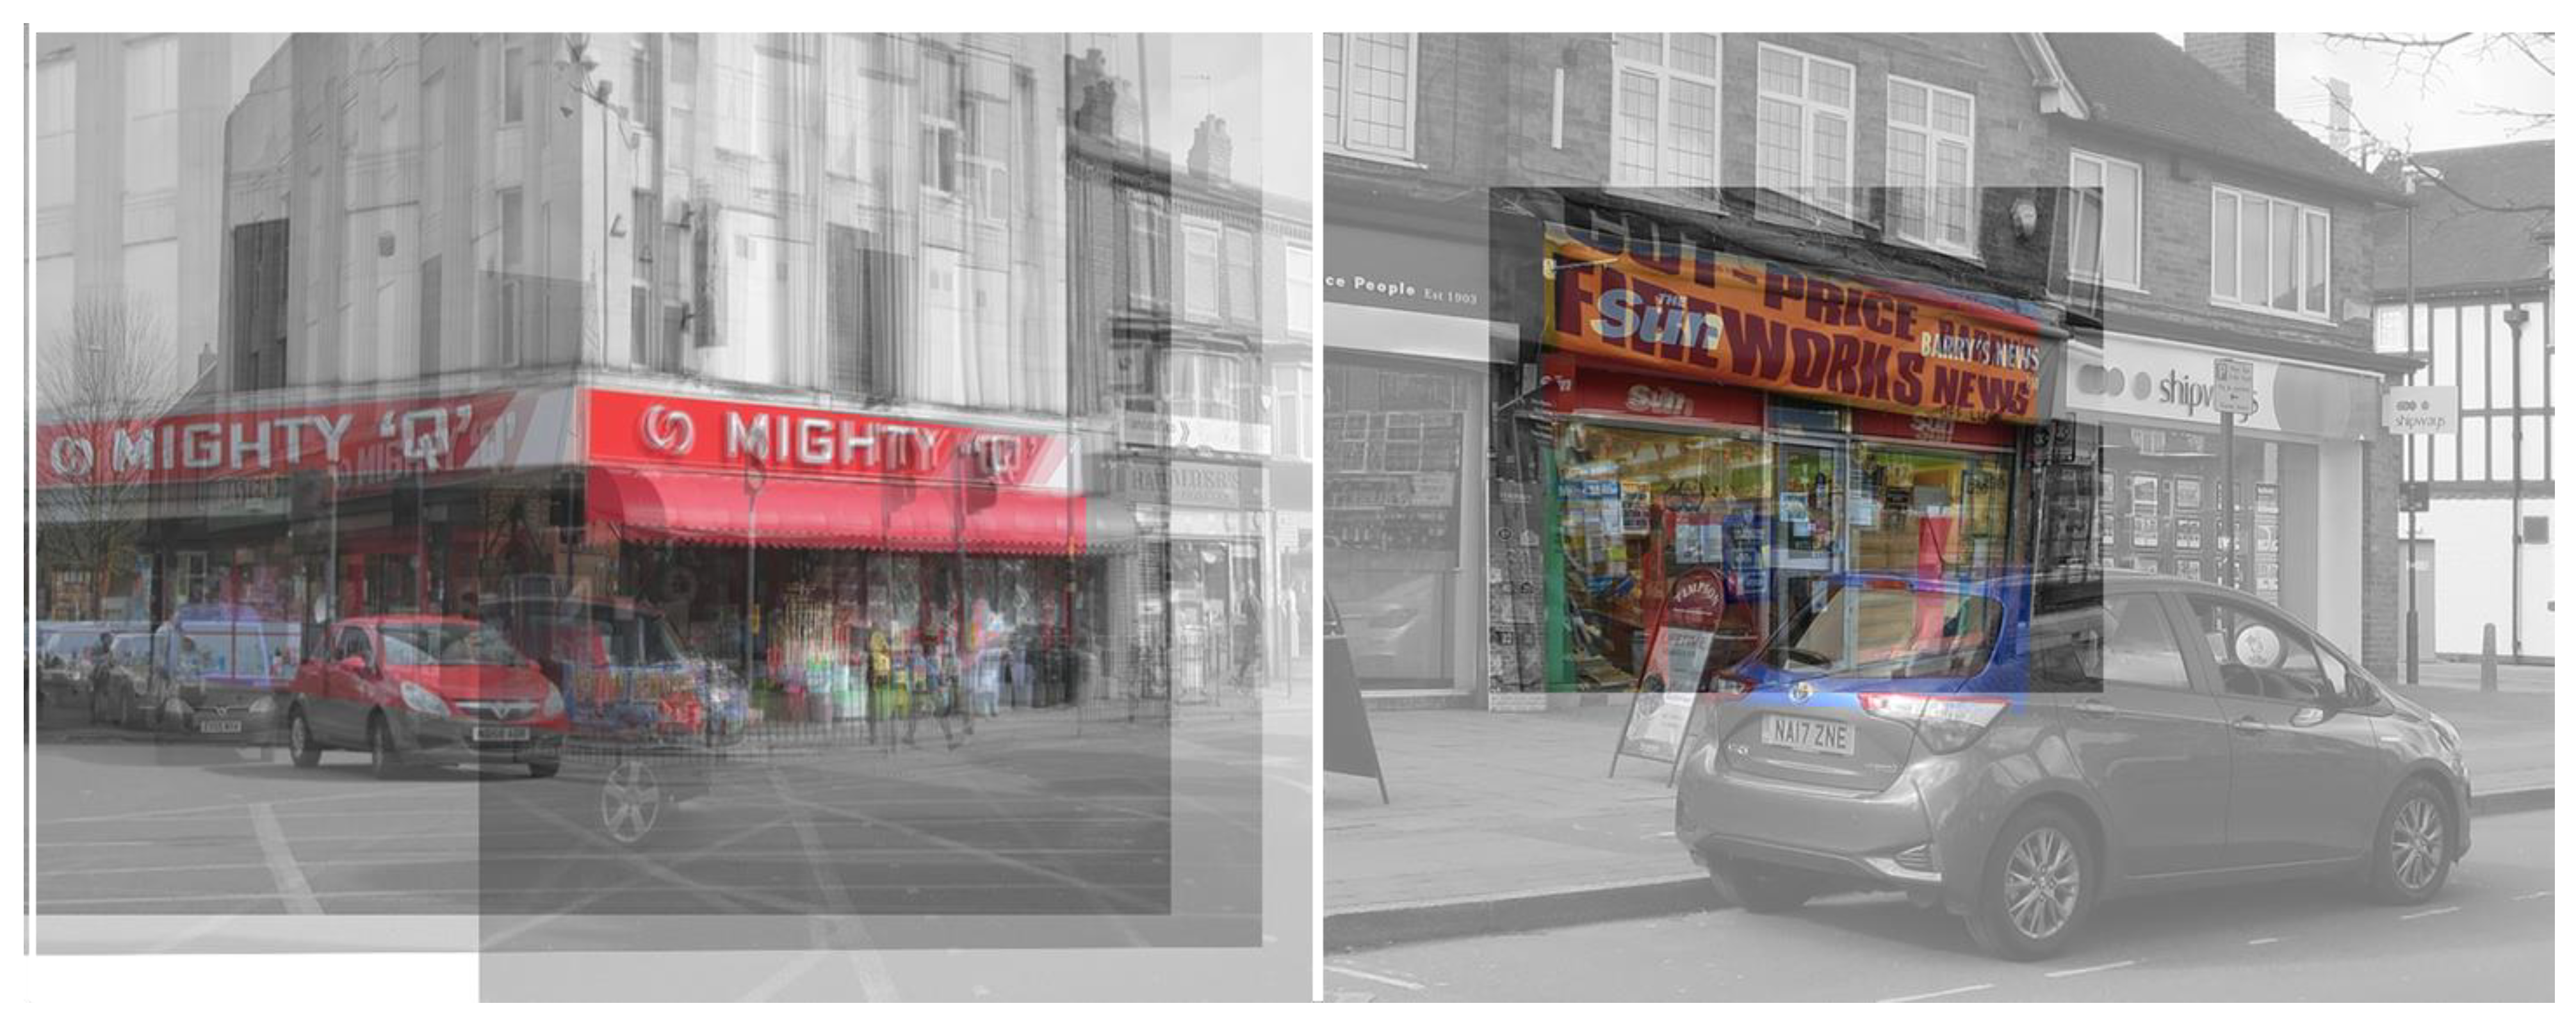
3.2.3. Offline Site Visits

Offline information was gathered through unstructured direct on-site observations of the two selected road segments of Stratford Road, at different times of the day from the 5 to 26 March 2019. Specifically, the fieldwork data collection had a twofold purpose: first, the manual registration of economic activities, which allowed a verification of Google Places registers in terms of their location and types; and second, the comparison of results obtained through online data sources with regard to identified signs of culturally diverse street-level urban activities.
Therefore, prior to visiting the site, the online-sourced dataset was examined using the method proposed by Dobson [30] and Longan [59]. This included the visualization of the curated datasets over a cartography in a Geographic Information System program. A paper version of this map was used for annotating on-site observations and for comparing and identifying any discrepancies with the online sourced datasets.

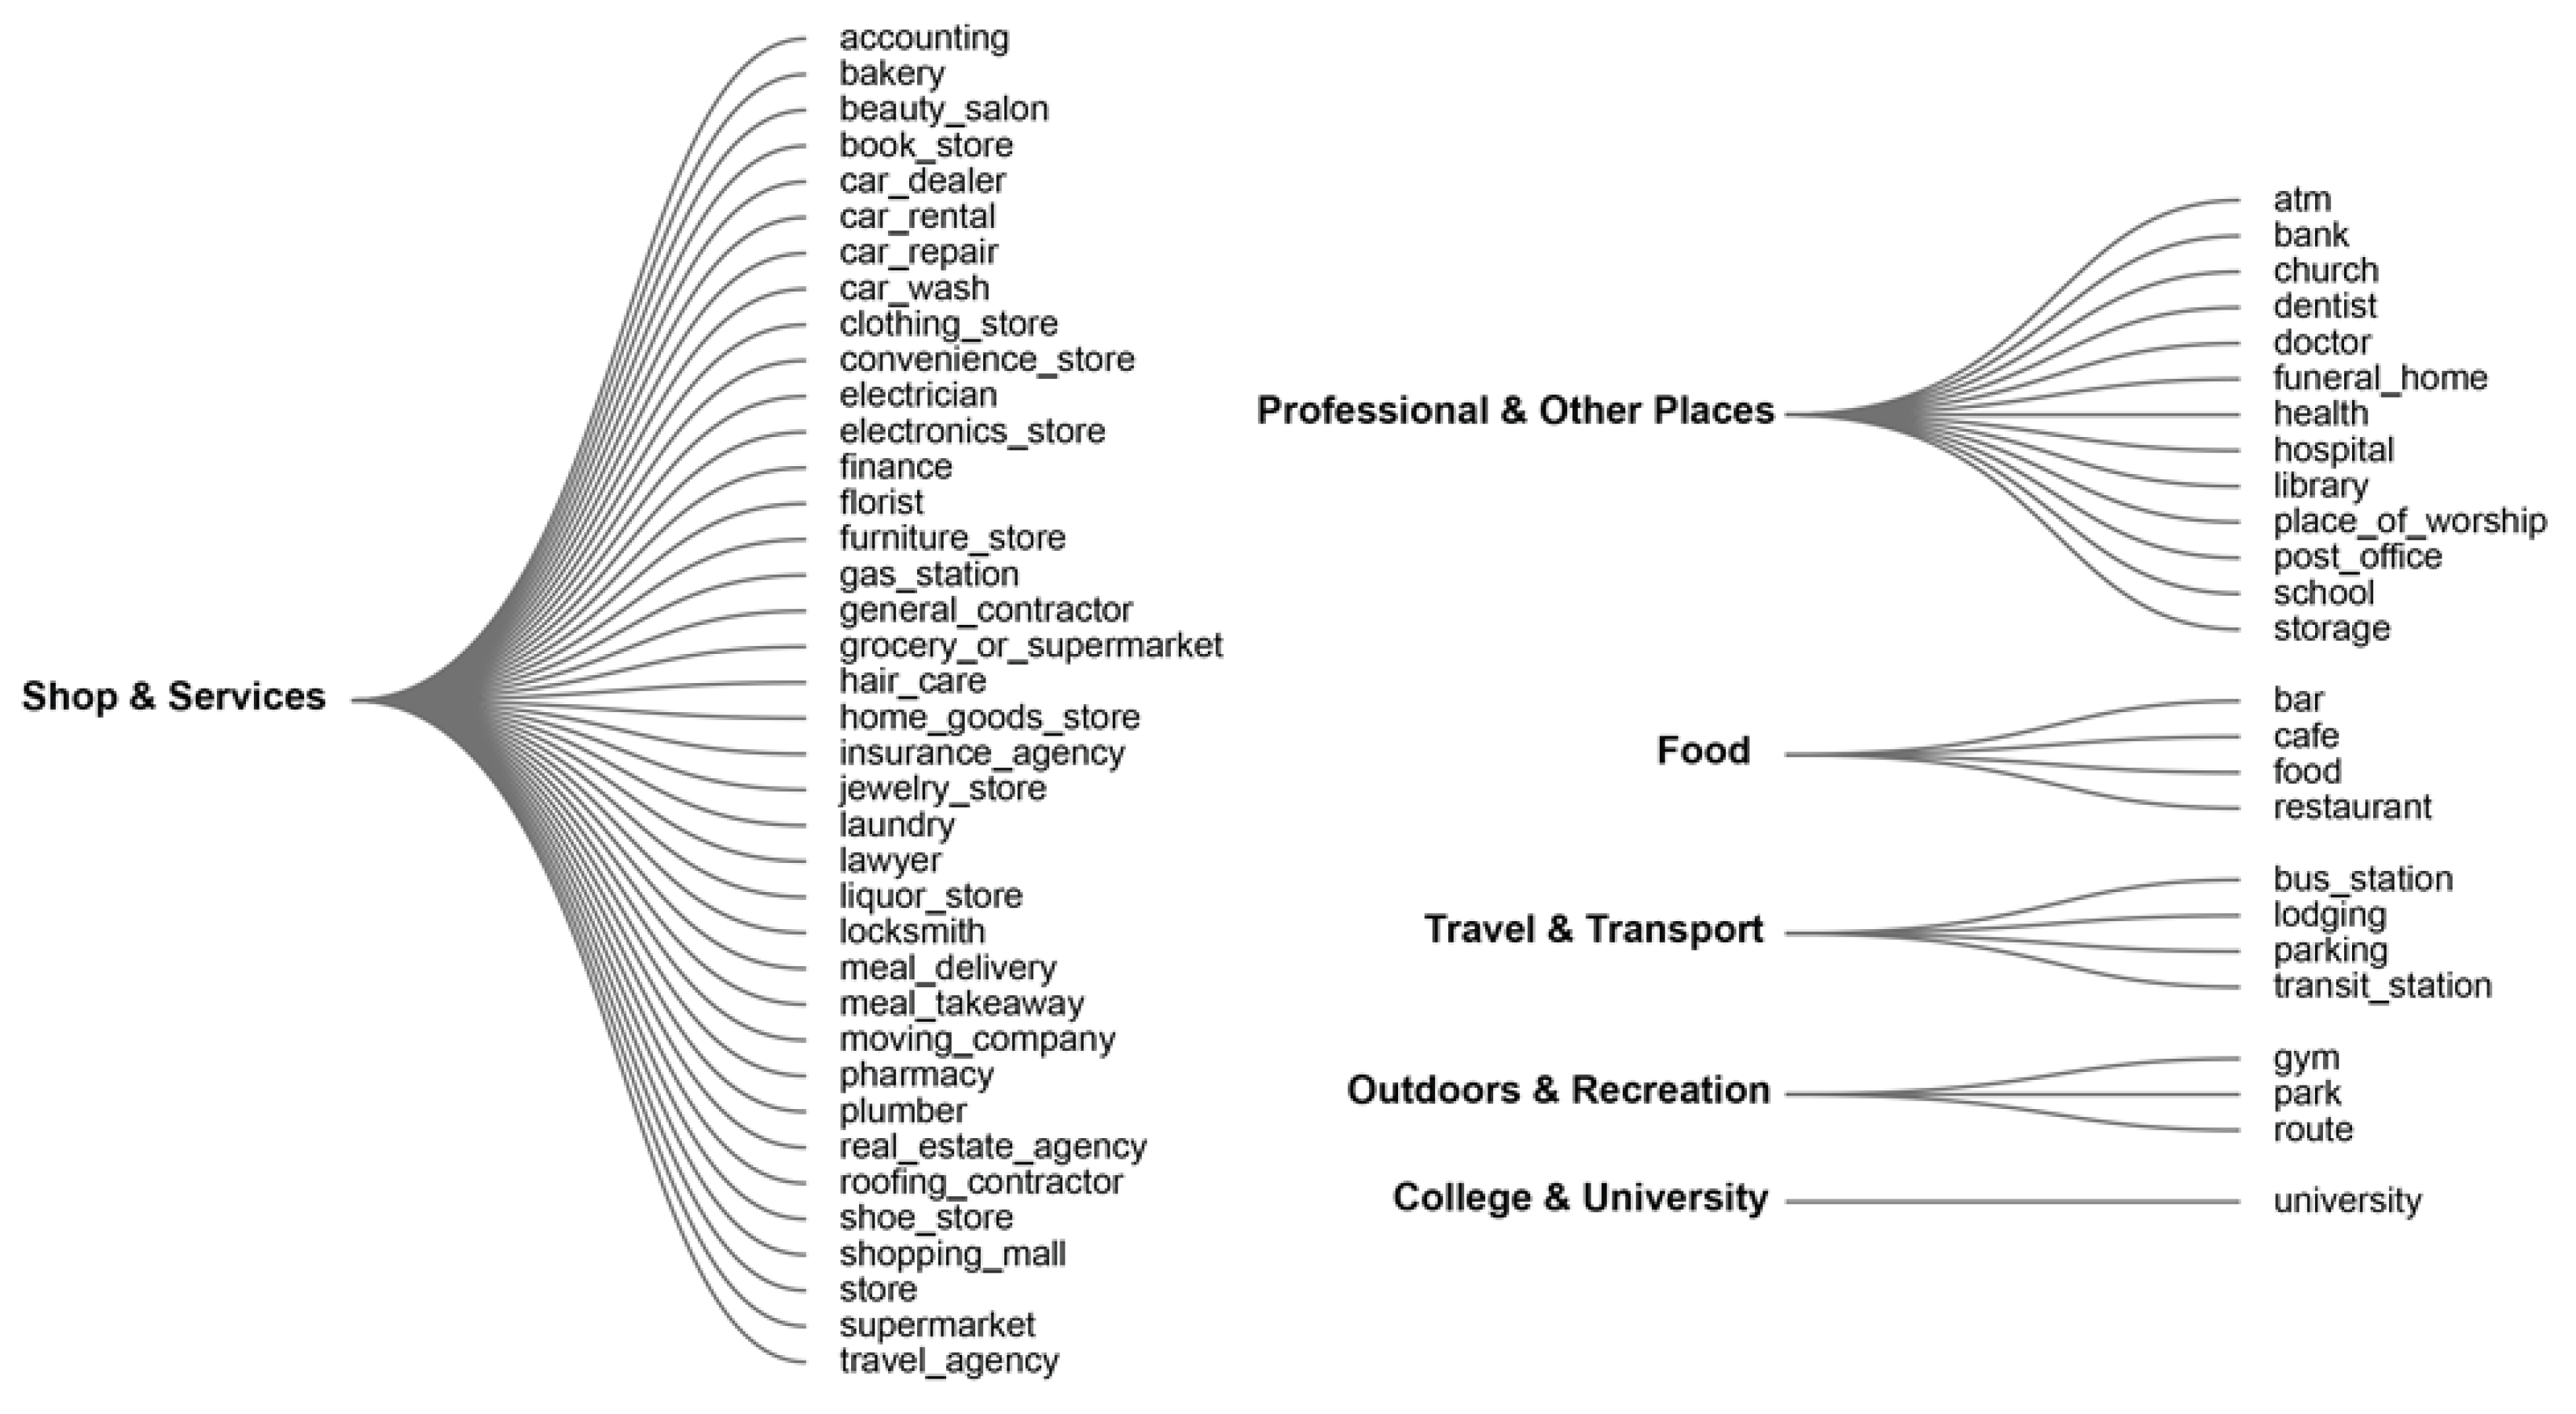
3.2.4. Data Pre-Processing and Recategorization

In total, after the data curation, the registers within the selected areas amounted to 41 Foursquare venues, 427 Google Places places, and 29 tweets for Cluster 1 in Hall Green and 73 venues, 298 places, and 87 tweets for Cluster 2 in Solihull (Table 3). The datasets from the three social networks were pre-processed and recategorized to facilitate the analysis.
The pre-processing of Foursquare and Google Places datasets was carried out to ensure that all the venues and places listed had an assigned category that corresponded to the type of location or activity they referred to. This task involved manual verification that resulted in only 5% of Foursquare venues requiring adjustment to their predefined categories. However, 20.1% and 22.8% of Google Places places in Clusters 1 and Cluster 2, respectively, had to be categorized into an existing Google Places category, either because the registers were not assigned to any category or because they had an ambiguous category assigned. For example, the category point of interest did not provide enough information about the place’s type of activity but accounted for 21.4% and 23.4% of the total raw data in CL1 and CL2, respectively (See Table S1 in Supplementary Materials).
As for the Twitter dataset, the pre-processing consisted of cleaning the text and removing in-text symbols, weblinks, etc., that did not provide useful information for the purpose of the study. Then, tweets were classified into four-timeframes, as follows:
I.
weekdays morning/afternoon, from 08:00 to 20:00, Friday included;
II.
weekdays evening/night, from 20:00 to 07:59, Friday excluded;
III.
weekends morning/afternoon, from 08:00 to 20:00, Friday excluded;
IV.
weekends evening/night, from 20:00 to 07:59, Friday included.
Once all datasets had been pre-processed, a reclassification of Google Places’ place types (63 initial categories) into the predefined Foursquare categories (6 categories) was conducted (Figure 3) for two reasons: first, to streamline the analysis and, second, to be able to compare the information from both sources [55].

3.2.5. General and Detailed Approaches to Data

Two analyses with different degrees of insight were conducted to depict signs of cultural diversity in street-level urban activities within the areas of study.
The general approach ([GA] in Figure 1) consisted of an overall first comparison between the urban and economic activities of the two clusters, considering the average datapoints per 100 linear metres. Then, a second comparison was made based on (i) the amount and diversity of urban and economic activities on offer for both clusters, which have been highlighted by both the Google Places places and the records collected during field observations; (ii) the amount and diversity of the venues on demand according to Foursquare datasets; and (iii) the amount of social activity and patterns of people’s presence as reflected by geolocated tweets as per the defined timeframes.
The detailed approach ([DA] in Figure 1) entailed recognizing and identifying venues, places, and tweets from which signs of culturally diverse street-level urban activities could be detected. Specifically, the metadata from social-media-gathered datasets were manually revised for that purpose. Foursquare venues ranked by check-ins provided an indication of socially preferred urban activities [50]. Then, the frequency of Foursquare venues within the Food and Shop and Services categories was analysed. Lastly, a word cloud showing frequent words in tweet messages related to both case study areas provided an indication of common topics related to urban activities.

4. Results

The case study selected included two areas with high urban activates along Stratford Road in Birmingham: cluster 1 (CL1) in Hall Green (See Figure S1 in Supplementary Materials), with a higher percentage of Asian population registered, and cluster 2 (CL2) in Solihull, with a predominantly white population (See Figure S2 in Supplementary Materials). Both clusters surpassed the average of 7–8 Google Places places (i.e., economic activities on offer) for every 60 linear metres, an indicator that suggests that these segments can be considered “active” [3]. This demonstrates their functional continuity, the methodological criterion followed for the delimitation of study areas.
Two other methodological considerations concerning the information sources and the data classification are worth highlighting.
First is that which related to the comparison between the proportion of economic and urban activities on offer as per Google Places datasets and those collected during field observations (Table 3). Indeed, Google Places datasets included 19% and 20% more activities for CL1 and CL2, respectively. The difference in the amount of information retrieved from both sources was potentially due to the fact that social media data include activities that are not appreciable from the street level. For instance, during fieldwork, it was not possible to know whether professional activities were taking place on upper floors with no signage on the façade.
Second, the data recategorization of Google Places places into Foursquare categories facilitated the comparison between the two clusters in terms of quantity, availability, and preferred types of urban and economic activities.

4.1. General Approach to Data [GA]

Findings from the General Approach to data are presented in Table 3, which shows the quantity and types of economic and urban activities that were analysed for each source and cluster. Two relevant findings were observed. First, with respect to the quantity, the average amount of urban activity on offer (places) per linear metre in CL1 and CL2 was rather similar, being 17.1 and 17.2, respectively, whereas the demand for activities was 2.4 times less in CL1 than CL2.
Second, in relation to the diversity of activities, although in a different order, the venue categories and place types that ranked the first, second, and third position with most registers were Shop and Services, Professional and Other places, and Food for both clusters. However, there seemed to be more diversity in the urban and economic activities on offer for CL2 than for CL1, whereas the opposite scenario was observed for the demand for these activities, in which more diversity was found in CL1 than in CL2.
As for the comparison between the number of Google Places places and Foursquare venues per category and cluster, the proportion of registers under the Food category was almost the same for both clusters in both social networks: 8% for CL1 and 10% for CL2 in Google Places and 32% for CL1 and 33% for CL2 in Foursquare. However, the category Shop and Service was far less well-represented in Foursquare than in Google Places, especially in CL1. This possibly suggests that local and proximity retail in CL1 was not fully represented in the Foursquare datasets.
Moreover, although a more exhaustive user behaviour analysis would be necessary to confirm this in quantitative terms, no apparent correlation was found during fieldwork between the very few registers collected from Foursquare and Twitter in CL1 and the actual vibrancy observed in this street segment, especially when compared to CL2. Indeed, CL1 was appreciated to be at least as active and vibrant as CL2 in terms of street-level pedestrian activity during the day and night, even though the number of users, check-ins, and visits registered in the Foursquare Nightlife Spot category venues (Table 4) was relatively small.
At this point, two considerations should be highlighted. First is that CL1 is located in a culturally rich area in which the penetration and use of the Foursquare social media platform might be different from that of CL2. Second, the socially oriented data included in this social network was not necessarily generated by neighbourhood residents, but by outsiders that may not be interested in registering or checking in to those retail venues found in CL1. These observations can be further supported by Twitter data (considered an indicative of the spatiotemporal presence of people), where CL1 presented three times fewer geolocated tweets than CL2 over a six-month span of streaming data collection.

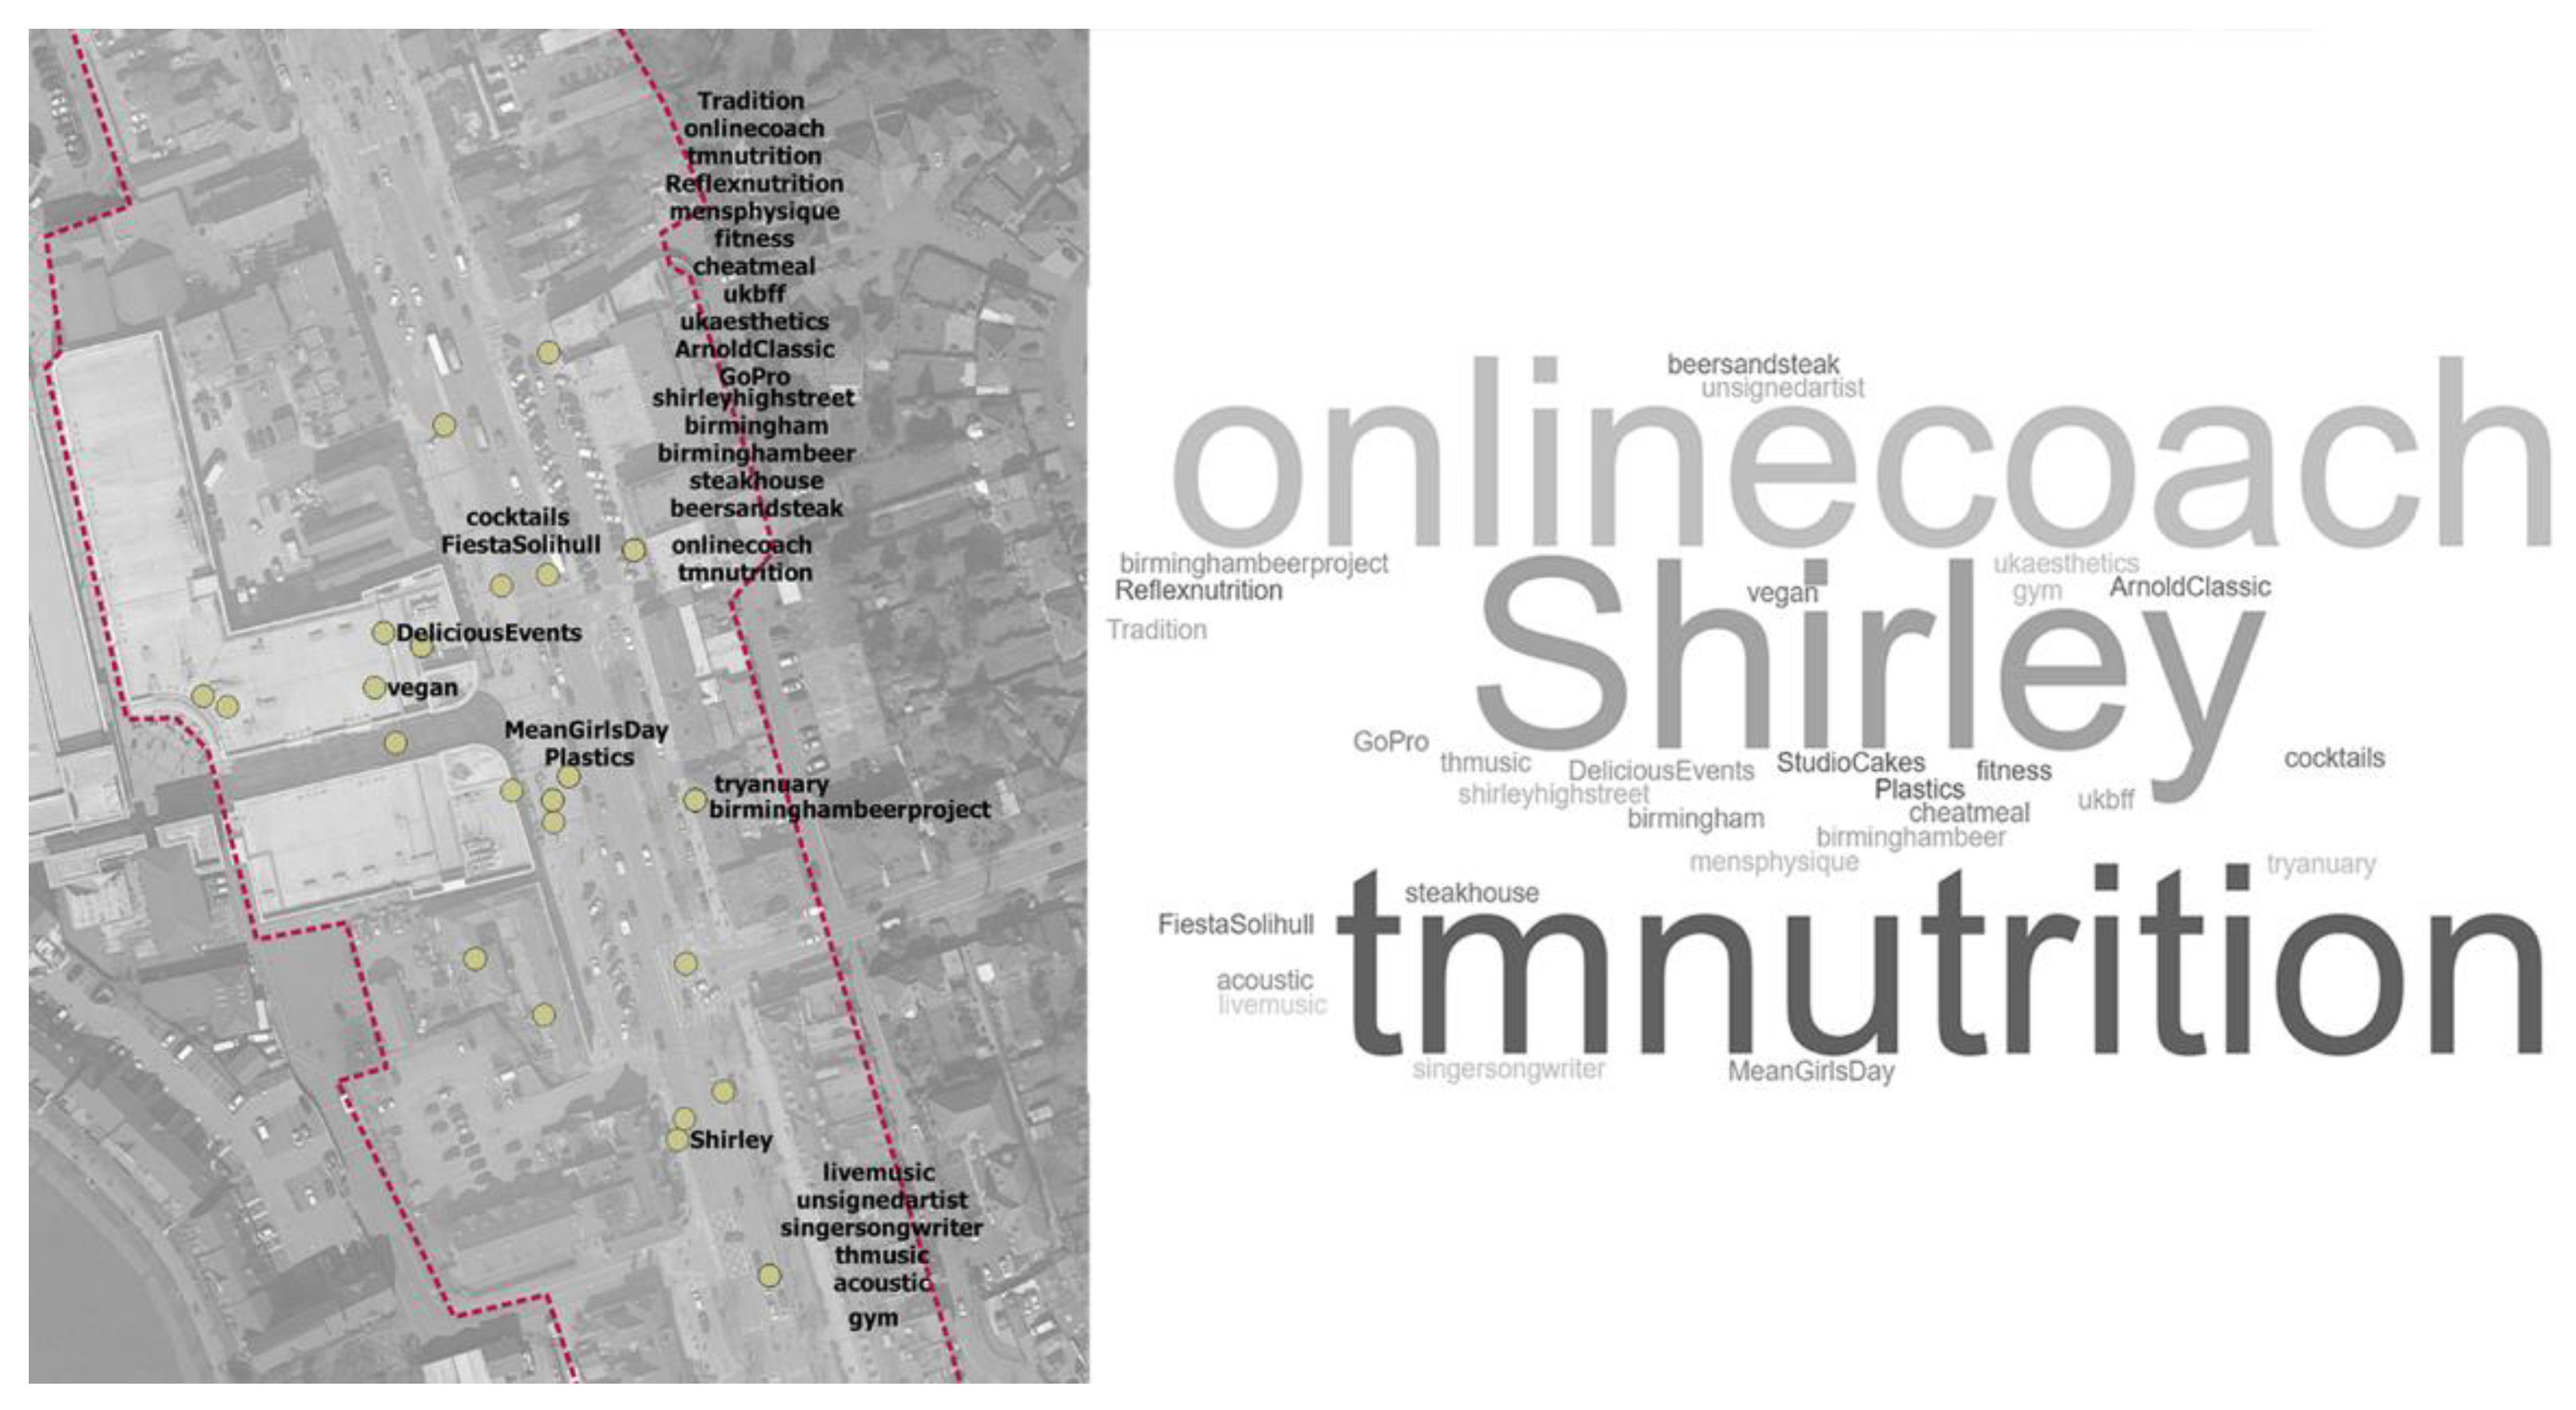
4.2. Detailed Approach to Data [DA]

Further analysis of the more socially oriented social media platforms selected (i.e., Foursquare and Twitter) evidenced traces of culturally diverse street-level urban activities for both clusters. Relevant observations are presented in relation to both field work annotations and key theoretical and empirical work from previous research.
The detailed approach to data included a ranking, by number of check-ins, of the 15 most active locations in Foursquare venues for both clusters (Table 5).
The highest ranked venues in CL2 were retail chain stores, whereas in CL1, most stores were locally oriented venues, which seemed to be aimed at very different target groups to those in CL2. Indeed, in view of this information, these types of urban activities are, to a great extent, indicative of the demographic and socio-economic profile of the area. Considering the number of users as indicative of the venues’ popularity, the most popular venue in CL1 (Hall Green) was “M.Y. Travel & Money Services Ltd” (Figure 4 left), a travel and foreign currency office. For CL2 (Solihull), “Costa Coffee” (Figure 4, right), a coffee house chain, was the venue with most users.
A closer examination of venues and places indicated that the categories from which signs of cultural diversity were more evident were Food and Shop and Services (See Figure 3 and Table 5). Table 6 shows the diversity of the type of food Foursquare venues per frequency and number of people that had walked by (visits), checked in (check-ins), or visited (users). CL2 had more diversity of Food venues registered in Foursquare. Furthermore, the most checked-in venues in CL1 under this category were Asian and Pakistani restaurants; whereas in CL2, the preferred types of Food venues were coffee shops, followed by Nando’s (a multinational food chain) and other Fast-Food Restaurants.
As for the Shop and Services category venues (Table 7), as previously observed in the general analysis of data, CL1 had three times fewer registered venues (9) compared to CL2 venues (33).
The economic activity with the most Foursquare check-ins, visits, and users for both clusters within the Shop and Services category was Bank: one registered in CL1 and seven in CL2. The next most popular venue type was Convenience Store, where the only venue in CL1 had double the number of registered users than the combined number of both venues in CL2.
As evidenced by Foursquare datasets, “Betting” and “Bridal Shops” were noteworthy economic activity types identified in CL1. This was corroborated by fieldwork observations, as well as through Google Places and Twitter data (Figure 5, left). In fact, of the total Google Places places registered and originally categorized as “Clothes Store” (representing 30% of the total number of places in CL1), 85% specialized in Indian and Asian bridal gowns and accessories (See Table S1 in Supplementary Materials). This was further supported by the topic frequency shown in the word cloud generated from tweets shared in CL1 (Figure 5, right), albeit the number of tweets was significantly lower than the amount of data retrieved from the other two social networks.
Lastly, the second, third, and fourth most popular type of venues within the Shop and Services Foursquare category in CL2 were “Food and Drink Shop”, “Shopping Mall”, “Salon/Barbershop”, and “Sporting Goods Shop”, respectively (Table 7). Precisely these types of urban activities were reflected in the trending topics included in CL2’s shared tweets that were geotagged at the area where the highest concentration of datapoints from all social networks was found (Figure 6).

5. Discussion

This study contributes to the existing body of research that characterises culturally diverse urban environments through digital footprints collected from social media platforms. Specifically, Google Places was used as a listing of urban and economic activities on offer; Foursquare was used as a means by which socially preferred places were recognised; and geolocated Twitter tweets were used as indicating the presence of people at certain locations and as a textual representation of social activities.
Two levels of data analysis were adopted in the proposed method: a general and a detailed approach. Google Places, which is a place-centred social network, was quite useful for the general approach to data, as it provided an up-to-date listing of urban and economic activities. From this, it became evident that both retail (Shop and Services category) and restaurants (Food category) have significative relevance in both road segments, with 12% more retail in CL1 (Hall Green), the most ethnically diverse and socioeconomically disadvantaged cluster. As previous findings from empirical research have confirmed, by analysing social preferences through behavioural mapping and personal interviews, culturally diverse shops and restaurants are important spaces for social and leisure activities, and in particular, “retail activities are the main concern of people in multi-cultural streets” [60]. Indeed, these are the types of businesses that often incorporate physical characteristics that support sociability and liveability, such as personalization of storefronts and street fronts, thereby creating unique ambiences [3]. As shown in Figure 7, the personalization of the most checked-in commercial establishments in both clusters differed in terms of how the products are displayed. Mighty Q, the most checked-in Convenience Store in CL1 was “extending the interior territory of the store to the exterior street space” [3], whereas the Convenience Store with most users in CL2 had a high permeability, but product display was restricted to the inner store space.
This information is valuable for designing businesses management strategies for retail activities and services that aim for a pluralistic approach towards inclusionary retail activity in multicultural contexts [6].
As for the detailed approach to data, despite the small-size of the dataset from Twitter in CL1 (Hall Green) and CL2 (Solihull) and of Foursquare in CL1, the data from both social networks highlighted relevant social preferences in terms of venues popularity and signs of cultural diversity embedded in urban and economic activities. This was found through a close examination of Foursquare venues and the hints detected about the nature of the activities that took place in each of the clusters through the textual information included in the tweets. For instance, the social relevance of Pakistani restaurants in CL1, along with the character and type of preferred venues, coincided with the Twitter trending topic word cloud. Although generalisation was not possible, in the light of the socioeconomic context of the case study areas (see Section 2, Case Study), these results concurred with those obtained from the research of Yuan et al. [61], which suggested that “low-income communities have a distinctive restaurant culture that the high-income areas do not have”.
There are a few aspects worth highlighting regarding the opportunities and limitations of data retrieved from the three social media platforms for depicting cultural diversity in street-level urban activities.
First, this study proved that “identities and power relationships […] are not always visible from the online prospective” [58]. In particular, this “visibility” largely depends, among other things, on the penetration and popularity of the social media platform in the case study areas, the age group that uses these platforms, and whether only one source of information is to be used for the analysis. Indeed, for this street-scale study, it was necessary to include several sources of data. This is a well-known strategy to “thicken” small data corpuses [61]. However, it is often not necessarily a matter of sample size, since a large data sample does not guarantee that better insights will arise [62]. Rather, it is more about the quality and content of the data.
This study, as has been the case for others that deal with small samples of data [63,64], has demonstrated the importance of not disregarding small datasets. For small-scale analysis, data cannot be dismissed before making sure it is not useful. For instance, a Twitter “influencer” is a user who is likely to generate noisy tweets, which is why some studies tend to eliminate the tweets generated by these users, especially in large-scale studies. However, in the case of street-scale analysis, it seems convenient to further investigate whether such users are posting content that could be useful. For instance, the most active user in Twitter of CL1, R F Chohan, a jewellery store user profile, provided what appeared to be an accurate picture of commonly found urban and economic activities within the street segment. This economic activity reflects the “cultural specialisms” of the area, one of the key cultural indicators pointed out by Montgomery [65], as it represents “the presence of peculiar and specialized art forms, crafts, or even manufacturing and services, jewellery, ceramics, cuisine, etc.". Similarly, an example of unexpected traces detected from Foursquare datasets was the social relevance of venues such as “Bus stops” in CL1, which were non-existent in CL2. These potentially contributed to the social life of the street and reflected a socio-economic difference between the two street segments.

6. Conclusions

This study has explored the potential of social media data sources for depicting culturally diverse street-level urban and economic activities. Specifically, the types of urban and economic activities reflected in Foursquare, Google Places, and Twitter have been used as proxy indicators of multicultural urban contexts.
Findings from Google Places data at a general stage provided a good understanding of the urban environment analysed. However, it must be acknowledged that the amount of geolocated data available from Foursquare and Twitter did not correlate with the amount of ground-observed liveability and ethnic and cultural richness in CL1. Although more exhaustive field data gathering and behavioural analysis would be required to quantitively measure this assertion, it could be affirmed that, unlike in the case of CL2 (the area with the higher socio-economic profile), the urban vibrancy observed in CL1 remained mostly physical and, as such, was not found to be entirely represented by these social media platforms. The degree of socialization and people presence observed in CL1 remained mostly in the physical space and did not extend to the virtual space, whereas in CL2, the social activity found in the virtual space seemed to mirror the physical one. Therefore, it is worth insisting on the fact that insights from these sources cannot be extrapolated to a society, nor can it be assumed that there is a single meaning to them. The reproducibility of the method proposed for other street-level case studies largely depends on the geographical context. For instance, the Food category was relevant for identifying and comparing urban and economic activities of distinct natures between the two case study areas. However, this may not necessarily be the case in other geographical contexts without such a strong and rich cultural character.
All in all, future research along the lines of small-scale analysis in multicultural urban environments could consider including a behavioural analysis and semi-structured interviews as an additional layer of information to deepen the conclusions drawn from the social media small-data analysis (as opposed to Big Data analysis for entire cities). This would provide a more comprehensive understanding of the socio-spatial relation between local people (and not only social media users) and the urban setting, which is valuable information for decision making aimed at preserving a unique, appealing, and socially inclusive urban environment.

Supplementary Materials

The following are available online at www.mdpi.com/article/10.3390/su132011141/s1, Figure S1: Visualization of datasets retrieved from the three social networks in CL1 (Hall Green): Foursquare venues (by check-in value ranking); Twitter; and Google Places places, Figure S2: Visualization of datasets retrieved from the three social networks in CL2 (Solihull): Foursquare venues (by check-in value ranking); Twitter; and Google Places places, Table S1: Google Places types of activities per cluster.

Author Contributions

Conceptualization, P.M., L.S.-E. and M.A.; methodology, P.M. and L.S.-E.; formal analysis, P.M., L.S.-E. and M.A.; investigation, P.M., L.S.-E. and M.A.; data curation, P.M. and L.S.-E.; writing—original draft preparation, P.M., L.S.-E. and M.A.; writing—review and editing, P.M., L.S.-E. and M.A.; funding acquisition, P.M. and L.S.-E. All authors have read and agreed to the published version of the manuscript.

Funding

This research was funded by Conselleria de Innovación, Universidades, Ciencia y Sociedad Digital, Generalitat Valenciana (GV/2021/177).

Conflicts of Interest

The authors declare no conflict of interest.

References

  1. Setha, L.; Dana, T.; Suzanne, S. Rethinking Urban Parks. Public Space and Cultural Diversity; The University of Texas Press: Austin, TX, USA, 2005; ISBN 0292706855. [Google Scholar]
  2. Lesan, M.; Gjerde, M. Sidewalk design in multi-cultural settings: A study of street furniture layout and design. Urban Des. Int. 2021, 26, 21–41. [Google Scholar] [CrossRef]
  3. Mehta, V. The Street: A Quintessential Social Public Space; Rouledge: New York, NY, USA, 2014; ISBN 041573729X. [Google Scholar]
  4. Hall, E.T. The Hidden Dimension; Doubleday: New York, NY, USA, 1966; ISBN o-385-08476-5. [Google Scholar]
  5. Wood, P.; Landry, C. The Intercultural City: Planning for Diversity Advantage; Earthscan: London, UK, 2008; Volume 53, ISBN 978-1-84407-436-5. [Google Scholar]
  6. Lesan, M.; Gjerde, M. A mixed methods approach to understanding streetscape preferences in a multicultural setting. Methodol. Innov. 2020, 1–15. [Google Scholar] [CrossRef]
  7. Low, S.M.; Altman, I. Place attachment. In Place Attachment. Human Behavior and Environment (Advances in Theory and Research); Springer: Boston, MA, USA, 1992; Volume 12, pp. 1–12. ISBN 978-1-4684-8753-4. [Google Scholar]
  8. Cross, J.E. What is sense of place? In Proceedings of the 12th Headwaters Conference, Gunnison, CO, USA, 2–4 November 2001. [Google Scholar]
  9. Aboutorabi, M. An inquiry into the Urban Landscape of Multicultural Cities. In Proceedings of the 5th International Conference on Civil Engineering, Architecture and Urban Planning Elites, Paris, France, 2–4 November 2018; pp. 1–13. [Google Scholar]
  10. Aboutorabi, M. Culture, Space, and Place: An inquiry into the urban landscape of multicultural cities. J. Eng. Archit. 2018, 6, 7–19. [Google Scholar] [CrossRef]
  11. Rapaport, A. Human Aspects of Urban Form: Towards a Man-Environment Approach to Urban Form and Design; Elsevier Ltd.: Amsterdam, Netherlands, 1977; ISBN 0080179746. [Google Scholar]
  12. Seamon, D. Place, place identity and phenomenology: A triadic interpretation based on J.G. Bennett’s systematics. In The Role of Place Identity in the Perception, Understanding, and Design of Built Environments; Casakin, H., Bernardo, F., Eds.; Bentham eBooks: Sharjah, United Arab Emirates, 2012; pp. 3–21. ISBN 9781608054138. [Google Scholar]
  13. Tilley, C. Introduction: Identity, place, landscape and heritage. J. Mater. Cult. 2006, 11, 7–32. [Google Scholar] [CrossRef]
  14. Lynch, K. Good City Form; MIT Press: Cambridge, UK, 1984; ISBN 0262620464, 9780262620468. [Google Scholar]
  15. Jacobs, A.B. Great Streets; MIT Press: Cambridge, UK, 1995; ISBN 0262600234. [Google Scholar]
  16. Tuan, Y.-F. Space and Place: The Perspective of Experience; University of Minessota: Minneapolis, MN, USA, 1989; ISBN 0816608849. [Google Scholar]
  17. Franck, K.A.; Stevens, Q. Loose Space: Possibility and Diversity in Urban Life; Routledge: Oxfordshire, UK, 2006; ISBN 0203799577. [Google Scholar]
  18. Montgomery, J. Making a city: Urbanity, vitality and urban design. J. Urban Des. 1998, 3, 93–116. [Google Scholar] [CrossRef]
  19. Palen, L.; Salzman, M.; Youngs, E. Discovery and integration of mobile communications in everyday life. Pers. Ubiquitous Comput. 2001, 5, 109–122. [Google Scholar] [CrossRef]
  20. Elwood, S.; Mitchell, K. Technology, memory, and collective knowing. Cult. Geogr. 2015, 22, 147–154. [Google Scholar] [CrossRef]
  21. Arribas-Bel, D.; Tranos, E. Big Urban Data: Challenges and Opportunities for Geographical Analysis. Geogr. Anal. 2018, 50, 123–124. [Google Scholar] [CrossRef]
  22. Crooks, A.; Pfoser, D.; Jenkins, A.; Croitoru, A.; Stefanidis, A.; Smith, D.; Karagiorgou, S.; Efentakis, A.; Lamprianidis, G. Crowdsourcing urban form and function. Int. J. Geogr. Inf. Sci. 2015, 37–41. [Google Scholar] [CrossRef]
  23. Cheng, Z.; Caverlee, J.; Lee, K.; Sui, D.Z. Exploring Millions of Footprints in Location Sharing Services. In Proceedings of the Fifth International AAAI Conference on Weblogs and Social Media, Barcelona, Spain, 17–21 July 2011; pp. 81–88. [Google Scholar]
  24. Chen, M.; Arribas-Bel, D.; Singleton, A. Quantifying the characteristics of the local urban environment through geotagged flickr photographs and image recognition. ISPRS Int. J. Geo-Inf. 2020, 9, 264. [Google Scholar] [CrossRef] [Green Version]
  25. Dunkel, A. Visualizing the perceived environment using crowdsourced photo geodata. Landsc. Urban Plan. 2015, 142, 173–186. [Google Scholar] [CrossRef]
  26. Liu, Y.; Yuan, Y.; Zhang, F. Mining urban perceptions from social media data. J. Spat. Inf. Sci. 2020, 20, 51–55. [Google Scholar] [CrossRef]
  27. Wu, W.; Wang, J.; Dai, T. The geography of cultural ties and human mobility: Big data in urban contexts. Ann. Am. Assoc. Geogr. 2016, 106, 612–630. [Google Scholar] [CrossRef]
  28. Jenkins, A.; Croitoru, A.; Crooks, A.T.; Stefanidis, A. Crowdsourcing a collective sense of place. PLoS ONE 2016, 11. [Google Scholar] [CrossRef] [PubMed] [Green Version]
  29. Cranshaw, J.; Schwartz, R.; Hong, J.I.; Sadeh, N. The Livehoods Project: Utilizing Social Media to Understand the Dynamics of a City. In Proceedings of the 6th International AAAI Conference on Weblogs and Social Media, Dublin, Ireland, 4–7 June 2012. [Google Scholar]
  30. Dobson, J.E. Fieldwork in a digital world. Geogr. Rev. 2001, 1–2, 430–440. [Google Scholar] [CrossRef]
  31. Hochman, N.; Manovich, L. Zooming into an Instagram city: Reading the local through social media. First Monday 2013, 18. [Google Scholar] [CrossRef]
  32. Tu, W.; Zhu, T.; Xia, J.; Zhou, Y.; Lai, Y.; Jiang, J.; Li, Q. Portraying the spatial dynamics of urban vibrancy using multisource urban big data. Comput. Environ. Urban Syst. 2020, 80, 101428. [Google Scholar] [CrossRef]
  33. Poorthuis, A.; Zook, M. Making Big Data Small: Strategies to Expand Urban and Geographical Research Using Social Media. J. Urban Technol. 2017, 24, 115–135. [Google Scholar] [CrossRef]
  34. Palazzo, M.; Vollero, A.; Vitale, P.; Siano, A. Urban and rural destinations on Instagram: Exploring the influencers’ role in # sustainabletourism. Land Use Policy 2021, 100, 104915. [Google Scholar] [CrossRef]
  35. Maurer, S.M. Evolving approaches to place tagging in Social Media. J. Urban Plan. Dev. 2020, 146, 04020023. [Google Scholar] [CrossRef]
  36. Lv, Y.; Lan, Z.; Kan, C.; Zheng, X. Polycentric urban development and its determinants in china: A geospatial Big Data perspective. Geogr. Anal. 2020, 1–23. [Google Scholar] [CrossRef]
  37. Hochman, N.; Schwartz, R. Visualizing Instagram: Tracing Cultural Visual Rhythms. In Proceedings of the 6th International AAAI Conference on Weblogs and Social Media, Dublin, Ireland, 4–7 June 2012; pp. 6–9. [Google Scholar]
  38. Cultural Analytics Lab Cultural Analytics Lab-Projects. Available online: http://lab.culturalanalytics.info/p/projects.html (accessed on 13 April 2021).
  39. Kim, H.J.; Chae, B.K.; Park, S.B. Exploring public space through social media: An exploratory case study on the High Line New York City. Urban Des. Int. 2018, 23, 69–85. [Google Scholar] [CrossRef]
  40. Bolognesi, C.; Galli, A. Mapping socials a voluntary map of a great event in Monza Park. In Proceedings of the International and Interdisciplinary Conference IMMAGINI? Brixen, Italy, 27–28 November 2017; Volume 1, p. 917. [Google Scholar]
  41. López Baeza, J.; Serrano Estrada, L.; Nolasco-Cirugeda, A. Percepción y uso social de una transformación urbana a través del social media. Las setas gigantes de la calle San Francisco. I2 Innovación e Investig. en Arquit. y Territ. 2016, 4. [Google Scholar] [CrossRef]
  42. Huang, Y.; Li, J.; Wu, G.; Fei, T. Quantifying the bias in place emotion extracted from photos on social networking sites: A case study on a university campus. Cities 2020, 102, 102719. [Google Scholar] [CrossRef]
  43. Kitchin, R.; Dodge, M. Code/Space: Software and Everyday Life; The MIT Press: Cambridge, MA, USA, 2011; ISBN 9780262042482. [Google Scholar]
  44. Graham, M.; Zook, M.; Boulton, A. Augmented reality in urban places: Contested content and the duplicity of code. Trans. Inst. Br. Geogr. 2013, 38, 464–479. [Google Scholar] [CrossRef]
  45. Birmingham City Council. 2011 Census in Birmingham Population and Migration; Birmingham City Council: Birmingham, UK, 2013. [Google Scholar]
  46. National Statistics English Indices of Deprivation. 2019. Available online: http://dclgapps.communities.gov.uk/imd/iod_index.html# (accessed on 25 September 2021).
  47. Koukaras, P.; Tjortjis, C.; Rousidis, D. Social Media Types: Introducing a data driven taxonomy. Computing 2020, 102, 295–340. [Google Scholar] [CrossRef]
  48. Martí, P.; Serrano-Estrada, L.; Nolasco-Cirugeda, A. Social Media data: Challenges, opportunities and limitations in urban studies. Comput. Environ. Urban Syst. 2019, 74, 161–174. [Google Scholar] [CrossRef]
  49. Milias, V.; Psyllidis, A. Assessing the influence of point-of-interest features on the classification of place categories. Comput. Environ. Urban Syst. 2021, 86, 101597. [Google Scholar] [CrossRef]
  50. Adelfio, M.; Serrano-Estrada, L.; Martí-Ciriquián, P.; Kain, J.-H.; Stenberg, J. Social activity in Gothenburg’s intermediate city: Mapping Third Places through social media data. Appl. Spat. Anal. Policy 2020, 1–33. [Google Scholar] [CrossRef] [Green Version]
  51. Google Developers Places. Google Maps Platform. Available online: https://www.google.com/maps (accessed on 25 September 2021).
  52. Foursquare Labs, Inc. Foursquare. Available online: https://foursquare.com (accessed on 1 November 2020).
  53. Twitter Inc. Twitter. Available online: https://about.twitter.com/ (accessed on 1 December 2020).
  54. Gehl, J. Cities for People; Island Press: Washington, DC, USA, 2010. [Google Scholar]
  55. Serrano-Estrada, L.; Bernabeu Bautista, A.; Martí Ciriquián, P. Actividades económicas y urbanas en ejes estructurantes metropolitanos. La aportación de los datos geolocalizados de Google Places. Revista Urbano 2020, 42, 80–97. [Google Scholar] [CrossRef]
  56. Foursquare Inc. Foursquare Venue Categories. Available online: https://developer.foursquare.com/docs/resources/categories (accessed on 20 February 2021).
  57. Google Developers Place Types. Available online: https://developers.google.com/places/supported_types (accessed on 25 January 2021).
  58. Foursquare Inc. What is Foursquare Swarm. Available online: https://support.foursquare.com/hc/en-us/articles/201908440-What-is-Foursquare-Swarm- (accessed on 20 February 2020).
  59. Longan, M.W. Cybergeography IRL. Cult. Geogr. 2015, 22, 217–229. [Google Scholar] [CrossRef]
  60. Lesan, M.; Gjerde, M. Management of business activities along streets; an often neglected aspect of urban design. In Living and Learning: Research for a Better Built Environment: 49th International Conference of the Architectural Science Association; Crawford, R.H., Stephan, A., Eds.; The Architectural Science Association and The University of Melbourne: Melbourne, Australia, 2015; pp. 897–906. [Google Scholar]
  61. Latzko-Toth, G.; Bonneau, C.; Millette, M. Small Data, Thick Data: Thickening Strategies for Research, Trace-based Social Media. In The SAGE Handbook of Social Media Research Methods; SAGE Publications: Southend Oaks, CA, USA, 2016. [Google Scholar]
  62. Crampton, J.W.; Graham, M.; Poorthuis, A.; Shelton, T.; Stephens, M.; Wilson, M.W.; Zook, M. Beyond the geotag: Situating ‘big data’ and leveraging the potential of the geoweb. Cartogr. Geogr. Inf. Sci. 2013, 40, 130–139. [Google Scholar] [CrossRef]
  63. Yang, W.; Mu, L. GIS analysis of depression among Twitter users. Appl. Geogr. 2015, 60, 217–223. [Google Scholar] [CrossRef]
  64. Korson, C. Political Agency and Citizen Journalism: Twitter as a Tool of Evaluation. Prof. Geogr. 2015, 67, 364–373. [Google Scholar] [CrossRef]
  65. Montgomery, J. The Story of Temple Bar: Creating Dublin’s cultural quarter. Plan. Pract. Res. 1995, 10, 135–172. [Google Scholar] [CrossRef]
Figure 1. Research procedure stages.
Sustainability 13 11141 g001
Figure 2. Location of clusters 1 and 2 along Stratford Road (upper, left); visualization of the three trials with different radii area sizes surrounding each Google Places datapoint (bottom, left); spatial delimitation of Clusters 1 and 2 (right).
Sustainability 13 11141 g002
Figure 3. Recategorization of Google Places places into Foursquare categories.
Sustainability 13 11141 g003
Figure 4. Superimposed site visit and online retrieved photographs. Left and right pictures show the most checked in venue in Cluster 1 (Hall Green) and Cluster 2 (Solihull), respectively.
Sustainability 13 11141 g004
Figure 5. Left: the most active Twitter profile of CL1, and right: word cloud of CL1 topics included in tweet texts by frequency.
Sustainability 13 11141 g005
Figure 6. Left image: geolocated tweet hashtags; right image: word cloud of CL2 trending topics of tweet texts.
Sustainability 13 11141 g006
Figure 7. Superimposed site visits and online retrieved photographs. From left to right, the most popular Convenience Stores in Cluster 1 and Cluster 2.
Sustainability 13 11141 g007
Table 1. Population by age and ethnic group in Sparkhill and Shirley (East and West). Source: UK National Statistics via https://www.citypopulation.de/en/uk/ (accessed on 23 June 2021).
Sparkhill
(Hall Green)
Shirley East and Shirley West
(Aggregated)
(Solihull)
Total population
(2020 estimate)
21,65022,770
Pop. Density
(2020 estimate)
10,760/km24648/km2
Age group
(2020 estimate)
(average)
18–64 years60%57%
0–17 years31%23%
65+9%20%
Total100%100%
Ethnic group (census 2011)
White12%86%
Asian77%10%
Black5%1%
Other3%1%
Mixed3%2%
Total100%100%
Table 2. Foursquare, Google Places, and Twitter dataset metadata used for this study.
General VariablesFoursquareGoogle PlacesTwitter
1. LocationLongitudeLongitudeLongitude
LatitudeLatitudeLatitude
2. Temporal informationCumulative data on venuesUpdated data on registered placesTime the tweet was posted
3. User-generated dataVenue namePlace nameTweet text
Venue addressPlace address (vicinity)-
Check-insAverage place ranking-
Visits--
Users--
4. Data categorizationHierarchy of categories and sub-categoriesCategories, sub-categories, sub-sub-categories-
5. Data IDVenue ID and URLPlace IDTweet ID
Table 3. Upper: frequency of Foursquare venues and Google Places places by category and Twitter tweets by time frame. Bottom: economic activity registered on field visit.
. Cluster 1
Hall Green
Cluster 2
Solihull
2478 Linear Metres1745 Linear Metres
Foursquare venues
Demand for urban activities
Retrieval date:
30 September 2018
Average venues/100 linear metres1.74.2
Categories
Arts and Entertainment25%--
College and University25%--
Food1332%2433%
Nightlife Spot25%46%
Outdoors and Recreation12%11%
Professional and Other Places717%1014%
Residence12%--
Shop and Services922%3345%
Travel and Transport410%11%
Total venues41100%73100%
Google Places places
Urban activities on offer
Retrieval date:
30 September 2018
Average places/100 linear metres17.217.1
Categories
Arts and Entertainment31%21%
College and University174%72%
Food348%3110%
Nightlife Spot--62%
Outdoors and Recreation154%145%
Professional and Other Places7518%6422%
Shop and Services26662%16154%
Travel and Transport174%124%
Residence--10%
Total places427100%298100%
Twitter tweets
Spatiotemporal patterns of people presence
Retrieval period
20 September 2018 to 5 March 2019
Average tweets/100 linear metres1.25
Timeframes
Weekdays Evening
(Friday EXCL)
621%1922%
Weekdays Morning
(Friday INCL)
1138%1618%
Weekends Evening
(Friday INCL)
27%1821%
Weekends Morning
(Friday EXCL)
1034%3439%
Total tweets29100%87100%
Field study collected dataAverage field study registers/100 linear metres14.3 14.1
-Google Places data points misplaced7 14
-Not in Google Places dataset44 9
-Could not be found on field visit58 38
Total registers collected through field visits356 246100%
Table 4. Foursquare venues within the Nightlife Spot category.
CL1 (Hall Green)UsersCheck-insVisits
Rangin244
Farahzad Lounge5224
Total7628
CL2 (Solihull)
Red Lion456093
Saracens Head126136211
The Pump House (Wetherspoon)212216509
Royal British Legion4175126
Total424487939
Table 5. Ranking of Foursquare venues by amount of check-ins.
Cluster 1 (Hall Green) Cluster 2 (Solihull)
Venue NameVisitsCheck-insUsersMain
Category
Venue NameVisitsCheck-insUsersMain
Category
1M.Y.Travel & Money Services Ltd28441751407Professional and Other Places1Costa Coffee976543323Food
2Sparkbrook27819286Residence2Nando′s339321200Food
3Mushtaq′s19017835Food3Morrisons Shirley367240110Shop and Service
4Stratford Road17017053Travel and Transport4The Pump House
(Wetherspoon)
509216212Nightlife Spot
5Barclays17316923Shop and Service5Aldi736172209Shop and Service
6Sparkhill17016346Outdoors and Recreation6Lloyds Bank25417086Shop and Service
7ShahiNan Kebab388113132Food7The Shirley Centre23914850Professional and Other Places
8Aldi239100108Shop and Service8Saracens Head211136126Nightlife Spot
9Caspian Pizza Complex1078025Food9The Gym21613042Outdoors and Recreation
10Yaqub′s Halal Steak House and Grill21563135Food10M&S SimplyFood13012254Shop and Service
11Hajee′s
Spices
995868Food11Desco Lounge393121201Food
12Mighty Q544320Shop and Service12Big John′s12510650Food
13Faithful Neighbourhood Centre36369Professional and Other Places13NatWest1568866Shop and Service
14Guru
Nanak Gurdwara
632038Professional and Other Places14Post Office1668674Professional and Other Places
15Subway1051845Food15Domino′s Pizza767642Food
Table 6. Foursquare’s Food category venues and their cumulative visits, check-ins, and users.
Cluster 1
Hall Green
VisitsCheck-insUsersCluster 2
Solihull
VisitsCheck-insUsers
Asian Restaurant444127173Asian Restaurant282422
Dipyum222Chop Wok10910
Lahore KarahiChopstix541239Good Wok181512
ShahiNan Kebab388113132Bistro407130208
Dessert Shop57937Desco Lounge393121201
Cravings57937Parksidebistro1497
FastFood Restaurant555Café231219
Karachi555Alba Sandwiches554
Indian Restaurant251917CoffeeRoaster18715
Bab-E-Khyber222Coffee Shop985550329
Deepalis231715Costa Coffee976543323
Pakistani Restaurant289236103KairosCoffee976
Hajee′sSpices995868Fast Food Restaurant18616384
Mushtaq′s19017835Big John′s12510650
Pizza Place1078025Shirley Kebab House615734
Caspian Pizza Complex1078025North IndianRestaurant11410360
Sandwich Place1051845DosaVillage221
Subway1051845Indico Street Kitchen& Bar766
Steakhouse22169140Oasis Restaurant302324
G3 Steak& Grill665Shah′sBistro994
Yaqub′s Halal Steak House & Grill21563135ShaplaTandorri666325
Total1253563545Italian Restaurant765746
Little Italy231313
Prezzo534433
Pizza Place16014582
Domino′s Pizza767642
perfetto pizza773
PizzaExpress776237
Portuguese Restaurant339321200
Nando′s339321200
SandwichPlace1324874
Subway1324874
Turkish Restaurant1463978
Istanbul Restaurant1463978
Vegetarían/Vegan Restaurant14137
Falafel Munch14137
Total261016051209
Table 7. Types and amount of Foursquare Shop and Services category venues.
Cluster 1
Hall Green
Total
Venues
VisitsCheck-insUsersCluster 2
Solihull
Total
Venues
VisitsCheck-insUsers
Bank117316923Bank7691390275
Convenience Store1544320Food and Drink Shop5206168106
Furniture/Home Store125418Shopping Mall1797226
Food and Drink Shop1665Salon/Barbershop4765124
Pharmacy1332Sporting Goods Shop1302220
Betting Shop1222Gift Shop1292912
Clothing Store1222Optical Shop1252411
Smoothie Shop1222Auto Dealership1181712
Bridal Shop1111Furniture/Home Store217139
Total926823275Clothing Store114137
Pharmacy112111
Convenience Store211119
Thrift/Vintage Store1332
Photography Lab1332
Miscellaneous Shop1221
Mobile Phone Shop1221
Real Estate Office1111
Shoe Repair1111
Total331220833520
Publisher’s Note: MDPI stays neutral with regard to jurisdictional claims in published maps and institutional affiliations.

