Article

The Impact of Cascade Large Deep Reservoir on the Migration and Deposition of Cadmium in Lancang River

1
State Key Laboratory of Simulation and Regulation of Water Cycle in River Basin, China Institute of Water Resources and Hydropower Research, Beijing 100038, China
2
Hebei Key Laboratory of Intelligent Water Conservancy, Hebei University of Engineering, Handan 056038, China
3
School of Water Conservancy and Hydroelectric Power, Hebei University of Engineering, Handan 056038, China
4
Department of Water Environment, China Institute of Water Resources and Hydropower Research, Beijing 100038, China
*
Authors to whom correspondence should be addressed.
Sustainability 2021, 13(20), 11137; https://doi.org/10.3390/su132011137
Submission received: 25 August 2021 / Revised: 22 September 2021 / Accepted: 7 October 2021 / Published: 9 October 2021

Abstract

:
Metal pollution is a global environmental problem. In order to understand the effects of the cascade hydropower development on Cd in reservoir sediments, this study investigated the migration and deposition mechanisms of Cd in reservoir sediments by using the film diffusion gradient technique (DGT) for the cascade large deep reservoirs of the Lancang River (LCR), Nuozhadu (NZD) and Xiaowan (XW). The results show that: (1) Strong correlations amongst the deposition processes of Cd, Mn and S were found in the sediments of the NZD reservoir; weak correlations between the deposition processes of Cd and Mn were found in the sediments of the XW reservoir. (2) Part of labile Cd in the pore water of the NZD reservoir was supplemented by silt and sand, and another part was inherent in the pore water; most of labile Cd in the pore water of the XW reservoir was inherent in the pore water, and minimal replenishment of sediment was noted. (3) Mn is the main factor controlling the migration of Cd in the NZD reservoir. This paper provides an effective resource for understanding the migration and deposition of Cd in the sediments of large deep reservoirs along the LCR.

1. Introduction

Cd is a toxic, bioaccumulating trace metal. Its low-dose intake by the human body can cause bone and kidney damage [1,2]. Xu et al. [3] compared sediment quality criteria and potential ecological risks and found high ecological risks due to Cd. The cascade construction of large deep reservoirs affects the continuity of rivers and changes the scope of the inflow of regional sediments. The intercepted water of upstream reservoirs increases sediment deposition rates and reduces the transportation of sediments in downstream reservoirs [4,5]. Retention of sediments in upstream reservoirs and the influx of sediments in downstream areas simultaneously affect the cycle of biological matter in the sediments of downstream reservoirs and pose a severe threat to the water quality, freshwater resources and aquatic ecosystem of these reservoirs [6].
Sediments have a strong tendency to accumulate trace metals, are the main storage site for natural and man-made interference metals and are an important medium for evaluating the pollution level of aquatic ecosystems [7,8]. Environmental factors, such as pH, dissolved oxygen (DO), conductivity and temperature, have important effects on the migration and deposition of trace metals in sediments [9,10]. Specifically, the higher the pH, the more alkaline the water and the greater the ease with which trace metals in the overlying water precipitate into the sediments. Conversely, the lower the pH, the more acidic the water and the greater the ease with which trace metals in the sediment are released into the pore water [11]. Anoxic conditions may cause the release of trace metals from Fe/Mn oxides [12]. The higher the conductivity, the stronger the adsorption capacity of the overlying water and pore water for trace metals [9]. The higher the temperature, the stronger the reducibility of Fe, Mn and S in the sediment [13]. A previous study found that the concentration of labile Cd in the sediments of Lake Taihu is significantly positively correlated with labile Mn but not with labile Fe, thereby indicating that Mn is the main metal element controlling the migration of Cd in pore water [14]. Zhang et al. [15] determined a strong negative correlation between labile Cd and Fe in Jialing River sediments by passive sampling; this finding indicates that Fe oxides in the sediments affect the release of Cd. The labile Cd in the sediments of the Three Gorges Reservoir Region is negatively correlated with labile Fe and Mn, which indicates that Fe/Mn oxides do not interfere with the release of Cd [16]. Previous studies showed that excessive S in sediments could cause Cd to precipitate in the form of CdS. Compared with other metals (e.g., Fe and Mn), the solubility of CdS is lower, and S can preferentially precipitate Cd [17]. Thus far, most studies on the migration mechanism of Cd in China focused on lakes and rivers. By comparison, the influence of the migration mechanism of Cd on the sediments of large deep reservoirs remains unclear, and few scholars have studied the impact of cascade reservoir construction on Cd deposition and migration.
Previous studies found that contact with oxygen during sample transport could change the chemical form of trace metals in the sediment [1]. Remote measurement may lead to the redissolution, redistribution and resorption of trace metals in the sediment and change the chemical composition of trace metals during measurement [18,19,20]. Therefore, in the present study, a new technique, i.e., thin-film diffusion gradient technology (DGT), was adopted. This technology has attracted great attention in recent years on account of its ability to measure active trace metals, cations and anions in sediments, water and soil immediately with high resolution [21,22,23]. The bioavailability of trace metals is related not only to their concentration in sediment but also to the migration speed of these metals in it [24,25]. DGT provides a new approach to the determination of trace metal concentrations in sediments [26]. The results of many research works indicate that DGT could be used to study labile trace metals in pore water [22,27,28].
The main objectives of this study were as follows. (1) Study the influence of the physicochemical characteristics of the overlying water of large deep reservoirs on Cd migration and deposition in surface sediments. (2) Analyze the main mechanism controlling Cd migration and deposition in the sediments of large deep reservoirs. (3) Discuss the potential impact of cascade reservoirs on the migration and deposition of Cd.

2. Materials and Methods

2.1. Study Area

The Lancang-Mekong River is the largest international river in Southeast Asia, with a length of 4880 km and a drainage basin of approximately 7.95 × 10⁵ km. The Lancang River (LCR) is located in upstream of the Lancang-Mekong River, with an annual average discharge of about 2350 m3/s. The main stream of LCR is 2161 km long, with a drainage area of approximately 1.57 × 10⁵ km2 [5,29,30]. It originates in the northeast of Tanggula Mountain in Qinghai Province of China, bordering the China–Myanmar international border to the east and the China–Laos international border to the north and is formed by the rapid drift of the Indian tectonic plate to the Eurasian plate [31]. On both sides of LCR, from south to north, there are low and medium mountains and wide valleys, and there are also high mountains and deep valleys [32]. There are two large deep reservoirs in the study area, XW and NZD, both with a storage capacity of over 10 billion. A total of six sampling points were arranged in this study, with more detailed information shown in Figure 1 and Table 1. They are located in upstream and downstream of XW and NZD reservoirs: XW-A, XW-B and XW-C and NZD-A, NZD-B and NZD-C, respectively.

2.2. Sample Collection and Analysis

A total of 2 undisturbed sediment column samples were collected near each sampling site in December 2019 using a sediment column sampler (6 cm in diameter and 100 cm in length). The samples taken had a clear interface between sediment and overlying water, and after the overlying water phase of column A was aspirated and discarded with a hose on site, sediment samples were taken at 1 cm intervals in layers in polyethylene plastic bags and stored frozen. Column B was sealed at the ends of the plastic tubing with rubber plugs, then the sediment core was kept upright to minimize disturbance and transported immediately to the laboratory. The portable multi-parameter water quality meter (Yellow Springs Instruments Inc., Yellow Springs, OH, USA, EXO2 Multiparameter Sonde) has 7 sensor ports that can measure dissolved oxygen, pH, conductivity and temperature and other physicochemical indicators of the overlying water simultaneously every 2–3 s. The frozen sediment column samples from column A were placed inside a vacuum freeze-dryer at −60.9 °C before the experiment, and the cold-dried sediment was ground and passed through a 100-mesh sieve (pore size of 150 μm). Two hundred milligrams of sample was digested in a 6 mL HNO3 and 2 mL HF mixture in Teflon tubes, and the contents of Cd, Fe and Mn were analyzed using inductively coupled plasma-mass spectrometry (ICP-MS) [33]. The content of S in the sediment was determined by elemental analyzer. The analysis of duplicate samples, blanks and reference materials (GSD-9 and GSD-11, Chinese geological reference materials) was used for quality control. The average recoveries of the different metals were in the range of 81.2–107.6%. The sediment particle size was measured by laser particle size analyzer (Mastersizer 2000, Malvern Instruments Ltd., Malvern, Worcestershire, UK) and graded according to clay < 5 μm, 5 < silt < 50 μm and 50 < sand < 150 μm.
Before arranging the DGT apparatus, the DGT was immersed into a solution of 1 mol/L NaCl without metal ions. After the B column was stabilized at 25 ± 0.5 °C for at least 24 h, the DGT (Chelex 100 resin gel) was inserted into the sediment at a laboratory temperature of 25 ± 0.5 °C, and the sediment was kept in the dark throughout the process by covering it with tinfoil. After 24 h, the DGT was removed, the sediment–water interface (SWI) was marked, and the gel was cut by 5 mm, placed in a 1.5 mL centrifuge tube and extracted with 1 mL of 1 mol/L HNO3 for at least 24 h. Then 4 mL of deionized water was added and diluted, and the concentration of DGT-labile Cd, Fe, Mn and S from sediments into pore water and inherent in pore water within 24 h was analyzed by ICP-MS; each sample was measured three times, and an average value was calculated. AgI-bound gels were scanned using a flatbed scanner (Canon 5600F), and the images were analyzed using ImageJ 1.41 software for grayscale intensity analysis of the images. The cumulative mass of S was calculated based on a previous study [34]. HNO3, HF and NaCl reagents used are professional analytical grade, supplied by Yantai Shuangshuang Chemical Co., Ltd., in Yantai, China.

2.3. Calculation Process

The mass of trace metal accumulated on the resin gel (M) can be calculated from the concentration of trace metal in the elution solution (Ce), according to Equation (1) [22]:
M = Ce(Vgel + Vacid)/Fe
where Vgel is the volume of the binding gel, mL; Vacid is the volume of the eluting acid, mL; Fe is the elution factor, and the elution factor takes the value of 0.80 [35].
The concentrations of labile Cd, Fe, Mn and S in the sediment–water profile measured by DGT were calculated using Equation (2) [33]:
CDGT = M × Δg/D × A × t
where A is the area of the gel, cm2; Δg is the total thickness of the diffusion gel layer and the filter membrane, mm; t is the deployment time, h; and D is the diffusion coefficient of the metal in the gel, cm2s−1. At 25 °C, DCd = 6.09 × 10⁻⁶cm2s−1; DFe = 6.11 × 10⁻⁶cm2s−1; DMn = 5.85 × 10⁻⁶cm2s−1; DS = 15.57 × 10⁻⁶cm2s−1. (http://www.dgtresearch.com, accessed on 5 November 2020.)
To evaluate the potential factors affecting Cd migration at the SWI of the cascade large deep reservoirs, the apparent diffusion fluxes of labile Cd, Fe, Mn and S at SWI were calculated using a numerical model. Considering the different recharge mechanisms of DGT uptake in sediment and overlying water, the apparent diffusion fluxes were the sum of the apparent fluxes of overlying water and sediment, respectively, as in Equation (3) [36]:
F = FW + FS = − DW(∂CDGT/∂XW)(X = 0) – μ × DS(∂CDGT/∂XS)(X = 0)
where F denotes the total flux of Cd and other elements (Fe, Mn and S(–II)) at the interface, and FS and FW denote the flux of Cd and other elements from sediment to SWI and from water to SWI, respectively. The overlying water concentration gradients (∂CDGT/∂XW)(X = 0) and (∂CDGT/∂XS)(X = 0) measured by DGT are the slopes of the change in DGT concentration (∂CDGT) at a certain distance from the interface. To accurately estimate the flux of Cd and other elements, we chose concentration at a distance of about 5 mm from the SWI to calculate the diffusion gradient of the SWI. The matrix-specific diffusion coefficient of Cd and other elements in the overlying water column (DW) and sediment (DS) is D. In addition, the surface sediment porosity is μ, and the porosity of the top 5 mm layer is 0.9 [21,37]. DW and DS are the diffusion coefficients of trace metals in the overlying water column and sediment, respectively. DW and DS values were calculated by empirical Equation (4) [38,39]:
DS = μ2 × DW (μ > 0.7)

3. Results

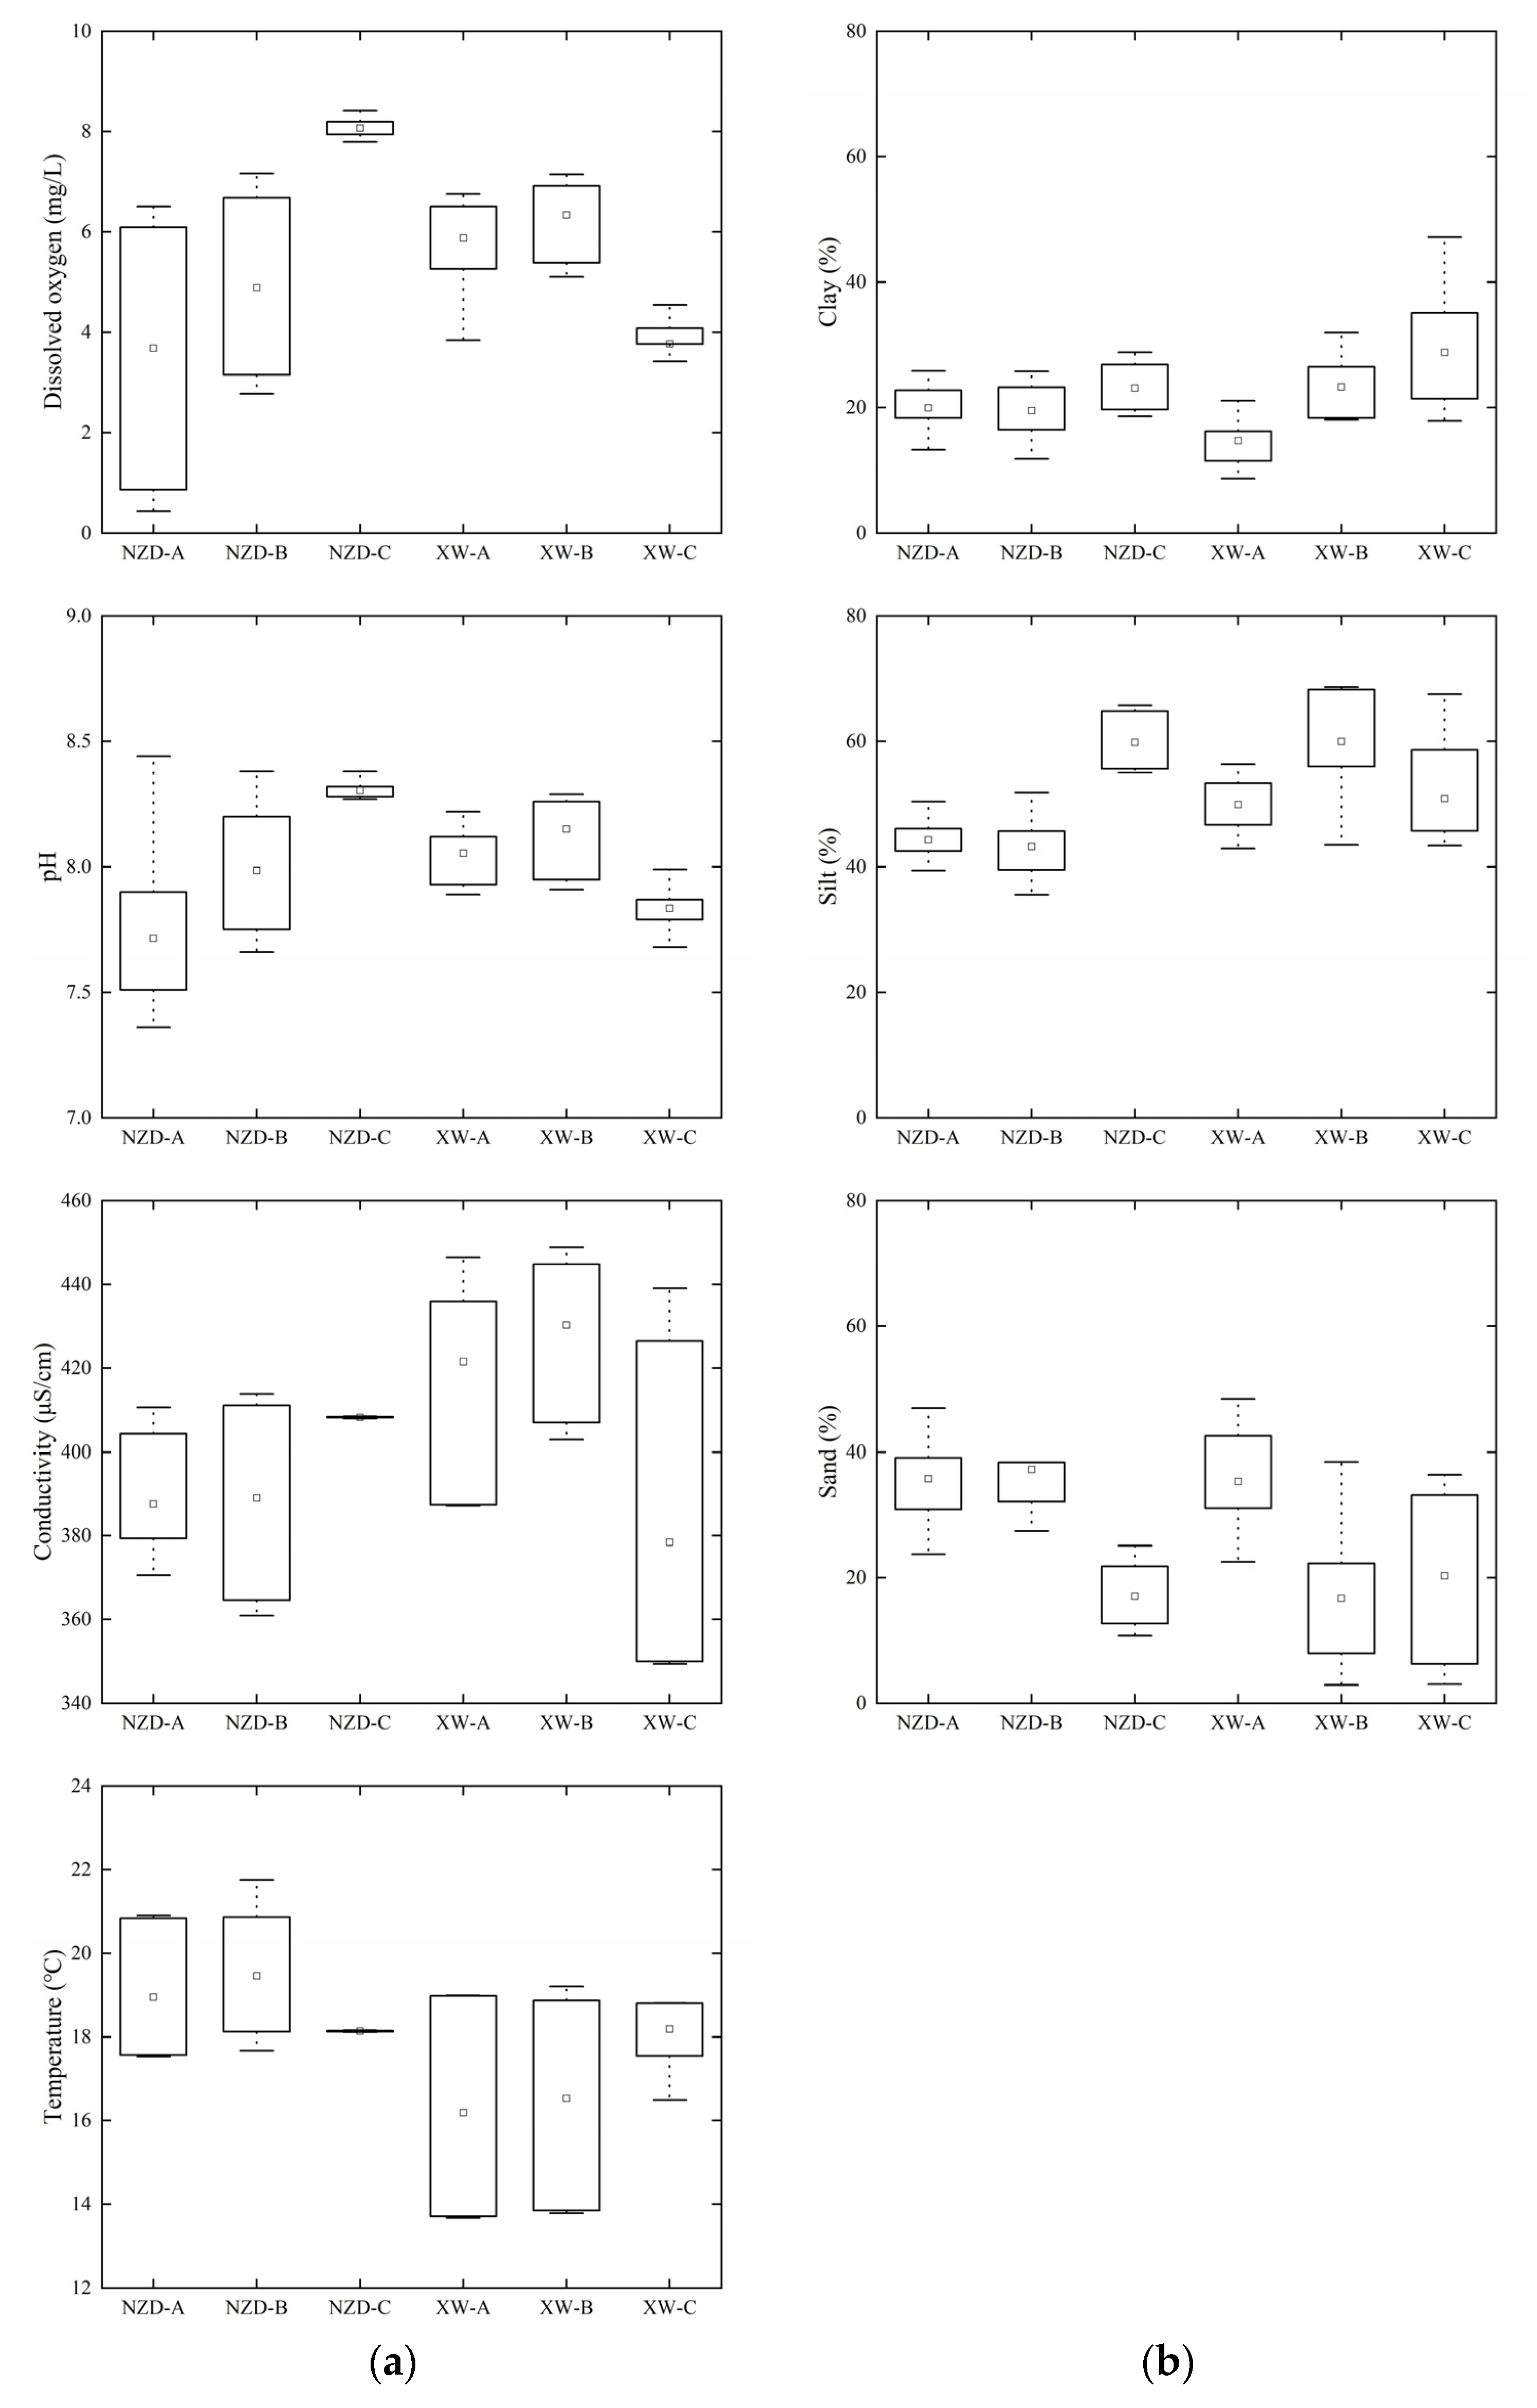
3.1. Physicochemical Properties of Large Deep Reservoirs

The DO, pH, conductivity and temperature of the overlying water are the main physicochemical characteristics affecting the adsorption, desorption and redox capacity of the SWI. The characteristics and mean values of these factors’ distribution in the overlying water and sediment of the NZD and XW reservoirs are shown in Figure 2 and Table 2. The average DO concentration in the overlying water of the XW reservoir (i.e., 5.33 ± 0.71 mg/L) is slightly lower than that of the XW reservoir (i.e., 5.55 ± 1.37 mg/L). The SWI has poor oxidation conditions, leading to SWI oxidation. Reductions in reduction potential are conducive to the reduction and dissolution of Fe/Mn oxides [40]. The oxidation conditions of the overlying water at all sampling points in the NZD and XW reservoirs are similar, and these points do not appear to be in the hypoxic zone. Only at NZD-A, which was about 30 m away from the SWI below the water depth of 130 m, the concentration of DO was lower than 1.0 mg/L, and the lowest concentration was 0.43 mg/L; thus, the area may be categorized as a severely hypoxic zone. The oxidation conditions of NZD-C are much higher than those of other sampling points. The average pH of the overlying water of the two cascade large deep reservoirs is weakly alkaline, and trace metals in this water may easily precipitate in the sediments [11]. The average conductivity of the overlying water of XW (i.e., 410.05 ± 25.53 μS/cm) is higher than that of NZD (i.e., 394.94 ± 11.23 μS/cm), which indicates that the SWI of XW has a higher adsorption capacity for trace metals than that of NZD (Figure 2a). The XW reservoir is located in the upper reaches of the LCR, close to the Qinghai–Tibet Plateau; as such, the average water temperature of the overlying water of XW (i.e., 16.97 ± 1.71 °C) is lower than that of NZD (18.85 ± 11.23 °C). The higher the temperature of the overlying water, the stronger the reduction of Fe, Mn and S(–II) in the surface sediments [13] (Figure 2a).
The smaller the particle size, the greater the adsorption capacity rate of the sediments [41]. Figure 2 shows the particle size of the NZD and XW sediments. The contents of clay (20.88 ± 3.78 %) and silt (49.12 ± 3.84 %) in NZD are lower than those in XW (i.e., 22.27 ± 5.55 % and 53.61 ± 6.19 %, respectively). By contrast, the sand content of NZD (30.01 ± 6.09 %) is higher than that of XW (24.12 ± 9.73 %). The particle size distribution results show that the adsorption capacity and adsorption capability of XW are greater than those of NZD (Figure 2b).
The multi-parameter water quality meter collects data approximately every 2–3 s after entering the overlying water body, 450, 369, 202, 415, 442 and 388 times at sampling points NZD-A, NZD-B, NZD-C, XW-A, XW-B and XW-C, respectively.

3.2. Vertical Distribution of Sediment and Water Profiles of Cd and Other Elements

Vertical changes in Cd and other elements in the sediment–water profile of the NZD and XW reservoirs are shown in Figure 3. The variation ranges of Cd contents in the sediment profiles of NZD and XW are 0.07–2.82 and 0.17–1.18 mg/kg, respectively. Amongst the six sampling points, Cd shows no obvious increasing or decreasing trend with increasing depth, except at point NZD-B, which reveals an obvious increasing trend with increasing depth (Figure 3a). From −2 cm to −10 cm below the SWI, Cd and Mn reflect similar spatial distribution trends in all six sampling points of the two large deep reservoirs. Statistics show that Cd and Mn have a significant correlation in the sediments of NZD from −2 cm to −10 cm (r ≥ 0.775, p < 0.05) and in the sediments of XW from −2 cm to −10 cm (r ≥ 0.567, p < 0.05). The correlation mixing matrix between Cd and other factors in the sediments of the two large deep reservoirs is shown in Figure 4. Correlation analysis shows that Cd in the sediments of NZD is positively correlated with Mn and S, but Cd in the sediments of XW is only significantly positively correlated with Mn; no significant correlation with other factors is observed. Table 3 indicates that Cd contents in the sediments of NZD and XW are lower than those in most domestic lakes and reservoirs but slightly higher than those in some lakes and reservoirs in foreign countries. These results show that the level of Cd pollution in the NZD and XW reservoirs is much lower than those in other parts of China.
No significant difference in the vertical changes of DGT-labile Cd is observed in pore-water profiles of the NZD and XW reservoirs, and the concentration ranges in these reservoirs are 0.48–0.72 and 0.50–0.73 μg/L, respectively (Figure 3b). DGT-labile Fe and Mn show a significant increasing trend below the SWI, which may be mainly attributed to the reduction and dissolution of Mn and Fe oxides mediated by bacterial activity [55]. The trends of the release of DGT-labile S and Fe at points NZD-B, XW-A and XW-B may be due to the coexistence of S- and Fe-reducing bacteria described by Naylor et al. [56]. Amongst the six sampling points, DGT-labile Cd shows no obvious increasing or decreasing trend with increasing depth. From −1 cm to −9 cm below the SWI, DGT-labile Cd, Mn and S show similar vertical distribution characteristics at points NZD-A and XW-B. In addition, DGT-labile Fe, Mn and S have similar vertical distribution characteristics in the pore water of sampling points NZD-B, NZD-C and the XW reservoir. These results suggest that the presence of a large number of reductively active bacteria and S in the sediments of these sampling sites promotes the reductive dissolution of Fe and Mn oxides. Statistics show a significant correlation between DGT-labile Cd and Mn in the pore water of the sediments of the NZD reservoir from −1 cm to −9 cm (r ≥ 0.733, p < 0.05); in the sediments of the XW reservoir, no significant correlation between DGT-labile Cd and Mn is noted in the pore water from −1 cm to −9 cm (r ≥ −0.269, p < 0.05). Correlation analysis shows that DGT-labile Cd in NZD is positively correlated with DGT-labile Mn and sand and negatively correlated with silt (Figure 4a). In XW, DGT-labile Cd has no significant correlation with other elements (Figure 4b).
Previous studies have found that in comparison with other metals (such as Fe and Mn), S(–II) could preferentially precipitate Cd due to the low solubility of CdS [17]. The two-dimensional distribution of DGT-labile S in the sediments of the NZD and XW reservoirs (reflected by DGT-Flux) is shown in Figure 5. The average fluxes of DGT-labile S at NZD-C (1 pg cm−2 S−1) and XW-C (8 pg cm−2 S−1) are quite low. By comparison, the average fluxes of DGT-labile S at NZD-A (16 pg cm−2 S−1), NZD-B (24 cm−2 S−1), XW-A (11 cm−2 S−1) and XW-B (14 cm−2 S−1) are relatively high.

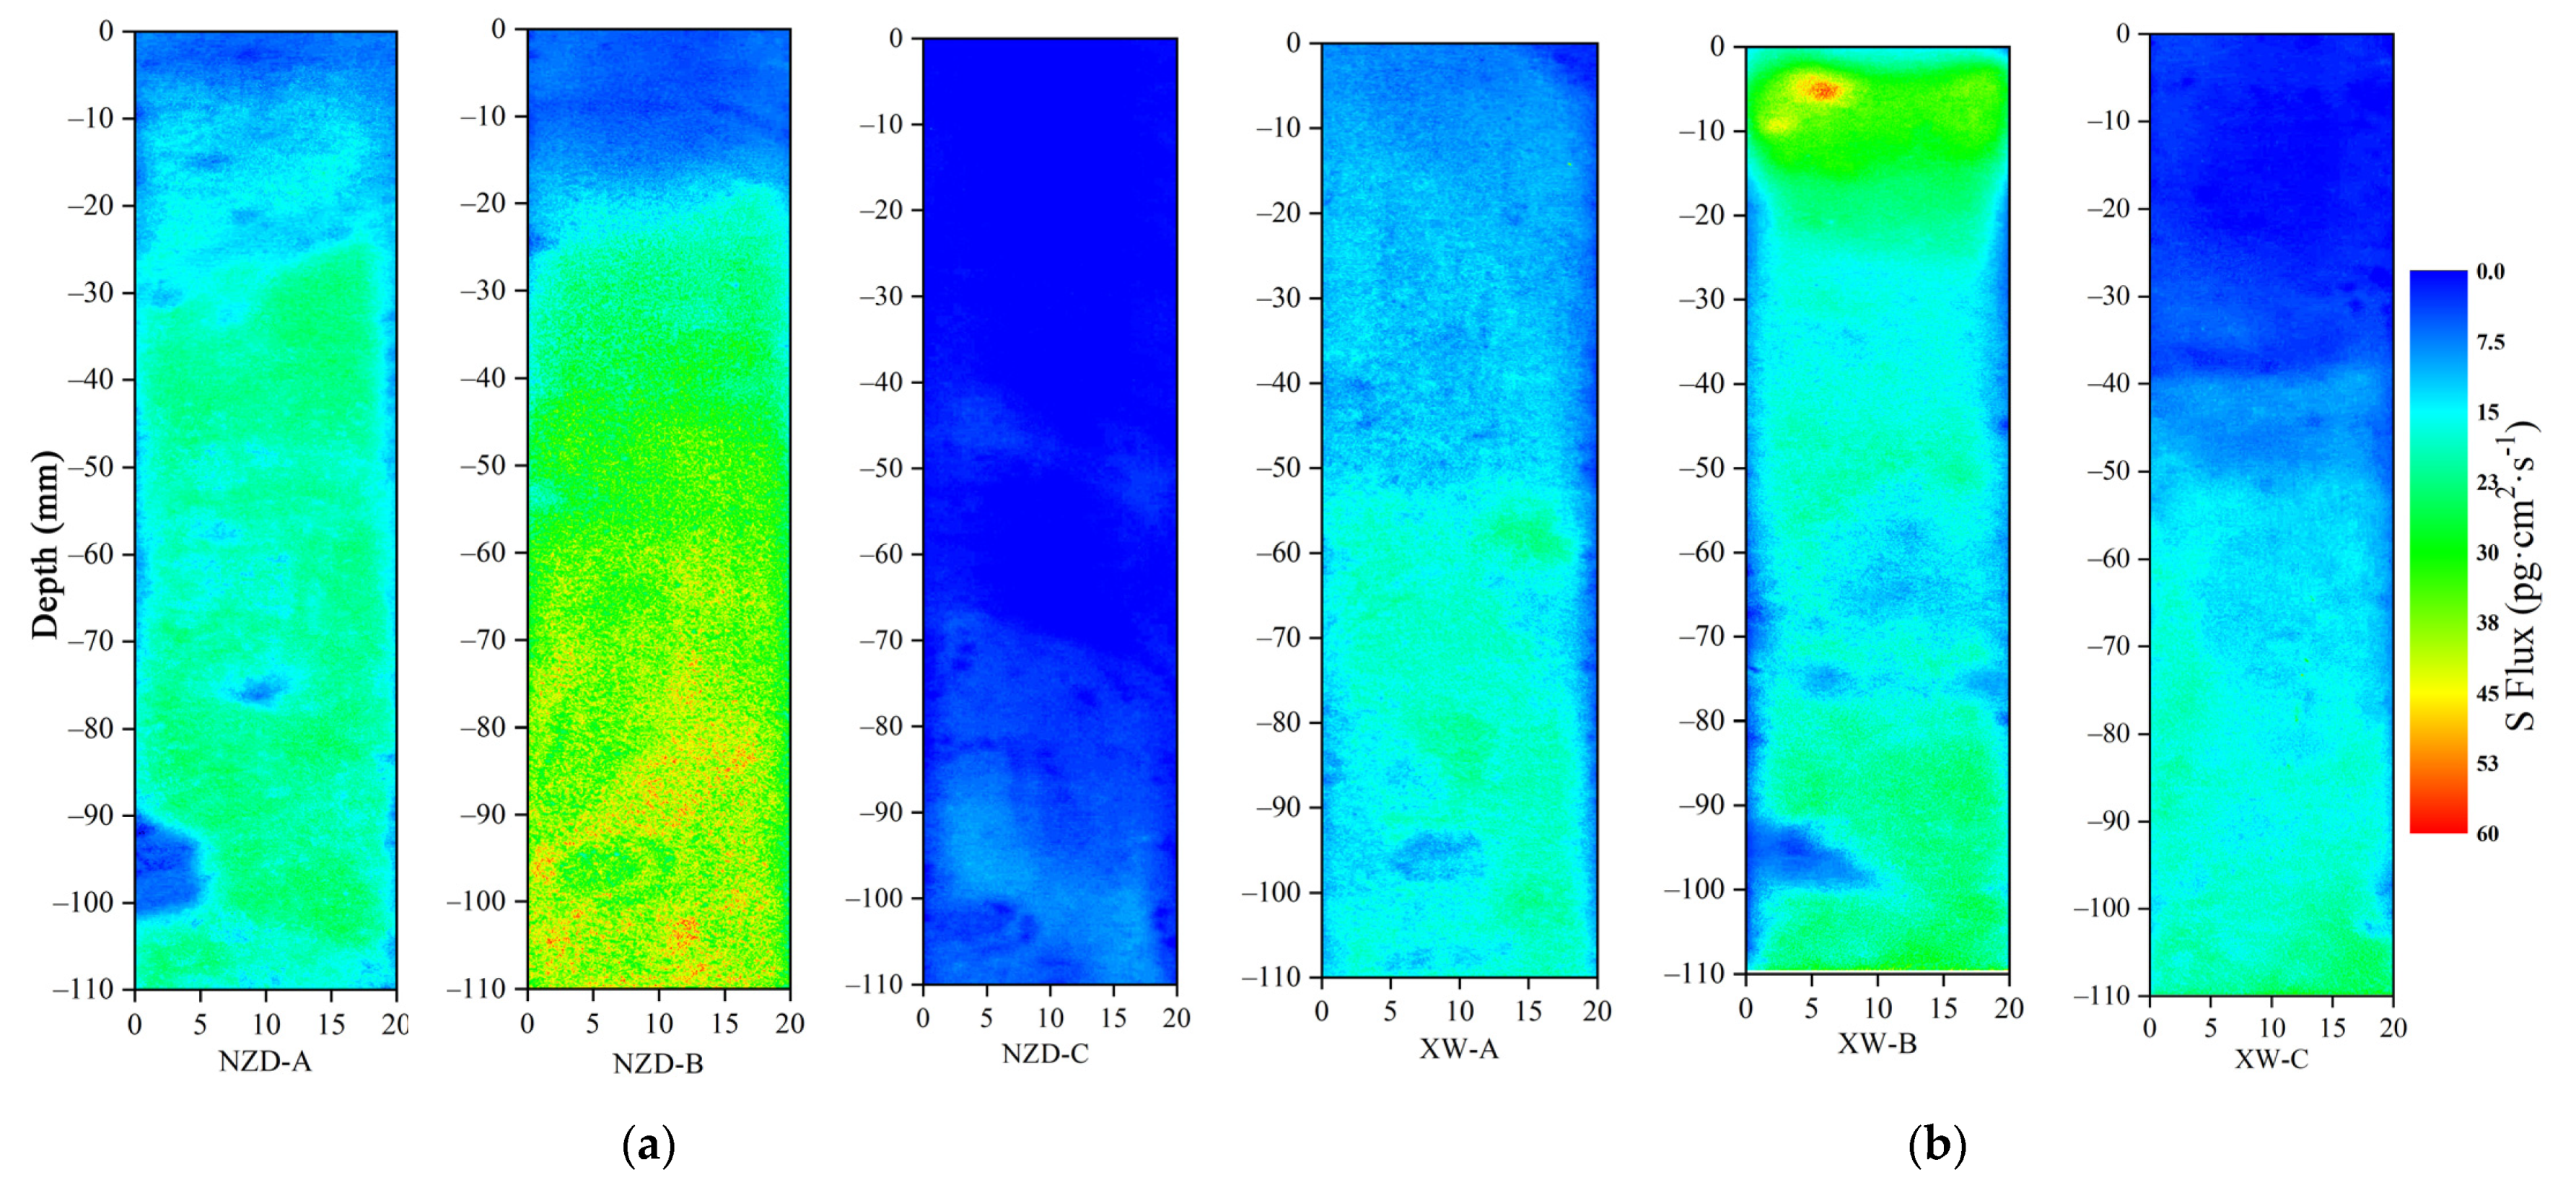
3.3. Diffusion Characteristics of Cd and Other Elements in Surface Sediments

The source and sink functions of surface sediments are mainly determined by the apparent diffusion fluxes of trace metals in the SWI. In this study, DGT was used to measure the concentration of labile Cd within 5 mm of the upper and lower SWI rapidly. The apparent diffusion fluxes of Cd and other elements were calculated using Equations (3) and (4), as shown in Figure 6. A positive apparent diffusion flux indicates that the sediment is a source of labile Cd, and a negative one indicates that the sediment is a sink of labile Cd (Figure 6a). The results show that although the functions of sediment sources and sinks at different sampling points of the two reservoirs are different, the distribution trends of the sources and sinks are relatively consistent. The apparent diffusion fluxes of labile Cd in the surface sediments at NZD-C and XW-C are −20.47 and −6.76 ng cm−2d−1, respectively, thereby indicating that the deposits of NZD-C and XW-C are potential sinks of labile Cd. The surface sediments at other sampling points are all potential sources of labile Cd. The closer to the dam, the smaller the apparent diffusion flux of labile Cd. Amongst the sampling sites, the release risk of labile Cd in the surface sediments at point XW-B is the highest, whereas that at point NZD-A is the lowest. For the NZD reservoir, the surface sediments at points NZD-A and NZD-B act as sources for Cd, Fe, Mn and S, while NZD-C is a sink. For the XW reservoir, the surface sediments at points XW-A and XW-B act as sources for Cd, Fe, Mn and S, but the source–sink mechanisms for Cd and Fe, Mn and S at point XW-C show opposite trends. This may be related to the relatively low conductivity and sand content at the XW-C point (Table 2). However, it can be inferred from the consistency of the source–sink of Cd with other elements at the pre-reservoir and mid-reservoir locations of the two reservoirs that there is a synchronous release mechanism between labile Cd and other elements in the surface sediments (Figure 6). The particle size of the sediment at each sampling point and differences in DO, pH, conductivity and temperature in the overlying water may explain these findings, as the aforementioned factors affect the adsorption and desorption of trace metals by surface sediments.

4. Discussion

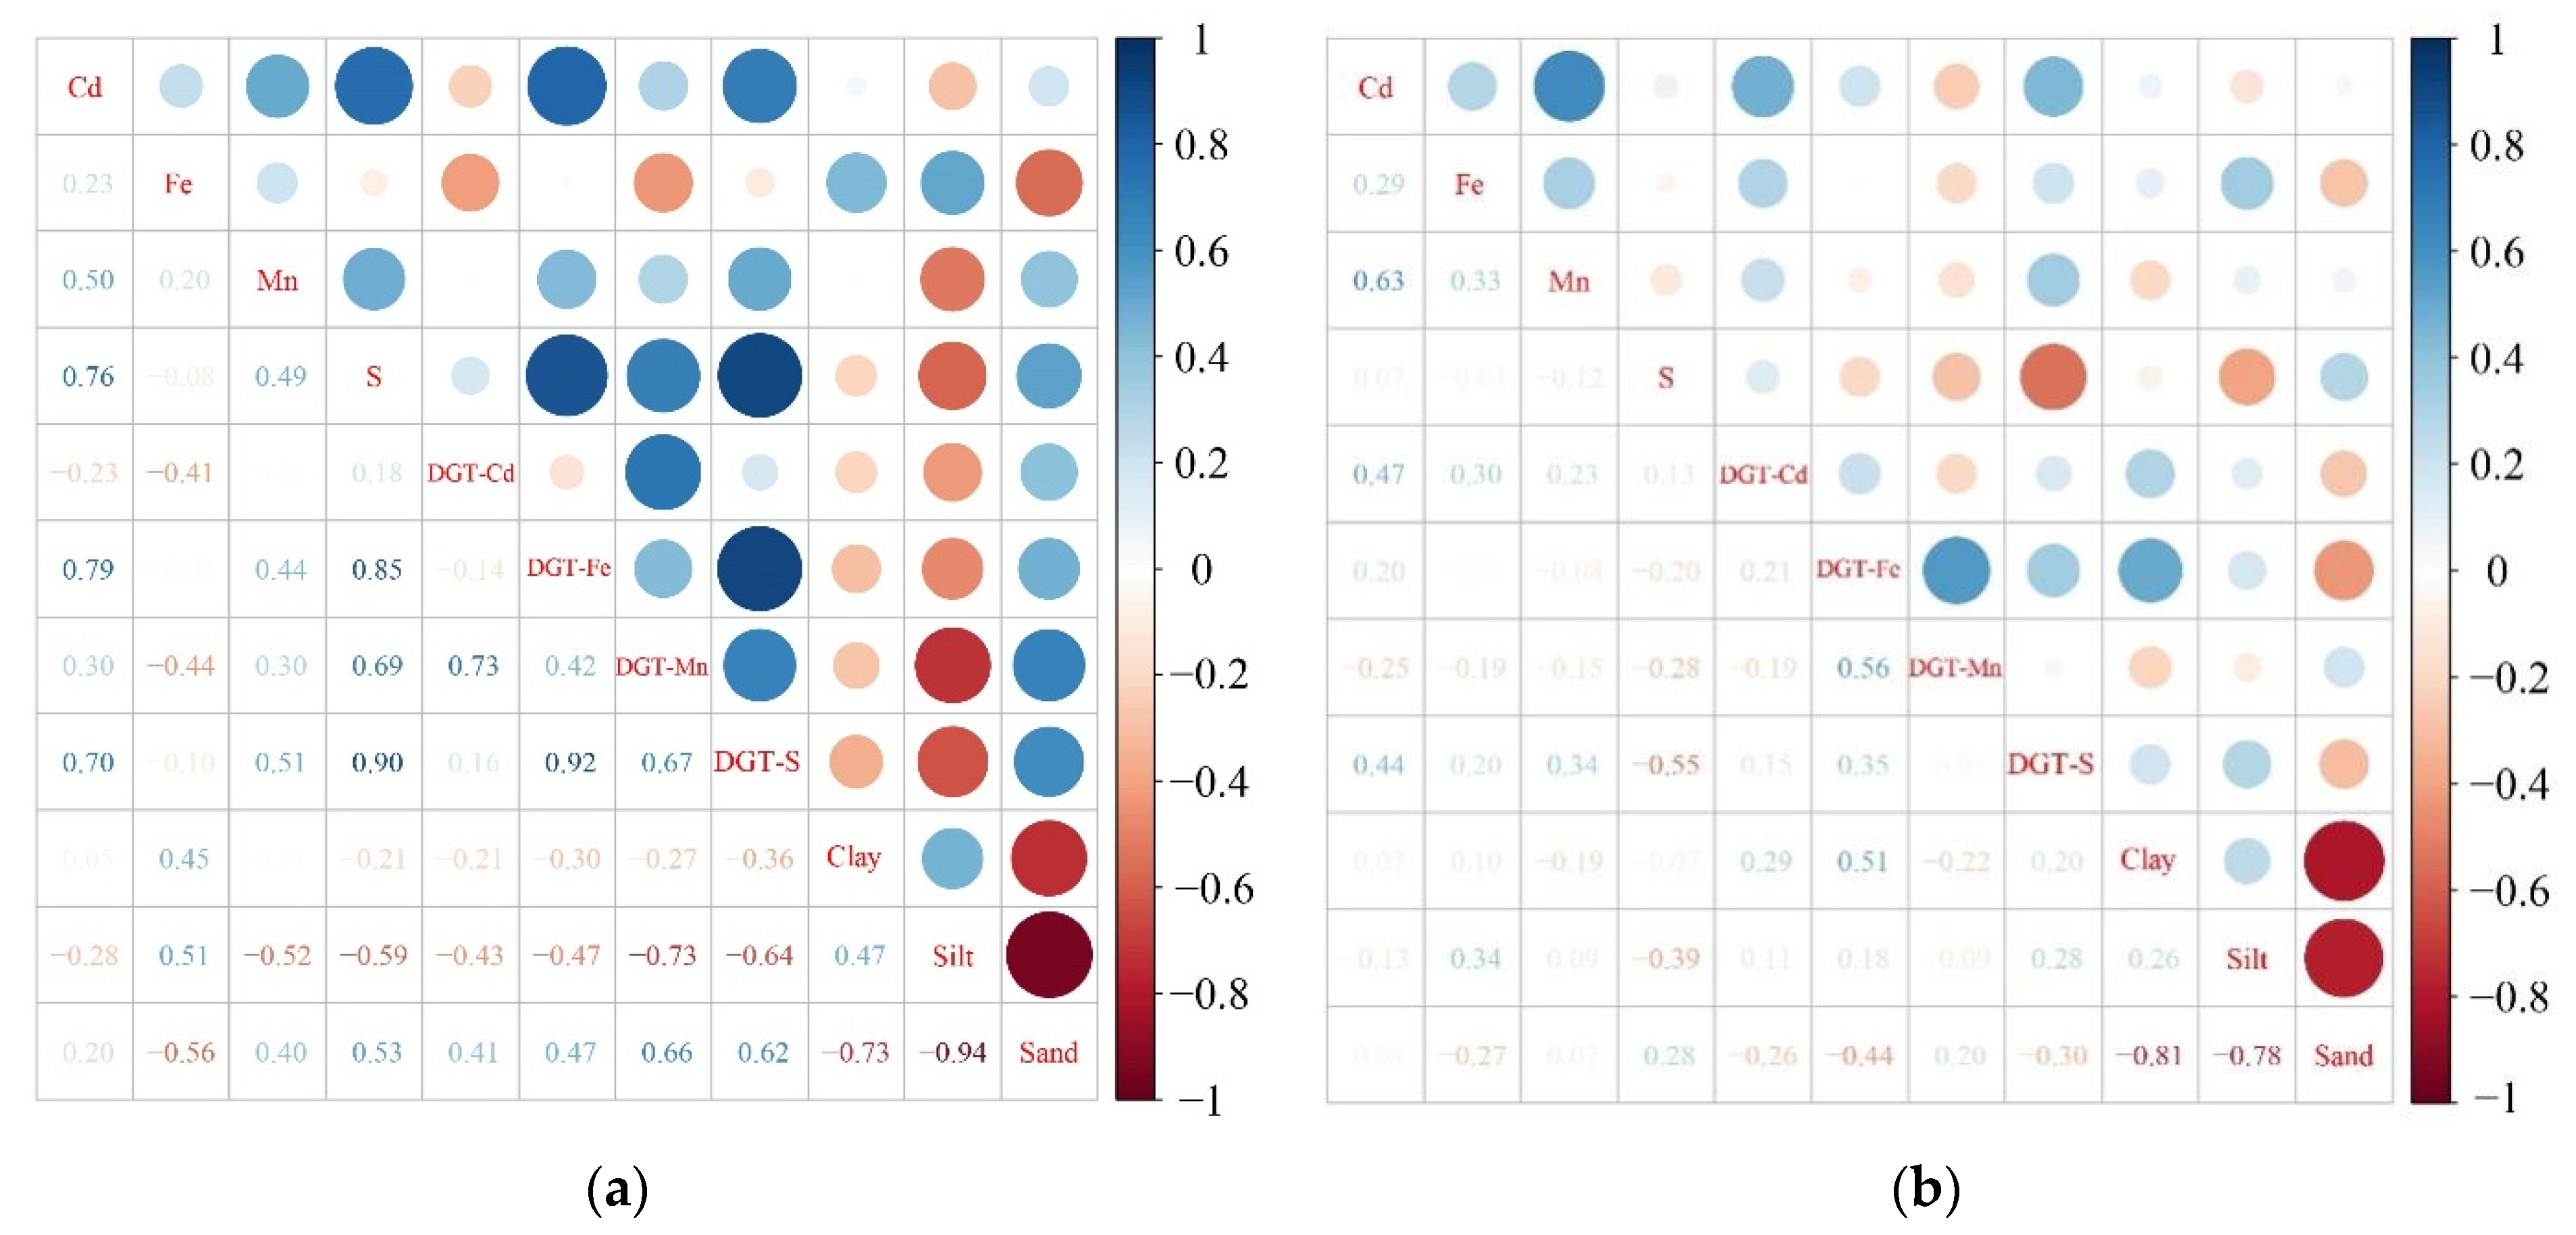
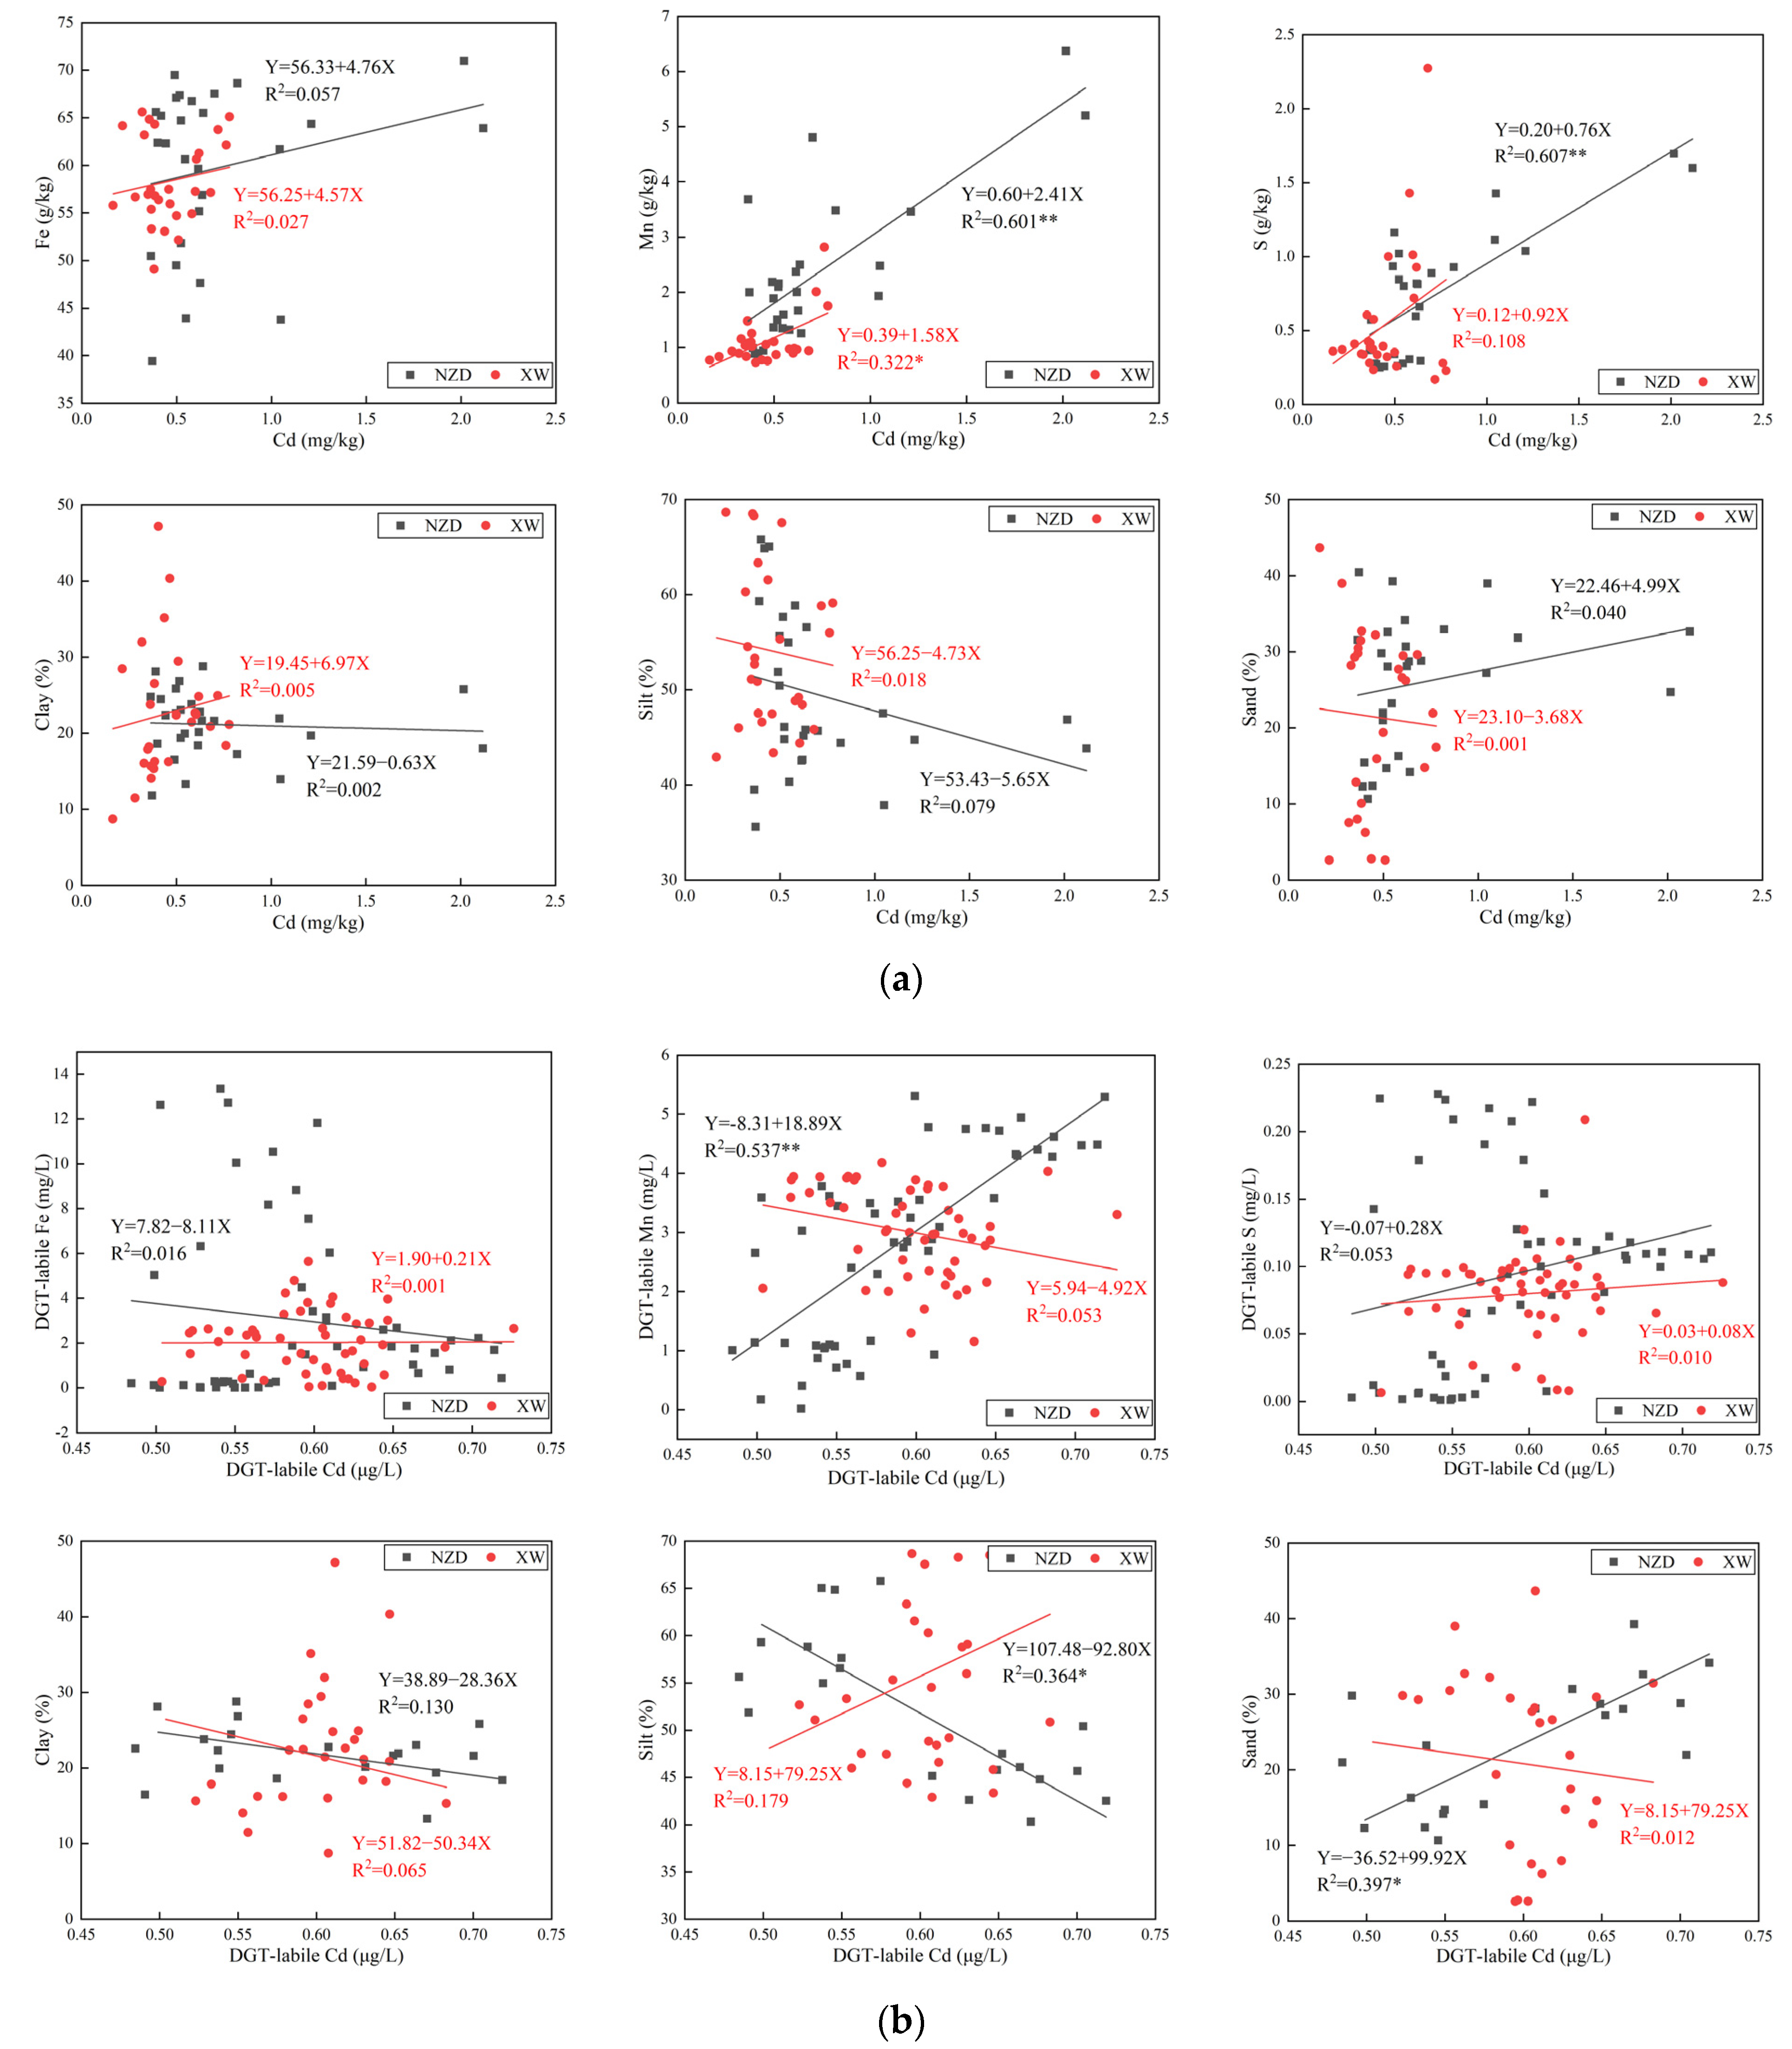
4.1. Main Mechanism Controlling Cd Migration and Deposition in Large Deep Reservoir Sediments

Previous studies found that the physicochemical properties of the overlying water affect the adsorption–desorption characteristics and redox conditions of surface sediments [13,37,44]. Moreover, the diagenesis of the bottom sediments affects the absorption and release of trace metals. The average pH and DO at point NZD-C in the overlying water is relatively high, as is the content of silt at this point. Previous studies have found that the higher the content of sediments in a reservoir, the smaller the particle size and the greater the adsorption capacity and adsorption rate of the sediments. The higher silt content at point NZD-C, which accounts for about 60% of the sediment particle size distribution, makes the sediment at point NZD-C more capable of adsorbing and carrying metals than points NZD-A and NZD-B, the metal ions Cd, Fe, Mn and S above the SWI at point NZD-C are more absorbed and stored by surface sediments. Metal ions in the surface sediments of NZD-A, NZD-B, XW-A and XW-B tend to be released likely because of the high temperature of the overlying water of the large deep reservoirs, which promotes the reduction and release of Fe, Mn and S in surface sediments. Overall, the flux of metal ions released from the surface sediments of the XW reservoir to the overlying water is greater than that of the NZD reservoir. This finding indicates that although the reduction release capacity of Fe, Mn and S in the surface sediments of NZD is greater than that of XW, the concentration of trace metals in the overlying water of the latter is greater than that of the former. The Cd concentrations at the bottom sediments of NZD and XW are higher than those at the top sediments, but diagenesis affects the release of labile Cd. The data from −2 cm to −10 cm below the sediment were selected for linear regression analysis, as shown in Figure 7, to eliminate the potential impacts of the physicochemical properties of the overlying water and diagenesis on Cd migration in the surface and bottom sediments, respectively. The correlations between Cd and Mn and S in the sediments of the NZD reservoir are significant (R2 = 0.601, R2 = 0.607, p < 0.01), which indicates that the deposition of Cd in the sediments is consistent with the deposition of Mn and S (Figure 7a). The correlations between DGT-labile Cd and DGT-labile Mn, silt and sand are also significant (R2 = 0.537, p < 0.01; R2 = 0.364, R2 = 0.397, p < 0.05). These results indicate that Mn in the sediments of NZD is the main element controlling Cd migration and that labile Cd in the pore water mainly originates from the release of silt and sand in the sediments. A significant correlation between Cd and S in NZD sediments may be observed. DGT-labile Cd is uncorrelated with DGT-labile S mainly because, compared with Fe and Mn, the presence of DGT-labile S in pore water can preferentially precipitate Cd to form CdS. Indeed, even if only a small amount of S(−II) exists in the water, Cd can be effectively precipitated [13,17]. The correlation between Cd and Mn in the sediments of the XW reservoir is not significant (R2 = 0.322, p < 0.05), which indicates weak consistency between the Cd and Mn processes in the sediment. DGT-labile Cd is not correlated with other factors, which indicates that the sediments of the XW reservoir are influenced by multiple factors weakly controlling Cd migration (Figure 7b). Assessing the main mechanism controlling Cd migration from the release trend and data is quite challenging mainly because the labile forms of Cd, Fe, Mn and S in the XW reservoir sediments are not the major metal forms and the presence of labile Cd in the pore water is not mainly due to the release of solid phases in these sediments.

4.2. Impact of Cascade Large Deep Reservoir Construction on Cd Deposition and Migration

Figure 8 presents an overall schematic diagram of Cd deposition/migration in the sediments of cascade large deep reservoirs. Earlier studies revealed that cascade hydropower development could disrupt the continuity of rivers; such development could cause upstream reservoirs to intercept a large quantity of sediments, increase the sedimentation rate of sediments in the overlying water of the reservoirs and reduce the source of sediments in downstream reservoirs [57,58]. The development of cascade hydropower could also change the scope of regional sedimentation and affect material circulation in the sediments of cascade reservoirs [6,59]. In the present study, as shown in Figure 7, the deposition processes of Cd, Mn and S in the sediments of the NZD reservoir show strong consistency, whereas the deposition processes of Cd and Mn in the XW reservoir sediments show weak consistency with the S deposition process. These findings indicate that the construction of cascade large deep reservoirs divides the influx of regional sediments into two parts. Part of the sediment in the upstream area flows into the XW reservoir and is eventually intercepted by the XW dam; another part of the downstream area flows into the NZD reservoir and is eventually intercepted by the NZD dam to the front of the dam. This division highlights the importance of sediments in the downstream area for the co-deposition of Cd, Mn and S in the sediments of the NZD reservoir. The strong consistency of DGT-labile Cd and Mn in the pore water of the NZD reservoir, the weak consistency of silt and sand and the irrelevance of DGT-labile Cd in the pore water of the XW reservoir to other factors indicate that the influx of sediments with higher contents of silt and sand in the downstream area renders DGT-labile Mn the main mechanism controlling the release of Cd in the pore water of the NZD reservoir. NZD shows similar vertical fluctuations (Figure 3a), and a significant correlation between DGT-labile Cd and Mn may be observed (Figure 7). Under the measurement principle of DGT, similarities in fluctuations reflect the reductive dissolution of Mn oxides in the sediments, resulting in the simultaneous release of Cd and Mn; this mechanism verifies that the mobility of Cd is controlled by the Mn redox cycle [22]. Previous studies pointed out that Cd can be adsorbed by Fe and Mn oxides and then released during the reduction and dissolution of these oxides; however, determining whether a single or multiple oxides absorb or release Cd is difficult [16,60,61]. Previous research revealed that, compared with Fe oxides, Mn oxides have a larger specific surface area and higher Cd affinity; such properties promote the formation of strong surface complexes between Cd and Mn oxides and the enrichment of Cd in these oxides [62]. Compared with other metal phases, CdS has lower solubility and can preferentially precipitate Cd [17]. The results further show that fluctuations in DGT-labile Cd concentration in the sediments of cascade large deep reservoirs first increase and then decrease likely because of the reduction and dissolution of Mn oxides, the preferential precipitation of CdS and the precipitation of CdS formed by S(−II) and Cd. The concentration of DGT-labile Cd in the surface sediments of NZD-A and NZD-C from −1 cm to −3 cm shows an upward trend (Figure 3). The overlying water at upstream and downstream locations of the NZD reservoir has higher DO, conductivity and temperature (Figure 2). Under these conditions, the oxidation of S in the surface deposits could cause the precipitation of CdS and the release of Cd [63]. The concentration of DGT-labile S in sediments of the NZD reservoir was higher than in those of the XW reservoir (Figure 5). According to previous studies, a high concentration of S in sediments can result in the precipitation of Cd as CdS [64]. The present study found that the redox dissolution of Mn and the preferential precipitation of CdS in the sediments of the NZD reservoir control Cd migration and deposition. The content of Mn in the sediments of the XW reservoir is low, although the redox dissolution of Mn affects the migration process of Cd, but the interference of other factors also has a great influence on the migration process of Cd. Meanwhile, the migration of Cd in the NZD reservoir did not reach the potential maximum capacity due to the limitation of environmental factors, which made no significant difference between the labile Cd in upstream and downstream reservoirs. The above findings demonstrate that the construction of cascade large deep reservoirs could change the scope of the influx of regional sediments. Because regional sediments are an important factor influencing the migration and deposition of Cd in reservoir sediments, cascade large deep reservoirs indirectly affect the migration mechanism of Cd in the sediments of upstream and downstream reservoirs.

5. Conclusions

Overall, the surface sediments of the XW reservoir are affected by the physicochemical properties of the overlying water, and the flux of metal ions released into the overlying water in this reservoir is greater than that of the NZD reservoir. The deposition processes of Cd, Mn and S in the sediments of the NZD reservoir are consistent. Mn in the sediments is the main mechanism controlling Cd migration. The labile Cd in pore water mainly originates from the release of silt and sand in the sediments. The consistency of the deposition processes of Cd and Mn in XW reservoir sediments is weak, and several factors weakly influence the migration of Cd in these sediments. Identifying the main mechanism controlling Cd migration from the release trend and data is quite challenging. Weak consistency between the deposition processes of Cd and Mn is found in the sediments, and no significant correlation between DGT-labile Cd and Fe, Mn, S and particle size is noted, thereby indicating that the contents of Cd and Mn in the input sediments in the upstream area are low, that the DGT-labile Cd absorbed by DGT mainly originates from the inherently labile Cd in the pore water and that the sediments add small amounts of labile Cd to the pore water. These findings indicate that the contents of Cd, Mn and S in the sediment inputs in the downstream area are high, that part of the DGT-labile Cd absorbed by DGT originates from the inherently labile Cd in the pore water and that another part originates from the labile Cd released by the reduction and dissolution of Mn oxides in silt and sand.

Author Contributions

Y.C.: Writing—Original Draft, Conceptualization. C.C.: Writing—Original Draft, Formal Analysis. Y.W.: Conceptualization, Methodology. M.H.: Investigation and Formal Analysis. All authors have read and agreed to the published version of the manuscript.

Funding

This research was financially supported by the National Natural Science Foundation of China (U1802241, U204021 and 92047204), Innovative Research Group of Hebei Natural Science Foundation (E2020402074), University Science and Technology Research Project of Hebei, China (ZD2019005), Science and Technology Program of China Huaneng Group (No. HNKJ18-H23) and Graduate Innovation Foundation of Hebei Province (CXZZBS2020152 and CXZZSS2021090).

Institutional Review Board Statement

Not applicable.

Informed Consent Statement

Informed consent was obtained from all subjects involved in the study.

Data Availability Statement

Not applicable.

Conflicts of Interest

The authors declare that they have no known competing financial interests or personal relationships that could have appeared to influence the work reported in this paper.

References

  1. Guan, D.-X.; Williams, P.N.; Xu, H.-C.; Li, G.; Luo, J.; Ma, L.Q. High-resolution measurement and mapping of tungstate in waters, soils and sediments using the low-disturbance DGT sampling technique. J. Hazard. Mater. 2016, 316, 69–76. [Google Scholar] [CrossRef] [Green Version]
  2. Zhao, D.; Juhasz, A.L.; Luo, J.; Huang, L.; Luo, X.-S.; Li, H.-B.; Ma, L.Q. Mineral Dietary Supplement to Decrease Cadmium Relative Bioavailability in Rice Based on a Mouse Bioassay. Environ. Sci. Technol. 2017, 51, 12123–12130. [Google Scholar] [CrossRef]
  3. Xu, D.; Gao, B.; Peng, W.; Liu, L.; Wu, W.; Liu, X. Boron toxicity coefficient calculation and application for ecological risk assessment in reservoir sediments. Sci. Total Environ. 2020, 739, 139703. [Google Scholar] [CrossRef] [PubMed]
  4. Li, Y.; Gao, B.; Xu, D.; Peng, W.; Liu, X.; Qu, X.; Zhang, M. Hydrodynamic impact on trace metals in sediments in the cascade reservoirs, North China. Sci. Total Environ. 2020, 716, 136914. [Google Scholar] [CrossRef] [PubMed]
  5. Guo, X.; Zhu, X.; Yang, Z.; Ma, J.; Xiao, S.; Daobin, J.; Defu, L. Impacts of cascade reservoirs on the longitudinal variability of fine sediment characteristics: A case study of the Lancang and Nu Rivers. J. Hydrol. 2020, 581, 124343. [Google Scholar] [CrossRef]
  6. Mu, Z.; Wang, Y.; Wu, J.; Cheng, Y.; Lu, J.; Chen, C.; Zhao, F.; Li, Y.; Hu, M.; Bao, Y. The influence of cascade reservoir construction on sediment biogenic substance cycle in Lancang River from the perspective of phosphorus fractions. Ecol. Eng. 2020, 158, 106051. [Google Scholar] [CrossRef]
  7. Silva, M.A.L.; Rezende, C.E. Behavior of selected micro and trace elements and organic matter in sediments of a freshwater system in south-east Brazil. Sci. Total Environ. 2002, 292, 121–128. [Google Scholar] [CrossRef]
  8. Duan, L.; Song, J.; Xu, Y.; Li, X.; Zhang, Y. The distribution, enrichment and source of potential harmful elements in surface sediments of Bohai Bay, North China. J. Hazard. Mater. 2010, 183, 155–164. [Google Scholar] [CrossRef]
  9. Emenike, P.C.; Neris, J.B.; Tenebe, I.T.; Nnaji, C.C.; Jarvis, P. Estimation of some trace metal pollutants in River Atuwara southwestern Nigeria and spatio-temporal human health risks assessment. Chemosphere 2020, 239, 124770. [Google Scholar] [CrossRef]
  10. Atkinson, C.; Jolley, D.; Simpson, S. Effect of overlying water pH, dissolved oxygen, salinity and sediment disturbances on metal release and sequestration from metal contaminated marine sediments. Chemosphere 2007, 69, 1428–1437. [Google Scholar] [CrossRef] [Green Version]
  11. Mao, L.; Liu, L.; Yan, N.; Li, F.; Wen, H. Factors controlling the accumulation and ecological risk of trace metal(loid)s in river sediments in agricultural field. Chemosphere 2019, 243, 125359. [Google Scholar] [CrossRef] [PubMed]
  12. Xie, M.; Jarrett, B.A.; Da Silva-Cadoux, C.; Fetters, K.J.; Burton, G.A., Jr.; Gaillard, J.F.; Packman, A.I. Coupled effects of hydrodynamics and biogeochemistry on Zn mobility and speciation in highly contaminated sediments. Environ. Sci. Technol. 2015, 49, 5346–5353. [Google Scholar] [CrossRef] [PubMed]
  13. Wang, W.; Wang, W.-X. Trace metal behavior in sediments of Jiulong River Estuary and implication for benthic exchange fluxes. Environ. Pollut. 2017, 225, 598–609. [Google Scholar] [CrossRef] [PubMed]
  14. Wang, W.; Wang, S.; Chen, J.; Jiang, X.; Zheng, B. Combined use of diffusive gradients in thin film, high-resolution dialysis technique and traditional methods to assess pollution and bioavailability of sediment metals of lake wetlands in Taihu Lake Basin. Sci. Total Environ. 2019, 671, 28–40. [Google Scholar] [CrossRef]
  15. Zhang, T.; Li, L.; Xu, F.; Chen, X.; Li, Y. Assessing the remobilization and fraction of cadmium and lead in sediment of the Jialing River by sequential extraction and diffusive gradients in films (DGT) technique. Chemosphere 2020, 257, 127181. [Google Scholar] [CrossRef]
  16. Xu, D.; Gao, B.; Gao, L.; Zhou, H.; Zhao, X.; Yin, S. Characteristics of cadmium remobilization in tributary sediments in Three Gorges Reservoir using chemical sequential extraction and DGT technology. Environ. Pollut. 2016, 218, 1094–1101. [Google Scholar] [CrossRef]
  17. Chen, M.; Ding, S.; Li, C.; Tang, Y.; Zhang, C. High cadmium pollution from sediments in a eutrophic lake caused by dissolved organic matter complexation and reduction of manganese oxide. Water Res. 2021, 190, 116711. [Google Scholar] [CrossRef] [PubMed]
  18. Wu, Z.; Wang, S. Release mechanism and kinetic exchange for phosphorus (P) in lake sediment characterized by diffusive gradients in thin films (DGT). J. Hazard. Mater. 2017, 331, 36–44. [Google Scholar] [CrossRef]
  19. Zhang, H.; Zhao, F.-J.; Sun, B.; Davison, W.; Mcgrath, S.P. A new method to measure effective soil solution concentration predicts copper availability to plants. Environ. Sci. Technol. 2001, 35, 2602–2607. [Google Scholar] [CrossRef]
  20. Chen, M.; Ding, S.; Gao, S.; Xu, S.; Yang, C.; Wu, Y.; Gong, M.; Wang, D.; Wang, Y. Long-term effects of sediment dredging on controlling cobalt, zinc, and nickel contamination determined by chemical fractionation and passive sampling. Chemosphere 2019, 220, 476–485. [Google Scholar] [CrossRef]
  21. Ding, S.; Han, C.; Wang, Y.; Yao, L.; Wang, Y.; Xu, D.; Sun, Q.; Williams, P.N.; Zhang, C. In situ, high-resolution imaging of labile phosphorus in sediments of a large eutrophic lake. Water Res. 2015, 74, 100–109. [Google Scholar] [CrossRef]
  22. Ding, S.; Wang, Y.; Wang, D.; Li, Y.Y.; Gong, M.; Zhang, C. In situ, high-resolution evidence for iron-coupled mobilization of phosphorus in sediments. Sci. Rep. 2016, 6, 24341. [Google Scholar] [CrossRef] [Green Version]
  23. Davison, W.; Zhang, H. Progress in understanding the use of diffusive gradients in thin films (DGT)—Back to basics. Environ. Chem. 2012, 9, 1–13. [Google Scholar] [CrossRef]
  24. Conesa, H.M.; Schulin, R.; Nowack, B. Suitability of using diffusive gradients in thin films (DGT) to study metal bioavailability in mine tailings: Possibilities and constraints. Environ. Sci. Pollut. Res. Int. 2010, 17, 657–664. [Google Scholar] [CrossRef]
  25. Agbenin, J.O.; Welp, G. Bioavailability of copper, cadmium, zinc, and lead in tropical savanna soils assessed by diffusive gradient in thin films (DGT) and ion exchange resin membranes. Environ. Monit. Assess. 2012, 184, 2275–2284. [Google Scholar] [CrossRef]
  26. Zhang, H.; Davison, W. Use of diffusive gradients in thin-films for studies of chemical speciation and bioavailability. Environ. Chem. 2015, 12, 85–101. [Google Scholar] [CrossRef]
  27. Yin, H.; Cai, Y.; Duan, H.; Gao, J.; Fan, C. Use of DGT and conventional methods to predict sediment metal bioavailability to a field inhabitant freshwater snail (Bellamya aeruginosa) from Chinese eutrophic lakes. J. Hazard. Mater. 2014, 264, 184–194. [Google Scholar] [CrossRef]
  28. Guan, D.; Williams, P.; Luo, J.; Zheng, J.; Xu, H.; Cai, C.; Ma, L. Novel precipitated zirconia-based DGT technique for high-resolution imaging of oxyanions in waters and sediments. Environ. Sci. Technol. 2015, 49, 3653–3661. [Google Scholar] [CrossRef]
  29. Xu, B.; Li, Y.; Han, F.; Zheng, Y.; Ding, W.; Zhang, C.; Wallington, K.; Zhang, Z. The transborder flux of phosphorus in the Lancang-Mekong River Basin: Magnitude, patterns and impacts from the cascade hydropower dams in China. J. Hydrol. 2020, 590, 125201. [Google Scholar] [CrossRef]
  30. Campbell, I.C. (Ed.) Chapter 1—Introduction. In The Mekong Biophysical Environment of an International River Basin; Academic Press: San Diego, CA, USA, 2009; pp. 1–11. [Google Scholar] [CrossRef]
  31. Kummu, M.; Varis, O. Sediment-related impacts due to upstream reservoir trapping, the Lower Mekong River. Geomorphology 2007, 85, 275–293. [Google Scholar] [CrossRef]
  32. He, D.; Wu, S.; Peng, H.; Yang, Z.; Ou, X.; Cui, B. A study of ecosystem changes in longitudinal range-gorge-region and transboundary eco-security in southwest China. Adv. Earth Sci. 2005, 20, 338–344. (In Chinese) [Google Scholar]
  33. Wang, D.; Gong, M.; Li, Y.; Xu, L.; Wang, Y.; Jing, R.; Ding, S.; Zhang, C.; Lin, Y.-P. In Situ, High-Resolution Profiles of Labile Metals in Sediments of Lake Taihu. Int. J. Environ. Res. Public Health 2016, 13, 884. [Google Scholar] [CrossRef] [Green Version]
  34. Ding, S.; Sun, Q.; Xu, D.; Jia, F.; He, X.; Zhang, C. High-resolution simultaneous measurements of dissolved reactive phosphorus and dissolved sulfide: The first observation of their simultaneous release in sediments. Environ. Sci. Technol. 2012, 46, 8297–8304. [Google Scholar] [CrossRef] [PubMed]
  35. Jansen, B.; Kotte, M.C.; Wijk, A.; Verstraten, J.M. Comparison of diffusive gradients in thin films and equilibrium dialysis for the determination of Al, Fe(III) and Zn complexed with dissolved organic matter. Sci. Total Environ. 2001, 277, 45–55. [Google Scholar] [CrossRef]
  36. Wang, Y.; Ding, S.; Gong, M.; Xu, S.; Xu, W.; Zhang, C. Diffusion characteristics of agarose hydrogel used in diffusive gradients in thin films for measurements of cations and anions. Anal. Chim. Acta 2016, 945, 47–56. [Google Scholar] [CrossRef] [PubMed]
  37. Gao, Y.; Lesven, L.; Gillan, D.; Sabbe, K.; Billon, G.; De Galan, S.; Elskens, M.; Baeyens, W.; Leermakers, M. Geochemical behavior of trace elements in sub-tidal marine sediments of the Belgian coast. Mar. Chem. 2009, 117, 88–96. [Google Scholar] [CrossRef]
  38. Ullman, W.J.; Aller, R.C. Diffusion Coefficients in Nearshore Marine Sediments. Limnol. Oceanogr. 1982, 27, 552–556. [Google Scholar] [CrossRef]
  39. Li, Y.H.; Gregory, S.; Li, Y.H.; Gregory, S. Diffusion of ions in sea-water and in deep-sea sediments. Geochim. Cosmochim. Acta 1974, 38, 703–714. [Google Scholar]
  40. Fang, T.; Lu, W.; Cui, K.; Li, J.; Yang, K.; Zhao, X.; Liang, Y.; Li, H. Distribution, bioaccumulation and trophic transfer of trace metals in the food web of Chaohu Lake, Anhui, China. Chemosphere 2019, 218, 1122–1130. [Google Scholar] [CrossRef]
  41. Chen, J. Principles of River Water Quality and River Water Quality in China; Science Press Department: Beijing, China, 2006. [Google Scholar]
  42. Lin, Q.; Liu, E.; Zhang, E.; Li, K.; Shen, J. Spatial distribution, contamination and ecological risk assessment of heavy metals in surface sediments of Erhai Lake, a large eutrophic plateau lake in southwest China. CATENA 2016, 145, 193–203. [Google Scholar] [CrossRef]
  43. Qian, Y.; Cheng, C.; Feng, H.; Hong, Z.; Zhu, Q.; Kolenčík, M.; Chang, X. Assessment of metal mobility in sediment, commercial fish accumulation and impact on human health risk in a large shallow plateau lake in southwest of China. Ecotoxicol. Environ. Saf. 2020, 194, 110346. [Google Scholar] [CrossRef] [PubMed]
  44. Zhuang, W.; Ying, S.C.; Frie, A.L.; Wang, Q.; Song, J.; Liu, Y.; Chen, Q.; Lai, X. Distribution, pollution status, and source apportionment of trace metals in lake sediments under the influence of the South-to-North Water Transfer Project, China. Sci. Total Environ. 2019, 671, 108–118. [Google Scholar] [CrossRef] [PubMed]
  45. Wang, L.; Dai, L.; Li, L.; Liang, T. Multivariable cokriging prediction and source analysis of potentially toxic elements (Cr, Cu, Cd, Pb, and Zn) in surface sediments from Dongting Lake, China. Ecol. Indic. 2018, 94 Pt 1, 312–319. [Google Scholar] [CrossRef]
  46. Dai, L.; Wang, L.; Li, L.; Liang, T.; Zhang, Y.; Ma, C.; Xing, B. Multivariate geostatistical analysis and source identification of heavy metals in the sediment of Poyang Lake in China. Sci. Total Environ. 2018, 621, 1433–1444. [Google Scholar] [CrossRef]
  47. Wang, Y.; Yang, L.; Kong, L.; Liu, E.; Wang, L.; Zhu, J. Spatial distribution, ecological risk assessment and source identification for heavy metals in surface sediments from Dongping Lake, Shandong, East China. CATENA 2015, 125, 200–205. [Google Scholar] [CrossRef]
  48. Lin, L.; Li, C.; Yang, W.; Zhao, L.; Liu, M.; Li, Q.; Crittenden, J.C. Spatial variations and periodic changes in heavy metals in surface water and sediments of the Three Gorges Reservoir, China. Chemosphere 2020, 240, 124837. [Google Scholar] [CrossRef] [PubMed]
  49. Aung, P.P.; Mao, Y.; Hu, T.; Qi, S.; Tian, Q.; Chen, Z.; Xing, X. Metal concentrations and pollution assessment in bottom sediments from Inle Lake, Myanmar. J. Geochem. Explor. 2019, 207, 106357. [Google Scholar] [CrossRef]
  50. Yuan, F.; Chaffin, J.D.; Xue, B.; Wattrus, N.; Zhu, Y.; Sun, Y. Contrasting sources and mobility of trace metals in recent sediments of western Lake Erie. J. Great Lakes Res. 2018, 44, 1026–1034. [Google Scholar] [CrossRef]
  51. El-Amier, Y.A.; Elnaggar, A.A.; El-Alfy, M.A. Evaluation and mapping spatial distribution of bottom sediment heavy metal contamination in Burullus Lake, Egypt. Egypt. J. Basic Appl. Sci. 2019, 4, 55–66. [Google Scholar] [CrossRef] [Green Version]
  52. Franck, F.; Brice, M.; Alexandra, C.-N.; Jean-François, L.; Amal, A.; Patrice, F.; Thierry, H.; François, B. Key parameters influencing metallic element mobility associated with sediments in a daily-managed reservoir. Sci. Total Environ. 2017, 605–606, 666–676. [Google Scholar] [CrossRef]
  53. Fural, Ş.; Kükrer, S.; Cürebal, İ. Geographical information systems based ecological risk analysis of metal accumulation in sediments of İkizcetepeler Dam Lake (Turkey). Ecol. Indic. 2020, 119, 106784. [Google Scholar] [CrossRef]
  54. Baran, A.; Tarnawski, M.; Koniarz, T. Spatial distribution of trace elements and ecotoxicity of bottom sediments in Rybnik reservoir, Silesian-Poland. Environ. Sci. Pollut. Res. 2016, 23, 17255–17268. [Google Scholar] [CrossRef] [Green Version]
  55. Lourino-Cabana, B.; Billon, G.; Lesven, L.; Sabbe, K.; Gillan, D.C.; Gao, Y.; Leermakers, M.; Baeyens, W. Monthly variation of trace metals in North Sea sediments. From experimental data to modeling calculations. Mar. Pollut. Bull. 2014, 87, 237–246. [Google Scholar] [CrossRef]
  56. Naylor, C.; Davison, W.; Motelica-Heino, M.; Van Den Berg, G.A.; Van Der Heijdt, L.M. Simultaneous release of sulfide with Fe, Mn, Ni and Zn in marine harbour sediment measured using a combined metal/sulfide DGT probe. Sci. Total Environ. 2004, 328, 275–286. [Google Scholar] [CrossRef]
  57. Fang, Y.; Deng, W. The critical scale and section management of cascade hydropower exploitation in Southwestern China. Energy 2011, 36, 5944–5953. [Google Scholar] [CrossRef]
  58. Smith, W.S.; Espíndola, E.L.G.; Rocha, O. Environmental gradient in reservoirs of the medium and low Tietê River: Limnological differences through the habitat sequence. Acta Limnol. Bras. 2014, 26, 73–88. [Google Scholar] [CrossRef] [Green Version]
  59. Cardoso-Silva, S.; Meirelles, S.T.; Frascareli, D.; López-Doval, J.C.; Rosa, A.H.; Moschini-Carlos, V.; Pompêo, M. Metals in superficial sediments of a cascade multisystem reservoir: Contamination and potential ecological risk. Environ. Earth Sci. 2017, 76, 756. [Google Scholar] [CrossRef] [Green Version]
  60. Ba Nks, J.; Ross, D.J.; Keough, M.J. Short-term (24 h) effects of mild and severe hypoxia (20% and 5% dissolved oxygen) on metal partitioning in highly contaminated estuarine sediments. Estuar. Coast. Shelf Sci. 2012, 99, 121–131. [Google Scholar] [CrossRef]
  61. He, Y.; Men, B.; Yang, X.; Li, Y.; Xu, H.; Wang, D. Investigation of heavy metals release from sediment with bioturbation/bioirrigation. Chemosphere 2017, 184, 235–243. [Google Scholar] [CrossRef] [PubMed]
  62. Müller, B.; Granina, L.; Schaller, T.; Ulrich, A.; Wehrli, B. P, As, Sb, Mo, and other elements in sedimentary Fe/Mn layers of Lake Baikal. Environ. Sci. Technol. 2002, 36, 411–420. [Google Scholar] [CrossRef]
  63. Kelderman, P.; Osman, A.A. Effect of redox potential on heavy metal binding forms in polluted canal sediments in Delft (The Netherlands). Water Res. 2007, 41, 4251–4261. [Google Scholar] [CrossRef] [PubMed]
  64. Frohne, T.; Rinklebe, J.; Diaz-Bone, R.A.; Du Laing, G. Controlled variation of redox conditions in a floodplain soil: Impact on metal mobilization and biomethylation of arsenic and antimony. Geoderma 2011, 160, 414–424. [Google Scholar] [CrossRef]
Figure 1. Research area and sampling sites.
Sustainability 13 11137 g001
Figure 2. Distribution characteristics of physicochemical properties in large deep reservoirs; (a) overlying water; (b) sediment.
Sustainability 13 11137 g002
Figure 3. The vertical variation of Cd and other elements in sediment–water profiles from six sampling sites; (a) distribution characteristics of Cd and other elements in sediment; (b) distribution characteristics of labile Cd and other elements in water.
Sustainability 13 11137 g003
Figure 4. The correlation mixing matrix between Cd and other factors of large deep reservoirs; (a) NZD reservoir; (b) XW reservoir.
Sustainability 13 11137 g004
Figure 5. The vertical changes in DGT-labile S of large deep reservoirs; (a) NZD reservoir; (b) XW reservoir.
Sustainability 13 11137 g005
Figure 6. The diffusive fluxes of Cd and other elements of the NZD and XW reservoirs; (a) Cd; (b) Fe, Mn and S.
Sustainability 13 11137 g006
Figure 7. The linear regression analysis between Cd and other elements of in the two large deep reservoirs; (a) Cd and other elements in sediment; (b) labile Cd and other elements in water; * Significant correlation at the 5% level; ** Significant correlation at the 1% level.
Sustainability 13 11137 g007
Figure 8. Schematic interpretation of the mechanism of Cd deposition/migration from sediments in NZD and XW reservoirs (Figure 8 is redrawn on the basis of reference [17]).
Sustainability 13 11137 g008
Table 1. Sampling site description of latitude, longitude, sampling depth, construction time and storage capacity in NZD and XW reservoirs.
Sampling SitesLatitude (N)Longitude (E)Depth (m)ConstructionStorage Capacity
NZD-A22°40′05″100°24′17″162.4
NZD-B23°13′04″100°02′33″112.41
NZD-C24°25′10″100°20′20″45.31
XW-A24°41′25″100°05′49″161.03
XW-B24°51′37″99°48′34″160.87
XW-C24°58′08″100°12′38″75.91
NZD 2005–2017 (Year)23.70 (billion m3)
XW 2000–2012 (Year)15.13 (billion m3)
Table 2. The average values of physicochemical characteristics in NZD and XW reservoirs.
NZD-ANZD-BNZD-CXW-AXW-BXW-CNZDXW
Overlying waterpH7.71
±0.31
7.99
±0.24
8.31
±0.04
8.05
±0.11
8.15
±0.15
7.83
±0.09
8.26
±0.52
8.01
±0.12
DO (mg/L)3.68
±2.31
4.89
±1.62
8.07
±0.16
5.88
±0.75
6.34
±0.75
3.77
±0.63
5.55
±1.37
5.33
±0.71
Cond (μS/cm)387.59
±13.79
389.08
±19.72
408.16
±0.22
421.52
±22.15
430.20
±17.07
378.45
±37.36
394.94
±11.23
410.05
±25.53
Temp (°C)18.95
±1.38
19.46
±1.28
18.14
±0.01
16.19
±2.20
16.53
±2.12
18.18
±0.82
18.85
±0.89
16.97
±1.71
SedimentClay (%)19.95
±3.65
19.53
±4.28
23.14
±3.43
14.71
±3.51
28.77
±8.90
23.33
±4.24
20.88
±3.78
22.27
±5.55
Silt (%)44.28
±3.06
43.23
±4.34
59.84
±4.12
49.95
±3.94
50.91
±7.59
59.97
±7.03
49.12
±3.84
53.61
±6.19
Sand (%)35.77
±6.58
37.24
±7.00
17.02
±4.69
35.35
±7.00
20.32
±12.66
16.69
±9.54
30.01
±6.09
24.12
±9.73
Cd (mg/kg)0.62
±0.15
1.15
±0.77
0.46
±0.14
0.36
±0.09
0.54
±0.08
0.60
±0.30
0.74
±0.35
0.50
±0.15
Fe (g/kg)54.08
±5.96
61.40
±10.76
64.98
±2.40
55.8
±3.38
56.90
±2.85
62.67
±4.10
60.15
±6.37
58.49
±3.44
Mn (g/kg)2.17
±0.41
4.33
±2.20
1.04
±0.39
0.92
±0.15
1.49
±0.61
0.02
±0.01
2.51
±1.00
0.81
±0.25
S (g/kg)0.85
±0.17
1.05
±0.43
0.29
±0.04
0.43
±0.09
1.13
±1.01
0.29
±0.07
0.73
±0.32
0.62
±0.37
Pore waterCd (μg/L)0.65
±0.03
0.56
±0.03
0.54
±0.03
0.57
±0.04
0.60
±0.03
0.62
±0.04
0.59
±0.03
0.60
±0.04
Fe (mg/L)1.87
±1.48
7.12
±5.11
0.14
±0.13
1.68
±0.94
2.78
±1.97
1.66
±1.60
3.04
±2.24
2.04
±1.50
Mn (mg/L)4.15
±0.98
2.99
±0.71
0.74
±0.43
3.45
±0.83
2.72
±0.65
2.36
±0.93
2.63
±0.71
2.84
±0.81
S (mg/L)0.09
±0.03
0.16
±0.07
0.01
±0.01
0.08
±0.04
0.06
±0.04
0.10
±0.04
0.09
±0.04
0.08
±0.04
Table 3. The Cd contents in lake and reservoir sediments.
LocationContent (mg/kg)References
NZD and XW reservoirs, Lancang River, China0.19–1.29This study
Erhai Lake, Yunnan, China0.10–2.00[42]
Dianchi Lake, Yunnan, China1.24–36.05[43]
Chaohu Lake, Anhui, China0.25–0.77[44]
Dongting Lake, Hunan, China0.40–4.00[45]
Poyang Lake, Jiangxi, China0.20–2.30[46]
Dongping Lake, Hubei, China0.22–0.35[47]
Three Gorges Reservoir, Yangtze River, China0.26–2.13[48]
Inle Lake, Taunggyi, Myanmar0.01–0.2[49]
Western Lake Erie, North America0.60–1.60[50]
Burullus Lake, Kafr El-Sheikh Governorate0.58–0.80[51]
Vaussaire reservoir, Cantal, France0.20–0.43[52]
Keban Reservoir, Euphrates River, Turkey0.05–0.38[53]
Rybnik reservoir, Ruda river, Silesian Poland0.10–15.67[54]
Publisher’s Note: MDPI stays neutral with regard to jurisdictional claims in published maps and institutional affiliations.

