Modeling Two-Person Segmentation and Locomotion for Stereoscopic Action Identification: A Sustainable Video Surveillance System


Abstract
1. Introduction
- Segmentation of both RGB and depth silhouettes is achieved via background subtraction and a series of morphological operations.
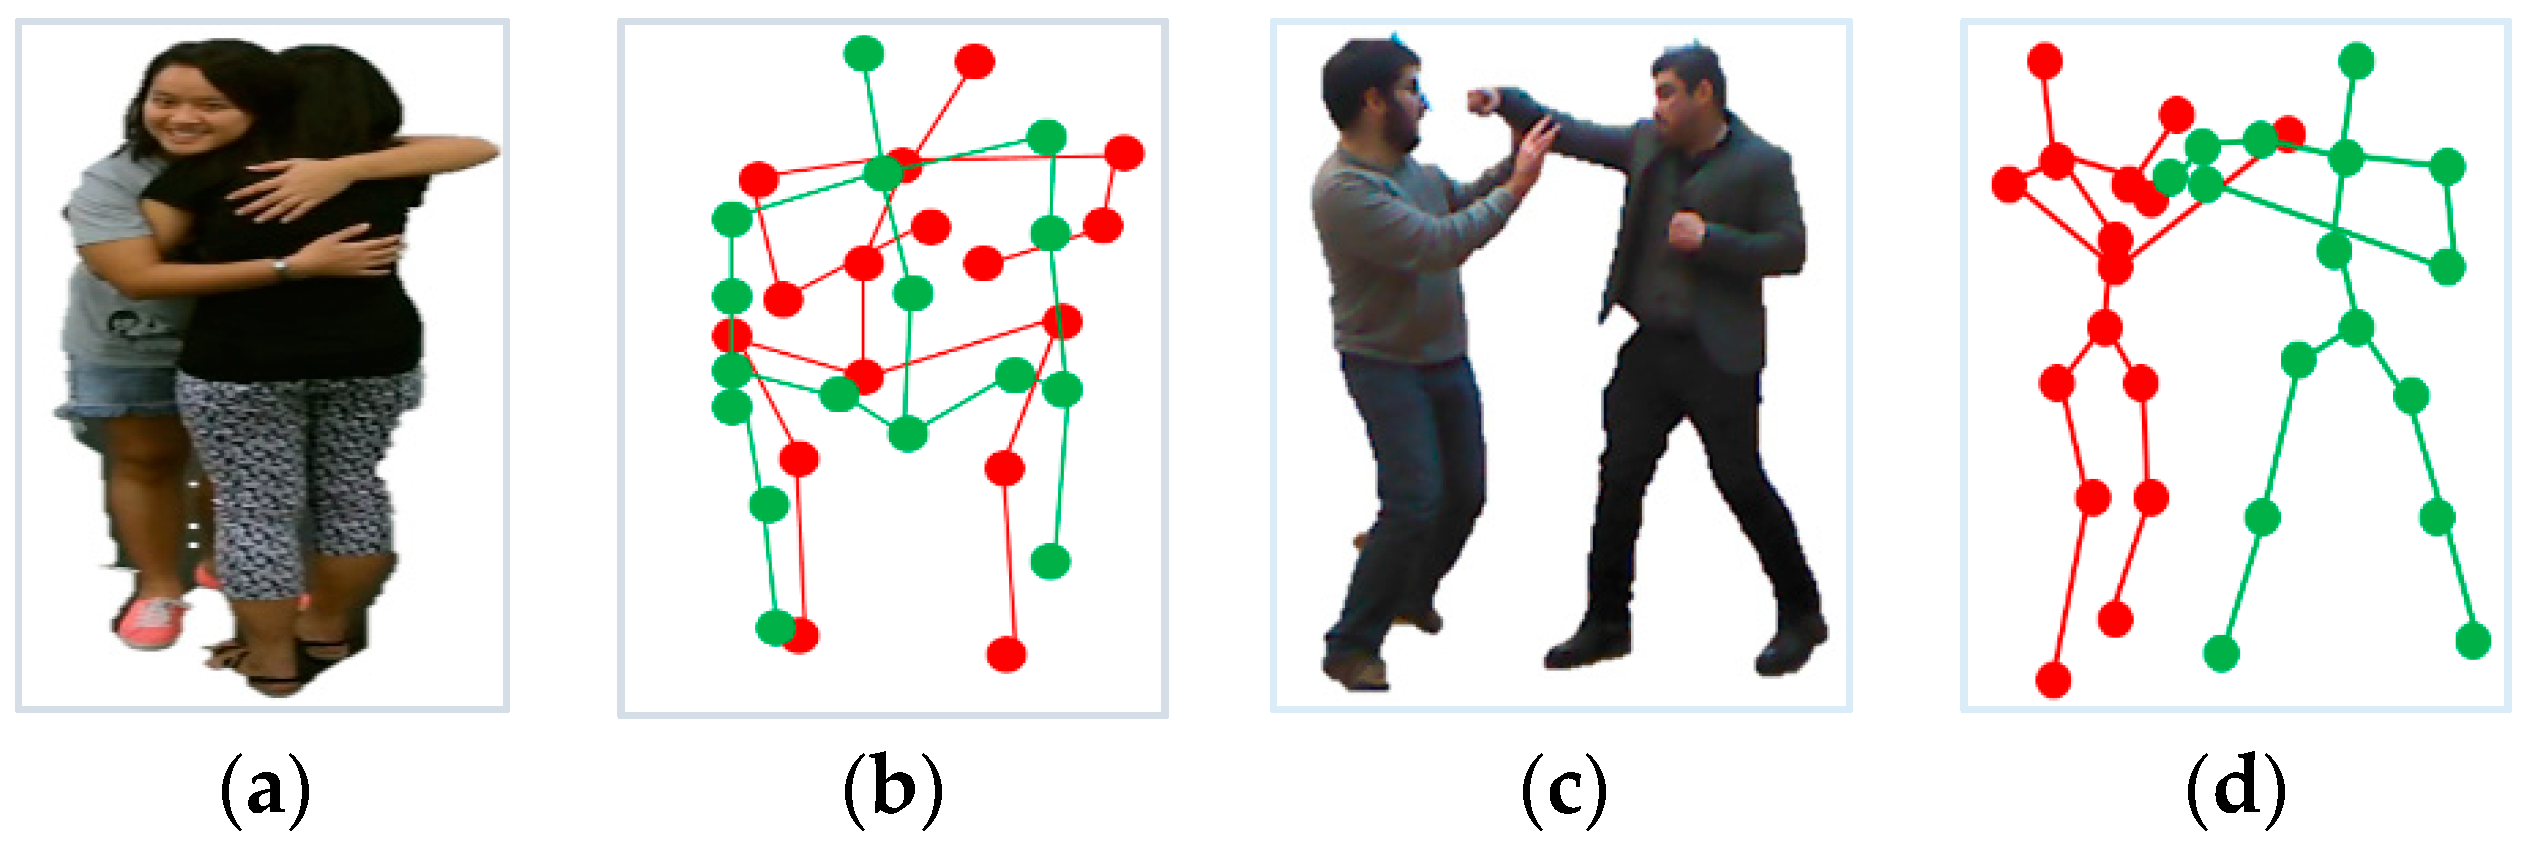
- Feature extraction from full human silhouettes is performed via geodesic maps and 3D Cartesian planes. Whereas, feature extraction from skeletal joints is performed via way-points trajectories and orientation angles. These features record each movement performed by two interacting human silhouettes.
- Feature selection is performed on the combined feature descriptors of four proposed features via PSO.
- Extensive experimentation is performed to prove systems’ validity via classification with a neuro-fuzzy inference system, effects of different numbers of membership functions, sensitivity specificity and error measures.
2. Literature Review
2.1. Devices for HAR Data Acquision
2.1.1. RGB-Based HAR Systems
2.1.2. RGB-D-Based HAR Systems
2.2. Division on the Basis of Feature Extraction and Recogition
2.2.1. Machine Learning-Based HAR Systems
2.2.2. Deep Learning-Based HAR Systems
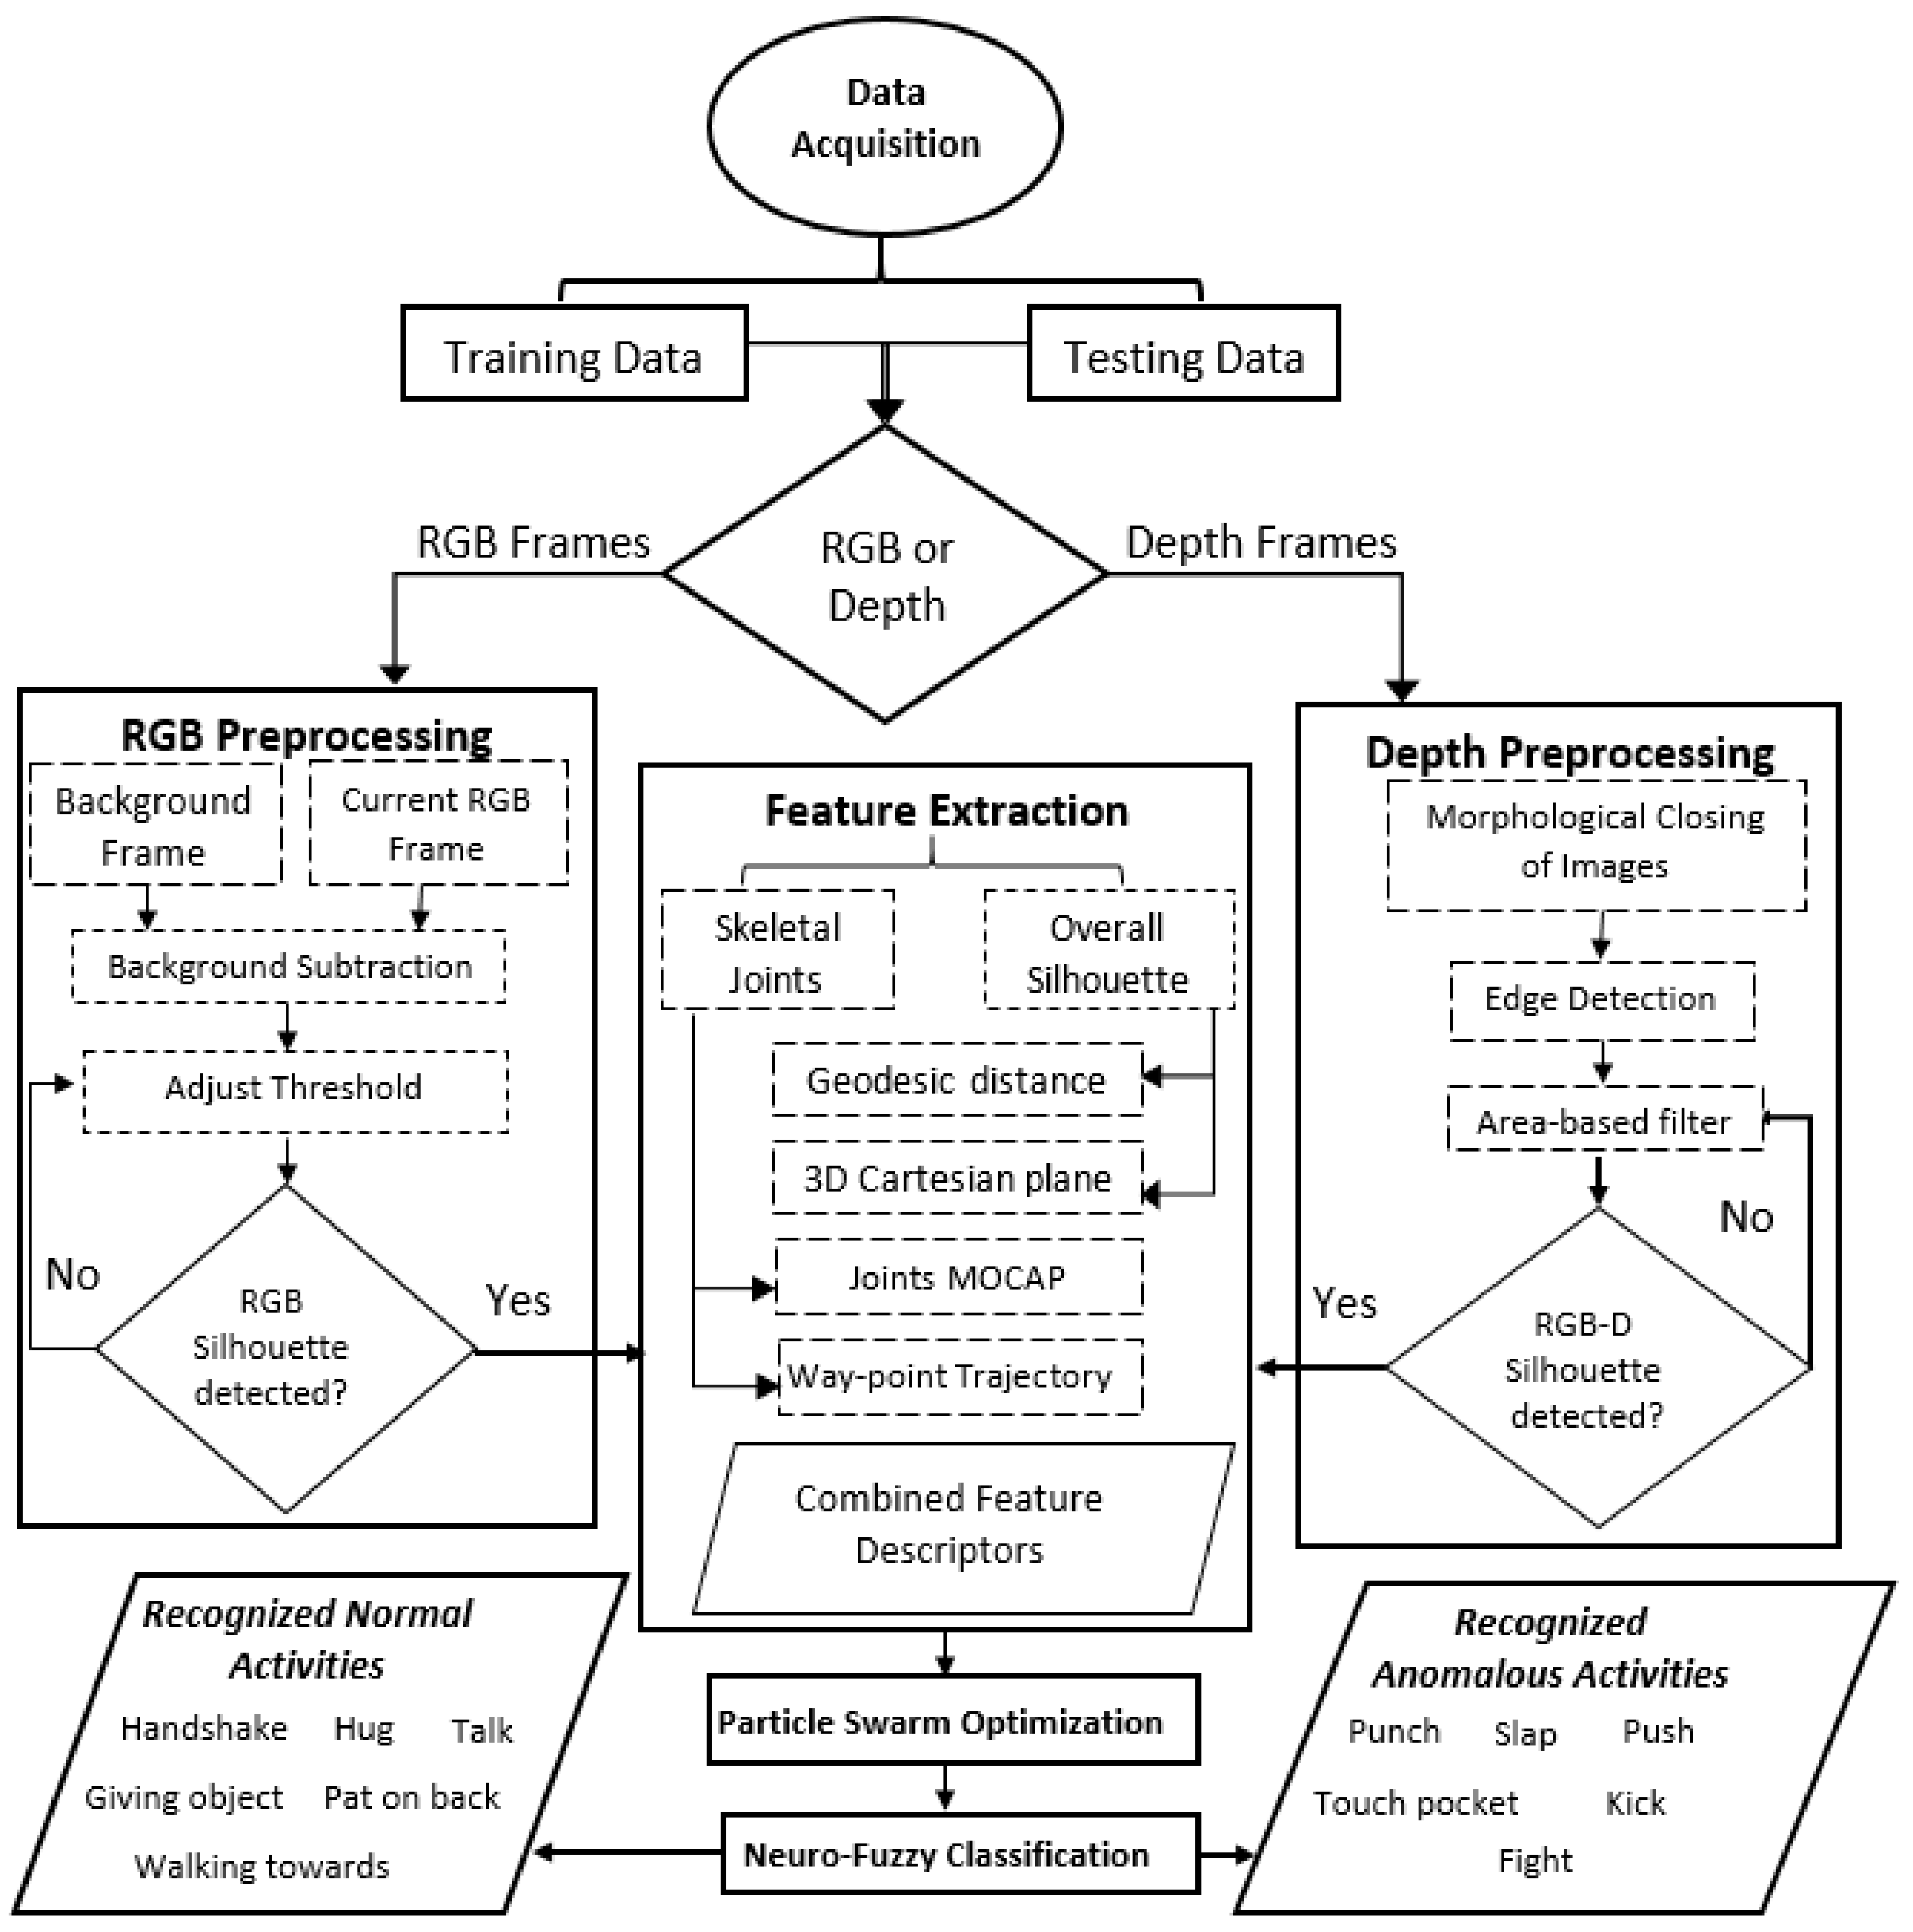
3. Materials and Methods
- In the preprocessing phase, human silhouettes of each RGB and depth image are segmented from their backgrounds.
- In the feature descriptor generation stage, four features (geodesic distance, 3D Cartesian plane, way-point trajectory and joints MOCAP) are mined from each RGB and depth image and thus, feature descriptors are generated.
- The optimization phase results in an optimized representation of feature descriptors via PSO.
- In the final stage, each human action is classified via a neuro-fuzzy inference system.
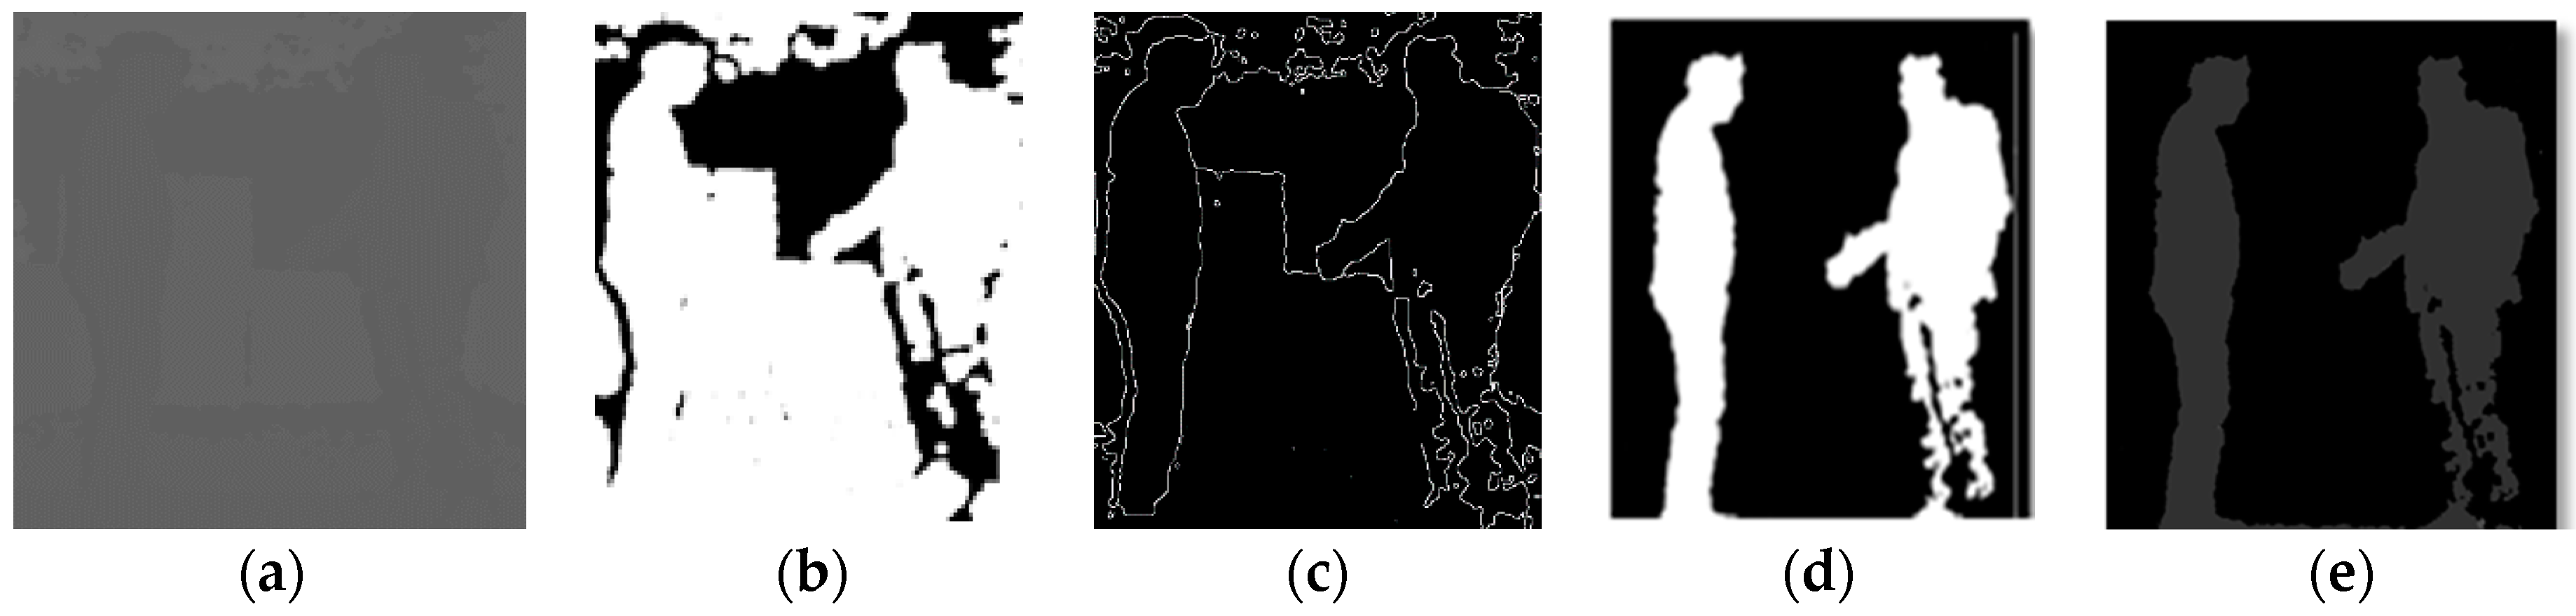
3.1. Foreground Extraction
3.1.1. Background Subtraction
3.1.2. Morphological Operations
3.2. Feature Descriptors Mining
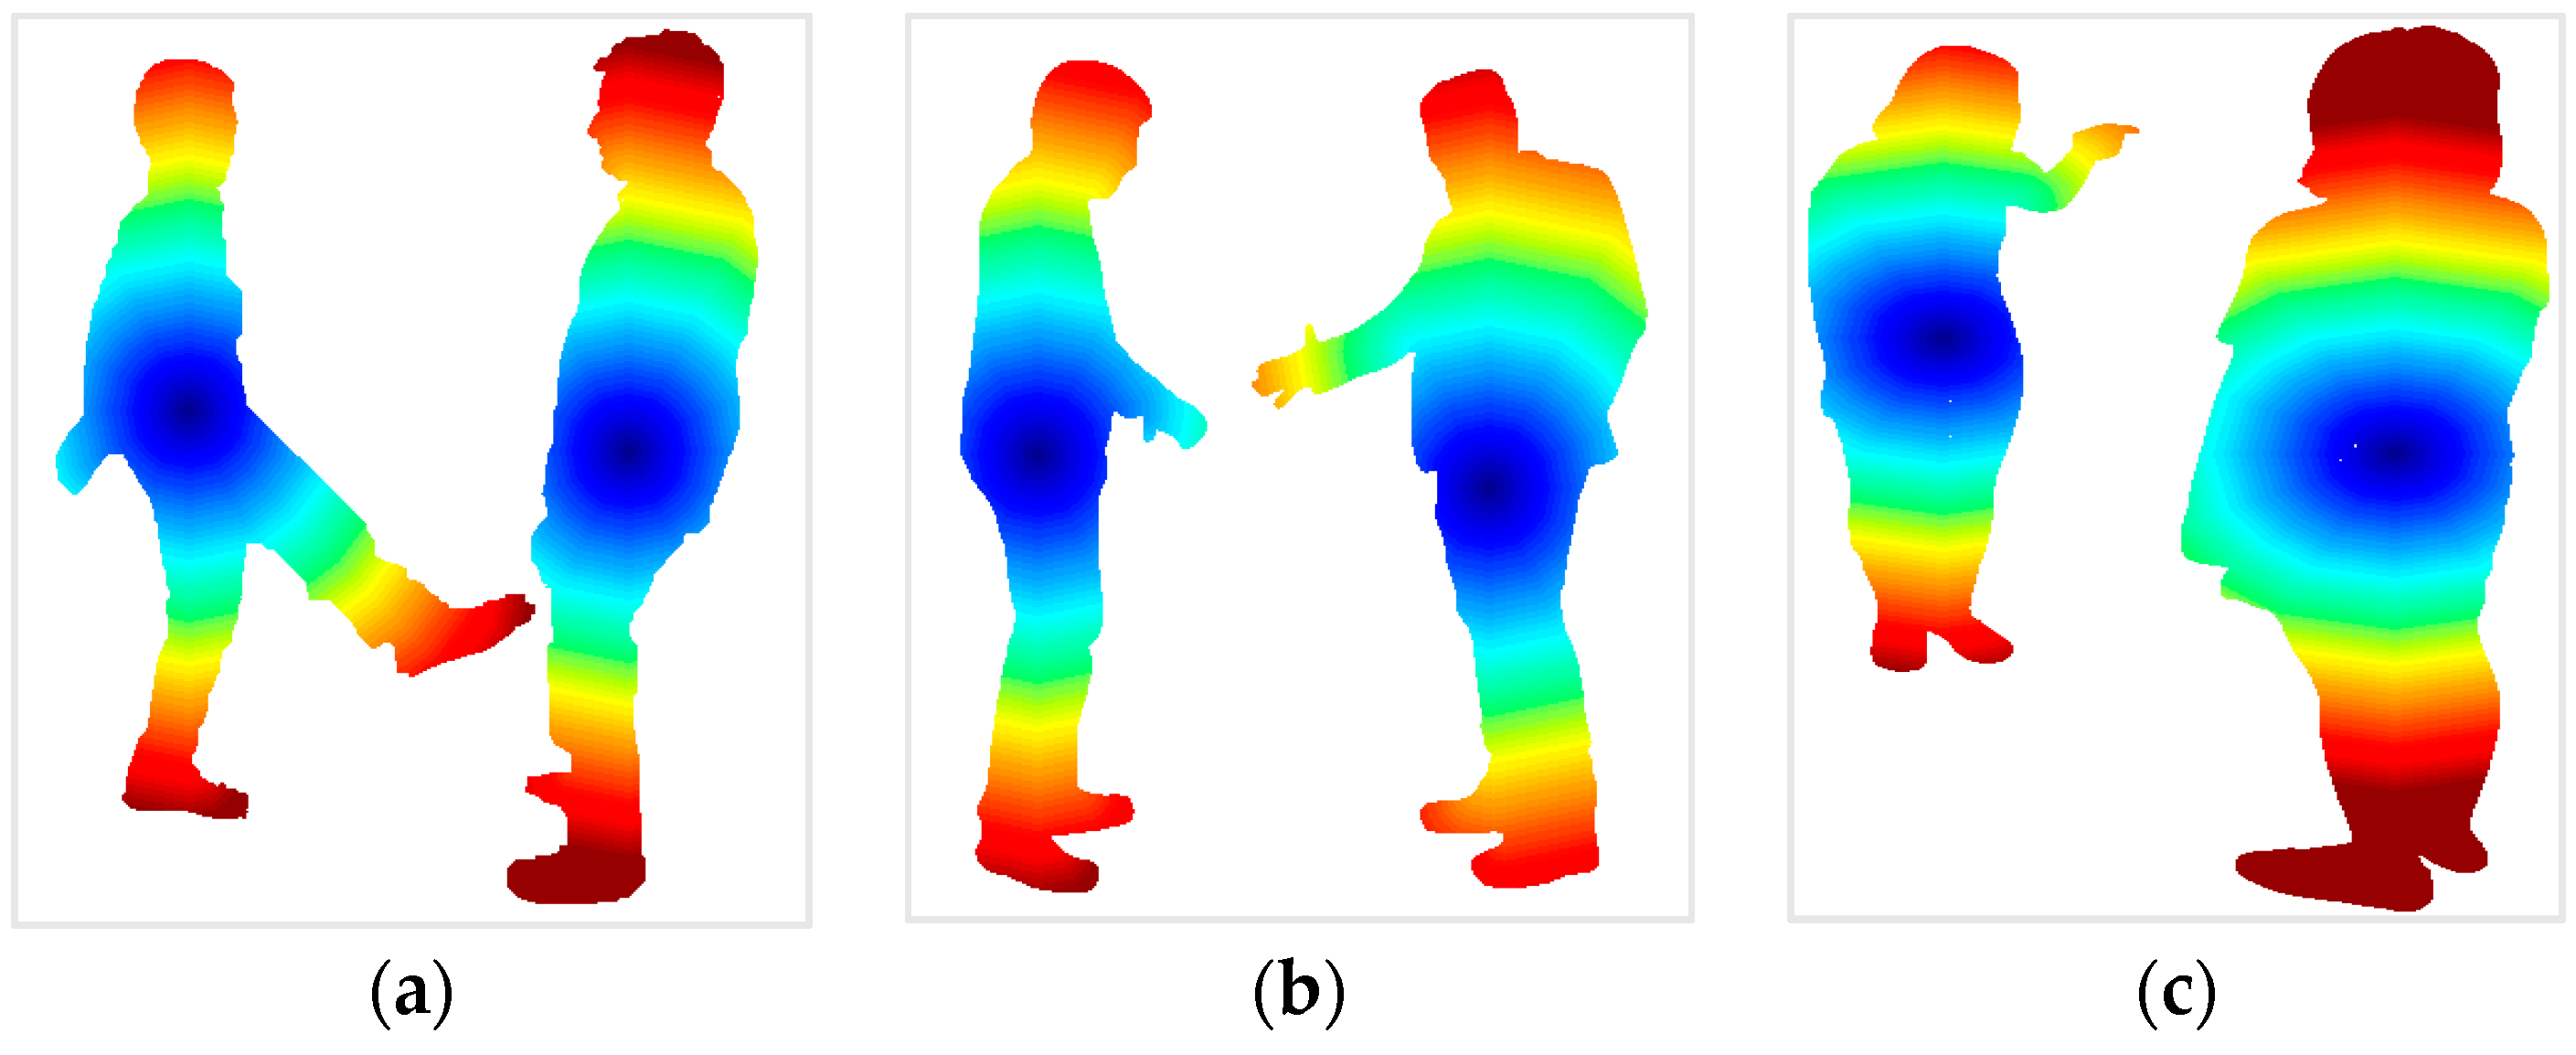
3.2.1. Geodesic Distance
3.2.2. 3D Cartesian-Plane Features
| Algorithm 1 Pseudo code of feature extraction from full silhouette |
|
1: Input: Segmented RGB and depth silhouettes frames (f1, f2, … fn) 2: Output: Full body feature descriptors (V1, V2, … Vn) //where n is total number of frames //Geodesic distance features// 3: for i = 1: n 4: mark center pixel of both human silhouettes as visited and initialize a distance equal to zero 5: as d(x0) = 0 6: for all the other points on human silhouette that are unvisited initialize d(x) = ∞ 7: initialize a queue Q = X for unvisited points 8: while Q ≠ ø 9: Step 1: Locate a vertex with a smallest distance d as x = 10: Step 2: For each neighboring unvisited vertex x′∊ N(x)∩Q 11: 12: Step 3: Remove x from Q 13: end while 14: Return distance vector d(xi) = dL (x0, xi) //3D Cartesian-plane features// 15: project each frame f in F on 3D Cartesian plane yz 16: for each projected 3D frame subtract current frame fyz from successor frame (f + 1)yz to get differential frame as diff ← (f + 1)yz − fyz 17: end for 18: for each differencial frame diff calculate HOG vector from gradient, magnitude, orientation and histogram as: 19: Gradient (diff, grad_x, grad_y) 20: Magnitude (grad_x, grad_y, mag) 21: Orientation (grad_x, grad_y, orient) 22: Histogram (orient, mag, hist) 23: Normalization (hist, normhist) 24: HOG vector ← normhist 25: end for 26: compute full body feature descriptor V for each frame f as V ← concatenate (distance vector, HOG vector) 27: end for 28: return Full body feature descriptors (V1, V2, … Vn) |
3.2.3. Joints MOCAP
- Upper body Angles: In this type, human motion caused by the rotation of the spine’s mid joint with respect to (w.r.t) all the upper body joints, namely, head, neck, left shoulder, right shoulder, left elbow, right elbow, left hand and right hand, are tracked. Four upper body angles per person, i.e., eight per frame, are tracked. The angle of the tangent between the spine’s mid joint and two other joints taken from a joints set S is calculated. The inverse tangent is found by taking a dot product of two lines v1 and v2, as represented by Equation (8):
- Lower body Angles: In this type, the angle of tangent from the spine-base joint to all the lower body joints, left hip, right hip, left knee, right knee, left foot and right foot, are calculated. Three lower body angles per person, i.e., six per frame, are tracked. Figure 6 depicts angle formation in the upper body and lower body.
3.2.4. Way-Point Trajectory Generation
| Algorithm 2. Pseudo code of feature extraction from skeletal joints |
|
1: Input: RGB and depth silhouette frames (f1, f2, … fN) //where N is total number of frames. Skeleton S consisting of sixteen human joints as {j1, j2, … jn} //where n is total number of joints 2: Output: Skeletal joints feature descriptors from all silhouette frames as (D1, D2, … DN) //Joints MOCAP feature descriptors// 3: for i = 1: N 4: for j = 1: n 5: calculate angle of tangent θup from spine mid joint to all the upper body joints 6: calculate angle of tangent θlow from spine base joint to all the lower body joints 7: compute joints MOCAP feature descriptor JMOCAP← concatenate (θup, θlow) 8: end for //way-point trajectory feature descriptors// 9: for i = 1: n 10: compute subsets Sub3, Sub4 and Sub5 consisting of sets of three, four and five 11: number of joints, respectively 12: generate trajectories as three-way T3 from Sub3, four-way T4 from Sub4 and four-way T5 13: from Sub5 14: compute displacement dx,y and motion Ct vector from trajectories T3, T4 and T5 with 15: time t 16: generate way-point trajectory descriptor T← concatenate (dx,y, Ct) 17: end for 18: skeletal joints feature descriptor D ← concatenate (JMOCAP, T) 19: end for 20: return Skeletal joints feature descriptors from all silhouette frames as (D1, D2, … DN) |
3.3. Particle Swarm Optimization (PSO)
3.4. Neuro-Fuzzy Classifier (NFC)
| Algorithm 3. Pseudo code of Neuro-fuzzy Classification of Optimized Vectors |
|
1: Step 1: for each input node in first layer do fuzzification by calculating the membership grade as 2: uij ← gussM (x, sig, c) 3: end for 4: Step 2: for each node in second layer calculate fuzzy strength by product of each sample with 5: antecedents of previous layer αis ← rule-layer (uij) 6: end for 7: Step 3: for each node in third layer defuzzify each node and generate output by weighted sum 8: of firing strenghts ysk ← sum(αis, wik.) 9: end for 10: Step 4: for each node in this layer normalize each output class by dividing it with sum of all 11: output classes osk ← ysk/sum(ysl) 12: end for 13: Step 5: Assign class label to each sample Cs ← max{osk} |
4. System Validation and Experimentation
4.1. Dataset Descriptions
4.2. Recognition Accuracy
4.3. The Effects of Numbers of Membership Functions
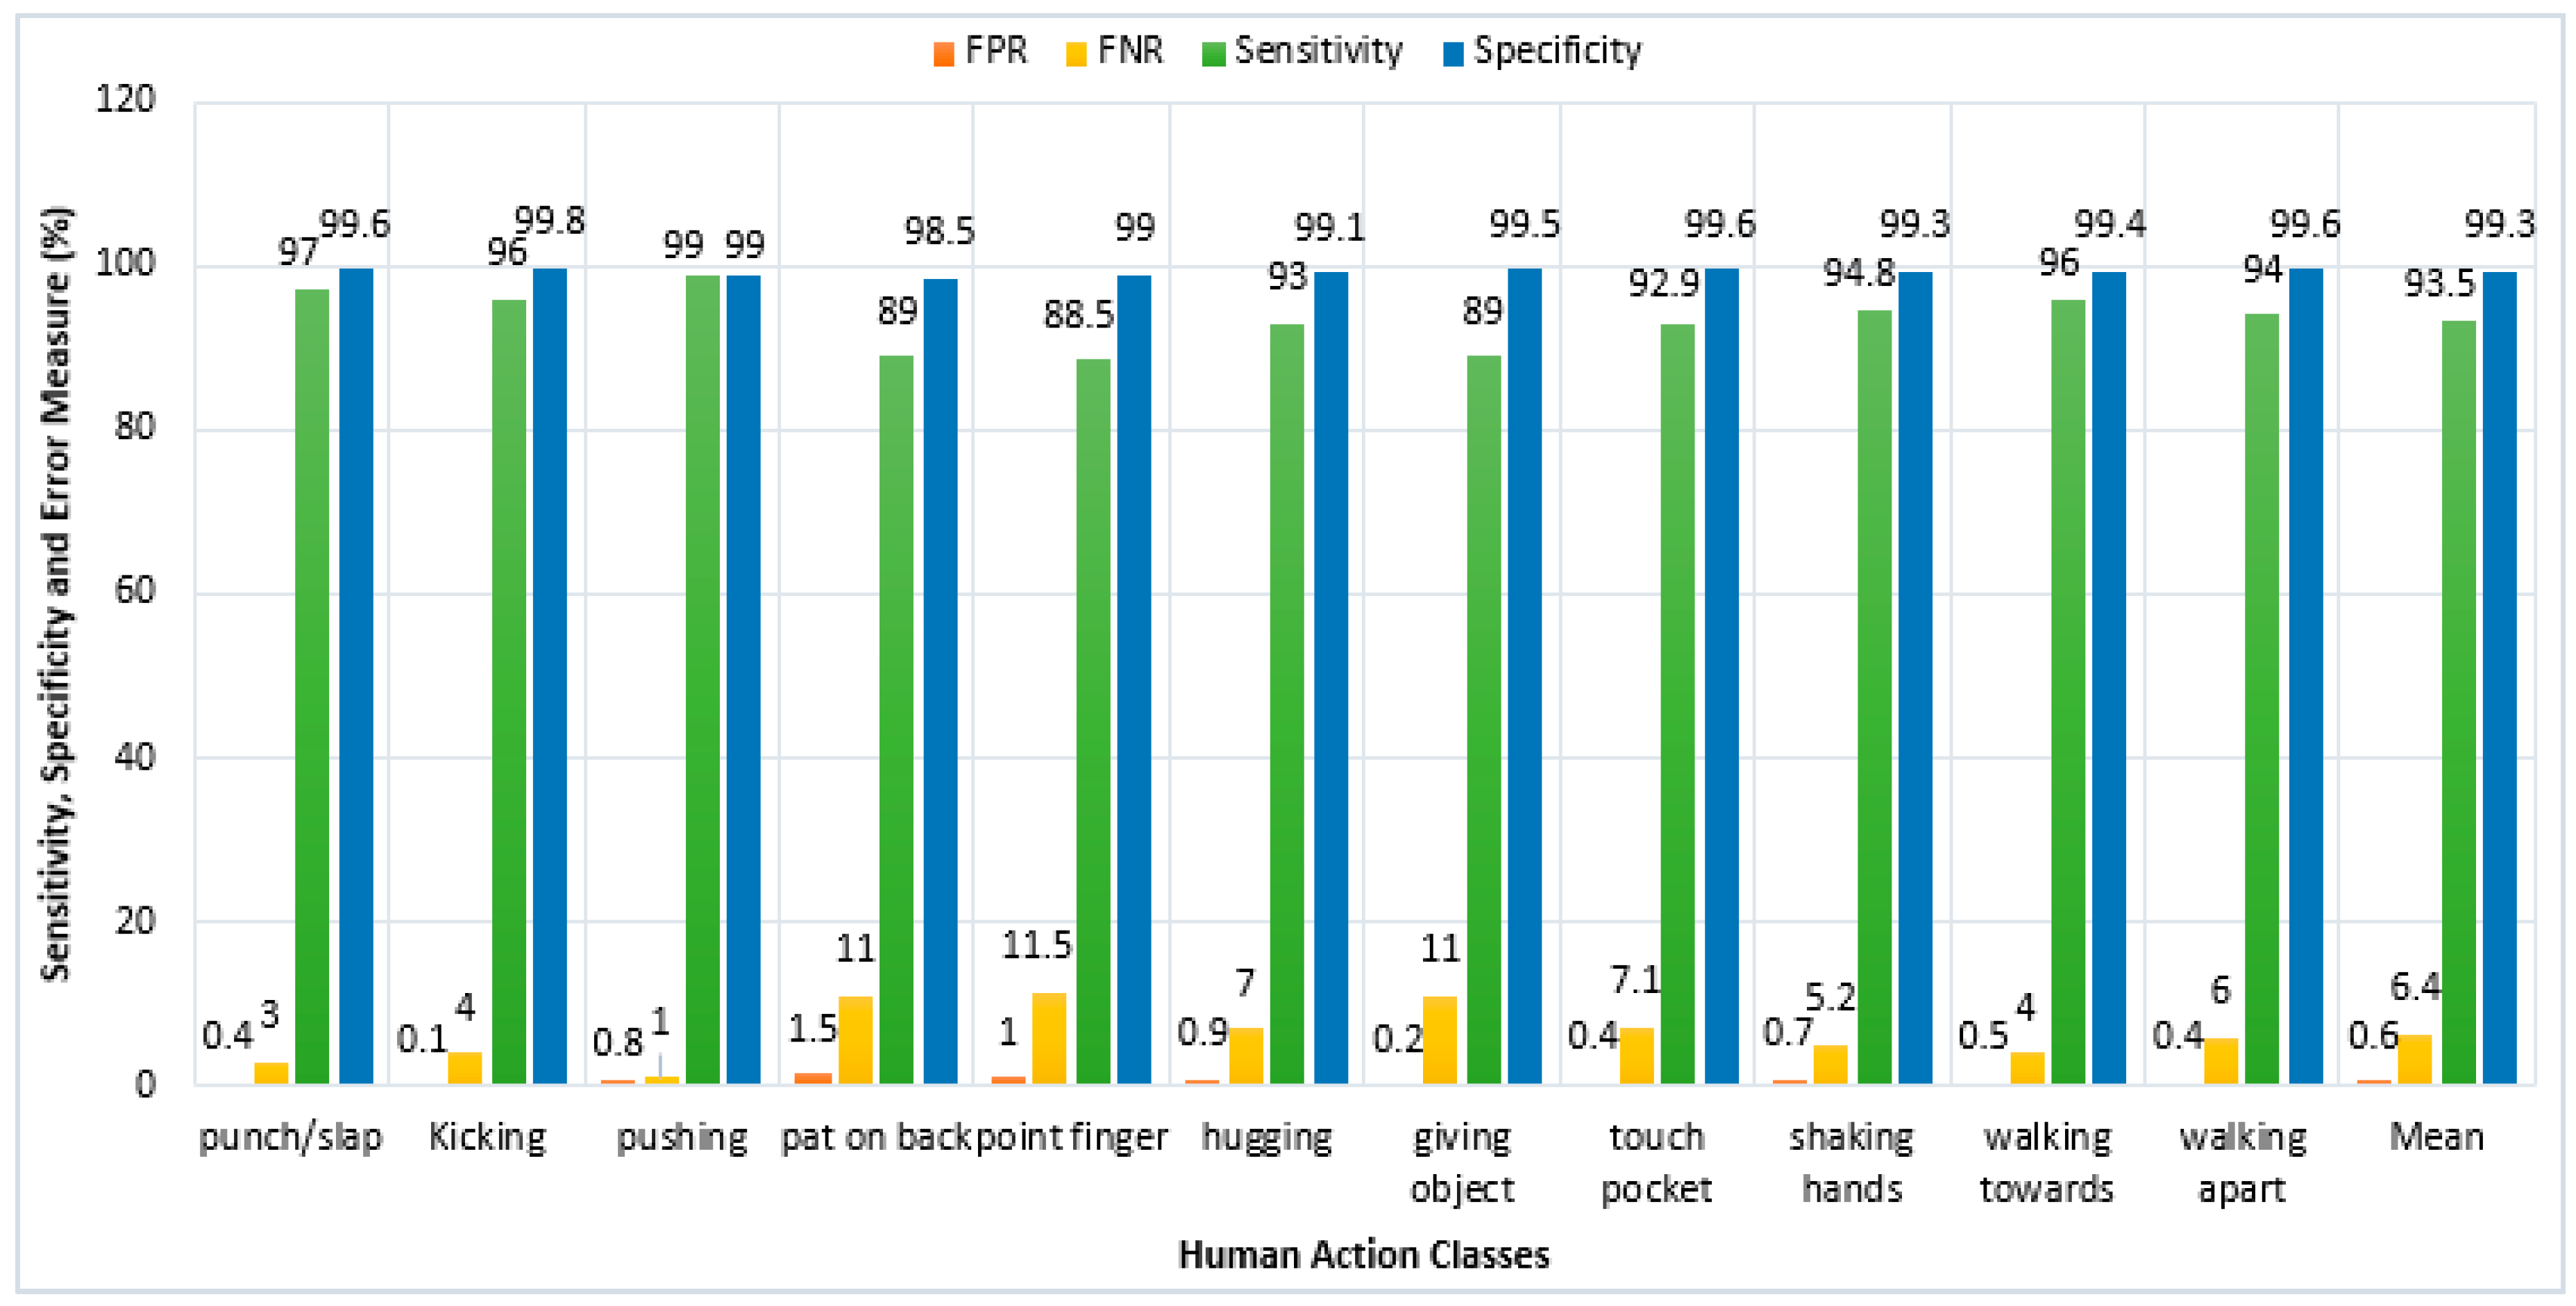
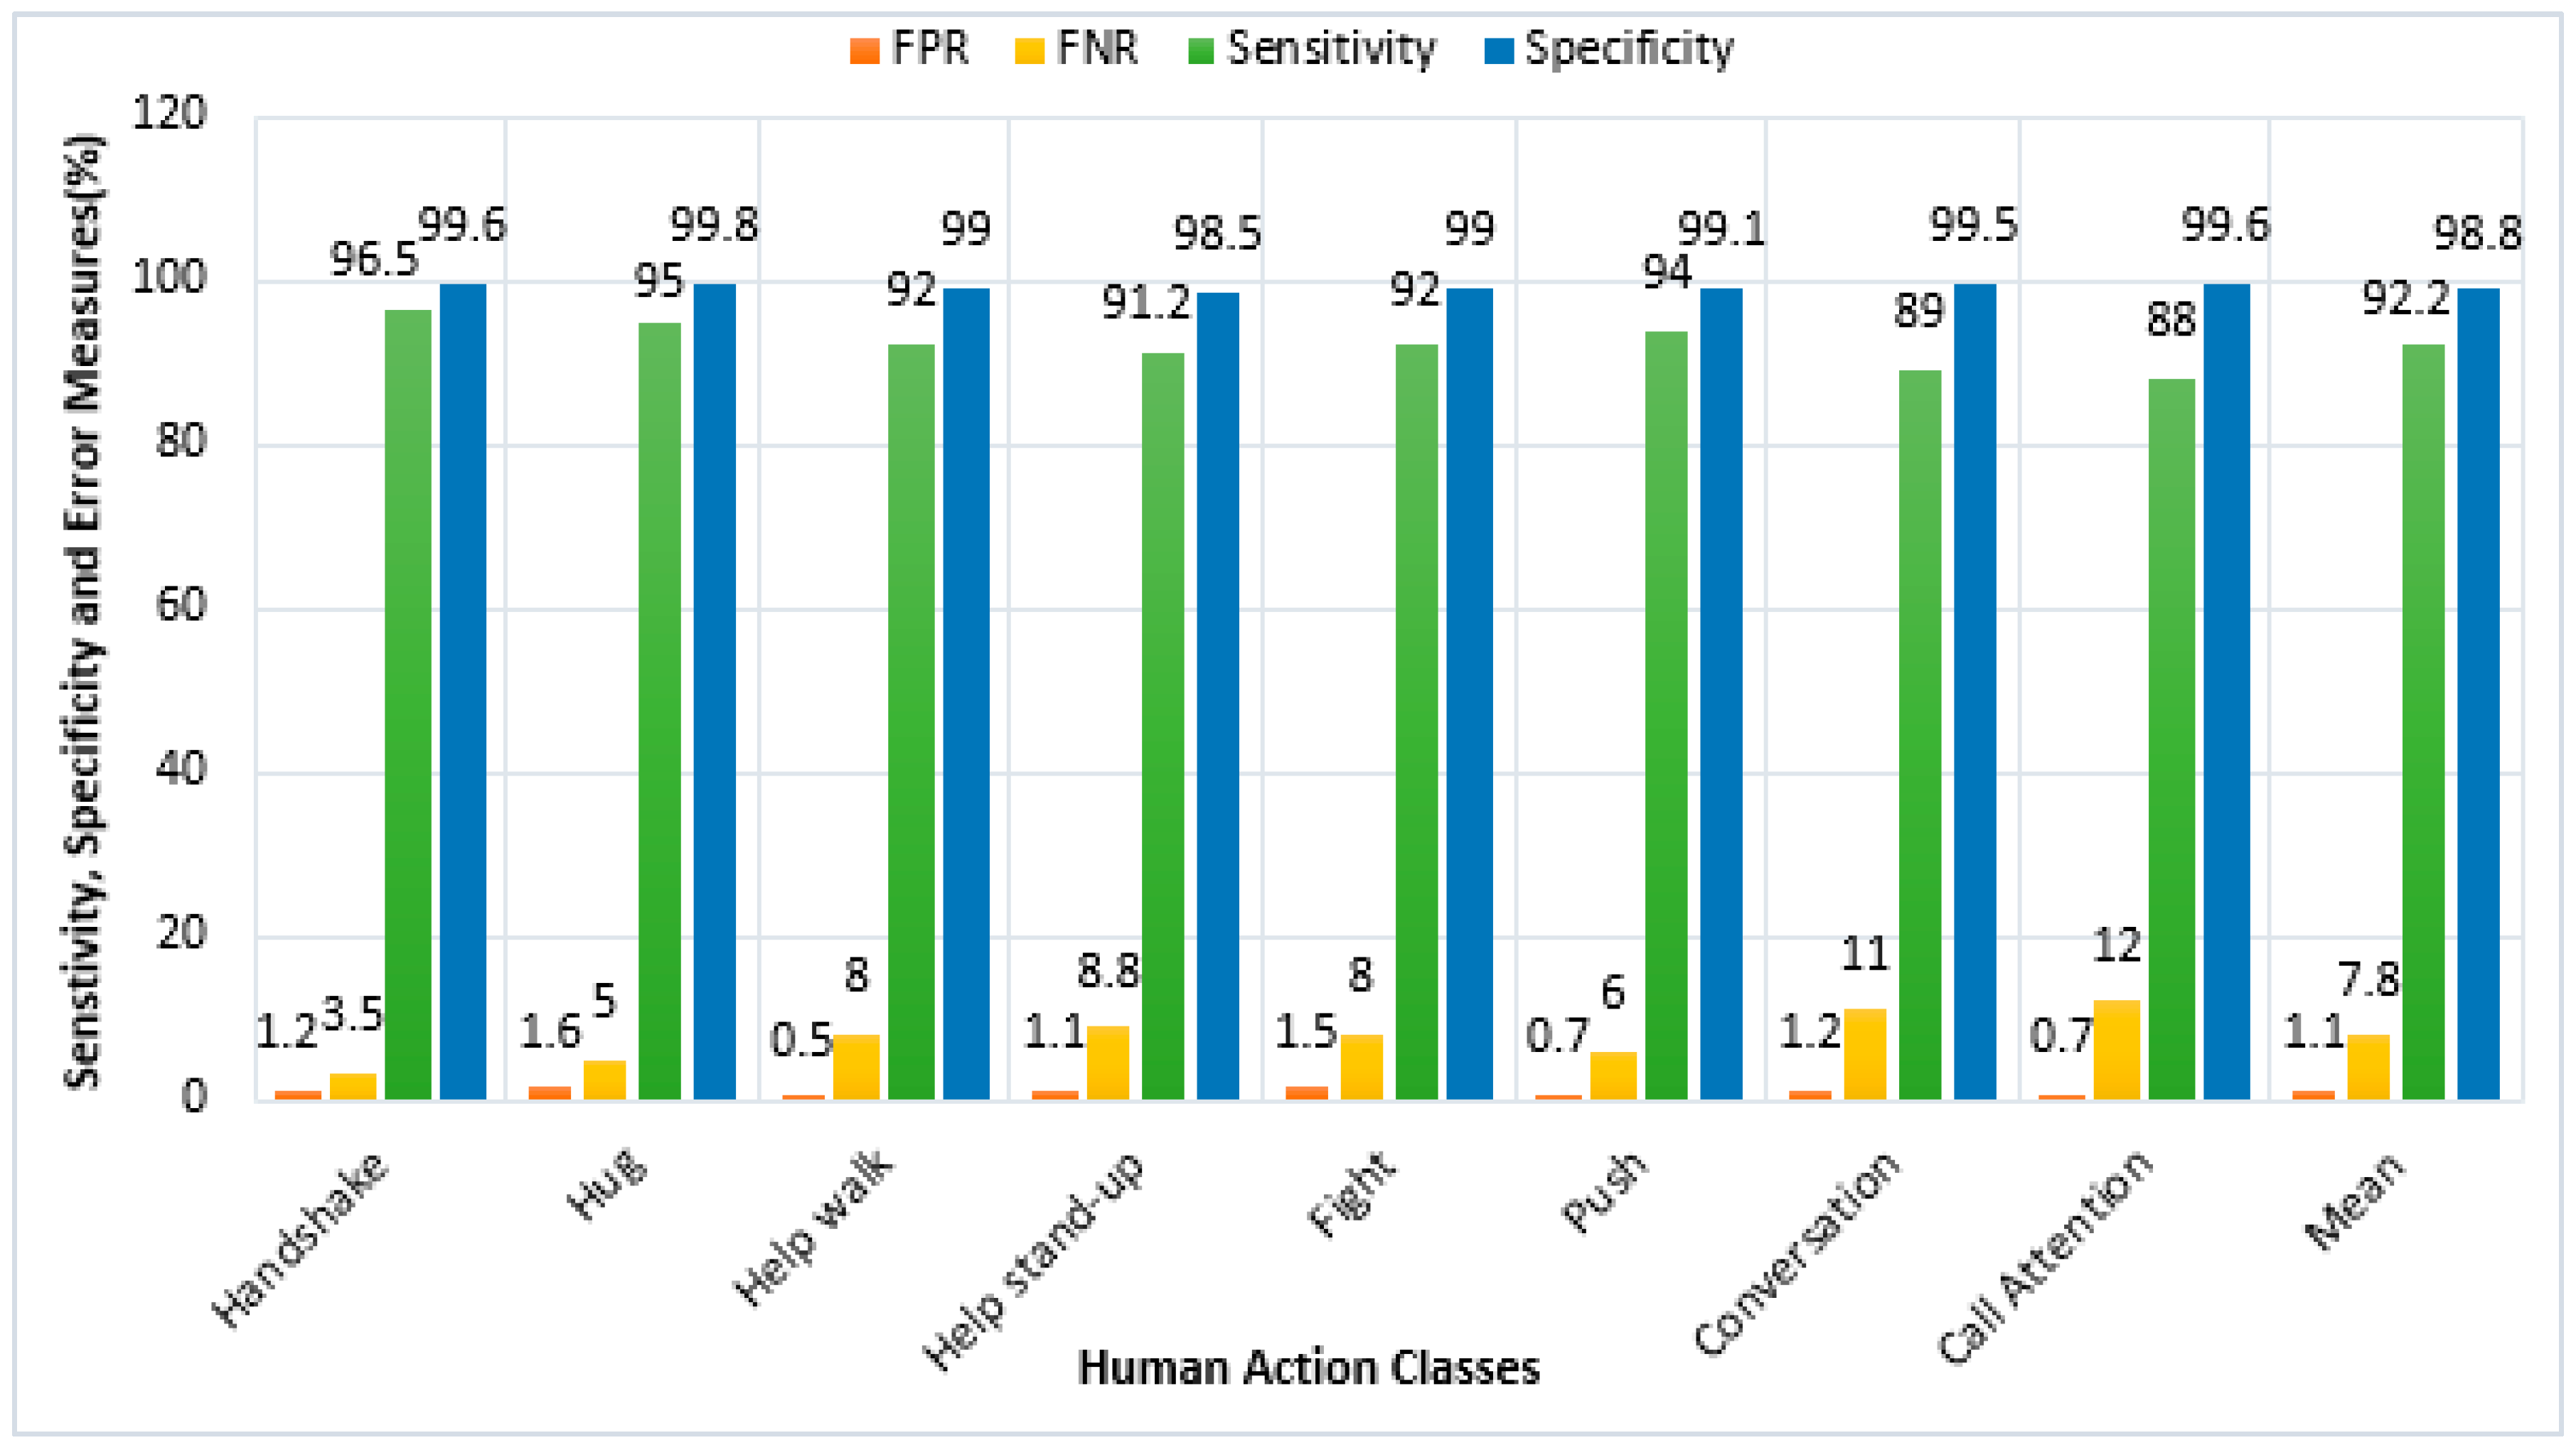
4.4. Sensitivity, Specificity and Error Measures
4.5. Computational Time Complexity
4.6. Comparison with Other Recently Proposed Systems
5. Discussion
6. Conclusions
Author Contributions
Funding
Institutional Review Board Statement
Informed Consent Statement
Conflicts of Interest
References
- Sun, Y.; Xu, C.; Li, G.; Xu, W.; Kong, J.; Jiang, D.; Tao, B.; Chen, D. Intelligent human computer interaction based on non-redundant EMG signal. Alex. Eng. J. 2020, 59, 1149–1157. [Google Scholar] [CrossRef]
- Zank, M.; Nescher, T.; Kunz, A. Tracking human locomotion by relative positional feet tracking. In Proceedings of the IEEE Virtual Reality (VR), Arles, France, 23–27 March 2015. [Google Scholar] [CrossRef]
- Jalal, A.; Akhtar, I.; Kim, K. Human posture estimation and sustainable events classification via pseudo-2D stick model and K-ary tree hashing. Sustainability 2020, 12, 9814. [Google Scholar] [CrossRef]
- Jalal, A.; Kamal, S.; Kim, D. A depth video sensor-based life-logging human activity recognition system for elderly care in Smart indoor environments. Sensors 2014, 14, 11735–11759. [Google Scholar] [CrossRef] [PubMed]
- Batool, M.; Jalal, A.; Kim, K. Sensors technologies for human activity analysis based on SVM optimized by PSO algorithm. In Proceedings of the IEEE International Conference on Applied and Engineering Mathematics (ICAEM), Taxila, Pakistan, 27–29 August 2019. [Google Scholar] [CrossRef]
- Susan, S.; Agrawal, P.; Mittal, M.; Bansal, S. New shape descriptor in the context of edge continuity. CAAI Trans. Intell. Technol. 2019, 4, 101–109. [Google Scholar] [CrossRef]
- Shokri, M.; Tavakoli, K. A review on the artificial neural network approach to analysis and prediction of seismic damage in infrastructure. Int. J. Hydromechatron. 2019, 4, 178–196. [Google Scholar] [CrossRef]
- Tingting, Y.; Junqian, W.; Lintai, W.; Yong, X. Three-stage network for age estimation. CAAI Trans. Intell. Technol. 2019, 4, 122–126. [Google Scholar] [CrossRef]
- Zhu, C.; Miao, D. Influence of kernel clustering on an RBFN. CAAI Trans. Intell. Technol. 2019, 4, 255–260. [Google Scholar] [CrossRef]
- Wiens, T. Engine speed reduction for hydraulic machinery using predictive algorithms. Int. J. Hydromechatron. 2019, 1, 16–31. [Google Scholar] [CrossRef]
- Osterland., S.; Weber, J. Analytical analysis of single-stage pressure relief valves. Int. J. Hydromechatron. 2019, 2, 32–53. [Google Scholar] [CrossRef]
- Rafique, A.A.; Jalal, A.; Kim, K. Automated sustainable multi-object segmentation and recognition via modified sampling consensus and kernel sliding perceptron. Symmetry 2020, 12, 1928. [Google Scholar] [CrossRef]
- Mahmood, M.; Jalal, A.; Kim, K. WHITE STAG model: Wise human interaction tracking and estimation (WHITE) using spatio-temporal and angular-geometric (STAG) descriptors. Multimed. Tools Appl. 2020, 79, 6919–6950. [Google Scholar] [CrossRef]
- Jalal, A.; Khalid, N.; Kim, K. Automatic recognition of human interaction via hybrid descriptors and maximum entropy Markov model using depth sensors. Entropy 2020, 22, 817. [Google Scholar] [CrossRef] [PubMed]
- Prati, A.; Shan, C.; Wang, K.I.-K. Sensors, vision and networks: From video surveillance to activity recognition and health monitoring. J. Ambient Intell. Smart Environ. 2019, 11, 5–22. [Google Scholar] [CrossRef]
- Sreenu, G.; Saleem Durai, M.A. Intelligent video surveillance: A review through deep learning techniques for crowd analysis. J. Big Data 2019, 6, 48. [Google Scholar] [CrossRef]
- Xu, H.; Pan, Y.; Li, J.; Nie, L.; Xu, X. Activity recognition method for home-based elderly care service based on random forest and activity similarity. IEEE Access 2019, 7, 16217–16225. [Google Scholar] [CrossRef]
- Park, S.U.; Park, J.H.; Al-masni, M.A.; Al-antari, M.A.; Uddin, M.Z.; Kim, T.S. A depth camera-based human activity recognition via deep learning recurrent neural network for health and social care services. Procedia Comput. Sci. 2016, 100, 78–84. [Google Scholar] [CrossRef]
- Zhao, W.; Lun, R.; Espy, D.D.; Reinthal, M.A. Rule based real time motion assessment for rehabilitation exercises. In Proceedings of the IEEE Symposium Computational Intelligence in Healthcare and E-Health, Orlando, FL, USA, 9–12 December 2014. [Google Scholar] [CrossRef]
- Barnachon, M.; Bouakaz, S.; Boufama, B.; Guillou, E. Ongoing human action recognition with motion capture. Pattern Recognit. 2014, 47, 238–247. [Google Scholar] [CrossRef]
- Bersch, S.D.; Azzi, D.; Khusainov, R.; Achumba, I.E.; Ries, J. Sensor data acquisition and processing parameters for human activity classification. Sensors 2014, 14, 4239–4270. [Google Scholar] [CrossRef]
- Schrader, L.; Vargas Toro, A.; Konietzny, S.; Rüping, S.; Schäpers, B.; Steinböck, M.; Krewer, C.; Müller, F.; Güttler, J.; Bock, T. Advanced sensing and human activity recognition in early intervention and rehabilitation of elderly people. Popul. Ageing 2020, 13, 139–165. [Google Scholar] [CrossRef]
- Li, J.; Tian, L.; Wang, H.; An, Y.; Wang, K.; Yu, L. Segmentation and recognition of basic and transitional activities for continuous physical human activity. IEEE Access 2019, 7, 42565–42576. [Google Scholar] [CrossRef]
- Jalal, A.; Batool, M.; Kim, K. Stochastic recognition of physical activity and healthcare using tri-axial inertial wearable sensors. Appl. Sci. 2020, 10, 7122. [Google Scholar] [CrossRef]
- Chen, C.; Jafari, R.; Kehtarnavaz, N. A survey of depth and inertial sensor fusion for human action recognition. Multimed. Tools Appl. 2017, 76, 4405–4425. [Google Scholar] [CrossRef]
- Mahjoub, A.B.; Atri, M. Human action recognition using RGB data. In Proceedings of the International Design & Test Symposium (IDT), Hammamet, Tunisia, 18–20 December 2016. [Google Scholar] [CrossRef]
- Nadeem, A.; Jalal, A.; Kim, K. Human actions tracking and recognition based on body parts detection via artificial neural network. In Proceedings of the International Conference on Advancements in Computational Sciences (ICACS), Lahore, Pakistan, 17–19 February 2020. [Google Scholar] [CrossRef]
- Jalal, A.; Mahmood, M.; Hasan, A.S. Multi-features descriptors for human activity tracking and recognition in indoor-outdoor environments. In Proceedings of the IEEE IBCAST, Islamabad, Pakistan, 8–12 January 2019. [Google Scholar] [CrossRef]
- Ali, H.H.; Moftah, H.M.; Youssif, A.A.A. Depth-based human activity recognition: A comparative perspective study on feature extraction. Future Comput. Inform. J. 2018, 3, 51–67. [Google Scholar] [CrossRef]
- Jalal, A.; Kim, Y.H.; Kim, Y.J.; Kamal, S.; Kim, D. Robust human activity recognition from depth video using spatiotemporal multi-fused features. Pattern Recognit. 2017, 61, 295–308. [Google Scholar] [CrossRef]
- Jalal, A.; Kamal, S.; Kim, D. Human depth sensors-based activity recognition using spatiotemporal features and hidden Markov model for smart environments. J. Comput. Netw. Commun. 2016, 1026, 2090–7141. [Google Scholar] [CrossRef]
- İnce, Ö.F.; Ince, I.F.; Yıldırım, M.E.; Park, J.S.; Song, J.K.; Yoon, B.W. Human activity recognition with analysis of angles between skeletal joints using a RGB-depth sensor. ETRI J. 2020, 42, 78–89. [Google Scholar] [CrossRef]
- Tahir, S.B.; Jalal, A.; Kim, K. Wearable inertial sensors for daily activity analysis based on Adam optimization and the maximum entropy Markov model. Entropy 2020, 22, 579. [Google Scholar] [CrossRef]
- Ahmed, A.; Jalal, A.; Kim, K. A novel statistical method for scene classification based on multi-object categorization and logistic regression. Sensors 2020, 20, 3871. [Google Scholar] [CrossRef]
- Beddiar, D.R.; Nini, B.; Sabokrou, M.; Hadid, A. Vision-based human activity recognition: A survey. Multimed. Tools Appl. 2020, 79, 30509–30555. [Google Scholar] [CrossRef]
- Nguyen, N.; Yoshitaka, A. Human interaction recognition using hierarchical invariant features. Int. J. Semant. Comput. 2015, 9, 169–191. [Google Scholar] [CrossRef]
- Cho, N.; Park, S.; Park, J.; Park, U.; Lee, S. Compositional interaction descriptor for human interaction recognition. Neurocomputing 2017, 267, 169–181. [Google Scholar] [CrossRef]
- Bibi, S.; Anjum, N.; Sher, M. Automated multi-feature human interaction recognition in complex environment. Comput. Ind. 2018, 99, 282–293. [Google Scholar] [CrossRef]
- Chang, X.; Zheng, W.-S.; Zhang, J. Learning person-person interaction in collective activity recognition. IEEE Trans. Image Process. 2015, 24, 1905–1918. [Google Scholar] [CrossRef] [PubMed]
- Ye, Q.; Zhong, H.; Qu, C.; Zhang, Y. Human interaction recognition based on whole-individual detection. Sensors 2020, 20, 2346. [Google Scholar] [CrossRef] [PubMed]
- Nadeem, A.; Jalal, A.; Kim, K. Accurate physical activity recognition using multidimensional features and Markov model for smart health fitness. Symmetry 2020, 12, 1766. [Google Scholar] [CrossRef]
- Reddy, K.K.; Shah, M. Recognizing 50 human action categories of web videos. Mach. Vis. Appl. 2013, 24, 971–981. [Google Scholar] [CrossRef]
- Mahmood, M.; Jalal, A.; Sidduqi, M.A. Robust spatio-temporal features for human interaction recognition via artificial neural network. In Proceedings of the International Conference on Frontiers of Information Technology (FIT), Islamabad, Pakistan, 17–19 December 2018. [Google Scholar] [CrossRef]
- Sharif, M.; Khan, M.A.; Akram, T.; Younus, M.J.; Saba, T.; Rehman, A. A framework of human detection and action recognition based on uniform segmentation and combination of Euclidean distance and joint entropy-based features selection. EURASIP J. Image Video Process. 2017, 2017, 89. [Google Scholar] [CrossRef]
- Kao, J.; Ortega, A.; Tian, D.; Mansour, H.; Vetro, A. Graph based skeleton modeling for human activity analysis. In Proceedings of the International Conference on Image Processing (ICIP), Taipei, Taiwan, 22–25 September 2019. [Google Scholar] [CrossRef]
- Al-Akam, R.; Paulus, D. Local feature extraction from RGB and depth videos for human action recognition. Int. J. Mach. Learn. Comput. 2018, 8, 274–279. [Google Scholar] [CrossRef]
- Jalal, A.; Kamal, S.; Kim, D. Shape and motion features approach for activity tracking and recognition from kinect video camera. In Proceedings of the IEEE International Conference on Advanced Information Networking and Applications Workshops, Gwangju, Korea, 24–27 March 2015. [Google Scholar] [CrossRef]
- Ji, X.; Wang, C.; Ju, Z. A new framework of human interaction recognition based on multiple stage probability fusion. Appl. Sci. 2017, 7, 567. [Google Scholar] [CrossRef]
- Li, M.; Leung, H. Multi-view depth-based pairwise feature learning for person-person interaction recognition. Multimed. Tools Appl. 2019, 78, 5731–5749. [Google Scholar] [CrossRef]
- Coppola, C.; Cosar, S.; Faria, D.R.; Bellotto, N. Automatic detection of human interactions from RGB-D data for social activity classification. In Proceedings of the International Symposium on Robot and Human Interactive Communication (RO-MAN), Lisbon, Portugal, 28 August–1 September 2017. [Google Scholar] [CrossRef]
- Jalal, A.; Quaid, M.A.K.; Kim, K. A wrist worn acceleration based human motion analysis and classification for ambient smart home system. J. Electr. Eng. Technol. 2019, 14, 1733–1739. [Google Scholar] [CrossRef]
- Kong, Y.; Liang, W.; Dong, Z.; Jia, Y. Recognizing human interaction from videos by a discriminative model. IET Comput. Vis. 2014, 8, 277–286. [Google Scholar] [CrossRef]
- Ji, Y.; Cheng, H.; Zheng, Y.; Li, H. Learning contrastive feature distribution model for interaction recognition. J. Vis. Commun. Image Represent. 2015, 33, 340–349. [Google Scholar] [CrossRef]
- Subetha, T.; Chitrakala, S. Recognition of human-human interaction using CWDTW. In Proceedings of the International Conference on Circuit, Power and Computing Technologies (ICCPCT), Nagercoil, India, 18–19 March 2016. [Google Scholar] [CrossRef]
- Jalal, A.; Kamal, S.; Azurdia-Meza, C.A. Depth maps-based human segmentation and action recognition using full-body plus body color cues via recognizer engine. J. Electr. Eng. Technol. 2019, 14, 455–461. [Google Scholar] [CrossRef]
- Huynh-The, T.; Banos, O.; Le, B.-V.; Bui, D.-M.; Lee, S.; Yoon, Y.; Le-Tien, T. PAM-based flexible generative topic model for 3D interactive activity recognition. In Proceedings of the International Conference on Advanced Technologies for Communications (ATC), Ho Chi Minh, Vietnam, 14–16 October 2015. [Google Scholar] [CrossRef]
- Shahroudy, A.; Ng, T.; Gong, Y.; Wang, G. Deep multimodal feature analysis for action recognition in RGB+D videos. IEEE Trans. Pattern Anal. Mach. Intell. 2018, 40, 1045–1058. [Google Scholar] [CrossRef]
- Shu, X.; Tang, J.; Qi, G.-J.; Song, Y.; Li, Z.; Zhang, L. Concurrence-aware long short-term sub-memories for person-person action recognition. In Proceedings of the IEEE Conference on Computer Vision and Pattern Recognition Workshops (CVPRW), Honolulu, HI, USA, 21–26 July 2017. [Google Scholar] [CrossRef]
- Zhu, W.; Lan, C.; Xing, J.; Zeng, W.; Li, Y.; Shen, L.; Xie, X. Co-occurrence feature learning for skeleton based action recognition using regularized deep LSTM networks. In Proceedings of the AAAI Conference on Artificial Intelligence (AAAI-16), Beijing, China, 24 March 2016. [Google Scholar]
- Du, Y.; Wang, W.; Wang, L. Hierarchical recurrent neural network for skeleton based action recognition. In Proceedings of the IEEE Conference on Computer Vision and Pattern Recognition (CVPR), Boston, MA, USA, 7–12 June 2015. [Google Scholar] [CrossRef]
- Shu, X.; Tang, J.; Qi, G.; Liu, W.; Yang, J. Hierarchical long short-term concurrent memory for human interaction recognition. IEEE Trans. Pattern Anal. Mach. Intell. 2019, 1–8. [Google Scholar] [CrossRef]
- Yao, Y.; Zhang, S.; Yang, S.; Gui, G. Learning attention representation with a multi-scale CNN for gear fault diagnosis under different working conditions. Sensors 2020, 20, 1233. [Google Scholar] [CrossRef]
- Li, T.; Shi, J.; Li, X.; Wu, J.; Pan, F. Image encryption based on pixel-level diffusion with dynamic filtering and DNA-level permutation with 3D Latin cubes. Entropy 2019, 21, 319. [Google Scholar] [CrossRef]
- Veluchamy, M.; Subramani, B. Image contrast and color enhancement using adaptive gamma correction and histogram equalization. Optik 2019, 183, 329–337. [Google Scholar] [CrossRef]
- Zhuang, L.; Guan, Y. Image enhancement via subimage histogram equalization based on mean and variance. Comput. Intell. Neurosci. 2017, 2017, 12. [Google Scholar] [CrossRef]
- Khan, S.; Lee, D.H. An adaptive dynamically weighted median filter for impulse noise removal. EURASIP J. Adv. Signal. Process. 2017, 67, 14. [Google Scholar] [CrossRef]
- Erkan, U.; Gökrem, L.; Enginoğlu, S. Different applied median filter in salt and pepper noise. Comput. Electr. Eng. 2018, 70, 789–798. [Google Scholar] [CrossRef]
- Ahmed, A.; Jalal, A.; Kim, K. RGB-D images for object segmentation, localization and recognition in indoor scenes using feature descriptor and Hough voting. In Proceedings of the IEEE IBCAST, Islamabad, Pakistan, 14–18 January 2020. [Google Scholar] [CrossRef]
- Jalal, A.; Quaid, M.A.K.; Tahir, S.B.u.d.; Kim, K. A study of accelerometer and gyroscope measurements in physical life-log activities detection systems. Sensors 2020, 20, 6670. [Google Scholar] [CrossRef] [PubMed]
- Jalal, A.; Batool, M.; Kim, K. Sustainable wearable system: Human behavior modeling for life-logging activities using K-ary tree hashing classifier. Sustainability 2020, 12, 10324. [Google Scholar] [CrossRef]
- Truong, M.T.N.; Kim, S. Automatic image thresholding using Otsu’s method and entropy weighting scheme for surface defect detection. Soft Comput. 2018, 22, 4197–4203. [Google Scholar] [CrossRef]
- Rizwan, S.A.; Jalal, A.; Kim, K. An accurate facial expression detector using multi-landmarks selection and local transform features. In Proceedings of the International Conference on Advancements in Computational Sciences (ICACS), Lahore, Pakistan, 17–19 February 2020. [Google Scholar] [CrossRef]
- Abid Hasan, S.M.; Ko, K. Depth edge detection by image-based smoothing and morphological operations. J. Comput. Des. Eng. 2016, 3, 191–197. [Google Scholar] [CrossRef]
- Treister, E.; Haber, E. A fast marching algorithm for the factored eikonal equation. J. Comput. Phys. 2016, 324, 210–225. [Google Scholar] [CrossRef]
- Garrido, S.; Alvarez, D.; Moreno Luis, E. Marine applications of the fast marching method. Front. Robot. AI 2020, 7, 2. [Google Scholar] [CrossRef]
- Jalal, A.; Nadeem, A.; Bobasu, S. Human body parts estimation and detection for physical sports movements. In Proceedings of the International Conference on Communication, Computing and Digital Systems (C-CODE), Islamabad, Pakistan, 6–7 March 2019. [Google Scholar] [CrossRef]
- Nguyen, N.; Bui, D.; Tran, X. A novel hardware architecture for human detection using HOG-SVM co-optimization. In Proceedings of the APCCAS, Bangkok, Thailand, 11–14 November 2019. [Google Scholar] [CrossRef]
- Muralikrishna, S.N.; Muniyal, B.; Dinesh Acharya, U.; Holla, R. Enhanced human action recognition using fusion of skeletal joint dynamics and structural features. J. Robot. 2020, 2020, 16. [Google Scholar] [CrossRef]
- Abdul-Azim, H.A.; Hemayed, E.E. Human action recognition using trajectory-based representation. Egypt. Inform. J. 2015, 16, 187–198. [Google Scholar] [CrossRef]
- Papadopoulos, K.; Demisse, G.; Ghorbel, E.; Antunes, M.; Aouada, D.; Ottersten, B. Localized trajectories for 2D and 3D action recognition. Sensors 2019, 19, 3503. [Google Scholar] [CrossRef] [PubMed]
- Ouyed, O.; Allili, M.S. Group-of-features relevance in multinomial kernel logistic regression and application to human interaction recognition. Expert Syst. Appl. 2020, 148, 113247. [Google Scholar] [CrossRef]
- Wang, D.; Tan, D.; Liu, L. Particle swarm optimization algorithm: An overview. Soft Comput. 2018, 22, 387–408. [Google Scholar] [CrossRef]
- Berlin, S.J.; John, M. Particle swarm optimization with deep learning for human action recognition. Multimed. Tools Appl. 2020, 79, 17349–17371. [Google Scholar] [CrossRef]
- Do, Q.H.; Chen, J.-F. A neuro-fuzzy approach in the classification of students’ academic performance. Comput. Intell. Neurosci. 2013, 2013, 179097. [Google Scholar] [CrossRef]
- Mohmed, G.; Lotfi, A.; Pourabdollah, A. Human activities recognition based on neuro-fuzzy finite state machine. Technologies 2018, 6, 110. [Google Scholar] [CrossRef]
- Subramanian, K.; Suresh, S.; Sundararajan, N. A metacognitive neuro-fuzzy inference system (McFIS) for sequential classification problems. IEEE Trans. Fuzzy Syst. 2013, 21, 1080–1095. [Google Scholar] [CrossRef]
- Shahroudy, A.; Liu, J.; Ng, T.; Wang, G. NTU RGB+D: A large scale dataset for 3D human activity analysis. In Proceedings of the Conference on Computer Vision and Pattern Recognition (CVPR), Las Vegas, NV, USA, 27–30 June 2016. [Google Scholar] [CrossRef]
- Coppola, C.; Cosar, S.; Faria, D.R.; Bellotto, N. Social activity recognition on continuous RGB-D video sequences. Int. J. Soc. Robot. 2020, 12, 201–215. [Google Scholar] [CrossRef]
- Choi, W.; Shahid, K.; Savarese, S. What are they doing? Collective activity classification using spatio-temporal relationship among people. In Proceedings of the International Conference on Computer Vision Workshops (ICCV), Kyoto, Japan, 27 September–4 October 2009. [Google Scholar] [CrossRef]
- Lee, J.; Ahn, B. Real-time human action recognition with a low-cost RGB camera and mobile robot platform. Sensors 2020, 20, 2886. [Google Scholar] [CrossRef]
- Luvizon, D.C.; Picard, D.; Tabia, H. 2D/3D pose estimation and action recognition using multitask deep learning. In Proceedings of the Conference on Computer Vision and Pattern Recognition, Salt Lake City, UT, USA, 18–23 June 2018. [Google Scholar] [CrossRef]
- Li, B.; Dai, Y.; Cheng, X.; Chen, H.; Lin, Y.; He, M. Skeleton based action recognition using translation-scale invariant image mapping and multi-scale deep CNN. In Proceedings of the International Conference on Multimedia & Expo Workshops (ICMEW), Hong Kong, China, 10–14 July 2017. [Google Scholar] [CrossRef]
- Coppola, C.; Faria, D.R.; Nunes, U.; Bellotto, N. Social activity recognition based on probabilistic merging of skeleton features with proximity priors from RGB-D data. In Proceedings of the International Conference on Intelligent Robots and Systems (IROS), Daejeon, South Korea, 9–14 October 2016. [Google Scholar] [CrossRef]
- Manzi, A.; Fiorini, L.; Limosani, R.; Dario, P.; Cavallo, F. Two-person activity recognition using skeleton data. IET Comput. Vis. 2018, 12, 27–35. [Google Scholar] [CrossRef]
- Ehatisham-Ul-Haq, M.; Javed, A.; Awais, M.A.; Hafiz, M.A.M.; Irtaza, A.; Hyun, I.L.; Tariq, M.M. Robust human activity recognition using multimodal feature-level fusion. IEEE Access 2019, 7, 60736–60751. [Google Scholar] [CrossRef]
- Deng, Z.; Vahdat, A.; Hu, H.; Mori, G. Structure inference machines: Recurrent neural networks for analyzing relations in group activity recognition. In Proceedings of the Conference on Computer Vision and Pattern Recognition (CVPR), Las Vegas, NV, USA, 27–30 June 2016. [Google Scholar] [CrossRef]
- Choi, W.; Savarese, S. A unified framework for multi-target tracking and collective activity recognition. In Proceedings of the ECCV LNCS, Berlin, Germany, 23–28 August 2012. [Google Scholar] [CrossRef]


| Phase | Techniques | Description |
|---|---|---|
| Silhouette Segmentation | Background subtraction and Morphological operations | Efficient silhouette segmentation is executed on both RGB and depth frames via frame differencing and morphological operations, respectively. |
| Feature Extraction | Geodesic distance | Geodesic maps are generated based on the shortest distance from the center points of two human silhouettes towards the outer boundary. |
| 3D Cartesian plane | RGB and depth silhouettes are projected in an altered Cartesian plane to represent features from different views. | |
| Joints MOCAP | The geometrical properties of each human joint are taken to record human locomotion. | |
| Way-point trajectory generation | The shape and motion information of each way-point trajectory generated from subsets of skeletal joints are recorded with each changing frame. Inter-silhouette and intra-silhouette trajectory generation is implemented. | |
| Optimization | Particle Swarm Optimization (PSO) | The tracked motion descriptors of each action class are represented in an optimized form via a PSO algorithm. PSO is used as a feature selection algorithm to remove redundant features and to increase classification performance. For an efficient time and space computation, PSO is applied for feature selection and size reduction. |
| Classification | Neuro-Fuzzy Classifier(NFC) | An extensive experimental evaluation with challenging RGB-D datasets is performed with NFC. System validation is proved with an altered number of membership functions. |
| Authors | RGB Datasets | Methodology | Classification Results |
|---|---|---|---|
| Xiaobin et al. [39] | CAD Choi’s Dataset | A learning-based methodology was proposed in which the interaction matrix of each activity was represented. A multitask interaction response (MIR) was computed for each class separately. | Support Vector Machine (SVM) as baseline and MIR was used for classification. Experiments proved the validation of the system. The mean accuracy achieved was 83.3% with CAD and 80.3% with Choi’s dataset. |
| Qing et al. [40] | UT-Interaction dataset | A global feature-based approach was presented where a combination of Gaussian time-phase features was used. Multifeature fusion was performed with ResNet (Residual Network) and parallel inception. | Experiments were performed via SVM with Kalman tracking. An overall recognition rate of 91.7% was achieved with UT-Interaction dataset. |
| Amir et al. [41] | UCF YouTube action dataset and an IM-DailyRGBEvents | Spatiotemporal multidimensional features were used for both body part detection and action recognition. | Better system performance was achieved with Maximum entropy Markov model and activity recognition rates of 89.09% with the UCF dataset and 88.26% with the IM Event dataset were achieved. |
| Kishore et al. [42] | UCF 50 | Scene context approach was applied. Motion features were applied along with the fusion of descriptors at early and late stages. | They achieved a performance rate of 87.19% with UCF11, 76.90% with UCF50, 27.20% with HMDB51 and 89.79% with KTH dataset via SVM. |
| UCF 11 | |||
| HMDB51 | |||
| KTH | |||
| Mahmood et al. [43] | UT-Interaction dataset | After identifying the starting and ending frame, spatiotemporal features were extracted from human key body points and from full body silhouettes, as well. | With Artificial Neural Network (ANN) and one-third training validation test, better recognition was achieved in six classes with an average accuracy of 83.5% with Set 1 and 72.5% with Set 2. |
| Authors | RGB-D Datasets | Methodology | Classification Results |
|---|---|---|---|
| Rawya et al. [46] | MSR-Daily Activity 3D dataset and Online RGBD action dataset | Spatio-temporal features were extracted using a Bag-of-Features (BoF) approach. Points of interest were detected, and motion history images were created to perform this research work. | By using K-means clustering and multiclass SVM, experimental results on these publicly available datasets proved the efficacy of the system with average recognition rates of 91.1% with the MSR dataset and 92.8% with the Online RGBD dataset. |
| Jalal et al. [47] | MSRAction3D | The two types of features that were extracted from human silhouettes were shape and motion features using temporal continuity constraints. | As a result of experimentation on two challenging datasets with Hidden Markov Model (HMM), this approach proved to be effective in HAR with a mean recognition rate of 82.10%. |
| Xiaofei et al. [48] | SBU Kinect interaction dataset UT-Interaction dataset | In this research work, interaction was divided into three stages, namely, start, middle and end. Probability fusion-based features were extracted. | Extensive experiments via HMM proved the efficacy of the system with 91.7% accuracy with the SBU and 80% with the UT-Interaction dataset. |
| Meng et al. [49] | NTU RGB+D, SBU Kinect interaction dataset and M2I dataset | With the help of skeletal and depth data, pairwise feature learning was introduced. Relative movement between body parts was extracted. | Linear SVM was used as a classifier. All activity classes were recognized with higher accuracy rates than many state-of-the-art systems. |
| Claudio et al. [50] | UoL 3D social activity dataset | Determining social activity via statistical and geometrical features such as skeletal positions and motion features was proposed in this research work. | The proposed novel features with HMM proved to be very effective in social interaction recognition with a mean accuracy of 85.5%. |
| Authors | Datasets | Methodology | Results via Machine Learning |
|---|---|---|---|
| Yu et al. [52] | BIT-Interaction Dataset UT-Interaction dataset | In order to recognize interdependencies between two-person interaction, local body parts and global large-scale features were presented. Adaboost algorithm was adopted to find 3D body parts. | Linear SVM was used for classification. After testing on two benchmark datasets, the average accuracy with the BIT dataset was 82.03% and with the UT dataset it was 85%. |
| Yanli et al. [53] | Self-annotated CR-UESTC dataset and SBU Kinect interaction dataset | For interaction recognition a Contrastive Feature Description Model (CFDM) was proposed. Intr-a and inter-skeleton were represented. | The CFDM approach proved to be very effective with an action recognition rate of 87.6% with the CR-UESTC and 89.4% with the SBU dataset via Binary SVM. |
| T Subetha et al. [54] | SBU Kinect interaction dataset | Features were extracted via a Histogram of Oriented Gradients (HOG) and pyramidal approach. Constrained Weighted Dynamic Time Warping (CWDTW) was used in this work. | K-means clustering with CWDTW was used for classification. A very high recognition rate of 90.8% was achieved with this new approach towards action recognition. |
| Jalal et al. [55] | IM-DailyDepthActivity dataset MSRAction3D | Spatiotemporal features of human joints and frame differentiation features were extracted. | Classification was performed with HMM. Results of the proposed system were validated via experimentation with an accuracy rate of 88.9% and 66.70% over two datasets. |
| Thien et al. [56] | SBU Kinect interaction dataset | Joint features were extracted via Pachinko Allocation Model. Both joint motion and distance feature were extracted. | This method outperformed many state-of-the-art methods via Binary Tree as a classifier. A mean recognition rate of 90.3% was achieved. |
| Authors | Datasets | Methodology | Results via Deep Learning |
|---|---|---|---|
| Amir et al. [57] | NTU RGB+D, 3D Action Pair, MSR Daily activity and Online RGBD | A new deep learning model for shared specific factorization features was introduced in this research work. Sparsity learning was introduced for classification. Two experimental settings were adopted to show the effectiveness of the proposed methodology. | The recognition rate of actions involving a single person is as high as 100% with the 3D action pair dataset, while the recognition rate with datasets that involve two-person interactions, i.e., NTU RGB+D, is 74.9%. Overall good performance is achieved with each of five datasets. |
| Xiangbo et al. [58] | BIT-Interaction Dataset UT-Interaction dataset | In order to capture changes in interactions between two persons over time, Concurrent Long Short-Term Memory (Co-LSTM) was proposed. Information about human action was stored in sub-memory units. | Co-LSTM produced a superior performance with both RGB datasets. A recognition rate of 92.8% was achieved with the UT-Interaction dataset and 95% with the BIT dataset was achieved. |
| Wentao et al. [59] | SBU Kinect interaction dataset, HDM05, Berkeley MHAD | Skeletal temporal features were extracted automatically via a Long Short-Term Memory (LSTM) network. Co-occurrence features were extracted. A novel dropout methodology was proposed. | Deep LSTM results in an average accuracy rate of 90.4% with SBU, 97.25% with HDM05 and 81.05% with the CMU dataset. |
| Yong et al. [60] | MSR action 3D Dataset, Berkeley MHAD and Motion Capture Dataset hdm05 | Temporal long-term contextual information was learned via Hierarchical RNN (HRNN). In this approach, the human skeleton is divided into five subparts. Each subpart is separately fed into five different subnetworks. | Five different experimental settings were used with HRNN. Through experimentation, high recognition performance rate was achieved with a number of datasets with each experimental setting. |
| Xiangbo shu et al. [61] | CAD | In order to overcome the limitation of LSTM in capturing changes in human interactions over time, Hierarchical LSTM (HLSTM) was used in this research work. Groups of people were observed to monitor human interactions. | Comparisons with four baselines and state-of the-art methods were performed. The validity of the novel approach presented in this method was proved by the high accuracy achieved with three datasets. |
| BIT | |||
| UT |
| No. of Trajectories | No. of Way-Points | Subsets of Joints | |
|---|---|---|---|
| Intra-Silhouette | Inter-Silhouette | ||
| 1 | Three | {H 1, N 1, SM 1} | {H 1, N 1, H 2} |
| 2 | {H 1, N 1, SB 1} | {H 2, N 2, H 1} | |
| 3 | {H 2, N 2, SM 2} | {RS 1, LS 1, RE 2} | |
| 4 | {H 2, N 2, SB 2} | {RS 2, LS 2, RE 1} | |
| 5 | {RS 1, RE 1, RH 1} | {RH 1, LH 1, LE 2} | |
| 6 | {LS 1, LE 1, LH 1} | {RH 2, LH 2, LE 1} | |
| 7 | {RS 2, RE 2, RH 2} | {SM 1,SB 1, SM 2} | |
| 8 | {LS 2, LE 2, LH 2} | {SM 2, SB 2, SM 1} | |
| 9 | {RHP 1,RK 1, RF 1} | {RHP 1, LHP 1, RK 2} | |
| 10 | {LHP 1,LK 1, LF 1} | {RHP 2, LHP 2, RK 1} | |
| 11 | {RHP 2,RK 2, RF 2} | {RF 1,LF 1,LK 2} | |
| 12 | {LHP 2,LK 2, LF 2} | {RF 2,LF 2,LK 1} | |
| 13 | Four | {H 1, N 1, SM 1, SB 1} | {H 1, N 1, H 2, N 2} |
| 14 | {H 2, N 2, SM 2, SB 2} | {H 2, N 2, H 1, N 1} | |
| 15 | {N 1, RS 1, RE 1,RH 1} | {RS 1, LS 1, RS 2, LS 2} | |
| 16 | {N 1, LS 1, LE 1,LH 1} | {RE 1, LE 1, RE 2, LE 2} | |
| 17 | {N 2, RS 2, RE 2,RH 2} | {RH 1, LH 1, RH 2, LH 2} | |
| 18 | {N 2, LS 2, LE 2, LH 2} | {SM 1, SB 1, SM 2, SB 2} | |
| 19 | {SB 1, RHP 1, RK 1, RF 1} | {RHP 1, LHP 1, RHP 2, LHP 2} | |
| 20 | {SB 1, LHP 1, LK 1, LF 1} | {RK 1, LK 1, RK 2, LK 2} | |
| 21 | {SB 2, RHP 2,RK 2, RF 2} | {RF 1, LF 1, RF 2, LF 2} | |
| 22 | {SB 2, LHP 2,LK 2, LF 2} | ||
| 23 | Five | {H 1, N 1, RS 1, RE 1, RH 1} | {H 1, N 1, SM 2, N 2, H 2} |
| 24 | {H 1, N 1, LS 1, LE 1,LH 1} | {H 2, N 2, SM 1, N 1, H 1} | |
| 25 | {H 2, N 2, RS 2, RE 2, RH 2} | {RS 1, LS 1, SB 2, RS 2, LS 2} | |
| 26 | {H 2, N 2, LS 2, LE 2, LH 2} | {RS 2, LS 2, SB 1, RS 1, LS 1} | |
| 27 | {SM 1, SB 1, RHP 1, RK 1, RF 1} | {RE 1, LE 1, RH 2,RE 2, LE 2} | |
| 28 | {SM 1, SB 1, LHP 1, LK 1, LF 1} | {RE 1, LE 1, LH 2,RE 2, LE 2} | |
| 29 | {SM 2, SB 2, RHP 2,RK 2, RF 2} | {RK 2, RF 2, RHP 1,RK 1, RF 1} | |
| 30 | {SM 2, SB 2, LHP 2,LK 2, LF 2} | {LK 2, LF 2, LHP 1,LK 1, LF 1} | |
| Name of Dataset | Type of Input Data | Action Classes |
|---|---|---|
| NTU RGB+D | RGB videos, depth map sequences, 3D skeletal data and infrared video | This dataset contains sixty action classes and 56,880 video samples. The eleven mutual action classes that we used in the proposed system are: punch/slap, kicking, pushing, pat on back, point finger, hugging, giving object, touch pocket, shaking hands, walking towards and walking apart. Dataset descriptions and samples are given in [87]. |
| UoL 3D social activity dataset | RGB-D images with tracked skeletons | This dataset contains eight two-person social interaction activities: handshake, hug, help walk, help stand-up, fight, push, conversation and call attention. The rest of the details and dataset samples are given in [88]. |
| Collective Activity Dataset (CAD) | RGB | This dataset consists of RGB sequences of five actions classes: crossing, walking, talking, queueing and waiting. Actions are performed in both indoor and outdoor environments. Dataset descriptions and samples are given in [89]. |
| Predicted Action Classes | ||||||||||||
|---|---|---|---|---|---|---|---|---|---|---|---|---|
| S | K | P | PB | PF | H | GO | TP | SH | WT | WA | ||
| Actual Action Classes | S 1 | 97 | 0 | 1 | 0 | 2 | 0 | 0 | 0 | 0 | 0 | 0 |
| K 2 | 0 | 96 | 0 | 0 | 0 | 0 | 0 | 1.5 | 0 | 2.5 | 0 | |
| P 3 | 1 | 0 | 98 | 0.5 | 0 | 0 | 0.5 | 0 | 0 | 0 | 0 | |
| PB 4 | 0 | 0 | 3 | 89 | 1 | 4 | 0 | 0 | 0 | 1 | 2 | |
| PF 5 | 1.5 | 0 | 3 | 2.5 | 88.5 | 0 | 2 | 0.5 | 2 | 0 | 0 | |
| H 6 | 0 | 0 | 3 | 0 | 2 | 93 | 0 | 0 | 1 | 1 | 0 | |
| GO 7 | 0 | 0.2 | 0 | 3 | 2 | 2 | 89 | 0 | 3.8 | 0 | 0 | |
| TP 8 | 0 | 0 | 0 | 3.8 | 0 | 1 | 0 | 92.9 | 0 | 0.7 | 1.6 | |
| SH 9 | 0 | 1.2 | 0 | 0 | 2.6 | 1.4 | 0 | 0 | 94.8 | 0 | 0 | |
| WT 10 | 1 | 0 | 0 | 0.8 | 0 | 0 | 2 | 0 | 0.2 | 96 | 0 | |
| WA 11 | 0 | 0 | 0 | 4 | 0 | 0 | 0 | 2 | 0 | 0 | 94 | |
| Mean Accuracy = 93.5% | ||||||||||||
| Predicted Action Classes | |||||||||
|---|---|---|---|---|---|---|---|---|---|
| Handshake | Hug | Help Walk | Help Stand-Up | Fight | Push | Conversation | Call Attention | ||
| Actual Action Classes | Handshake | 96.5 | 1.5 | 2 | 0 | 0 | 0 | 0 | 0 |
| Hug | 2 | 95 | 1 | 0 | 0 | 0 | 2 | 0 | |
| Help walk | 0 | 2 | 92 | 3 | 1 | 0 | 2 | 0 | |
| Help stand-up | 2 | 0 | 0 | 91.2 | 4.8 | 0 | 0 | 2 | |
| Fight | 0 | 2 | 0 | 1 | 92 | 5 | 0 | 0 | |
| Push | 0 | 1 | 1 | 0 | 3 | 94 | 0 | 1 | |
| Conversation | 2 | 5 | 0 | 0 | 2 | 0 | 89 | 2 | |
| Call Attention | 3 | 0 | 0 | 4 | 0 | 0 | 5 | 88 | |
| Mean Accuracy = 92.2% | |||||||||
| Predicted Action Classes | ||||||
|---|---|---|---|---|---|---|
| Actual Action Classes | crossing | talking | walking | queueing | waiting | |
| crossing | 88 | 0 | 10 | 2 | 0 | |
| talking | 0 | 92 | 3 | 0 | 5 | |
| walking | 8 | 0 | 84 | 3 | 5 | |
| queueing | 0 | 2 | 4 | 90 | 4 | |
| waiting | 1 | 0 | 1 | 4 | 94 | |
| Mean Accuracy = 89.6% | ||||||
| Parameters | Performance | |||
|---|---|---|---|---|
| No. of Epochs | No. of MF | Computational Time (s) | RMSE | Accuracy (%) |
| 200 | 3 | 20 | 0.065 | 90.5 |
| 5 | 27.4 | 0.059 | 91.2 | |
| 8 | 35.2 | 0.060 | 90.9 | |
| 300 | 3 | 25 | 0.058 | 92.0 |
| 5 | 32.8 | 0.055 | 93.5 | |
| 8 | 38 | 0.055 | 93.0 | |
| 500 | 3 | 32 | 0.059 | 92.9 |
| 5 | 47.2 | 0.055 | 93.1 | |
| 8 | 58 | 0.056 | 93.1 | |
| Parameters | Performance | |||
|---|---|---|---|---|
| No. of Epochs | No. of MF | Computational Time (s) | RMSE | Accuracy (%) |
| 200 | 3 | 15 | 0.069 | 88.7 |
| 5 | 24 | 0.059 | 90.5 | |
| 8 | 32 | 0.060 | 90 | |
| 300 | 3 | 27 | 0.070 | 89 |
| 5 | 33 | 0.056 | 92 | |
| 8 | 45 | 0.061 | 91.9 | |
| 500 | 3 | 29 | 0.070 | 90 |
| 5 | 43 | 0.059 | 92 | |
| 8 | 57 | 0.066 | 92 | |
| Parameters | Performance | |||
|---|---|---|---|---|
| No. of Epochs | No. of MF | Computational Time (s) | RMSE | Accuracy (%) |
| 200 | 3 | 20 | 0.125 | 82.2 |
| 5 | 23 | 0.097 | 87.8 | |
| 8 | 31 | 0.098 | 85 | |
| 300 | 3 | 25 | 0.099 | 88.7 |
| 5 | 27 | 0.096 | 89.5 | |
| 8 | 34 | 0.096 | 89 | |
| 500 | 3 | 31 | 0.111 | 87 |
| 5 | 35 | 0.098 | 89 | |
| 8 | 40 | 0.099 | 88.5 | |
| Datasets | Authors | Methodology | Recognition Accuracy (%) |
|---|---|---|---|
| Meng Li et al. [49] | Pairwise features | 88.6 | |
| Junwoo et al. [90] | Mobile robot platform | 75.0 | |
| Amir et al. [57] | Deep multimodal features | 74.9 | |
| NTU RGB+D | Diogo et al. [91] | Multitask deep learning | 85.5 |
| Bo et al. [92] | Skeletal based action recognition | 88.6 | |
| Proposed Methodology | RGB-D skeletal and full body features | 93.5 | |
| Claudio et al. [50] | Statistical and geometrical features | 85.5 | |
| UoL 3D activity | Claudio et al. [93] | Probabilistic merging of skeleton features | 85.1 |
| Alessandro et al. [94] | Skeletal data | 87.0 | |
| Muhammad et al. [95] | Multimodal feature level fusion | 85.1 | |
| Proposed Methodology | RGB-D skeletal and full body features | 92.2 | |
| Xiaobin et al. [39] | Interaction response from atomic actions | 83.3 | |
| CAD | Xiangbo et al. [61] | Hierarchical Long Short-Term Concurrent Memory | 83.7 |
| Zhiwei et al. [96] | Relationship in group activity | 81.2 | |
| Wongun et al. [97] | Multitarget tracking | 73.3 | |
| Proposed Methodology | RGB-D skeletal and full body features | 89.6 |
Publisher’s Note: MDPI stays neutral with regard to jurisdictional claims in published maps and institutional affiliations. |
© 2021 by the authors. Licensee MDPI, Basel, Switzerland. This article is an open access article distributed under the terms and conditions of the Creative Commons Attribution (CC BY) license (http://creativecommons.org/licenses/by/4.0/).
Share and Cite
Khalid, N.; Gochoo, M.; Jalal, A.; Kim, K. Modeling Two-Person Segmentation and Locomotion for Stereoscopic Action Identification: A Sustainable Video Surveillance System. Sustainability 2021, 13, 970. https://doi.org/10.3390/su13020970
Khalid N, Gochoo M, Jalal A, Kim K. Modeling Two-Person Segmentation and Locomotion for Stereoscopic Action Identification: A Sustainable Video Surveillance System. Sustainability. 2021; 13(2):970. https://doi.org/10.3390/su13020970
Chicago/Turabian StyleKhalid, Nida, Munkhjargal Gochoo, Ahmad Jalal, and Kibum Kim. 2021. "Modeling Two-Person Segmentation and Locomotion for Stereoscopic Action Identification: A Sustainable Video Surveillance System" Sustainability 13, no. 2: 970. https://doi.org/10.3390/su13020970
APA StyleKhalid, N., Gochoo, M., Jalal, A., & Kim, K. (2021). Modeling Two-Person Segmentation and Locomotion for Stereoscopic Action Identification: A Sustainable Video Surveillance System. Sustainability, 13(2), 970. https://doi.org/10.3390/su13020970