Article

Mapping the Green Product-Space in Mexico: From Capabilities to Green Opportunities

by
Carla Carolina Pérez-Hernández
*,
Blanca Cecilia Salazar-Hernández
,
Jessica Mendoza-Moheno
,
Erika Cruz-Coria
and
Martín Aubert Hernández-Calzada
Institute of Economic Sciences and Management, Universidad Autónoma del Estado de Hidalgo, 42160 Pachuca, Mexico
*
Author to whom correspondence should be addressed.
Sustainability 2021, 13(2), 945; https://doi.org/10.3390/su13020945
Submission received: 10 December 2020 / Revised: 11 January 2021 / Accepted: 16 January 2021 / Published: 18 January 2021
(This article belongs to the Special Issue Economic Complexity and Sustainability)

Abstract

:
The aim of this paper is to examine the current and potential capability to promote the green economy in Mexico, simultaneously detecting new opportunities for diversification and “green” productive sophistication so that Mexican entities can move toward environmentally friendly ecological products. For this, we adopted a novel methodology to measure the productive capabilities of the green economy in Mexico, thereby discovering the green product space at a subnational scale. Economic complexity methods were used to estimate the Green Complexity Index (GCI) and the Green Complexity Potential (GCP) for 32 Mexican regions considering a time series from 2004 to 2018 and a set of data on international trade in ecological products. The main findings are reflected in a grid of the Green Adjacent Possible (GAP) and a heatmap that shows the “grasslands” (current green products by state). The results are likely to influence industrial policy and state innovation agendas. A limitation of this work is that it is based only on data from the formal, industrial, and regulated economy. The originality lies in the fact that there were no previous studies in the context analyzed, and the fecundity of the research reflects the need to expand the study with a focus on green business models.

1. Introduction

Nations and regions around the world are moving toward a green economy. Sustainable economic growth, innovation, caring for the environment, and social inclusion are the main driving forces behind this new economic approach. In Mexico, economic development in recent decades has been guided by the principles of a brown economy. That is, an economy based on neoclassical thought and whose production processes are concentrated in the search for the maximization of benefits and the growth of the gross domestic product.
These economic benefits have deteriorated the natural environment due to the use of fossil fuels in production processes, the overexploitation of natural resources and the increase in the amount of waste derived from production and consumption. In this sense, moving from a brown economy to a green economy represents a paradigm shift that requires a set of gradual, constant and exponential changes within the different areas and sectors of the economy that in the medium and long term will reflect greater efficiency and sustained economic growth. These changes should not compromise access to natural resources and the quality of the environment and should ensure social inclusion by reducing poverty levels and economic inequality as well as unemployment problems [1].
An old route always leads to an old destination. If we want to reach a new destination that is radically different from the old one, we have to build a new path [2]. In this sense, being able to discover the product-green space within a territory could help create a map of all the ways in which current products can be reinvented (diversified and/or sophisticated) toward a green economy, leaving behind a brown economy, which, in the short term, generates an increase in the gross domestic product, but in the long term does not promote the impulse towards Gross Internal Knowledge (Knowledge Intensity, also known as the Gross Internal Knowledge metric or Economic Complexity Index.), necessary to chart a sustainable economy.
Derived from the above, this research was designed to answer the following Research Questions:
(RQ1) Which states in Mexico are likely to have the production capabilities to take advantage of this shift to the green economy?
(RQ2) What about new green opportunities? What happen if state “s” looks to reorient its productive capabilities to become more competitive in green products?
(RQ3) Can we map the green product-space and pinpoint how states might be able to repurpose their existing capabilities for productive purposes in the green economy?
The premise is that Mexican entities might be able to reinforce/repurpose their existing capabilities for productive purposes in the green economy.
To answer these questions, we follow the seminal work of Mealy and Teytelboym, using the measures called the Green Complexity Index (GCI—which aims to estimate an entity’s green production capabilities), the Green Complexity Potential (GCP—which measures each entity’s average relatedness to complex green products that the entity is not yet competitive in) and the Green Adjacent Possible (GAP—which aims to identify the most proximate green diversification opportunities for each entity) [3].
Recently, Romero and Gramkow provide evidence that economic complexity contributes to reduce greenhouse gas emission intensity as well as per capita emissions. They argued that the production of complex goods is associated with lower emission intensity due to the types of technologies used in the production of such goods and their high value-added characteristic [4].
Economic complexity introduces network theory concepts to different social science considerations related to international trade and income inequality [5]. More recently Economic complexity has been linked to sustainability topics. With the bulk of literature established in the last decade, the field of economic complexity is relatively new, but its approach is very useful in order to promote decisions based on data (such decisions can be related to human development, economic development from a social, ecological and economical point of view).
In recent years, complexity theory has attracted increasing interest from economists, and is now believed by many to be a novel and powerful framework of thought capable of challenging the fundamental principles of the mainstream economic canon indirectly with “complexity thinking”. Whilst he stresses that “complexity economics” is still more a research program than a single synthesized theory, he identifies five key dimensions that mark out “complexity economics” from “traditional economics”: The economy as an open, non-linear system; made up of agents with bounded rationality, who learn and adapt; who interact through constantly changing networks; whose micro behaviors and interactions are the source of emergent pattern and order at the macro-level; and who are the source of the constant novelty that imbues the economy with its evolutionary momentum [6].
Therefore, it is considered that sustainability analyzed by methods of economic complexity is a very promising yet relatively unexplored research line. In our case, the exploration of the green product space in Mexico is an approach that can be helpful, because it allows an understanding about the possibilities of green diversification/sophistication at a mesoeconomic level.
Relatively little work has studied the relevance of countries productive structures for their success in the green economy [3]. The research gap is even more large if we focus in a sub-national level of analysis. Then, our study has solved the empirical gap by compiling a dataset of environmental goods state by state with a time series of 15 years; after that, we applied the methods of economic complexity in order to explore the green product-space in Mexico.
The organization of the work is detailed as follows: In the first section, a literature review is shown, then a contextual review is created to show a landscape of our study perimeter. The methodology used is broken down, followed by the analysis of results and interpretations and, finally, the reflections and conclusions of the study.

2. Literature Review

Countries have long been making efforts to transit from a brown economy to a green economy [1,7]. The need to care for the environment is becoming increasingly evident, which makes the production of green products imminent. The green economy seeks sustainability; innovation; generating benefits for economic development, equity and social inclusion; and the protection of the environment, through the redistribution of natural, social and financial capital [1]. A green economy implies a world that improves the quality of life of citizens, saves costs and maintains a clean environment.
The term green economy first appeared in 1989 in a Report from the London Environmental Economics Centre. According to one of its most cited definitions, a green economy results in improving prosperity and social equality while simultaneously reducing the pressure on the environment and ecological damage [8].
The term was reaffirmed by the UN in 2008 through the program on the environment. Today’s ways of life and production require a transformation toward the use of clean and renewable energies that can slow down the currently accelerated climate change. In industrialized countries, green energy has become the touchstone for economic development [9]. In developing countries, the social, economic and environmental costs of not investing in green products on time can be expensive [1]. In Mexico, there have been efforts to move from a brown economy to a green economy since 2013 when the Sector Program for Environment and Natural Resources was enacted; however, progress has been very slow.
The product space (metric of relatedness) is a tool developed by Hidalgo et al. and represents the proximity between products through the P × P matrix, where P is the total of the products that a country exports, while i × j denotes the proximity between products i and j. The product space is the proximity between products commercialized in the global market [10,11].
There are three main approaches to measure the relatedness between products (See Table 1). Each of the approaches has advantages and disadvantages and the utility of them in various historical, geographical, and sectoral contexts needs to be explored further through systematic accumulation of empirical material [12,13,14,15,16].
Hidalgo et al. (the second approach) argue that several dimensions may influence the degree of relatedness between two products: Similarities in the combination of productive factors; the characteristics of the technology used in production, the use of a specific component; the features of the final customers; or the use of specific distribution channels. Due to the large number of factors that may determine relatedness between products, they also use an outcome, or ex post, measure to calculate the degree of proximity between products. They argue that two products will be close to each other if countries tend to have Revealed Comparative Advantage (RCA) in both products [14].
The most industrialized countries are characterized by producing products with a high revealed comparative advantage (RCA) located in the center of the product space, where they are highly connected with many other products. This is why these countries raise their exports faster than other countries. In contrast, developing countries have products with high RCAs located on the periphery of the product space, characterized by limited connections with other products. The likelihood of a country to develop a particular type of product depends on how close that type of product is in the product space. Proximity is a statistical measure of the similarity between goods, it formalizes the idea that similar goods are more likely to be produced in tandem than non-similar goods; therefore, if a country produces (exports) certain products it is more likely to produce (export) other similar goods [16].
The similarity of a product is related to the requirement of capabilities that a product has. If two products require similar capabilities, such as infrastructure, technology or physical goods, it is highly likely that they will be produced in tandem [17]. The proximity of goods i and j is defined as the minimum conditional probabilities of the pair (i and j) of exportable product i—that is, it is competitive in exported products j. Hausmann and Klinger showed that the location of a country in the global product space can indicate where to move to new sectors [18]. The presence of close sectors can be a good proxy for the existence of initial favorable conditions for the development of a corresponding sector [19].
On the other hand, green products are generally associated with reducing pollution and preserving the environment when compared to their conventional counterparts [7]. Green products aim to reduce the environmental impact of manufacturing, use and disposal by design [20]. According to the Commission of the European Communities, green products use fewer resources, have fewer impacts and risks for the environment and prevent the generation of waste at the conception stage [21]. However, the efficiency of green products is not limited to the production phase but extends to the entire product life cycle [22]. Sorting green products is a difficult task.
Huberty and Zachmann analyzed the growth in RCA of green products exported by European countries (solar cells, wind turbines, nuclear power plants and the parts thereof and electric meters), supported by national policy measures [19]. These authors found that the proximity of products was the only variable that influenced the growth of products. The growth in the RCA of green products was higher for countries where the green product had a strong closeness or proximity to other products with an RCA greater than 1.
Subsequently, Hamwey et al. proposed the green product space methodology in green products in Brazil, used to identify which green products are competitive in the world market, calculating the proximity with RCA > 1. As well, Fankhauser et al. investigated the green competitiveness of eight countries in 110 manufactured sectors, through sectoral patenting rates, exports and industry output. One of the problems that countries face is in making national proposals when it is instead optimal to elaborate them at the individual level (state or municipal). The biggest challenge facing policy makers is in selecting which green sectors to promote [7,23].
The research developed by Fraccascia et al., based on the product space complexity tool, showed the proximity between products and captured the similarity of the capabilities required to produce them. In the green context, the closer the green product is to a product with RCA > 1, the more likely the country is to possess the capabilities to produce that green product efficiently. The green products with the greatest potential for the growth of a country are close to products with a high RCA, that is, an RCA greater than one [24].
Dordmond et al. developed the green jobs index to analyze the development in 27 states in Brazil and to demonstrate the difficulty of moving toward a green occupational space. The results showed that a high green jobs index in the previous period had a positive effect on the index in the subsequent period. States with many green jobs had the same behavior in the next period. In this way, the complexity of a state had a positive coefficient and was statistically significant. Economically complex states had a greener occupational space [25].
Mealy and Teytelboyn used 293 green products and 57 renewable energy products and found that the Product Complexity Index (PCI) was an appropriate proxy to measure the technological sophistication of products. They also developed the Green Complexity Index (GCI) that estimates the production capabilities of a country and predicts future increases in the GCI and the number of green products with which a country is competitive. The GCI measures the country’s average relativity to complex green products that are not yet competitive [3].
Green commercialized products have a higher PCI compared with other commercialized products. Mealy and Teytelboyn ranked countries according to their ability to export complex green products. They examined the potential for countries to transition to green product production in the future and found the path to dependence on the accumulation of green capabilities. The authors found that green and renewable energy products required, on average, higher technologically advanced knowhow when compared with typical products. Countries that are focused on exporting oil and petroleum products have a lower Global Complexity Index (GCI) compared to their Economic Complexity Index (ECI); therefore, their production capabilities may be less aligned with green products [3].
To address the increasingly complex problems in society it. is necessary to develop a thinking perspective, i.e., “the ability to see the world as a complex system, in which we understand that ‘you can’t just do one thing’ and that ‘everything is connected to everything else’” [26]. Therefore, this study based on complexity thinking puts emphasis on networks, diversity and feedback mechanisms between micro, meso and macro structures, exploring deeply into the relations between the actions and interactions of heterogeneous elements within complex systems [27]. Where this is clear is the interaction between mesoeconomic findings (green product-spaces at sub national level) are related to micro implications, i.e., “the approach of Supply Chain Management (SCM) that is derived from the fact that there are dependencies between levels in channels from the point of origin to the point of consumption” [28]. Sourcing and SCM research can help lead the change to truly sustainable supply chains [29].
Recognizing opportunities to integrate sustainability in an organization is an important part of management. It is understood that the elements of Sustainable Supply Chain Management (SSCM), no matter the model applied, contribute to the creation of value and success of larger systems, such as a supply chain, ecosystem services, and society. These foundational elements include the following: Green purchasing, waste and water management, energy consumption and emission reduction, green manufacturing, product recovery and reverse logistics. With the growing awareness of environmental protection and dynamic business environments, firms can opt for taking more active strategies to realize the potential opportunities sustainable business practices can provide [30].
The image of a modern supply chain has become inseparably associated with its care for ecological aspects and sustainable development. It can be assumed that the pursuit of sustainable supply chain management results from the needs of the modern world, and efficiency and care for natural resources contribute not only to improving the image, but also to waste reduction, innovation, generating profits and building a competitive advantage [31].
Another future research direction could be linking the product type (maybe derived by the green product-spaces) to SSCM strategies. The reactive strategy may be applicable to functional products/service and suppliers; whereas a proactive strategy may be more applicable to innovative products/service and requires only a small number of suppliers who have the innovative capabilities to collaborate with focal companies [32].

Contextual Review

During the globalization crisis of 2007–2009, various organizations, such as the Organization for Economic Cooperation and Development (OECD), the World Bank and the United Nations Environment Program (UNEP), proposed a transition to the green economy as a way to care for, protect and minimize the use of natural resources of the economies in the world. As a member of the OECD, Mexico recently signed the intention of “promoting and guiding inclusive and facilitating green growth that preserves the natural heritage while generating wealth, competitiveness and employment effectively” in its 2013–2018 National Development Plan (PND) [33]; However, it is since the 1980s that Mexican environmental policy acquired a comprehensive approach that led to the definition—among other things—of a series of actions in terms of energy efficiency and renewable energies, eco-systemic services and agri-food production that are allowing progress toward a green economy.
In developed countries, the green economy is fundamentally focused on the production of clean energies and technologies, on recycling and converting waste into energy and on the construction of energy efficient infrastructure and transport [34]. In Mexico, in addition to an incipient production of renewable energies, the transition toward a green economy also includes products, processes, and services that have high levels of technology but that operate with a reduced environmental impact or improve the use of natural resources, such as practices for the efficient use of water resources, ecosystem services, and sustainable agricultural processes.
Since the beginning of this decade, the production of renewable energy (RE) in the country has benefited from national and international pressures to develop a sustainable economy that guarantees energy assurance and, additionally, by the energy reform implemented in the year 2013 that, through a new model of hydrocarbon exploration and extraction, allows the participation of the private sector in the generation and commercialization not only of hydrocarbons but also of other renewable and non-renewable energies [35].
Although development in terms of energy generation through renewable sources has been slow, Mexico already has an amount of installed capacity for the production. In 2001, the first large-scale photovoltaic plant came into operation; with this, the generation of electrical energy from solar energy increased its installed capacity from 19.5 MW in 2005 to 3364 MW in 2019 with the operation of 42 solar power plants distributed in 14 entities of the country (Nuevo León, Aguascalientes, Baja California, Baja California Sur, Chihuahua, Coahuila, Durango, State of Mexico, Guanajuato, Jalisco, Querétaro, San Luis Potosí, Sonora and Yucatán), with the state of Baja California as the largest generator of this type of energy [36,37].
Electricity generation with wind energy had one of the most significant growths, with 32 plants at the end of 2015 and Oaxaca and Baja California as the states that maintained the highest participation. Similarly, in terms of geothermal energy, there has been growth that has not been observed for more than 30 years. The country has eight power plants distributed in the northern and southern states of Baja California, Nayarit and Michoacán that, together, generate 1.84% of the generation of electricity in the country.
Finally, the production of hydraulic energy is the most exploited resource with 97 hydroelectric plants distributed throughout the country in the central-south zone (Guerrero, Veracruz, Chiapas and Oaxaca) and the western zone (Nayarit, Jalisco, Colima and Michoacán), which account for just over half of the hydroelectric plants, although the northern states (Sonora, Sinaloa and San Luis Potosí) also maintain a significant participation with 17 plants [36].
The green economy in the country is not only based on the generation of renewable energies, currently the country is among one of the main organic producer-exporters in America and the first in organic coffee production [38]. Through the design of diversified agro-systems and the use of low-input technologies, the area devoted to organic production went from 501,364 hectares to 1,141,651 hectares in 2020 [39]. The states of Veracruz, Chiapas and Oaxaca are the leaders in organic production, followed by Michoacán, Querétaro and Guerrero. The products with the largest organic agricultural area are coffee, tropical and semi-tropical fruits, vegetables, cocoa beans and citrus fruits [40].
Since developed countries can meet their commitments to reduce their levels of greenhouse gases (mainly CO2) by purchasing emission reduction units from another country or region, Mexico has also entered the market for ecosystem services since the year 2003, in particular through carbon capture and hydraulic performance [41]. In the country, both green productivity schemes are being achieved through the proper management of various ecosystems (mainly forests and jungles) and, in many cases, through the creation of protected natural areas (ANP). Research estimated that the capture potential water and carbon is concentrated in the central-south of the country (Michoacán, Guerrero, Veracruz, Chiapas and Querétaro) and in the north in states, such as Durango, Sinaloa, Coahuila and Baja California Norte and Sur [42]. The market for environmental services is incipient but with high potential for countries like Mexico to begin to transition from an economy highly dependent on the production and consumption of fossil fuels to an economy based, among other things, on natural resource efficiency.
There is evidence of successful cases of innovative regional projects that are having a positive impact on the development of the national green economy. We can mention the development of solar fields in Sonora and Jalisco, the case of Monterrey, Nuevo León and the southeastern region of Jalisco with Michoacán and its innovative strategy to manage solid urban waste, the generation of wind energy in Oaxaca and Zacatecas, as well as the application of innovative public policies in Mexico City to mitigate climate change and others. In each of these cases, the culture of regional innovation plays a determining role in achieving success [1].
Although there are a large number of shortcomings and challenges that limit the strengthening of the green economy and production in the country, in addition to the aforementioned potential, Mexico is beginning to take action in other sectors traditionally considered as “brown”, such as such as tourism, transportation and manufacturing, based on the adoption of low-carbon and more efficient technologies and processes.

3. Materials and Methods

We adapted the “CLEG” (Combined List of Environmental Goods) developed by OECD [43], as a green products adaptation that we used to construct our list to provide us the advantage of being able to identify different categories: REP = renewable energy plant; CRE = cleaner or more resource efficient technologies and products; SWM = management of solid and hazardous waste and recycling systems; and WAT = waste water management and potable water treatment and others (APC = air pollution control; EPP = environmentally preferable products based on end use or disposal characteristics; HEM = heat and energy management; MON = environmental monitoring, analysis and assessment equipment; NRP = natural resources protection; NVA = noise and vibration abatement; and SWR = clean up or remediation of soil and water [43]). We used RAMON (Reference and Management of Nomenclatures) to identify the green products of CLEG within the Harmonized System for the designation and codification of goods [44].
After reviewing the 257 products proposed within the CLEG, we finalized a list of 106 green products. The reduction in the number of products was mainly because the export basket in Mexico only had 106 of the 257 products in the CLEG list; however, all the categories of green products were present on our list.
Our data compiled the exports at the sub-national level with a 2004–2014 time series, extracted from DATOS.GOB [45]; however, to update the series to the most recent year possible, we compiled the international sales data provided in DATAMEXICO [46] with a time series from 2015 to 2018. In this way, our study integrated data from 15 years related with international trade of the 32 states of the Mexican Republic with the list of 106 green products for each year considering the 11 different categories of ecological products.

3.1. Using Methods of Economic Complexity

The Revealed Comparative Advantage (RCA) is a key indicator of economic complexity [17], it could be calculated at sub national level [12]. RCA reflects whether an entity has comparative advantages in the production of a good. Then, the RCA of a state (s) in the product (p) is denoted as follows:
R C A s , p = X s . p p n X s , p s p n X s p s p n X s p
where X s . p is the total exports of state s, in product p, and p n X s , p   are the total exports of state s. s p n X s p represents the total exports in product p throughout the country (Mexico); similarly, s p n X s p is the total exports throughout the country (Mexico). If this ratio is greater than 1, the location has a revealed comparative advantage in that product. The RCA is also used to define the binary matrix (It is proposed to use VCR ≥ 1 as threshold; This implies that the country or entity is specialized in the economic activity or product in question [17]) Ms,p which is equal to 1 if place (s) has a RCA ≥ 1 and zero in other cases. This is:
M s , p = 1   i f   R C A s , p     1 O t h e r w i s e ,   M s , p = 0   i f   R C A s , p   <   1
According to Hidalgo and Hausmann, the matrix M c , p allows defining the level of ubiquity and diversity of the products [17] and can also be represented at a subnational scale as M s , p . States are represented by (s), while economic activities are denoted by (p). Algebraically:
d s = k s , 0 =   p = 1 n M s ,   p
u p = k p , 0 =   s = 1 32 M s ,   p
Then, the ECI is defined as the eigenvector associated with the second largest eigenvalue of the matrix:
M ˜ = D 1 S ,
where D is the diagonal matrix formed from the diversity vector, and S is a matrix whose rows and columns correspond to states and whose entries are given by:
s s s = p M s p M s p u P
To answer, “Which states have the most complex green production capabilities?”, we used the formula of Green Complexity Index (GCI) developed by Mealy and Teytelboym, which is an increasing function of both the number and complexity of green products that a state is able to export competitively [3]. Specifically, the GCI of state s is given by:
G C I s = g p g P C I g ˜
where p g is a binary vector in which a 1 corresponds to a Mexican entity having RCA > 1 in green product g and 0 otherwise, and the Product Complexity Index ( P C I g ˜ is normalized to take a value between 0 and 1.) is given by P C I g ˜ .
Then, the proximity (denoted by i j ) is the similarity between economic activities (products) [11,47]. In addition, it also can be calculated at subnational level [12].
i j = min ( ( R C A s i   > 1 | ( R C A s j > 1 ) ,   ( ( R C A s j   > 1 | ( R C A s i > 1 )
where ( ( R C A s i   > 1 | ( R C A s j > 1 ) is the conditional probability that an entity “s” is competitive in product “i”, given that it is competitive in product j. We take the minimum to ensure that i j =   j i   [16].
On the other hand, the density (denoted by ω j s ) is estimated as the sum of the proximities of the products in which a locality has comparative advantage as a proportion of the sum of the proximities between all the products, where p i is a vector of i products for which state s has RCA > 1 [11,47,48].
Density measures the distance between a product and a state’s existing productive structure. This indicator is defined as the weighted relatedness of four-digit product i in state s [12].
ω j s = Σ i p i i j Σ i i j
Finally, we used a measure called the Green Complexity Potential (GCP) developed by Mealy and Teytelboym. This measure operates on green products that states are presently not competitive in and, as the name suggests, aims to estimate how much “potential” states have to diversify into green, technologically sophisticated products in the future [3]. The GCP for state s is given by:
G C P S = 1 | 1 p g | ( 1 p g )   ω j s   P C I g ˜  
where 1 p g is the vector of green products that an entity currently does not have RCA > 1 in, ω j s   is the proximity of product g to state s, and P C I g ˜ is the PCI of product g, normalized to take a value between 0 and 1.

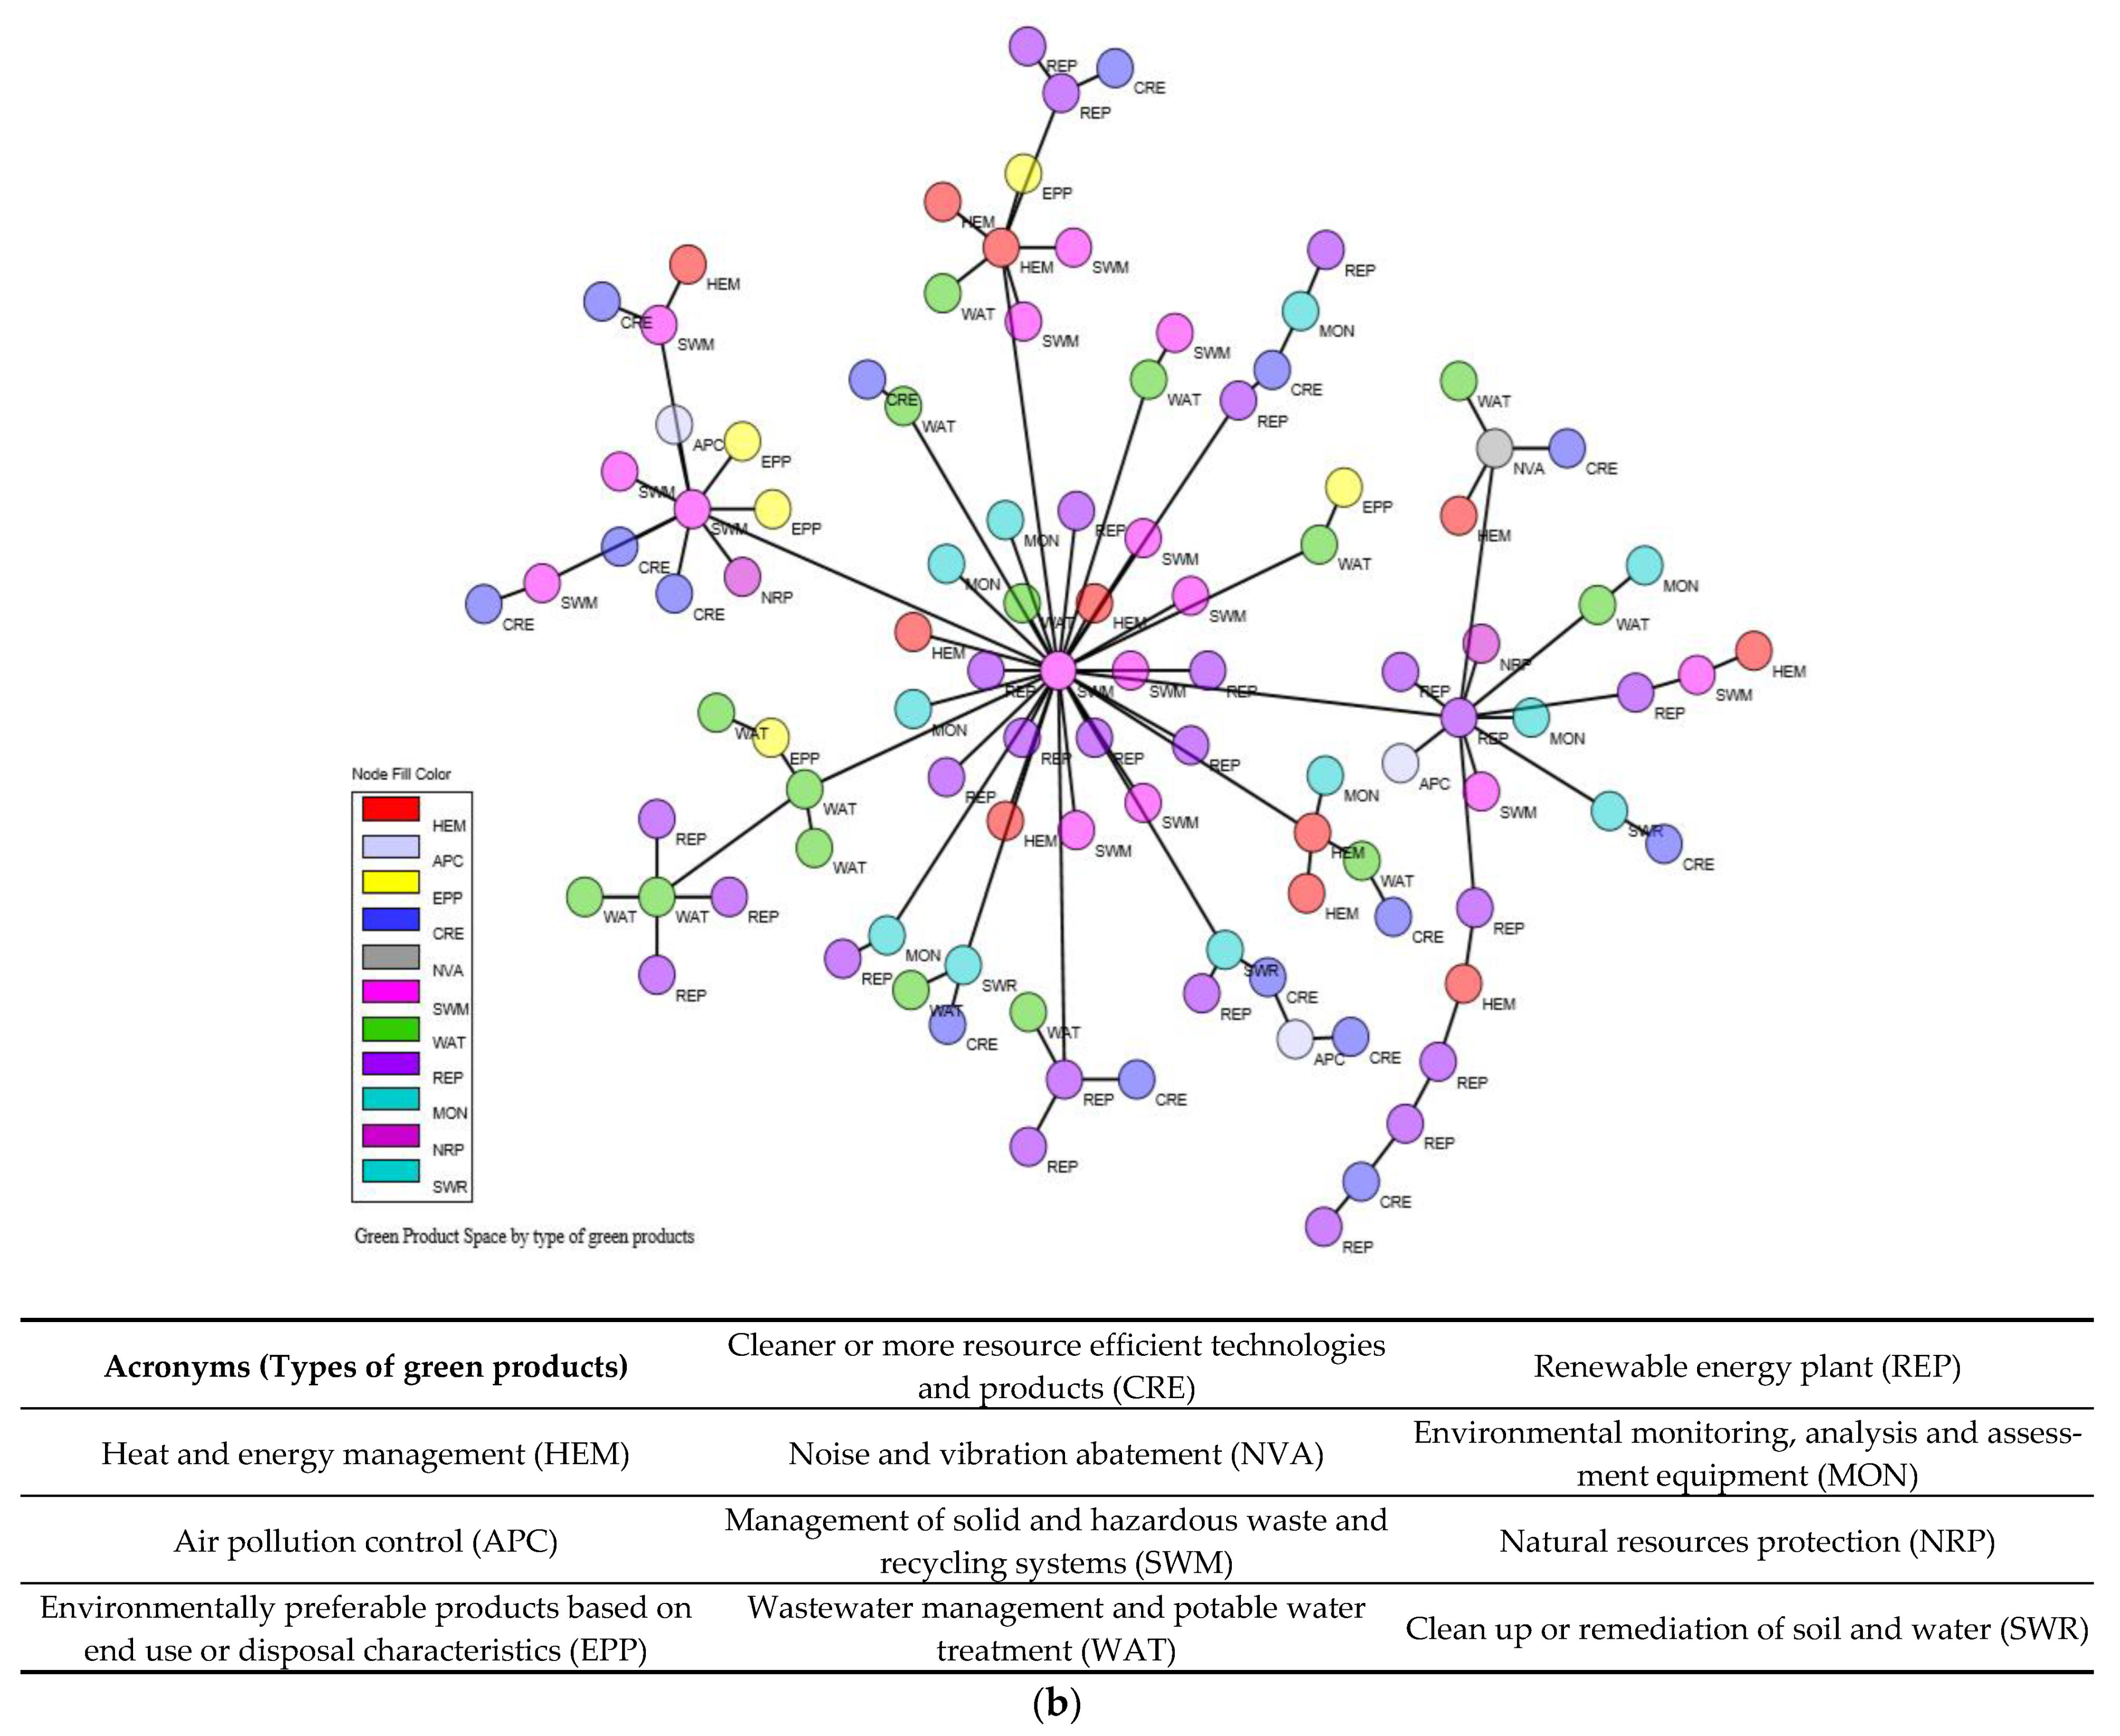
3.2. Visualizing the Green Product Space

To ensure the visualization of the product space is connected, we calculated the maximum spanning tree (MST) of the proximity matrix. The MST is the set of links that connects all the nodes in the network using a minimum number of connections and the maximum possible sum of proximities. We calculated the MST using Kruskal’s algorithm. The algorithm sorts the values of the proximity matrix in descending order and then includes links in the MST, if and only if, they connect an isolated product [11].
Therefore, the Green Product Space shows the relatedness in the capabilities underpinning green products thorough of a network where green products are linked to other green products if they have a high probability of being co-exported. We used a Force-Directed layout algorithm to visualize the green product space in Mexico with our subset of data that was adapted from the CLEG list of products.

4. Results

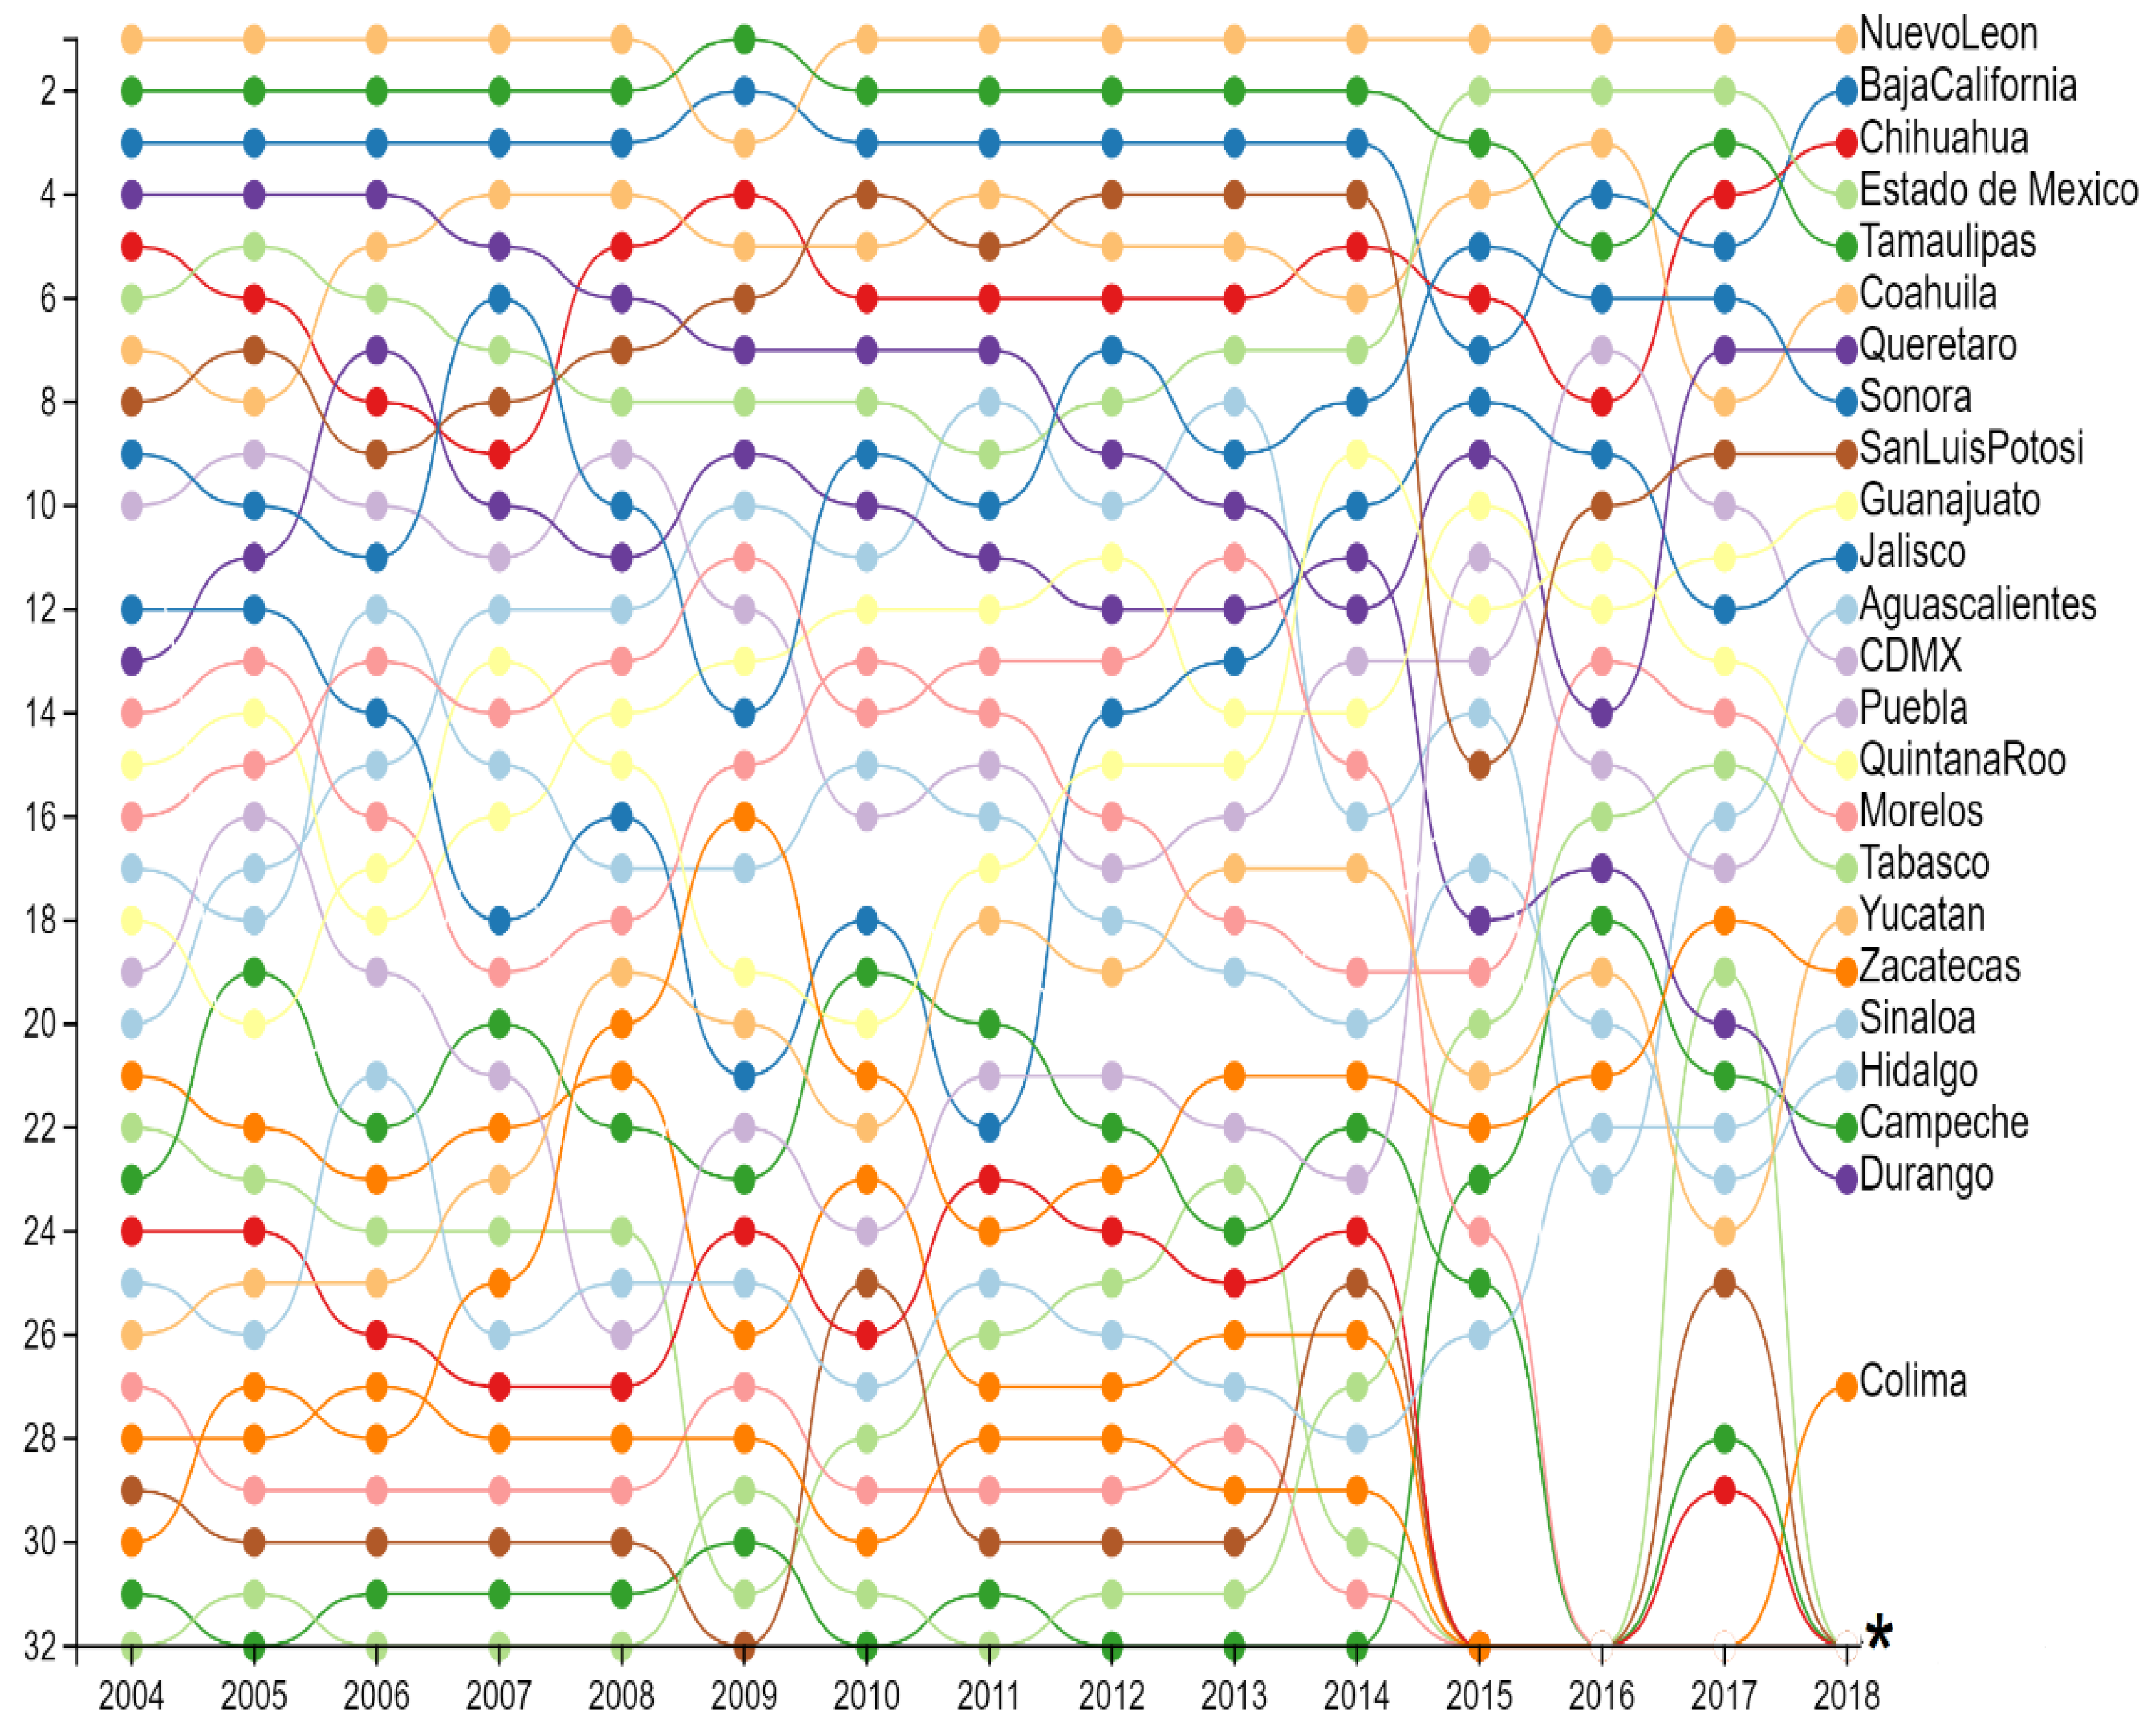
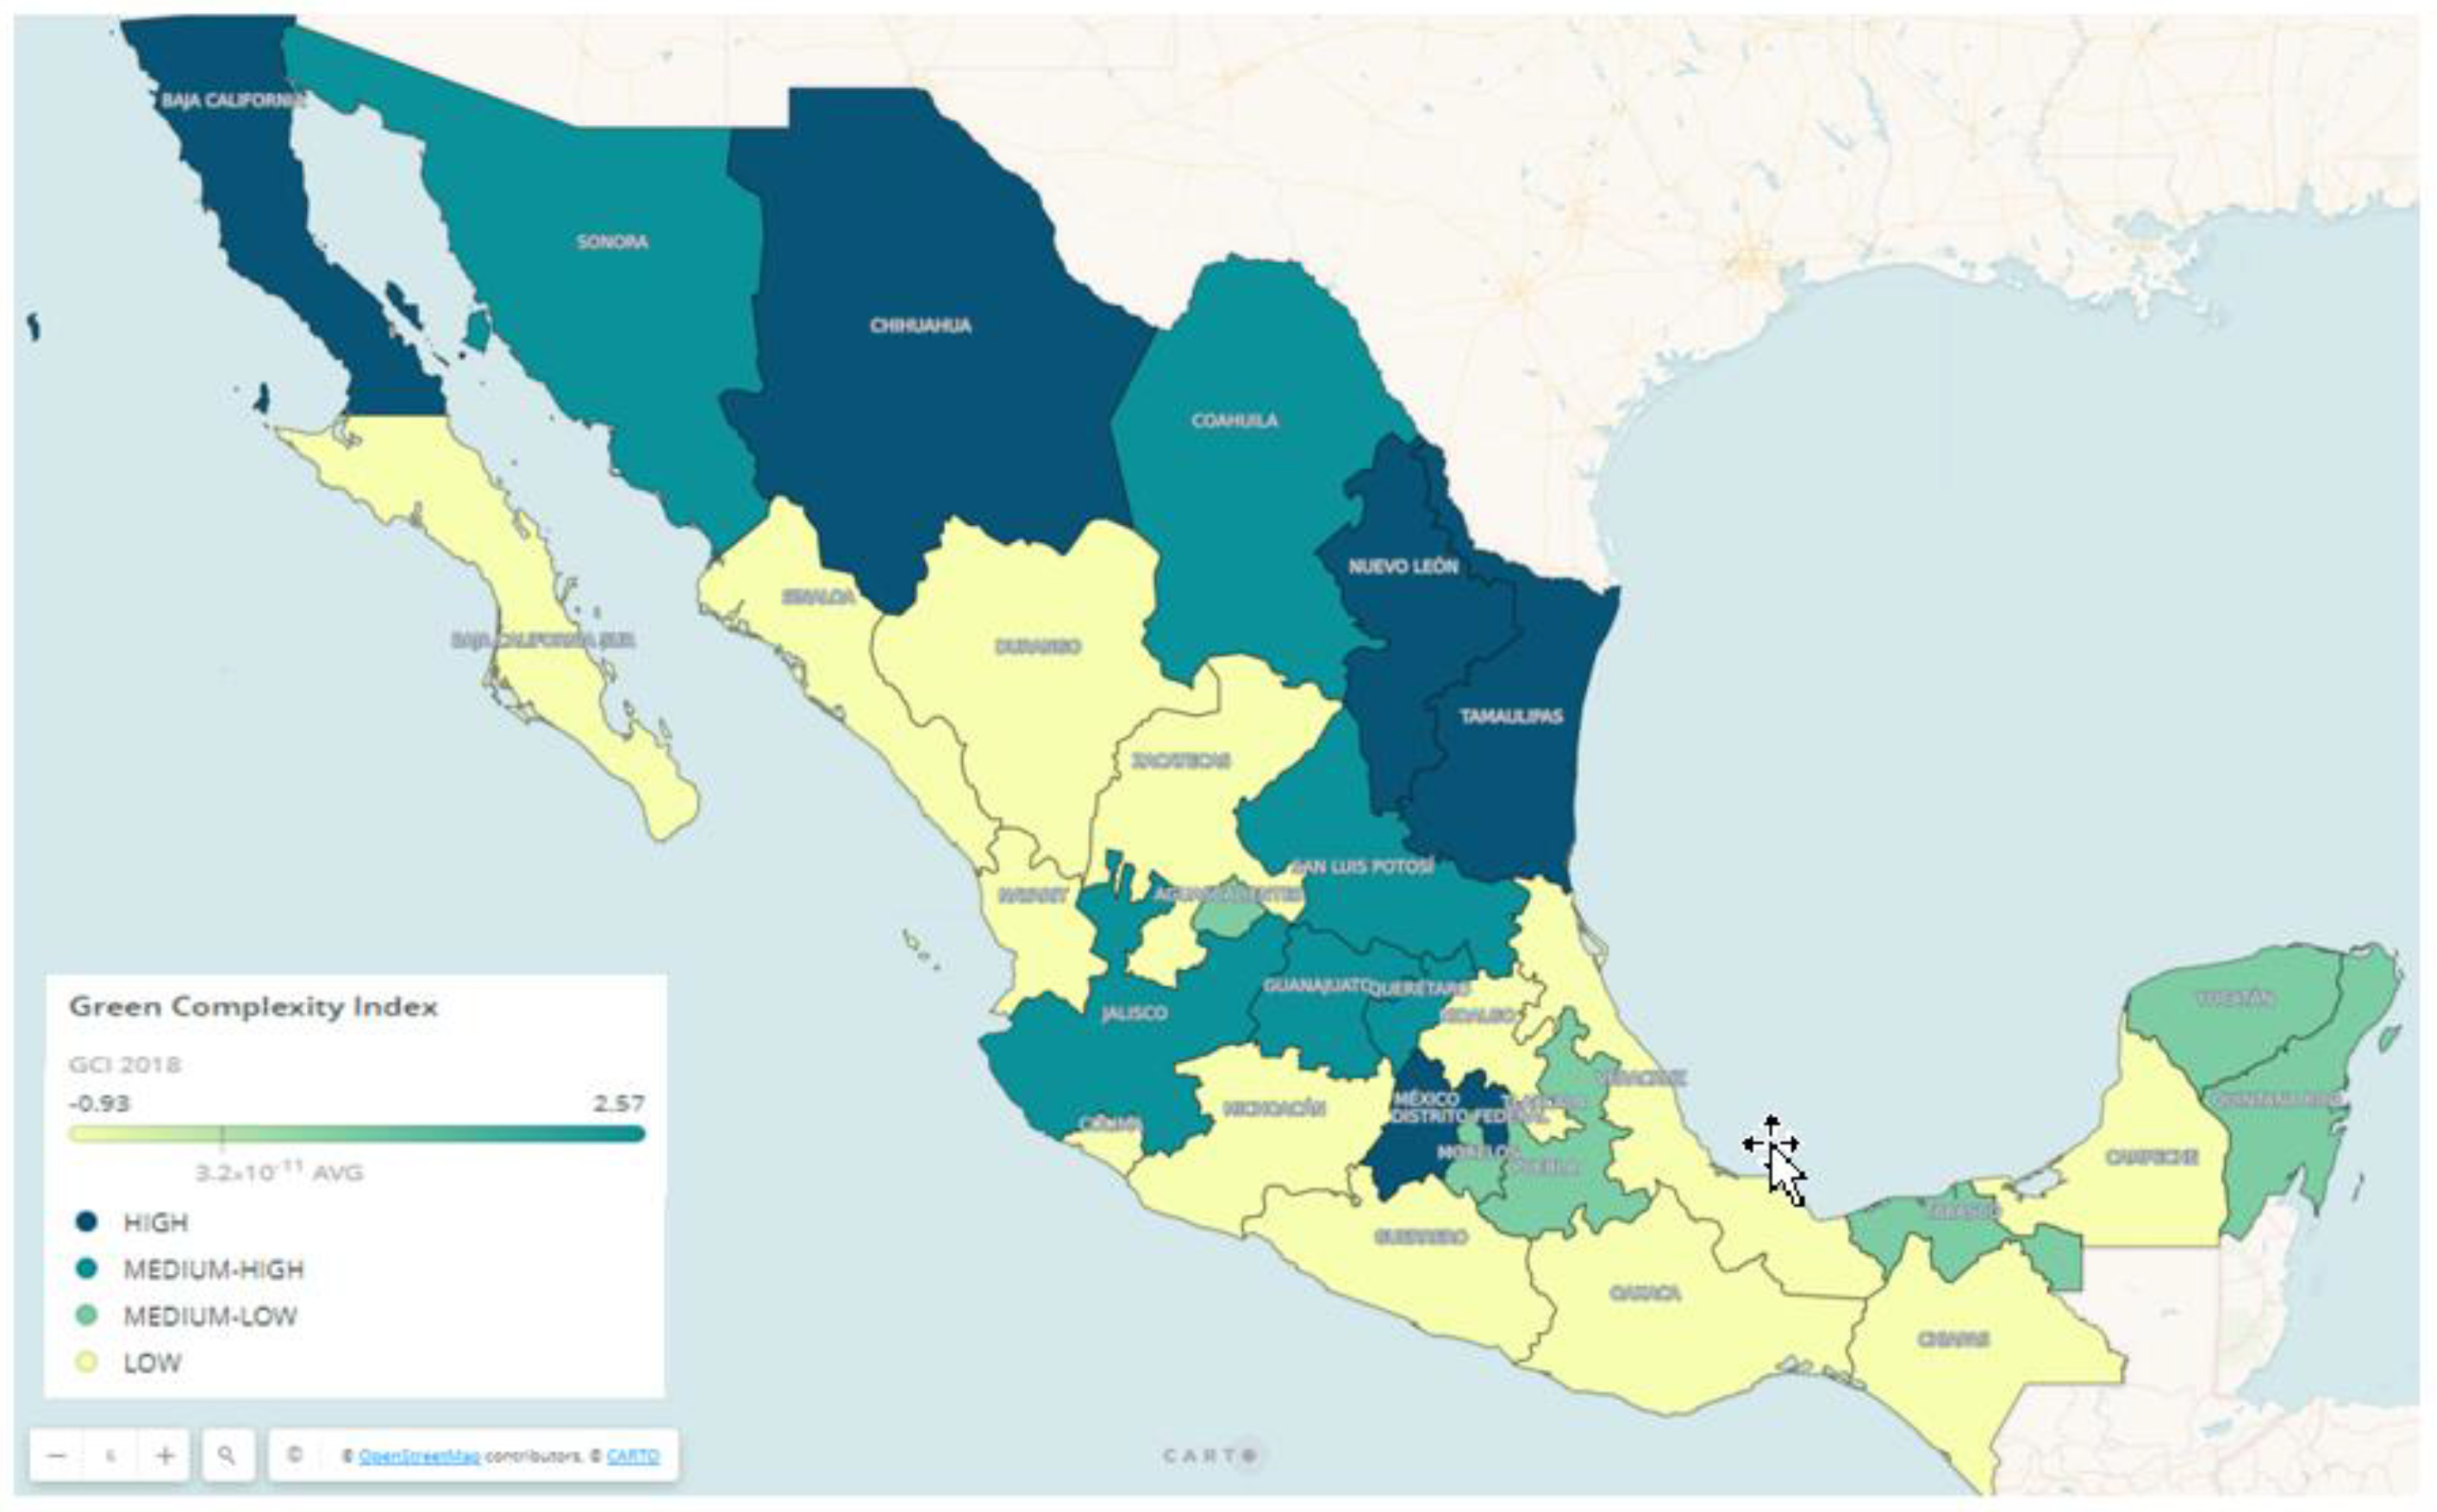
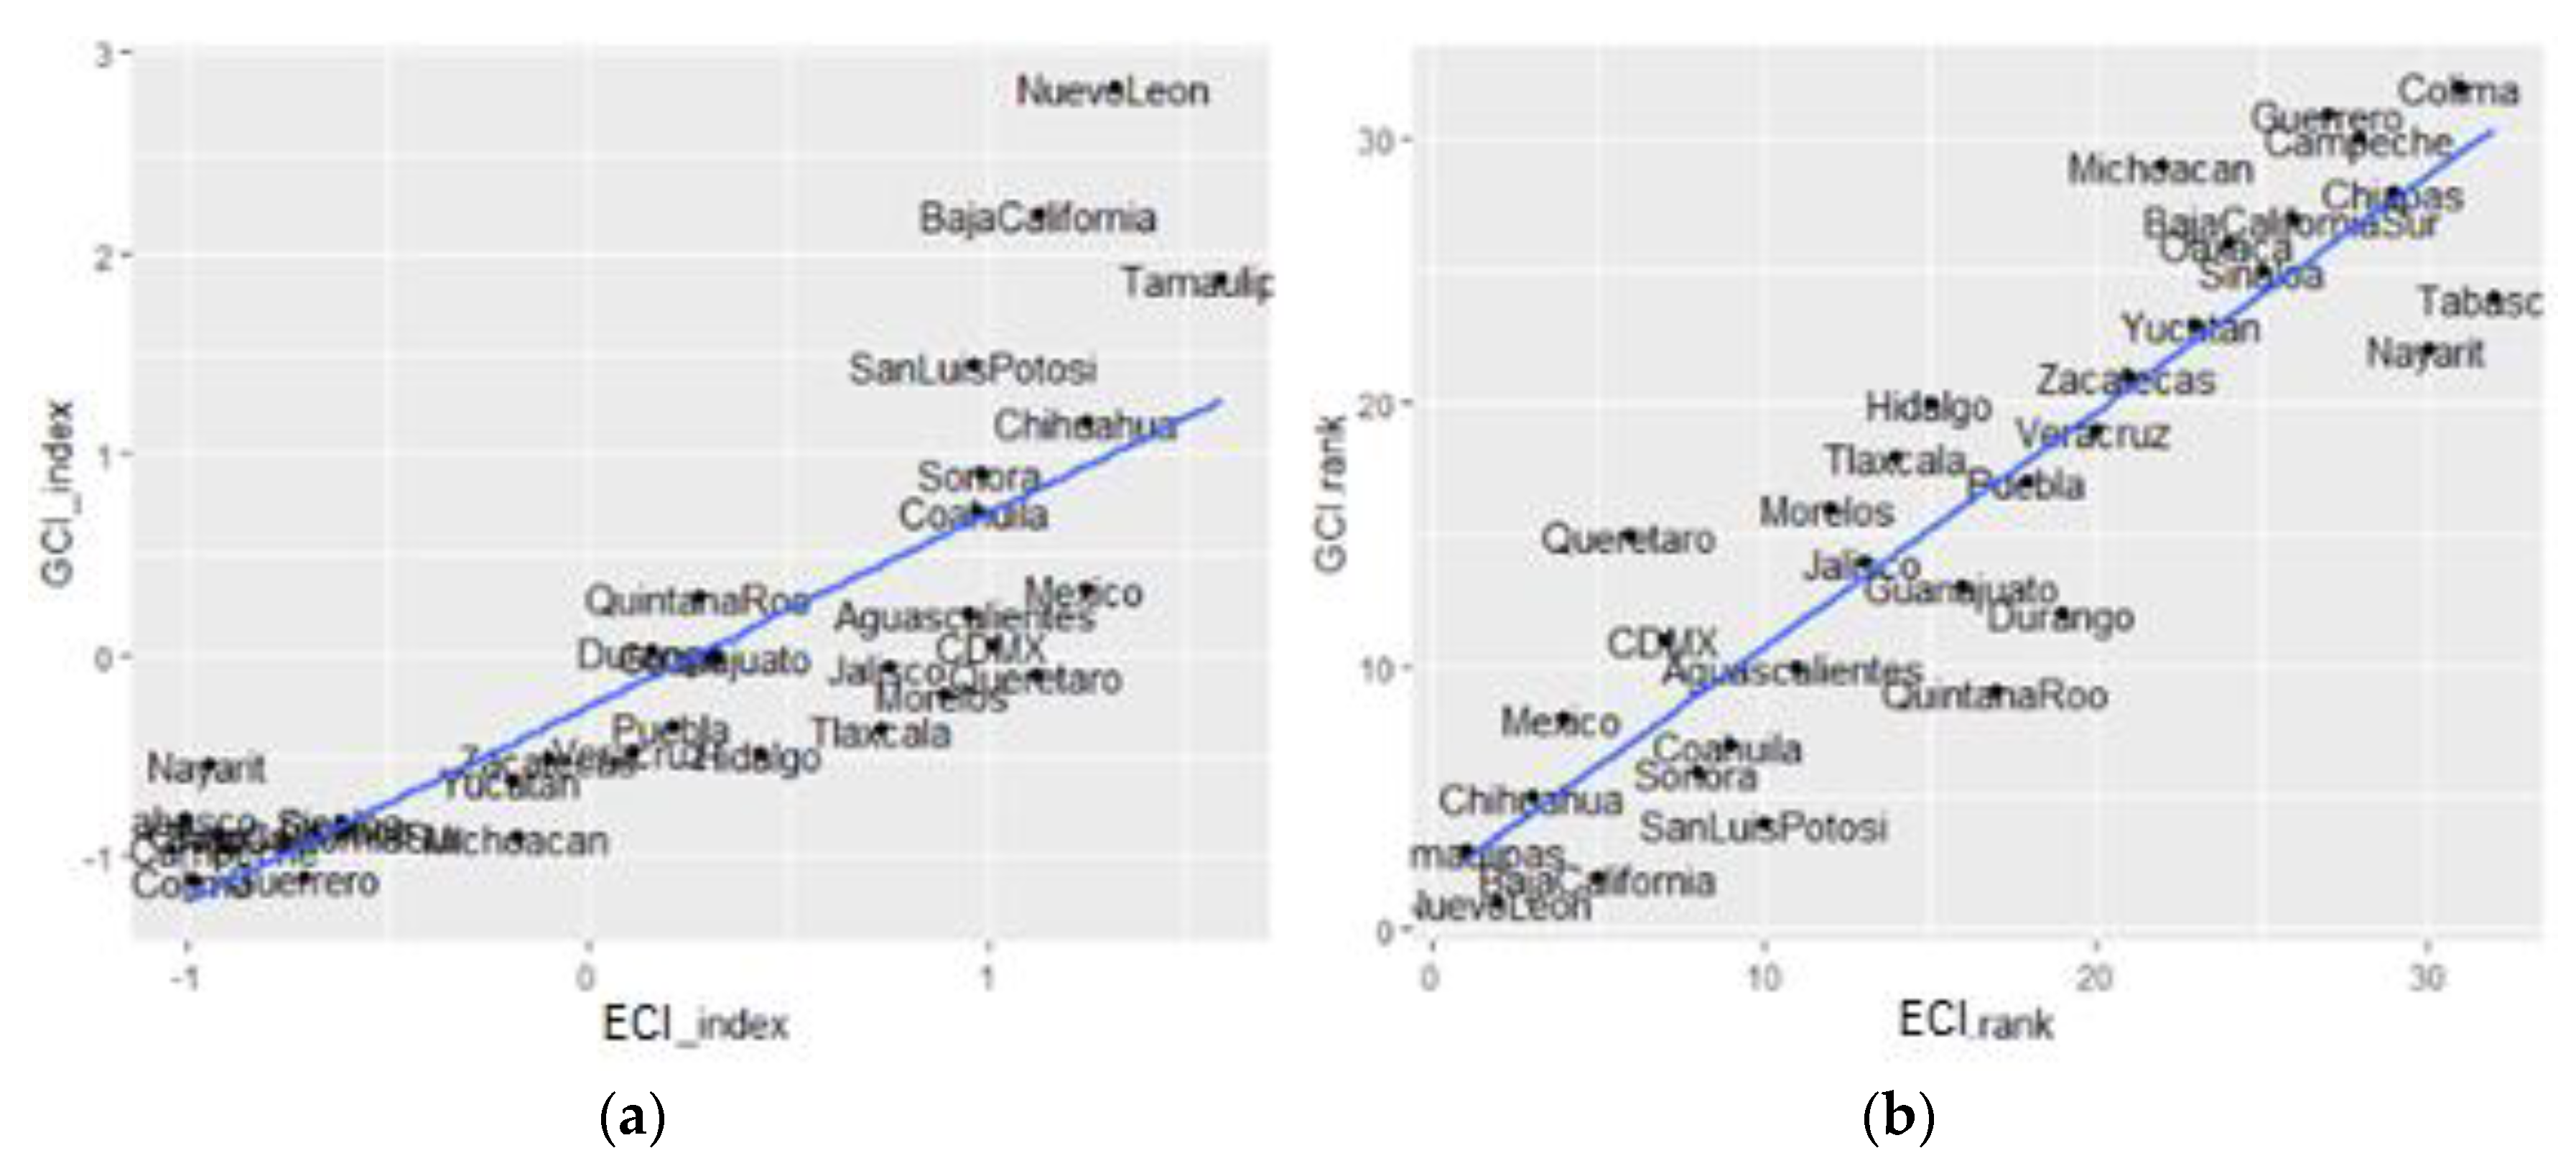
4.1. Green Complexity Index at the Subnational Level across Time

Which states have “green” production capabilities? In Figure 1, we can see the evolution of the GCI ranks across states over the period 2004–2018. The GCI reflects the existence of factual capabilities of an entity to manufacture green products. In 2018, Nuevo León held the top rank, followed by Baja California, Chihuahua, Estado de México and Tamaulipas. The bottom ranks included states such as Baja California Sur, Chiapas, Colima, Guerrero, Nayarit, Oaxaca and Tlaxcala. Looking at how the ranks have changed over the 15-year period, Nuevo León impressively maintained its top position throughout. Some states, such as Jalisco and Zacatecas, made significant gains in their green production capabilities, while other states, such as Durango, saw a substantial decline in their GCI rankings.
As we mentioned in the methodological section, from 2015 to 2018, data of international sales were used, and this temporary addition has the disadvantage of a lack data in Veracruz. In addition, the international sales (the value of International Sales is published under the Law of the National System of Statistical and Geographical Information and the Federal Law of Protection of Personal Data) represent a concept different from Exports by State, whose publication is from the National Institute of Statistics and Geography (INEGI). This may explain why the last states within the ranking in 2014 fell sharply in subsequent years. However, it is considered pertinent to consider the entire 2004–2018 time series given that international sales are an adequate proxy to explain the factual and potential capacities of the development of green products at the subnational level.
Geographically, the north of the country had high levels of GCI, while, in the south of the country, low levels of GCI prevailed, and the central region had some states with high and medium-high intensity of GCI surrounded by entities with low GCI levels.
As shown in Figure 2, the GCI had a frequency distribution skewed to the right, which implies that there were few entities with high levels of GCI in the Mexican Republic. As a consequence, the head and tail maps are ideal for data with heavy tail distributions (as in this case GCI), such as exponential decay or lognormal curves.
Classification was performed by dividing the values into large (head) and small (tail) around the arithmetic mean; the division procedure was repeated continuously until the specified number of containers was reached or until only one value remained. This method, more than others, helps to reveal the underlying scale pattern of values much smaller than the large ones; therefore, just the “green intense” states are the heads (Baja California, Chihuahua, Nuevo León, Tamaulipas, Estado de México and Mexico City), and the others are the tails.

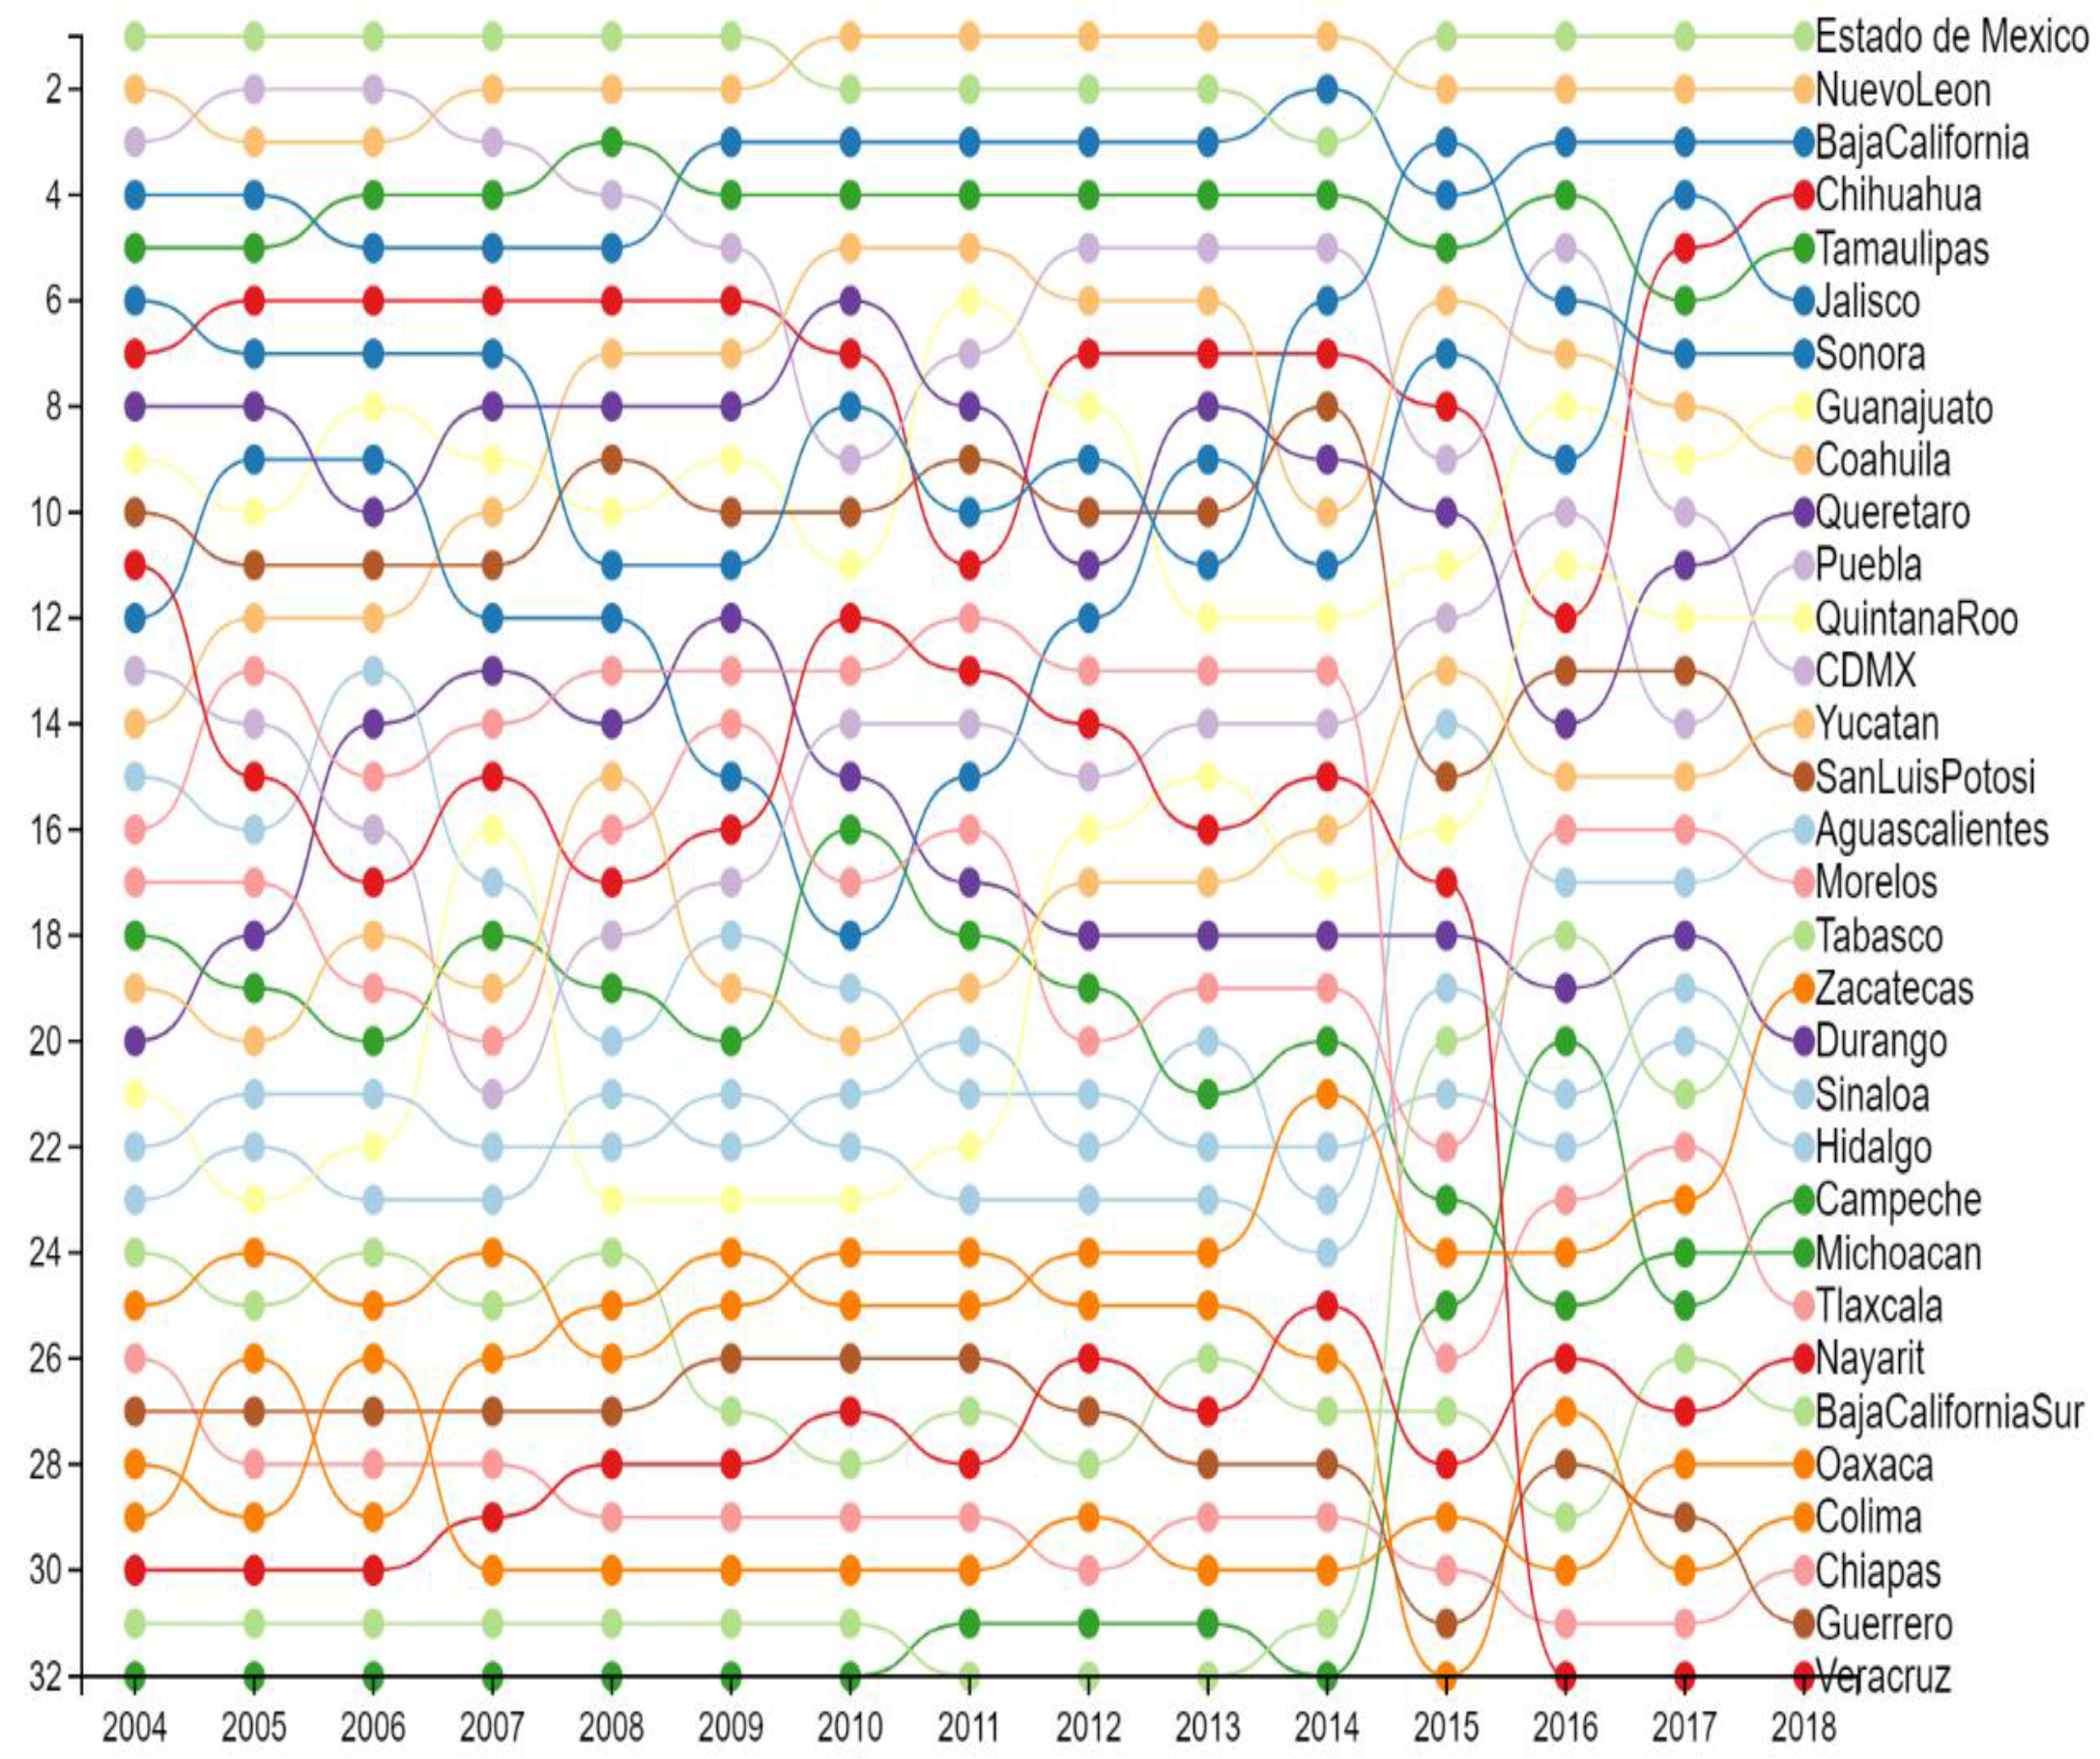
4.2. Green Complexity Potential at the Subnational Level across Time

The Green Complexity Potential (GCP) measures each state’s average relatedness to green products that it is currently not competitive in. Hence, the GCP summarizes each state’s Green Adjacent Possible (GAP) into a single number and allows us to compare entities in terms of their overall potential to diversify into green, technologically sophisticated products. Figure 3 shows the states that are consistent with a high degree of GCP: Estado de México, Nuevo León, Baja California and Tamaulipas, while Chihuahua, Coahuila and Jalisco have improved their position within the GCP in the top 10.
As expected, states with high levels of GCI also expressed high levels of GCP and vice versa. GCI’s historical indicators count when evaluating the generation of green potential, which implies that the evolution of labor markets toward green activities and technological trajectories are relevant to position the potential of entities toward green products with higher RCA or equal to 1, even though fluctuating increases and decreases were perceived in the time of the GCP. The abrupt increases in the GCP, such as the case of Tabasco and Campeche, were mainly due to the data that, as of 2014, are used by international sales records instead of net exports.
The case of Jalisco is striking. Despite not being in the top 10 of GCI, Jalisco showed significant potential to develop green products, as it was in the fifth position of the GCP ranking. The same happened with the state of Puebla, which revealed greater potential capacities over the current capacities. Guanajuato, Sonora and the State of Mexico improved their potential positioning compared to their GCI ranking within the top 10.

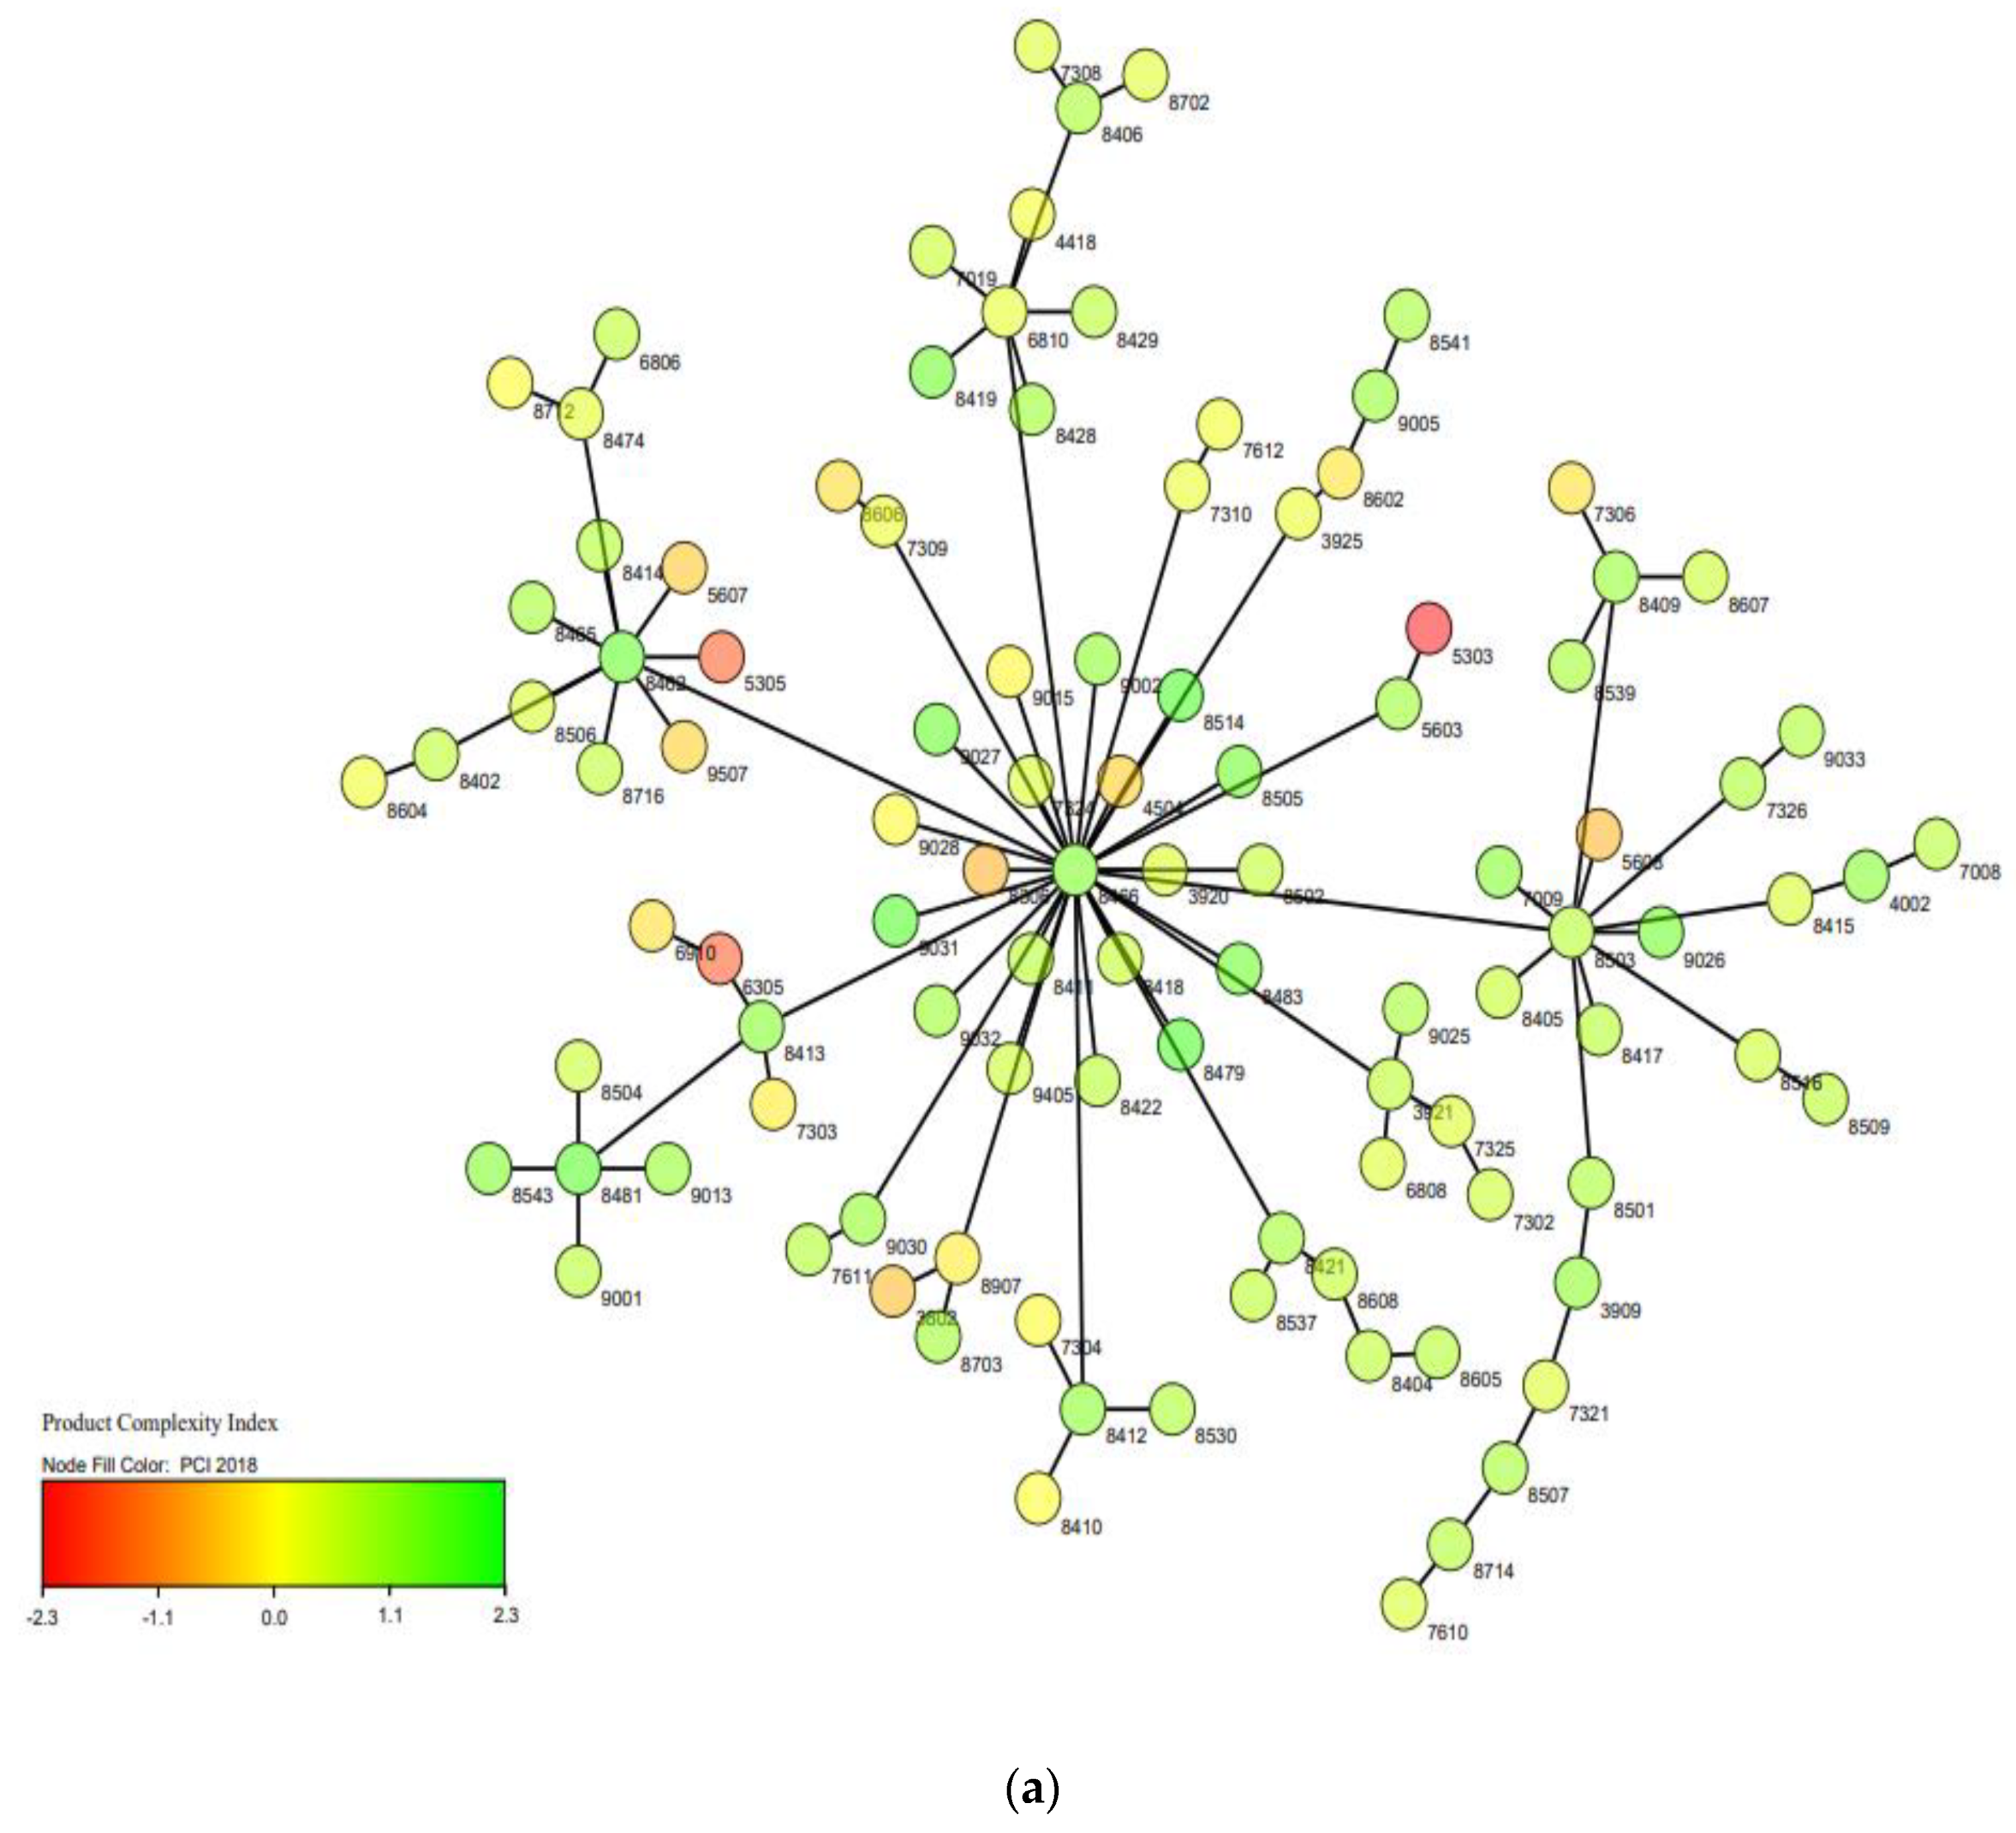
4.3. The Green Product Space in Mexico

Greening the economy implies having more complex products. As shown in Figure 4, the green product space in Mexico is primarily made up of products with a positive and high value in the Product Complexity Index. The latter is considered as an appropriate proxy to measure the technological sophistication of products. The product space in Mexico is primarily made up of products derived from the category “Renewable Energy Plant” (REP), followed by green products classified as: CRE = cleaner or more resource efficient technologies and products; SWM = management of solid and hazardous waste and recycling systems; and WAT = wastewater management and potable water treatment.
Similar to previous studies, regarding the product space for the entire set of traded products, we found that green products with lower PCI tended to be located in the periphery of the green product space, while products with higher PCI were located in the core [3,16]. We also observed that green products derived from the category of “Environmentally preferable products based on end use or disposal characteristics” (EPP), were located mainly in the periphery, which denotes low levels of PCI. However, these products, despite being a minority, are important because they are connected with other products of greater PCI.
The products with the lowest PCI included jute and other textile bast fibers, coconut, abaca (Manila hemp or Musa textilis Nee), sacks for the packing of goods, activated carbon, twine, cordage, ropes and cables covered or sheathed with rubber or plastics, knotted netting of twine, fishing rods and bicycles and other cycles (including delivery tricycles), not motorized.
The green product space also provides a new way to visualize each state’s competitive green exports. We show a selection of different states (see Figure 5). Holding the underlying network fixed, we colored (in green) the products that had R C A P g   1 . While the most striking aspect of the Nuevo León exports is the sheer abundance of competitive green products, the majority of these were related to renewable energy plants (13 products that had a mean of PCI = 0.7297), the management of solid and hazardous waste and recycling systems (eight products), wastewater management and potable water treatment (seven products), heat and energy management (five products), environmentally preferable products based on the end use or disposal characteristics (two products), as well as noise and vibration abatement, air pollution control, clean up or remediation of soil and water, cleaner or more resource efficient technologies and products (one product for each category).
Jalisco´s green products space was integrated by wastewater management and potable water treatment (six products with a mean PCI = 0.501027), renewable energy plant (four products), environmentally preferable products based on end use or disposal characteristics (three products), as well as environmental monitoring, analysis and assessment equipment and heat and energy management and cleaner or more resource efficient technologies and products (with one product for each category). Competitive green product spaces for a selection of states are shown in Figure 5.
In Figure 6, we demonstrate a heatmap of green products in Mexico using 31 states and 106 green products by category. In the matrix, squares are colored green if i f   R C A s , P g     1 . We called this metaphorically “grasslands” (we use this metaphor because a meadow refers to a set of meadows, also known as grasslands “green”; in that sense, our meadows reveal existing green products with an RCA). This visualization is useful to realize that even the states with a high level of GCI have opportunities to increase their sophistication and diversification of green products. There were states than did not have green quadrants, which indicates that it is necessary to reinforce the importance of the green economy to achieve sustainable development in those regions.
In Figure 7, we used the data of exports to compare the GCI vs. ECI (index and ranking), and we noticed a strong positive correlation between states’ GCP and GCI, which, according to Mealy and Teytelboyn, suggests “a high degree of path dependence of the accumulation of green production capabilities” [3]. This suggests the idea that greening the economy requires increasing complexity.
In Figure 8, we illustrate the Green Adjacent Possible (GAP) for all the Mexican states. In each panel, dots represent green products that states do not currently export competitively. The x-axis plots the density value for each green product, which estimates how related that product is to the country’s current capabilities. The y-axis measures each product’s PCI. As we would expect, Baja California Sur, Campeche, Chiapas, Colima, Guerrero and Oaxaca were much less proximate to the set of green products as seen in the dots (green products) that are aligned to the y-axis. This indicates that a lower density shows a greater distance to achieve green products.
Therefore, according to the principle of relatedness, the probability that those states enter with their own-factual and current capacities into a green economic activity (green products) is low because there is no presence of related activities with advanced technological capabilities. Oaxaca is less proximate to green products with higher PCI because it has less advanced technological capabilities.
However, Oaxaca could potentially build on its agricultural base to diversify into green products made from vegetable materials, such as jute and other textile bast fibers (excluding flax, true hemp and ramie), raw or processed but not spun; the tow and waste of these fibers (including yarn waste and garneted stock); coconut, abaca (Manila hemp or Musa textilis Nee), ramie and other vegetable textile fibers, not elsewhere specified or included, raw or processed but not spun; the tow and waste of these fibers (including yarn waste and garneted stock); knotted netting of twine, cordage or rope; fishing nets and other nets of textile materials. In contrast, the states that show greater density and greater proximity (less distance to green products) were mainly Baja California, Mexico City, Chihuahua, Coahuila, Estado de México, Guanajuato, Jalisco, Nuevo León, Querétaro, Puebla and Sonora y Tamaulipas.
Baja California, for example, showed less distance to high-PCI green products, such as optical fibers and optical fiber bundles; optical fiber cables other than those of heading; sheets and plates of polarizing material; lenses (including contact lenses), prisms, mirrors and other optical elements and agglomerated cork (with or without a binding substance) and articles of agglomerated cork, which are products that belong to heat and energy management and renewable energy plants (focuses on low-carbon technologies that are key for addressing climate change).
Sonora showed less distance to high-PCI green product, such as binoculars, monoculars, other optical telescopes and the mountings thereof; other astronomical instruments and mountings thereof, but not including instruments for radio-astronomy; parts and accessories thereof. This green product belongs to the category of environmental monitoring, analysis and assessment equipment.
When we ordered the densities from higher to lower levels according to each entity, we identified the top five green products with greater proximity and potential to be developed in the future for each region (Green Adjacent Possible). We plotted the results in a Sankey diagram (Figure 9) in which some products (derived from the top five) classified as HEM (heat and energy management with the PCI MEAN = 0.539, which indicates complex green products) are adjacent possibilities of regions, such as Baja California, Chihuahua, Coahuila, México state, Jalisco, Nuevo León, Querétaro, Aguascalientes, Mexico City, Durango, Morelos, Puebla, San Luis Potosí, Tabasco, Yucatán and Zacatecas.
Products classified as EPP (environmentally preferable products based on the end use or disposal characteristics with a PCI MEAN = −1.237, which indicates green products with low complexity) are adjacent possibilities of regions, such as Chiapas, Colima, Guerrero, Hidalgo, Michoacán, Nayarit and Oaxaca. Regions with greater technological capabilities have an adjacent possible future toward more sophisticated and complex green products, while regions lagging behind in economic complexity, green complexity and potential green complexity showed limited possibilities of diversification into green products from their current vocations.
Some entities have the potential to jump into more sophisticated products, such as environmental monitoring, analysis and assessment equipment (MON with a PCI MEAN = 1.142) or renewable energy plants (REP with a PCI MEAN = 0.7297) with a higher density than others, which implies that they can make that leap with greater feasibility.
In Appendix A Table A1 are the descriptive statistics of the types of green products, while in Appendix A Table A2 are the rankings of green products by density (the first 30 green products with higher density), related to the region where these products can flourish. All our data are available upon request.

5. Discussion

To start the discussion, it is important to question: What is a green product? Various institutions have proposed their own classifications of environmental goods [49,50]. There does not exist one single and definitive list of green products. Thus, in the absence of a universal classification, we decided to collect data from the CLEG developed by the OECD [43] that compiled environmental goods and reflected green traded products.
Therefore, according to this compilation, we can build the heatmap that shows the green products that have a Reveled Comparative Advantage (RCA) in each entity. For instance, Jalisco is already competitive in some technologically sophisticated green products types, such as wastewater management and potable water treatment goods (because six products have R C A s , P g     1 ). However, we can also identify some green products that Jalisco is not yet competitive in, such as amino-resins, measuring or checking instruments, turbojets, electrical filament or discharge lamps, electric instantaneous and storage water heaters.
Consequently, it is necessary to extend the discussion with questions like: Why is Jalisco not competitively exporting these products? Are there any binding constraints that are preventing these new growth opportunities from taking off? Are there skill shortages? Are there issues with the regulatory landscape? Are there some kinds of infrastructure deficiencies? The answers to these questions could form a useful basis for targeted policy measures to turn the economy further green.
In other words, in order to deal with the decision-making risks caused by major environmental changes and model error bias, policymakers should link these results with the particular context of each region to find failures that inhibit the green economy (its diversification and sophistication). Because, according to Kiskiene, market, system and cultural failures are approaches that constitute a viable tool for the classification and analysis of public policy in the field of science, technology and innovation [51].
Furthermore, it should be noted that the economic complexity studies generated are not prescriptive at any time. Hence, as suggested by Hausmann, Cheston and Santos “should be interpreted as an approach to identifying opportunities for productive diversification, and not as a process through which winning sectors are selected. This definition should be the basis of an iterative analysis process that effectively validates its relevance, and provides a roadmap to identify possible barriers that could be inhibiting its emergence, such as absent specific capacities, public goods or other market failures” [52].
On the other hand, it is important to discuss that an important bias of our study is that the co-occurrence approach proposed by Hidalgo et al., falls short in considering other aspects that may influence the relatedness between industrial sectors, including institutions, infrastructure and the combination of productive factors [12]. However, it is a powerful metric to exploring the green product-space because avoid the problems of the hierarchical structure of the standard industrial classification (SIC) system. Besides, “the co-occurrence approach is able to capture a larger range of factors affecting similarities across products and industries” [14].
Accordingly, future investigation could focus on drawing the green product-space based in similarity in resource use or flow of resources between firms and/or sectors focusing on the role of human capital and the similarity in occupation profiles, technological resources using patent analysis, and material resources using commodity flows measured through input–output linkages.
Another obvious limitation of the product-space is that products that do not yet exist are absent, as well as products that are not specifically classified in the industrial classification system at 4 or 6 digits (unclassified eco-innovations) and products from unregulated industries.
In order to avoid the model error bias, it is necessary count with complementary or particular studies on green products or green business models (both regulated and unregulated goods and services) or digital products (with green business models).
For example, in Mexico, there is the industry of edible insects (which is not yet regulated) [53] that is encapsulated in green business models and influences the promotion of the green economy and not its deterioration (examples of Mexican companies in this sector: Totolines, Griyum and Nutrinsectos, products derived from chapulín). Other products that are unaccounted include eco-innovations that are not yet exported to the global product space but that exist in the national economy (for example, the company from Nuevo León GECO -Bioplastic of orange peel-).
Finally, conducting further research at the microeconomic level will be relevant to produce a wide range of studies related to green business models, as new business models can make an important contribution in the transition to green growth [54]. According to Yunus, it is possible to pursue zero poverty and zero unemployment while also seeking the goal of zero net carbon. In fact, it is essential to pursue all three goals, as they complement and support each other. Dirty growth is unsustainable growth not only in environmental terms but also in terms of practical economics. History also shows that, when environmentally destructive policies are pursued, the poor suffer the most [2].

6. Conclusions

The present work is framed at the mesoeconomic level and made an adequate compilation of data, which allowed the generation of a study in the Mexican context that serves to provide a first approach toward the green product space. This is useful for policymakers that are interested in a green recovery, looking to invest to build cleaner and safer industries for the future rather than continuing to support traditional emission-intensive industries.
We mapped the current landscape of the green production capabilities in Mexico at the subnational level. Therefore, we collected an adapted dataset from CLEG products that reflects green traded products. In the list that we adapted, we primarily identified “Renewable Energy Products” (REP), such as optical fibers, which are used in solar concentrated systems static converters, which are used for alternative energy. However, when thinking about the green economy, we are not only interested in REP. We also think about environmental benefits more broadly.
Consequently, we compiled products in categories, such as CRE = cleaner or more resource efficient technologies and products; SWM = management of solid and hazardous waste and recycling systems; WAT = waste water management and potable water treatment; APC = air pollution control; EPP = environmentally preferable products based on end use or disposal characteristics; HEM = heat and energy management; MON = environmental monitoring, analysis and assessment equipment; NRP = natural resources protection; NVA = noise and vibration abatement; and SWR = clean up or remediation of soil and water. The dataset of environmental products that we explored was quite complete in this sense.
The GCIs indices demonstrated changes over time. Over the 15 years of data that we analyzed, Nuevo León persistently held onto the top place, which is quite impressive. Jalisco and Zacatecas also made fairly significant gains. Other regions, such as Durango, saw a substantial decline in their GCI rankings.
The evolution of the GCI and GCP was heterogeneous across the different states. The case of Jalisco´s GCP is striking, which, despite not being in the top 10 of GCI, shows a significant potential to develop green products, since it is in the fifth position of the GCP ranking. The same occurred for the state of Puebla, which revealed greater potential future capacities over its current capacity. Guanajuato, Sonora and the State of Mexico improved their potential positioning compared to their GCI ranking within the top 10. Finally, we also found a strong correlation between the GCI and GDP, which suggests that to green the economy, Mexico needs to have a more complex economy.
Finally, we can summarize our findings in the next list:
  • Production of green goods is associated mainly with products of high complexity (greening the Mexican economy implies having more complex products).
  • We adapt a new dataset based on the CLEG list in order to study green economy within Mexican states (mesoeconomic focus).
  • We estimate the Green Complexity Index (GCIs) at sub-national level in order to measure the green production capabilities across Mexican entities.
  • We explore the green product-space in Mexico, it allowed us to show the Grid of Green Adjacent Possible (GAPs) by state—a measure that predicts future green export growth across entities—as well as the Green Complexity Potential (GCPs), which reveals the entities that have more or less potential capabilities to transit into a green economy.
A limitation of our work is related to the fact that we investigated only exported products. Therefore, we cannot comment on the production process (the way in which a product was generated), and we do not have data or comparable data on the supply chains. Another limitation is that we did not explore green services and green business models in mapping the green space.
This limitation frames the importance of Economic-Administrative Sciences to be able to link, for example, the green product-space with studies related to green business models as well as sustainable supply chains.
In Mexico, it is necessary to reverse the process from the micro to the macro, from the regional to the national, and it is essential to start the process from the personal to the community and collective. In short, it is a priority to build a national innovation agenda that communicates the experiences and regional talents of the country’s states, where the best practices can be shared, and innovation is nurtured. Thus, with regional actions of the states, we will achieve transformation toward a national green economy [1].

Author Contributions

Conceptualization: C.C.P.-H. and B.C.S.-H.; methodology: C.C.P.-H.; theorical investigation, J.M.-M. and M.A.H.-C.; contextual investigation: E.C.-C. and B.C.S.-H.; data curation: C.C.P.-H.; writing—original draft preparation, B.C.S.-H., M.A.H.-C., and C.C.P.-H.; writing—review and editing: J.M.-M. and E.C.-C.; visualization: C.C.P.-H. All authors have read and agreed to the published version of the manuscript.

Funding

This research received funding by Secretariat of Public Education (Mexico) with the fund called “Programa para el Desarrollo Profesional Docente” (PROMEP-SEP). Agreement Number: 511-6/2020-8587.

Institutional Review Board Statement

Not applicable.

Informed Consent Statement

Not applicable.

Data Availability Statement

The data that support the findings of this study are available from the corresponding author upon request.

Conflicts of Interest

The authors declare no conflict of interest.

Appendix A

Table A1. Descriptive statistics of green products by type.
TYPE OF GREEN PRODUCTNMEAN PCISTDEVCOEFVAR
Green products1060.60020.7472124.49
Renewable energy plant (REP)250.72970.495767.93
Cleaner or more resource efficient technologies and products (CRE)170.5540.50591.18
Waste water management and potable water treatment (WAT)150.5010.777155.01
Management of solid and hazardous waste and recycling systems (SWM)151.0410.55653.36
Heat and energy management (HEM)120.5390.47788.55
Environmental monitoring, analysis and assessment equipment (MON)81.1420.58751.44
Environmentally preferable products based on end use or disposal characteristics (EPP)5−1.2370.971−78.48
Air pollution control (APC)30.73810.108114.65
Clean up or remediation of soil and water (SWR)30.4520.608134.64
Natural resources protection (NRP)2−0.6560.174−26.51
Noise and vibration abatement (NVA)11.1569NANA
Source: Own elaboration. All our data are available upon request. Note: NA = not applicable.
Table A2. Ranking of green products by density.
RANKTYPEGREEN PRODUCTPCI.2018REGIONDENSITY
1MONMonoculars for MON1.165Sonora26.22
2REPOptical fibers 0.7699Baja California26.2
3HEMAgglomerated cork −0.5364Baja California26.1
4HEM Gas, liquid or electricity supply or production meters−0.0506Chihuahua24.68
5HEMAgglomerated cork −0.5364Chihuahua23.58
6HEMMultiple-walled insulating units of glass0.7681Chihuahua22.66
7CREParts and accessories of vehicles CRE0.8366Chihuahua22.66
8MON Parts and accessories MON0.9104Chihuahua22.66
9SWRElectric instantaneous or storage water heaters 0.5367Baja California21.67
10HEMAmino-resins, phenolic resins and polyurethanes1.2493Edo. Mex.21.46
11REPOptical fibers and optical fiber bundles0.7699Tamaulipas20.68
12MON Measuring or checking instruments MON1.8193Baja California20.53
13NRP Fishing rods, fish hooks and other line fishing tackle−0.5331Chihuahua20.33
14MON Measuring or checking instruments MON1.8193Nuevo León20.24
15SWMMachine tools SWM1.0371Chihuahua19.69
16HEM Gas, liquid or electricity supply or production meters−0.0506Nuevo León19.67
17SWMMachine tools SWM1.0371Nuevo León19.43
18HEMMultiple-walled insulating units of glass0.7681Baja California19.02
19CREParts and accessories of vehicles CRE0.8366Baja California19.02
20MON Parts and accessories MON0.9104Baja California19.02
21HEMMultiple-walled insulating units of glass0.7681Nuevo León18.89
22CREParts and accessories of vehicles CRE0.8366Nuevo León18.89
23MON Parts and accessories MON0.9104Nuevo León18.89
24HEM Gas, liquid or electricity supply or production meters−0.0506Baja California18.86
25APCProducer gas or water gas generators, with purifiers0.6341Chihuahua18.82
26CREPrimary cells and primary batteries; parts thereof0.4174Chihuahua18.82
27WATTubes, pipes and hollow profiles, of cast iron−0.2055Baja California18.77
28REPLenses, prisms, mirrors and other optical elements for REP1.2455Edo. Mex.18.37
29SWMElectromagnets1.5448Nuevo León18.36
30CREBicycles and other cycles −0.0113Nuevo León18.24
Source: Own elaboration. Note: All our data are available upon request.

References

  1. Medina, S. Economía Verde En México. Transformación Económica, Desarrollo Social Incluyente y Cuidado Del Medio Ambiente; LID: Ciudad de México, Mexico, 2019; pp. 1–155. [Google Scholar]
  2. Yunus, M. Un Mundo de Tres Ceros: Nueva Economía de Pobreza Cero, Desempleo Cero y Cero Emisiones Netas de Carbono; Paidós: Barcelona, Spain, 2018. [Google Scholar]
  3. Mealy, P.; Teytelboym, A. Economic complexity and the green economy. Res. Policy 2020, 103948. [Google Scholar] [CrossRef]
  4. Romero, J.P.; Gramkow, C. Economic complexity and greenhouse gas emissions. World Dev. 2021, 139, 105317. [Google Scholar] [CrossRef]
  5. Vargas, M. Economiccomplexity: Computational Methods for Economic Complexity. J. Open Source Softw. 2020, 5, 1866. [Google Scholar] [CrossRef]
  6. Martin, R.; Sunley, P. Complexity thinking and evolutionary economic geography. J. Econ. Geogr. 2007, 7, 573–601. [Google Scholar] [CrossRef] [Green Version]
  7. Hamwey, R.; Pacini, H.; Assunção, L. Mapping Green Product Spaces of Nations. J. Environ. Dev. 2013, 22, 155–168. [Google Scholar] [CrossRef]
  8. Denona, N.; Grdic, Z.S. Transitioning to a Green Economy—Possible Effects on the Croatian Economy. Sustainability 2020, 12, 9342. [Google Scholar] [CrossRef]
  9. Bailey, I.; Caprotti, F. The Green Economy: Functional Domains and Theoretical Directions of Enquiry. Environ. Plan. Econ. Space 2014, 46, 1797–1813. [Google Scholar] [CrossRef] [Green Version]
  10. Hausmann, R.; Hidalgo, C.A. The network structure of economic output. J. Econ. Growth 2011, 16, 309–342. [Google Scholar] [CrossRef] [Green Version]
  11. Hausmann, R.; Hidalgo, C.A.; Bustos, C.; Coscia, M.; Simoes, A.; Yildirim, M.A. The Atlas of Economic Complexity: Mapping Maps of Prosperity; MIT Press: Cambridge, MA, USA, 2013. [Google Scholar]
  12. He, C.; Zhu, S. Evolution of Export Product Space in China: Technological Relatedness, National/Local Governance and Regional Industrial Diversification. Tijdschr. Voor Econ. Soc Geogr. 2018, 109, 575–593. [Google Scholar] [CrossRef]
  13. Neffke, F.; Henning, M.; Boschma, R. How Do Regions Diversify over Time? Industry Relatedness and the Development of New Growth Paths in Regions. Econ. Geogr. 2011, 87, 237–265. [Google Scholar] [CrossRef]
  14. Boschma, R.; Minondo, A.; Navarro, M. Related variety and regional growth in Spain*: Related variety and regional growth. Pap. Reg. Sci. 2011, 91, 241–256. [Google Scholar] [CrossRef]
  15. Essletzbichler, J. Relatedness, Industrial Branching and Technological Cohesion in US Metropolitan Areas. Reg. Stud. 2015, 49, 752–766. [Google Scholar] [CrossRef] [Green Version]
  16. Hidalgo, C.A.; Klinger, B.; Barabasi, A.-L.; Hausmann, R. The Product Space Conditions the Development of Nations. Science 2007, 317, 482–487. [Google Scholar] [CrossRef] [PubMed] [Green Version]
  17. Hidalgo, C.A.; Hausmann, R. The building blocks of economic complexity. Proc. Natl. Acad. Sci. USA 2009, 106, 10570–10575. [Google Scholar] [CrossRef] [PubMed] [Green Version]
  18. Hausmann, R.; Klinger, B. Structural Transformation and Patterns of Comparative Advantage in the Product; CID working paper; Center for International Development at Harvard University: Cambridge, MA, USA, 2006. [Google Scholar]
  19. Huberty, M.; Zahmann, G. Green Exports and the Global Product Space—Prospects for EU Industrial Policy. Bruegel working paper. BRUEGEL: Germany, 2011. Available online: https://www.econstor.eu/handle/10419/77991 (accessed on 18 January 2021).
  20. Berchicci, L.; Bodewes, W. Bridging environmental issues with new product development. Bus. Strategy Environ. 2005, 14, 272–285. [Google Scholar] [CrossRef]
  21. Sdrolia, E.; Zarotiadis, G.A. Comprehensive review for green product term: From definition to evaluation: A comprehensive review for green product term. J. Econ. Surv. 2019, 33, 150–178. [Google Scholar] [CrossRef] [Green Version]
  22. Albino, V.; Balice, A.; Dangelico, R.M. Environmental strategies and green product development: An overview on sustainability-driven companies. Bus. Strategy Environ. 2009, 18, 83–96. [Google Scholar] [CrossRef]
  23. Fankhauser, S.; Bowen, A.; Calel, R.; Dechezleprêtre, A.; Grover, D.; Rydge, J.; Sato, M. Who will win the green race? In search of environmental competitiveness and innovation. Glob. Environ. Chang. 2013, 23, 902–913. [Google Scholar] [CrossRef] [Green Version]
  24. Fraccascia, L.; Giannoccaro, I.; Albino, V. Green product development: What does the country product space imply? J. Clean. Prod. 2018, 170, 1076–1088. [Google Scholar] [CrossRef]
  25. Dordmond, G.; de Oliveira, H.C.; Silva, I.R.; Swart, J. The complexity of green job creation: An analysis of green job development in Brazil. Environ. Dev. Sustain. 2020, 23, 723–746. [Google Scholar] [CrossRef]
  26. Rebs, T.; Brandenburg, M.; Seuring, S. System dynamics modeling for sustainable supply chain management: A literature review and systems thinking approach. J. Clean. Prod. 2019, 208, 1265–1280. [Google Scholar] [CrossRef]
  27. Hartmann, D. Economic Complexity and Human Development: How Economic Diversification and Social Networks Affect Human Agency and Welfare, 1st ed.; Routledge: NewYork, NY, USA, 2018. [Google Scholar]
  28. Svensson, G. Aspects of sustainable supply chain management (SSCM): Conceptual framework and empirical example. Supply Chain Manag. Int. J. 2007, 12, 262–266. [Google Scholar] [CrossRef]
  29. Pagell, M.; Shevchenko, A. Why Research in Sustainable Supply Chain Management Should Have no Future. J. Supply Chain Manag. 2014, 50, 44–55. [Google Scholar] [CrossRef]
  30. Zimon, D.; Tyan, J.; Sroufe, R. Implementing Sustainable Supply Chain Management: Reactive, Cooperative, and Dynamic Models. Sustainability 2019, 11, 7227. [Google Scholar] [CrossRef] [Green Version]
  31. Zimon, D.; Tyan, J.; Sroufe, R. Drivers of sustainable supply chain management: Practices to alignment with un sustainable development goals. Int. J. Qual. Res. 2020, 14, 219–236. [Google Scholar] [CrossRef]
  32. Gosling, J.; Jia, F.; Gong, Y.; Brown, S. The role of supply chain leadership in the learning of sustainable practice: Toward an integrated framework. J. Clean. Prod. 2017, 140, 239–250. [Google Scholar] [CrossRef]
  33. Presidencia de la República. Plan Nacional de Desarrollo 2013–2018. Available online: http://www.gob.mx/epn/acciones-y-programas/plan-nacional-de-desarrollo-2013-2018-78557/ (accessed on 13 October 2020).
  34. Gibbs, D. Green Economy. In International Encyclopedia of Human Geography; Elsevier: Amsterdam, The Netherlands, 2020; pp. 267–274. [Google Scholar]
  35. Morales, A.C.M. Energías renovables y el hidrógeno: Un par prometedor en la transición energética de México. Investig. Cienc. 2017, 25, 92–101. [Google Scholar]
  36. SENER. Inventario Nacional de Energías Limpias. Available online: http://www.gob.mx/sener/articulos/inventario-nacional-de-energias-limpias?idiom=es/ (accessed on 2 October 2020).
  37. Hurtado, I. México se Consolida Como Potencia en Energía Solar. Available online: https://www.energiaadebate.com/tecnologias/mexico-se-consolida-como-potencia-en-energia-solar/ (accessed on 13 October 2020).
  38. ICOA. Report of the Inter-American Commission on Organic Agriculture 2019–2020. Available online: http://apps.iica.int/SReunionesOG/Content/Documents/CE2020/en/132d9deb-07f4-49d6-a237-f3a8ccf17629_id01_report_of_the_icoa__rev._2.pdf/ (accessed on 13 October 2020).
  39. Rindermann, R.S. La Red Mexicana de Tianguis y Mercados Orgánicos—Renovando Sistemas de Abasto de Bienes de Primera Necesidad Para Pequeños Productores y Muchos Consumidores; Revista Ciencias de la Salud: Bogotá, Colombia, 2015. [Google Scholar]
  40. Bustamante, T.; Chávez, B.C.; Rindermann, R.S. Sostenibilidad de pequeños productores en Tlaxcala, Puebla y Oaxaca, México. Cuad. Trab. Estud. Reg. Econ. Poblac. Desarro. 2017, 37, 3–34. [Google Scholar]
  41. Torres, J.; Guevara, A. El potencial de México para la producción de servicios ambientales: Captura de carbono y desempeño hidráulico. Gac. Ecológica 2002, 63, 40–59. [Google Scholar]
  42. Serrano, A.; Martín, S. Impuestos Verdes: ¿Una Alternativa Viable Para el Ecuador? Fundación Friedrich Ebert ILDIS: Centro de Estudios Fiscales CEF; EcoEcoEs Asociación Ecológica en España: Quito, Ecuador, 2011. [Google Scholar]
  43. Sauvage, J. The Stringency of Environmental Regulations and Trade in Environmental Goods; OECD Trade and Environment Working Paper; Organization for Economic Cooperation and Development: Paris, France, 2014; pp. 1–34. [Google Scholar]
  44. EUROSAT. Available online: https://ec.europa.eu/eurostat/ramon/nomenclatures/index.cfm?TargetUrl=LST_CLS_DLD&StrNom=HS_2007&StrLanguageCode=ES&StrLayoutCode=HIERARCHIC#/ (accessed on 13 October 2020).
  45. DATOS.GOB. Available online: https://datos.gob.mx/busca/dataset/estadistica-de-comercio-exterior-importaciones-y-exportaciones-de-mexico/ (accessed on 13 May 2020).
  46. DATAMEXICO. Available online: https://datamexico.org/ (accessed on 29 July 2020).
  47. Balland, P.A. Economic Geography in R: Introduction to the EconGeo Package. SSRN Electron J. 2017. [Google Scholar] [CrossRef] [Green Version]
  48. Boschma, R.; Balland, P.A.; Kogler, D.F. Relatedness and technological change in cities: The rise and fall of technological knowledge in US metropolitan areas from 1981 to 2010. Ind. Corp. Chang. 2015, 24, 223–250. [Google Scholar] [CrossRef]
  49. OECD. Environmental Goods: A Comparison of the APEC and OECD Lists. Available online: https://www.oecd.org/environment/envtrade/35837840.pdf/ (accessed on 29 July 2020).
  50. OECD. The Environmental Goods and Services Industry: Manual for Data Collection and Analysis. Available online: https://www.oecd-ilibrary.org/industry-and-services/the-environmental-goods-and-services-industry_9789264173651-en/ (accessed on 29 July 2020).
  51. Kiskiene, A. Scientific Knowledge and Technology Transfer Policy in the E. Econ. Bus. 2014, 26, 36–43. [Google Scholar] [CrossRef] [Green Version]
  52. Hausmann, R.; Cheston, T.; Santos, M. La Complejidad Económica de Chiapas: Análisis de Capacidades y Posibilidades de Diversificación Productiva; Working Papers; Harvard CID: Cambridge, MA, USA, 2015. [Google Scholar]
  53. Ramos-Elorduy, J.; Pino, J.; Conconi, M. Ausencia de una reglamentación y normalización de la explotación y comercialización de insectos comestibles en México. Folia Entomológica Mex. 2006, 45, 291–318. [Google Scholar]
  54. OECD. Why New Business Models Matter for Green Growth. Available online: https://www.oecd-ilibrary.org/environment/why-new-business-models-matter-for-green-growth_5k97gk40v3ln-en/ (accessed on 29 July 2020).
Figure 1. Green Complexity Index ranking for 2004–2018. * Baja California Sur, Chiapas, Colima, Guerrero, Nayarit, Oaxaca and Tlaxcala were the states that, in 2018, had the last position in the ranking. Veracruz did not have available data for 2016–2018. Source: Own calculations and elaboration.
Sustainability 13 00945 g001
Figure 2. Green Complexity Index in 2018. Source: Own calculations and elaboration.
Sustainability 13 00945 g002
Figure 3. Green Complexity Potential Ranking for 2004–2018. Note: There were no data of Veracruz (2016–2018). Source: Own calculations and elaboration.
Sustainability 13 00945 g003
Figure 4. The green product space in Mexico. (a) The green product space in Mexico by Product Complexity Index (PCI), year 2018; (b) the green product space in Mexico by type of green product, year 2018. Source: Own elaboration.
Sustainability 13 00945 g004aSustainability 13 00945 g004b
Figure 5. Competitive green product spaces for a selection of states: The green product spaces (networks where green product nodes are linked to each other on the basis of their relatedness) provide further visualizations of certain state´s green production capabilities. Note: green nodes are colored if R C A P g   1 . Source: Own calculations and elaboration.
Sustainability 13 00945 g005
Figure 6. The heatmap shows the “grasslands” already existing in the economy of each entity. This shows which green products have a factual revealed comparative advantage (RCA). The x-axis plots each green product and the y-axis shows each state. Note: Green squares are colored if M s , p = 1   i f   R C A s , P g     1 ; O t h e r w i s e ,   M s , p = 0   i f   R C A s , P g   <   1 . Source: Own elaboration.
Sustainability 13 00945 g006
Figure 7. The Green Complexity Index (GCI) vs. the Economic Complexity Index (ECI) of Mexican exports. (a) Correlation between the GCI index and ECI index R = 0.79; (b) correlation between the GCI ranking and ECI ranking; R = 0.89 Source: Own elaboration.
Sustainability 13 00945 g007
Figure 8. Grid of Green Adjacent Possible (GAP) for all Mexican states (except Veracruz). In each plot, the dots represent green products that the denoted state is not competitive in. The y-axis plots the PCI of each product and the x-axis plots that product’s density to a state. Source: Own calculations and elaboration.
Sustainability 13 00945 g008
Figure 9. The top five of densities of each region by the type of green product. In Sankey diagrams: The columns represent the relationships between green product types that belong to each entity. Note: All products have different levels of density. Source: Own elaboration.
Sustainability 13 00945 g009
Table 1. Approaches to measure the relatedness (Product-Space) between products [12,13,14,15,16].
(1) The Hierarchical Structure of the Standard Industrial Classification (SIC) System.(2) The Co-Occurrence Approach Proposed by Hidalgo et al.(3) The Similarity in Resource Use
Definition
The method based on similarities in upward and down- ward linkages in input-output tables.
The closer together industries are within this classification system, the more related they are thought to be.
Co-occurrence analysis measures the relatedness between two industries by assessing whether two industries are often found together in one and the same economic entity. Hidalgo et al. counted the number of times that two industries showed a revealed comparative advantage (the co-occurrence) in the same country (the economic entity).
The third approach defines relatedness through similarity in resource use or flow of resources between firms and/or sectors focusing on the role of human capital and the similarity in occupation profiles, technological resources using patent analysis, and material resources using commodity flows measured through input–output linkages.
Limitation (bias)
This method is relatively easy to implement and available for a large number of secondary data for different countries and regions.
However, the method has been critiqued for neglecting the relatedness between subsectors that do not belong to the same sector classification.
However, other factors besides relatedness may partly determine the number of co-occurrences. For example, if industries are very large, they are likely to be found in many firms, and, therefore, they will also more frequently co-occur with other industries.
Resource-based similarity measures suffer from bias because of the strategic relevance given to some resources.
Patent-based indicators shed light on relatedness among patent-intensive industries, while input–output-based measures may be more useful for an investigation of manufacturing rather than service industries.
Publisher’s Note: MDPI stays neutral with regard to jurisdictional claims in published maps and institutional affiliations.

