1. Introduction
With the continuous growth of the world’s population and the increasing complexity of road conditions, pedestrian traffic crashes remain high. International crashes statistics indicates that older pedestrian is an extremely vulnerable group on the road [
1].
In the United States, pedestrians’ fatality rate has increased by more than 3% from 1990 to 2018. In the United States, the 2017 data show that the population over 65 only accounts for 15.42%, while the death rate of road pedestrian crashes over 65 is as high as 19.7%, an increase of 8.4 percentage points compared with the 1985 data. By age group, the groups with the highest overall pedestrian fatality rate were 55–59 years old and 75–79 years old, with a fatality rate of 281 and 271 deaths per 100,000 people, respectively [
2]. For comparison, NHTSA’s National Pedestrian Crash Report’s statistical results show that Pedestrian fatalities declined between 1997 and 2006. However, it is also found that the older age group (over 64) has a much greater possibility than other age groups to be killed in a crash. Remarkably, nearly two pedestrians nationwide died in vehicle crashes per 100,000 population, and a pedestrian crash death occurred every 70 million miles walked. This result is much lower than the death rate among the elderly [
3]. Which means the older pedestrian, as a very vulnerable group, still deserve great attention in pedestrian traffic crashes [
2].
However, since the total number of traffic crashes of older pedestrians is relatively small compared with other age groups, few studies have been done on traffic crashes among older pedestrians. However, as the population ages, prediction research concluded that, in 2050, the population over 64 years old is expected to exceed 83.7 million in the United States [
4,
5,
6]. With the increase of the more aging population, older pedestrian groups who have a higher death rate in the traffic crash need more protection on the road. More studies and research are required to analyze their behavior and surroundings compared with other age groups.
In Europe, the problem of older pedestrian safety is also severe. The National Committee on Ageing and Older Persons of the Republic of Ireland points out that older pedestrians are particularly vulnerable to fatal and injury caused by road traffic crashes. The rate of pedestrian injury and death for people over 70 years old is the highest among all age groups [
7]. Statistics from the Irish Road Safety Authority show that between 1996 and 2005, more than 500 Irish people over the age of 65 were killed in road crashes. According to Euromonitor, 34.4% of pedestrian deaths in Ireland involve the elderly (65 years or older), slightly below the European Union average (39.4%) [
8].
In Greece, Italy, and France, older people account for more than half of pedestrian deaths, while in the U.K., the rate is similar to Ireland at 35.9%. Notably, many older pedestrians who survived traffic crashes cannot return home due to disability and need shelter [
9].
In the different regions and countries of Europe, the rate ranges from 5.9 pedestrian fatalities per million inhabitants in the Netherlands to 47.6 pedestrian fatalities by million inhabitants in Estonia, a rate that is about eight times higher. At the same time, the EU-19 database average is equal to 15.8. Survey also shows that the proportion of pedestrian fatalities is considerably high for children (i.e., age < 15 years) as well as for the elderly (i.e., age > 65 years) [
10].
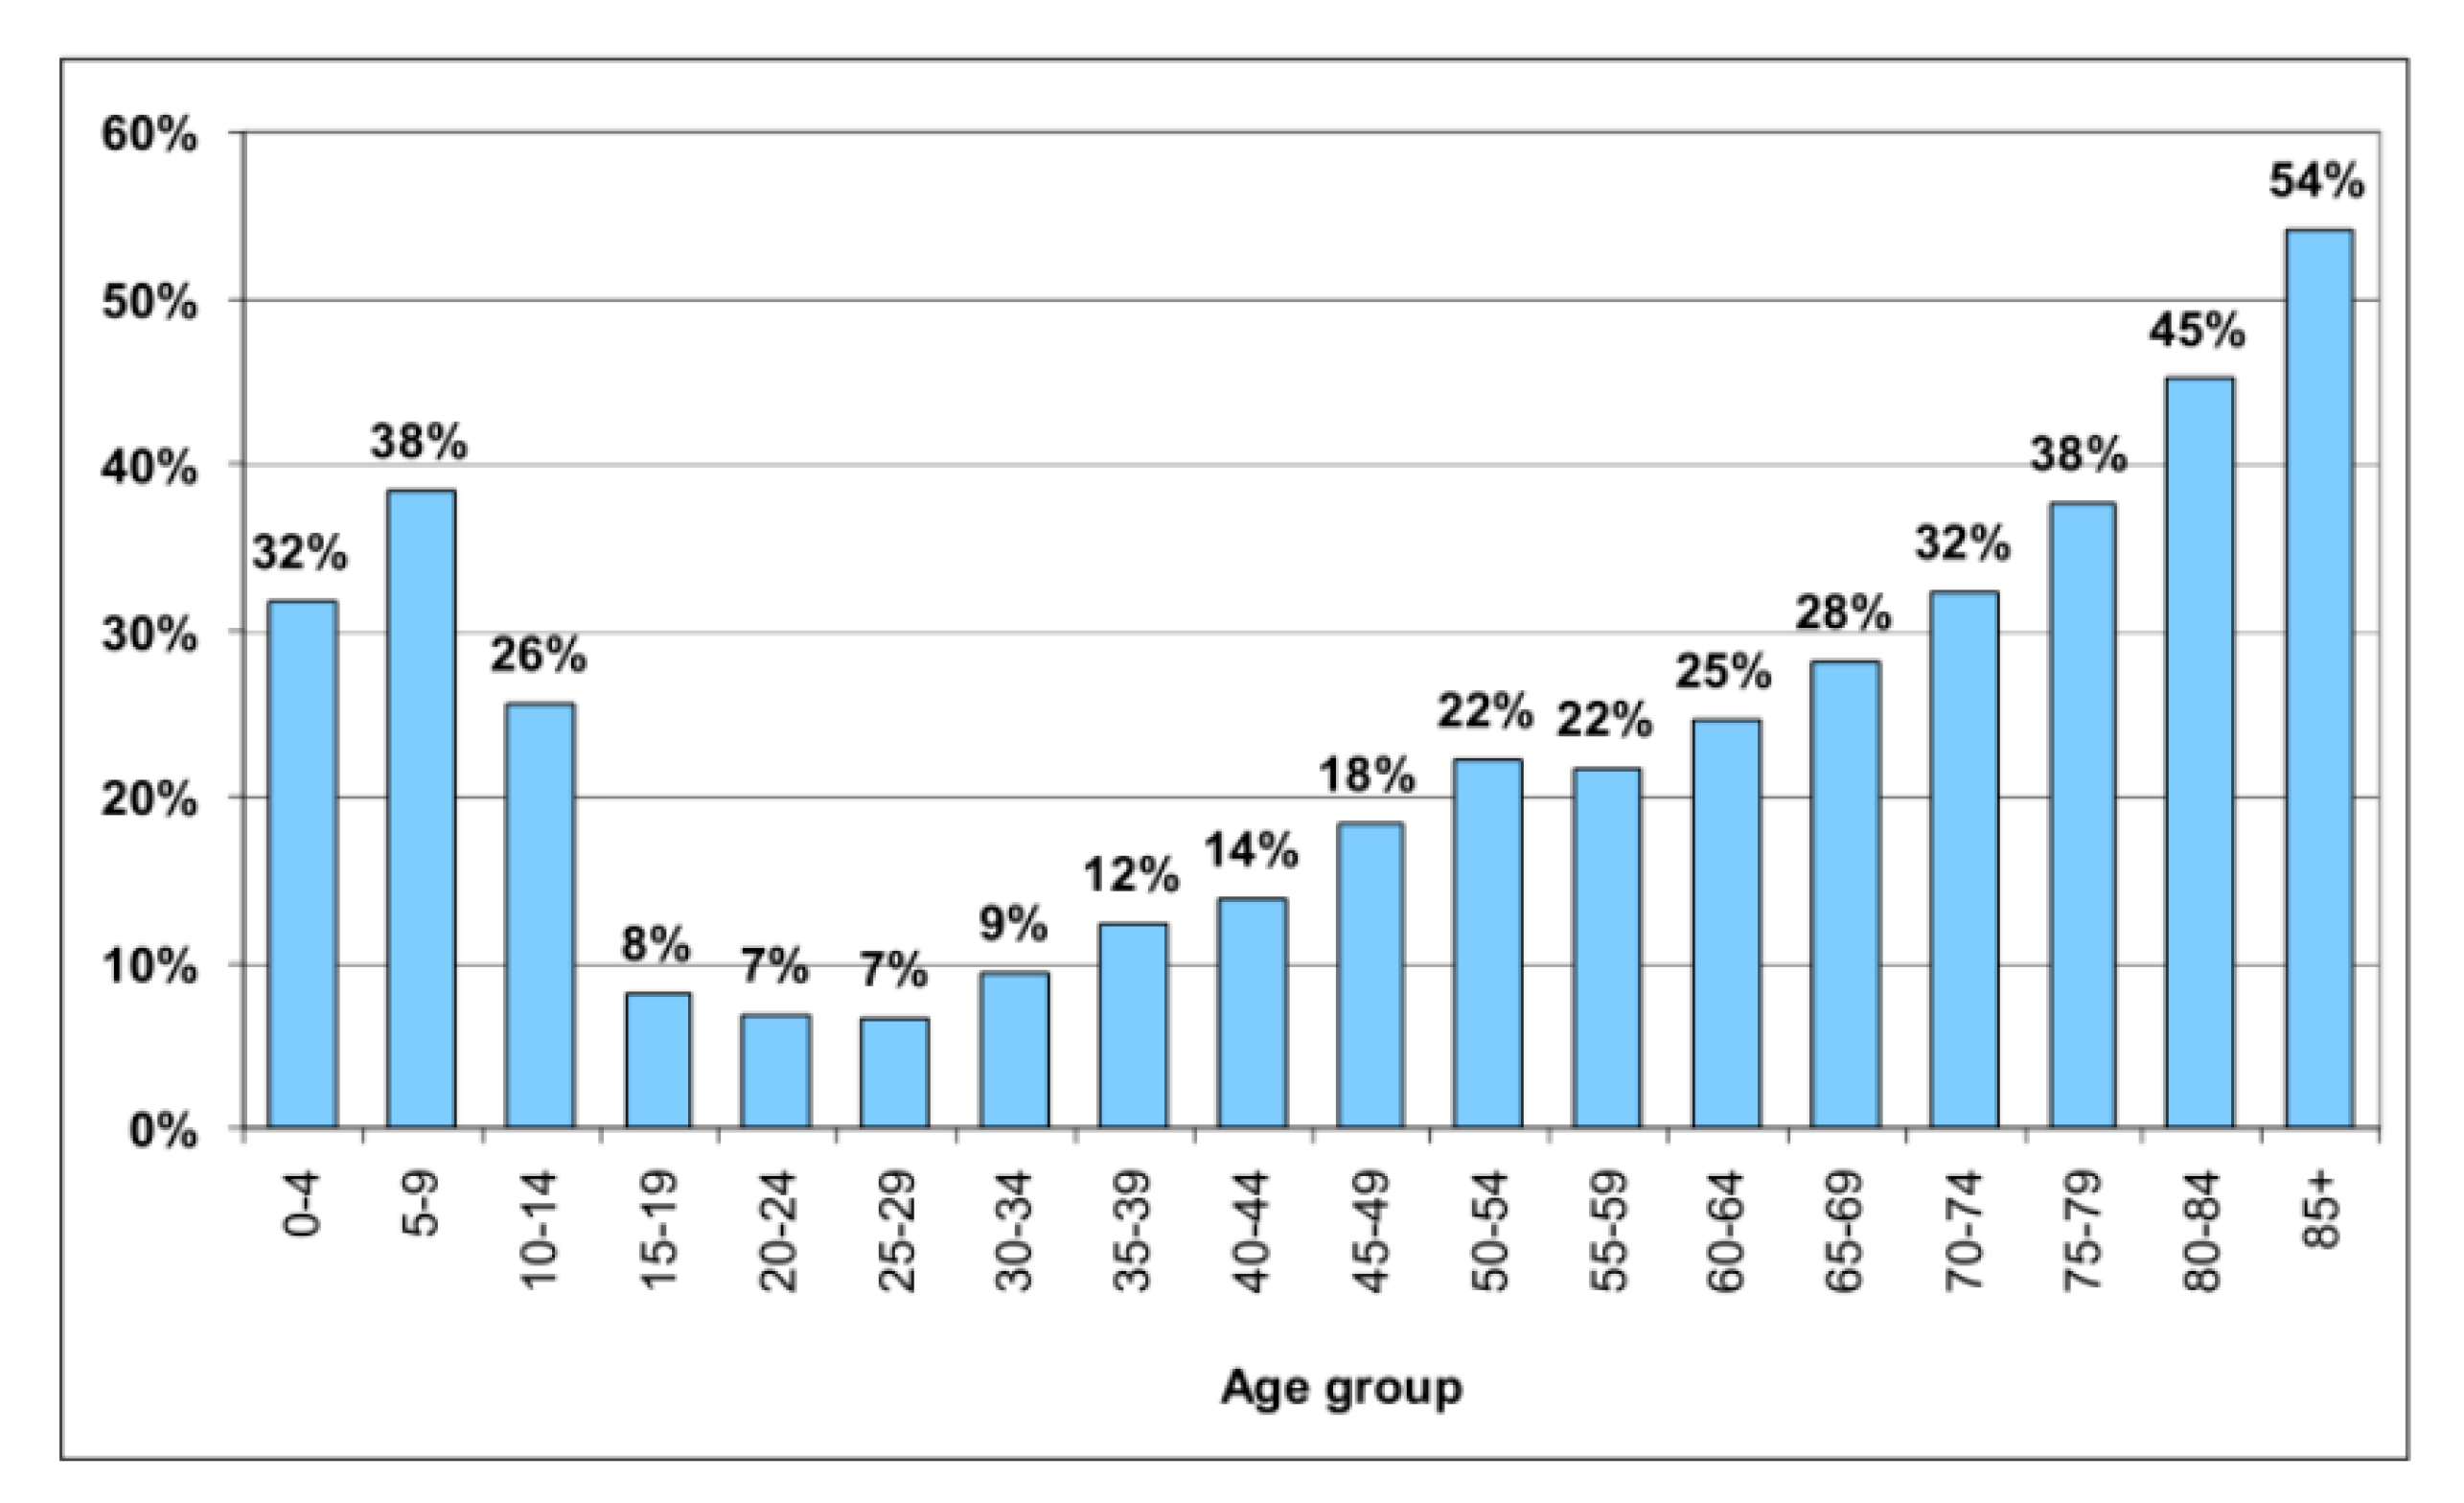
Figure 1 shows the pedestrian fatalities as a percentage of total fatalities by age group, including that around 30% of children’s road fatalities are pedestrians. Additionally, more than 30% of persons killed in the age groups > 65 years are pedestrians, a value that reaches 54% in the age groups > 85 years [
11].
Figure 1 also shows the death rate of the 15–59 age group is much lower than that of the over 60 age group, which indicates that the elderly pedestrian crashes in Europe are also of great concern.
Facing the difficult situation of older pedestrian traffic crashes, to accurately extract the internal mechanism of older pedestrian traffic crashes and effectively improve traffic safety for older pedestrians, it is necessary to carry out risk identification and severity prediction research on older pedestrian crashes. Based on this, to accurately identify the main influencing factors of older pedestrian traffic crashes and accurately predict the severity of older pedestrian traffic crashes, this study’s objective is first to model the older pedestrian crash severity. In the method part, an emerging machine learning algorithm XGBoost is applied, and the comparison between the traditional model Multinomial Logistic Regression and XGBoost is introduced. The second objective is to determine the feature importance and impact on different levels of severity of older pedestrian crashes by using SHAP interpretation. Finally, this study provides a definitive guide for management, construction, and other relevant departments to avoid tragedies and protect the older pedestrian effectively based on the above results.
2. Literature Review
Research on traffic crashes of older pedestrians has increased in recent years. Most of the researchers investigated the characteristics of older pedestrians, the living and traveling environment, and roadway features associated with pedestrian crashes.
2.1. Characteristics of Older Pedestrians Behaviors
The oldster’s response time to road condition analysis shows a trend of gradual increase with the increase of age [
9]. Oxley studied the road crossing behavior of young people and older people in a traffic crash hotspot in Australia. He found that there were differences in the reaction time in an emergent situation as well as the judgment of road conditions within the two groups of pedestrians, which makes the crossing choice of the oldster more dangerous than young people [
12]. The reason for this result may be that the conscious acceptance of the oldster will affect their judgment on the road [
13]. McDowd et al. made a contrast test to study whether age differences lead to distraction by hearing, vision, and a group of memory tests. The results showed that the receiving of the signal would appear delay in the older group because of their low awareness. Thus, older pedestrians are obviously at a disadvantage under the complicated road conditions [
14].
In terms of pedestrian actions, Walid Abdulla et al.’s research showed that older pedestrians are more likely to use crosswalks to cross the road than young pedestrians. However, older people tend to walk at a relatively slow speed, and there are many unfriendly designs for older people in the facilities and signal timing at intersections [
15]. Romero-Ortuno et al. analyzed the crossing time of different age groups through linear model regression. The result of the regression prediction showed that age and walking speed presented a negative correlation. The older pedestrians over 70 years old concluded that the crossing time of standard crosswalks is insufficient [
9,
16]. Liu et al. carried out a simulation experiment. The study found that younger pedestrians showed a higher rate of safe crossing than older pedestrians. Older people may underestimate their reduced ability to walk when making decisions about crossing the road, which puts them at relatively high risk. Besides, the most critical risk determinant for older adults is the time gap. The time interval is affected by the distance and speed of oncoming vehicles, which is easily misjudged by older pedestrians [
17].
In terms of gender, the severity of pedestrian traffic crashes is higher in older men than in women. Tatok analyzed 4829 pedestrian traffic crashes from 2011 to 2012 provided by the Chicago Police, and applied multiple Logit models, mixed Logit models, and potential category Logit models to study the impact of age and gender on the results of pedestrian traffic crash severity [
18]. Older pedestrians are more likely to have fatal crashes, and older male pedestrians are more severe than females [
19,
20].
2.2. Factors Affecting the Severity of Older Pedestrian Crashes
Environmental factors have a significant impact on walking safety for older individuals. Building a pedestrian-friendly environment is helpful to reduce the risk of pedestrian deaths. The result of Ahmed and Dunn’s study shows that walking can reduce the incidence rate of type 2 diabetes and some related cancers in the elderly [
21,
22]. Creating a relatively friendly environment for older pedestrians has been paid more and more attention from many researchers in recent years [
23,
24].
Woo et al. explored the relationship between residential environment and pedestrian traffic crashes by studying how the environment built by the Low-Income Housing Tax Credit (LIHTC) program affected pedestrian traffic accidents in Austin, Texas. Their study used a two-layer negative binomial regression model to illustrate the impact of the building environment at street and community levels on pedestrian collisions around the LIHTC complex. The results show that urban expressway, commercial district, high parking density, and high density of four-way intersections and road sections will reduce pedestrian safety. In contrast, local roads, single-family housing lots, and connecting sidewalks can improve pedestrian safety [
25,
26,
27,
28,
29].
The diversity of facilities in the residential neighborhood also affects pedestrian traffic crashes’ age and characteristics. According to Sugie et al.’s research, in areas with a high density of furniture stores, banks, and churches, there are fewer traffic crashes among older pedestrians in low-income communities than in high-income neighborhoods [
30].
In the road environment, the establishment of some pavement foundation settings is conducive to improve the frequent occurrence of older pedestrian traffic crashes [
30]. Some traffic control devices can also effectively protect pedestrian traffic safety.
Hwang et al.’s research results showed that crosswalks and speed bumps also reduce the occurrence of pedestrian traffic crashes [
31].
Other road features also impact the occurrence and severity of pedestrian traffic crashes, for example, the features of intersections. The older pedestrians have more fatal accidents in crashes at wide intersections [
32]. Besides, older pedestrians are more likely to get injured at four-lane meetings in low-income communities. Especially older pedestrians have more vehicle-human conflicts at four-lane intersections [
30].
The setting of bus stops and transfer signs will also affect pedestrian traffic accidents. Sugie’s research concluded that the number of Bus Rapid Transit (B.R.T) stations in a community significantly impacts older pedestrian safety [
33].
Different angles of impact also bring different degrees of harm to the elderly. Subasish’s research showed that oncoming vehicles have a higher incidence of accidents with older female pedestrians, especially among people over 79. When pedestrians between the ages of 65 and 69 cross the expressway at night, the analysis results also show a higher risk of traffic accidents [
34]. Dommes et al. simulated a crossing experiment on pedestrians of different ages. The experimental results show that elderly pedestrians are more dangerous when they move at the edge of two two-way lanes [
35,
36,
37].
When confronted with a vehicle, the head-on collision carries a higher risk of injury, disability, or fatality in older people [
38,
39].
2.3. XGBoost Research for Traffic Crashes
Tianqi Chen et al. proposed a sparse data perception algorithm and an approximate tree learning weighted quantile graph algorithm in 2016. It is improved based on the gradient boosting algorithm of machine learning, which has been called a “regularized transformation” technology. It has parallel processing, high flexibility, and built-in cross-validation functions, a more efficient and accurate machine learning application method, and is named the Extreme Gradient Boosting Algorithm(XGBoost) [
40]. This algorithm has been applied in many disciplines, and some researchers have used this algorithm in traffic crashes risk prediction and obtained better results than the traditional algorithms [
41,
42,
43].
Fan Li et al. studied the dynamic fatigue driving affected crashes. They introduced an algorithm based on XGBoost and built a prediction model for the driver fatigue level. The results show that the model accuracy is as high as 89% [
44]. Xiupeng Shi et al. used the XGBoost algorithm to analyze correlations between behavioral features and corresponding risk levels. The results showed that XGBoost is more accurate in identifying key features and more effective and accurate in predicting risk levels [
45]. Amir et al. use XGboost for detecting highway traffic data. The high performance of XGBoost supports its ability to see crashes, and the prediction accuracy is 99% [
46].
As a whole, most previous researches on pedestrians or older pedestrians’ safety are based on experiment and simulation data. Although a few used pedestrian crash data, only demographic data was used for the analysis and modeling. In this study, the 11-year pedestrian traffic crash data in Colorado was used for research and modeling, making the results valid and close to the realities. Furthermore, none of them implemented emerging machine learning to build their model precisely. Most of the modeling for older pedestrian traffic crashes used the traditional Logistic model for data analysis. The modeling distortion caused by the independence assumption of the model itself cannot be fundamentally solved. In this study, the XGBoost algorithm can avoid the independence assumption because it is not impacted by multicollinearity [
47]. Moreover, SHAP is used to interpret the XGBoost result. It can precisely calculate the correlation between each feature and the older pedestrian crash severity level and provide a qualified summary for the researchers.
3. Data Procession and Description
Data in this study are about pedestrian-vehicle traffic crashes in Colorado, USA, from 2006 to 2016. According to the preliminary screening of pedestrian age and data cleaning, a total of 13,856 pedestrian traffic crashes are collected [
48].
Previous research has shown that ages less than 14 are considered young, ages between 14 and 64 are considered adult, and ages greater than or equal to 65 are defined as older. This standard is widely used in the field of traffic crashes analysis. Moreover, the study of Siram showed that 65 years old is a reasonable age boundary in pedestrian traffic crash analysis [
49]. In this paper, 65 years old is used as the age boundary for the older group.
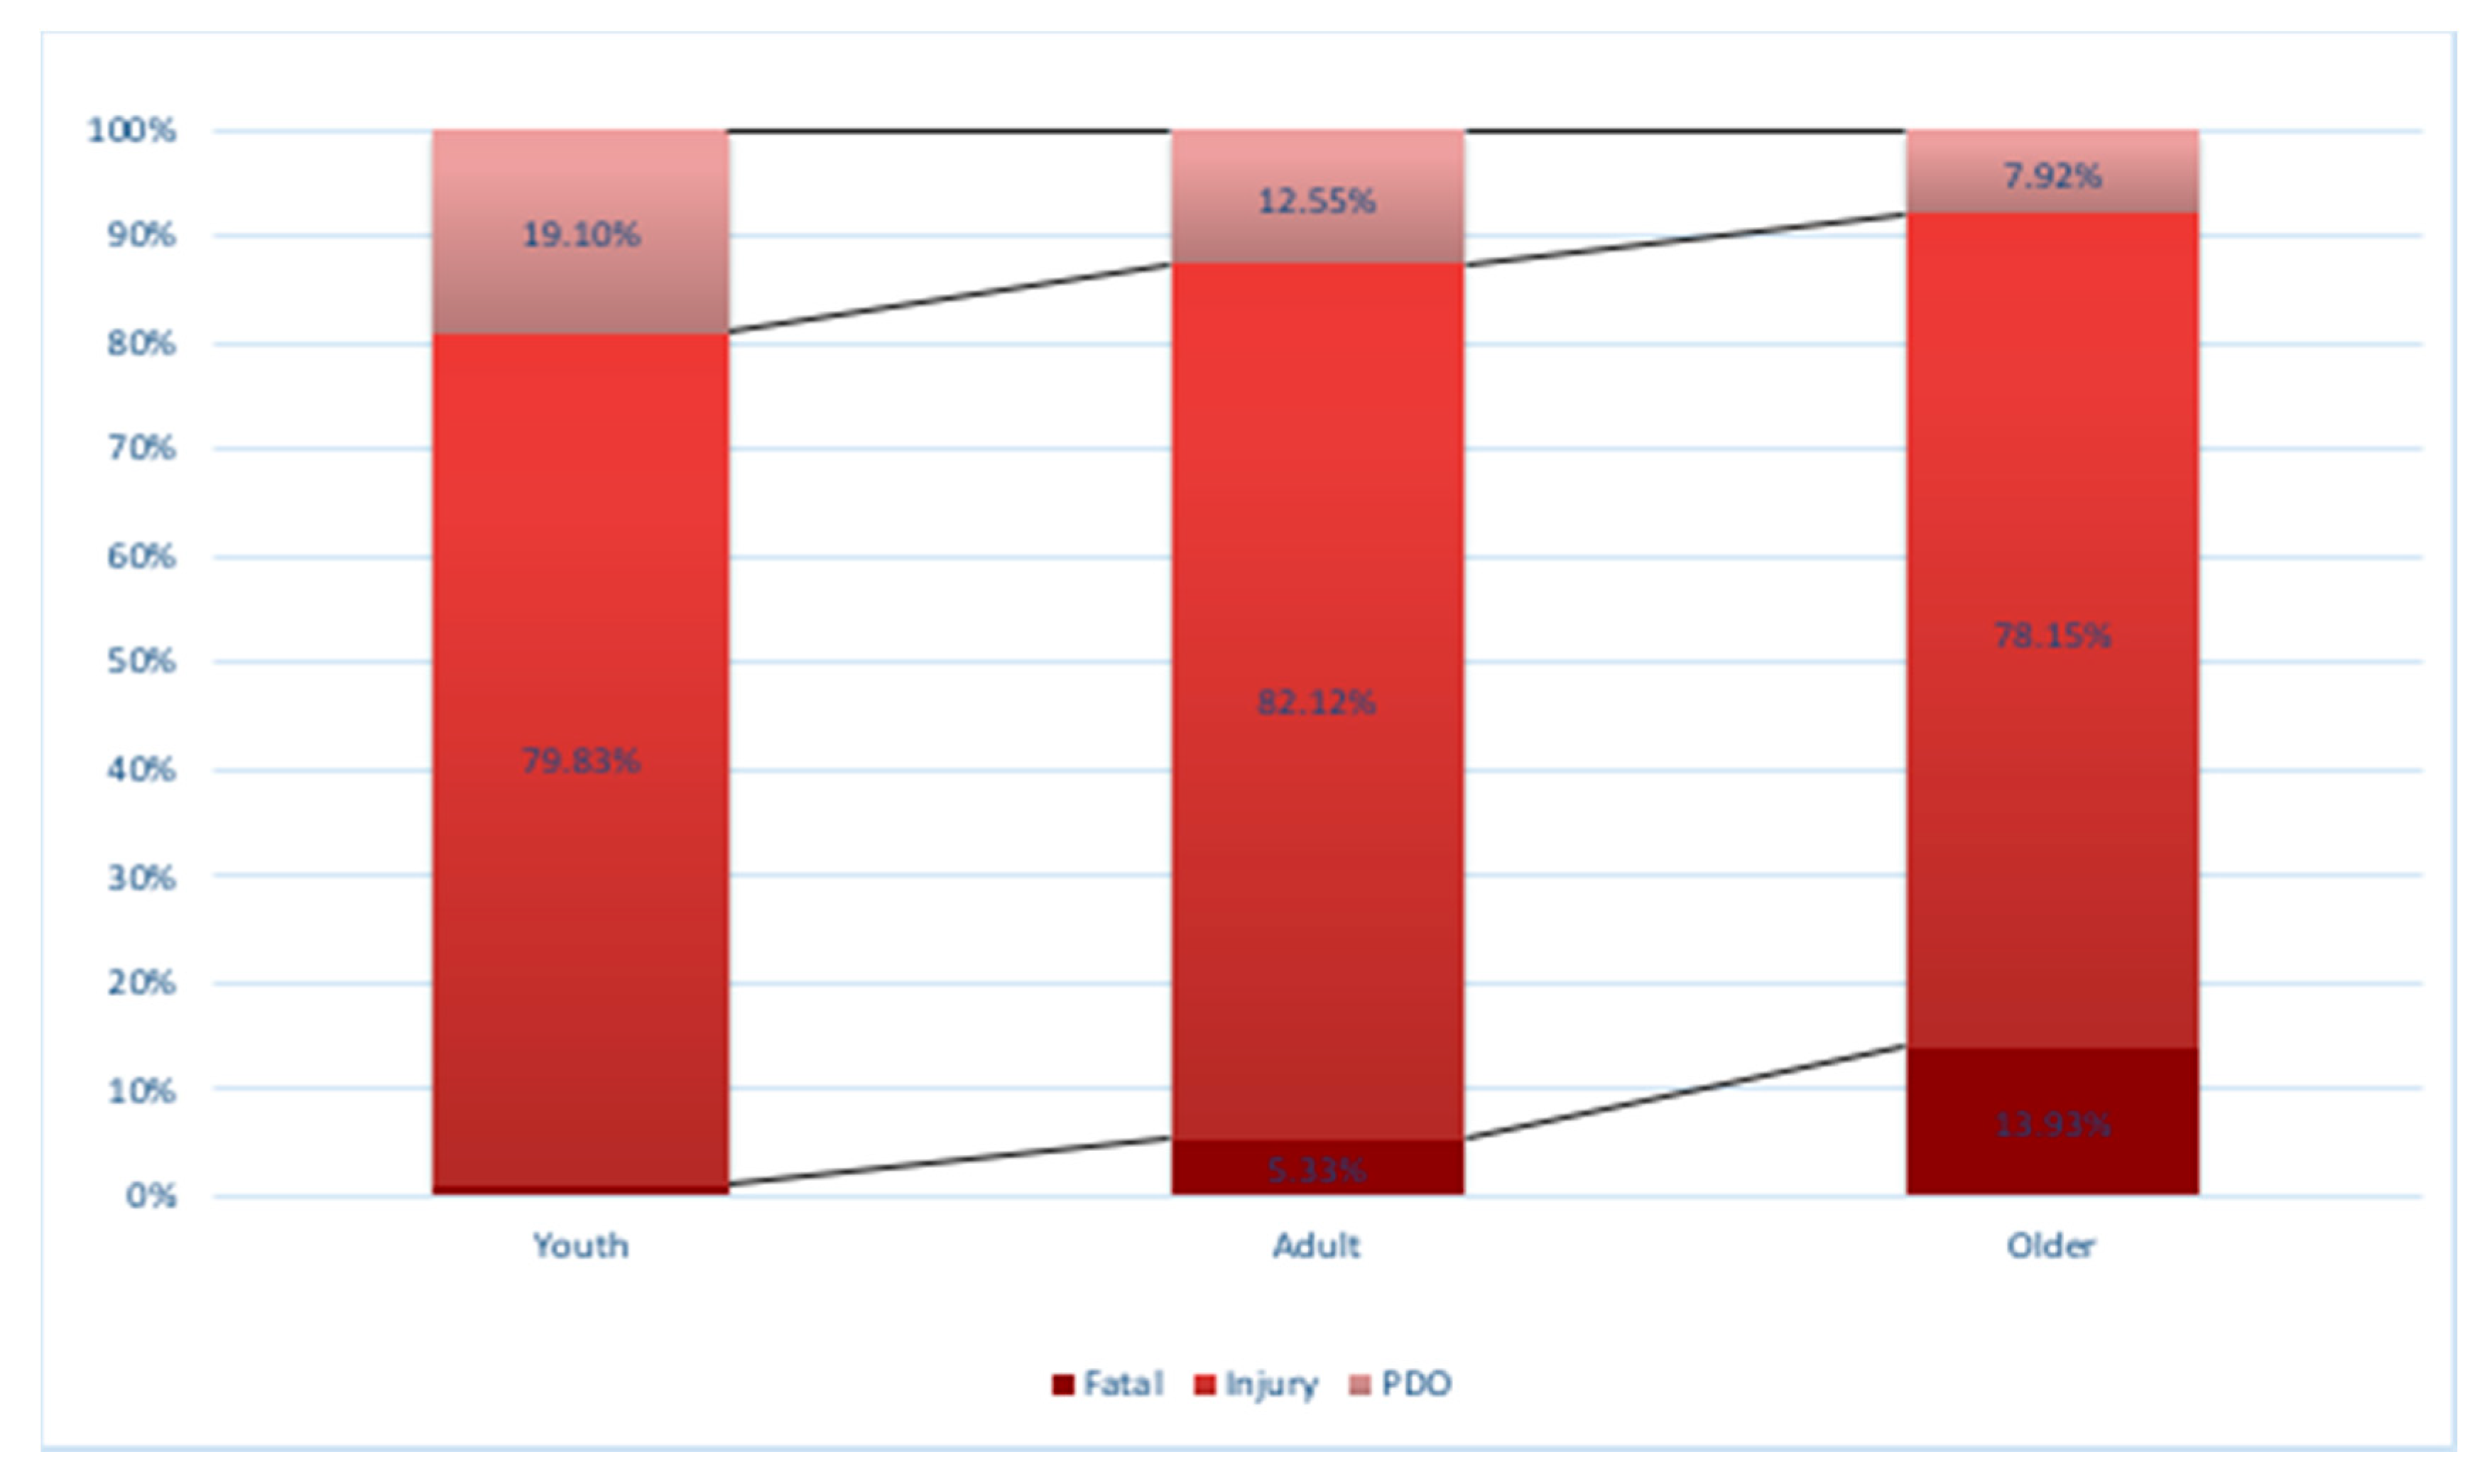
Figure 2 shows the proportion of the different pedestrian traffic crash severity by age groups. The data shows that the proportion of fatal pedestrian traffic crashes of the older group over 65 is the highest compared with other age groups.
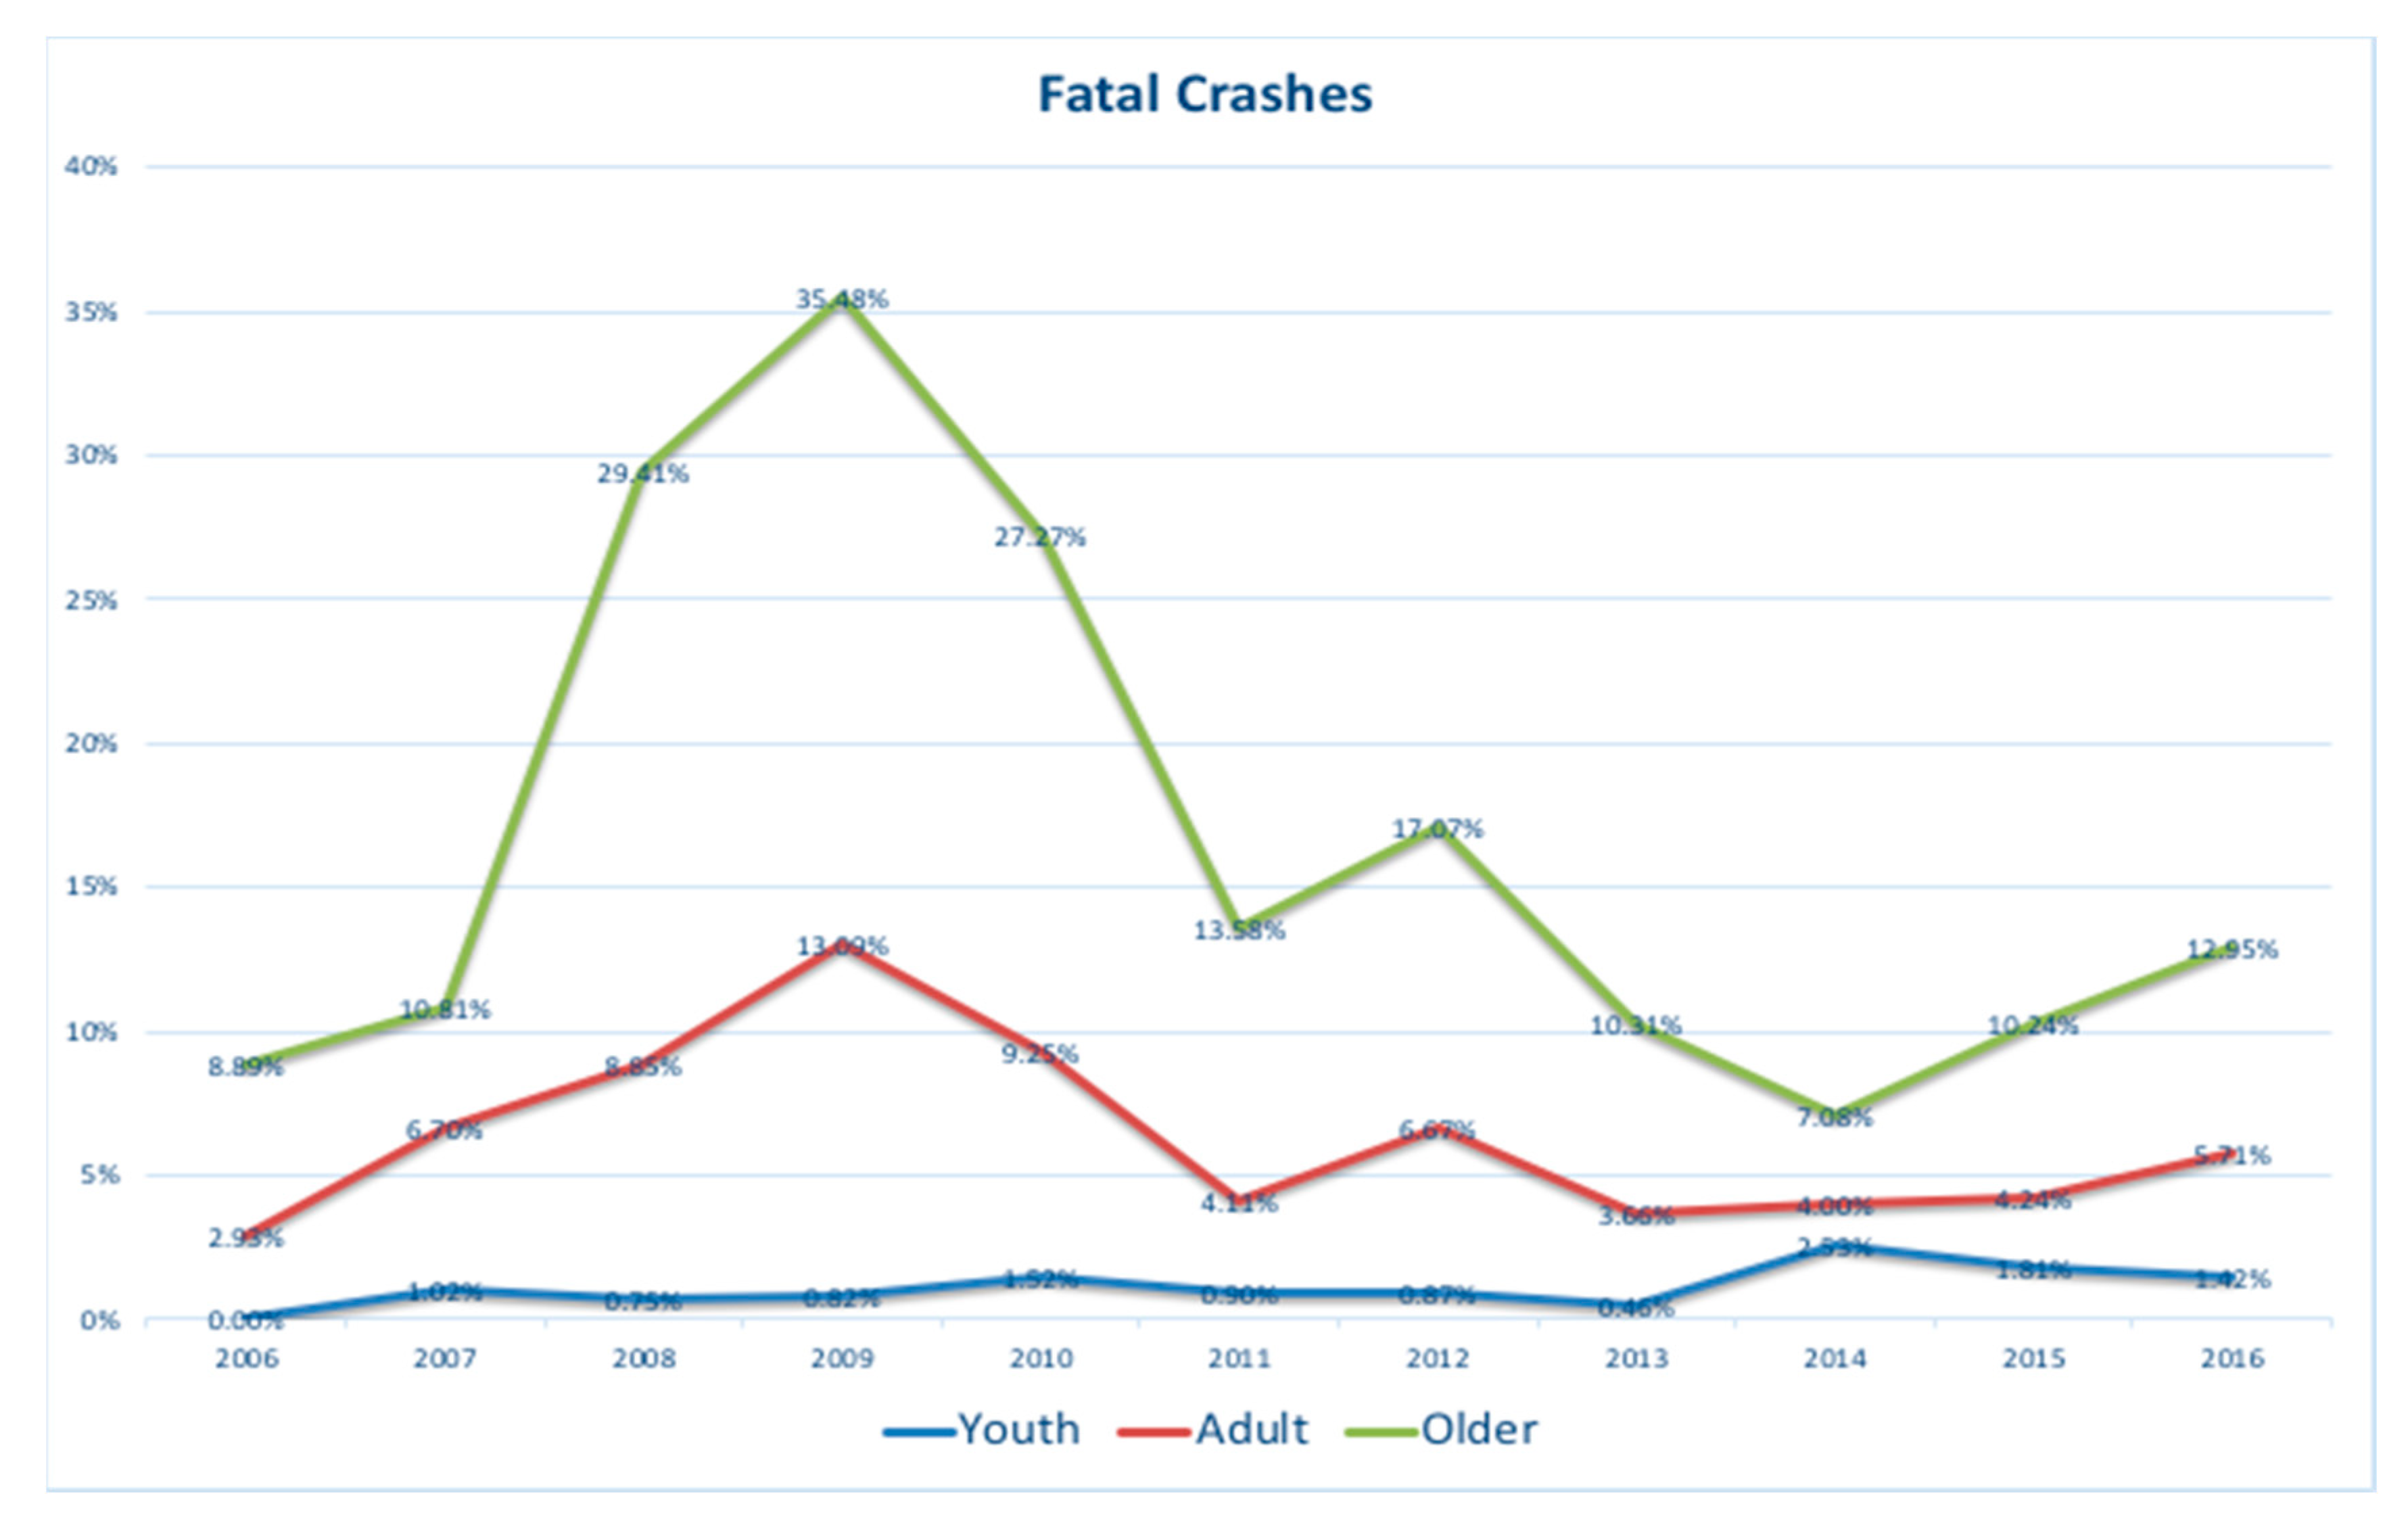
Figure 3 shows the proportion trend of the fatal crash in different age groups in the 11 years. The green line indicates that the proportion of older pedestrians’ fatal crashes is higher than in other age groups in the 11 years. Moreover, it reaches a peak in 2008, 2009, and 2010, then the proportion of fatal crashes decreased in the next few years. Since 2015, the ratio of the fatal crash of older pedestrians has gradually increased.
This study focuses on older pedestrians because of its high proportion of fatal crashes. After data selection, the 856 traffic crashes of older pedestrians are explored and analyzed.
Figure 4 shows the number of crashes with different levels of severity of older pedestrian crashes.
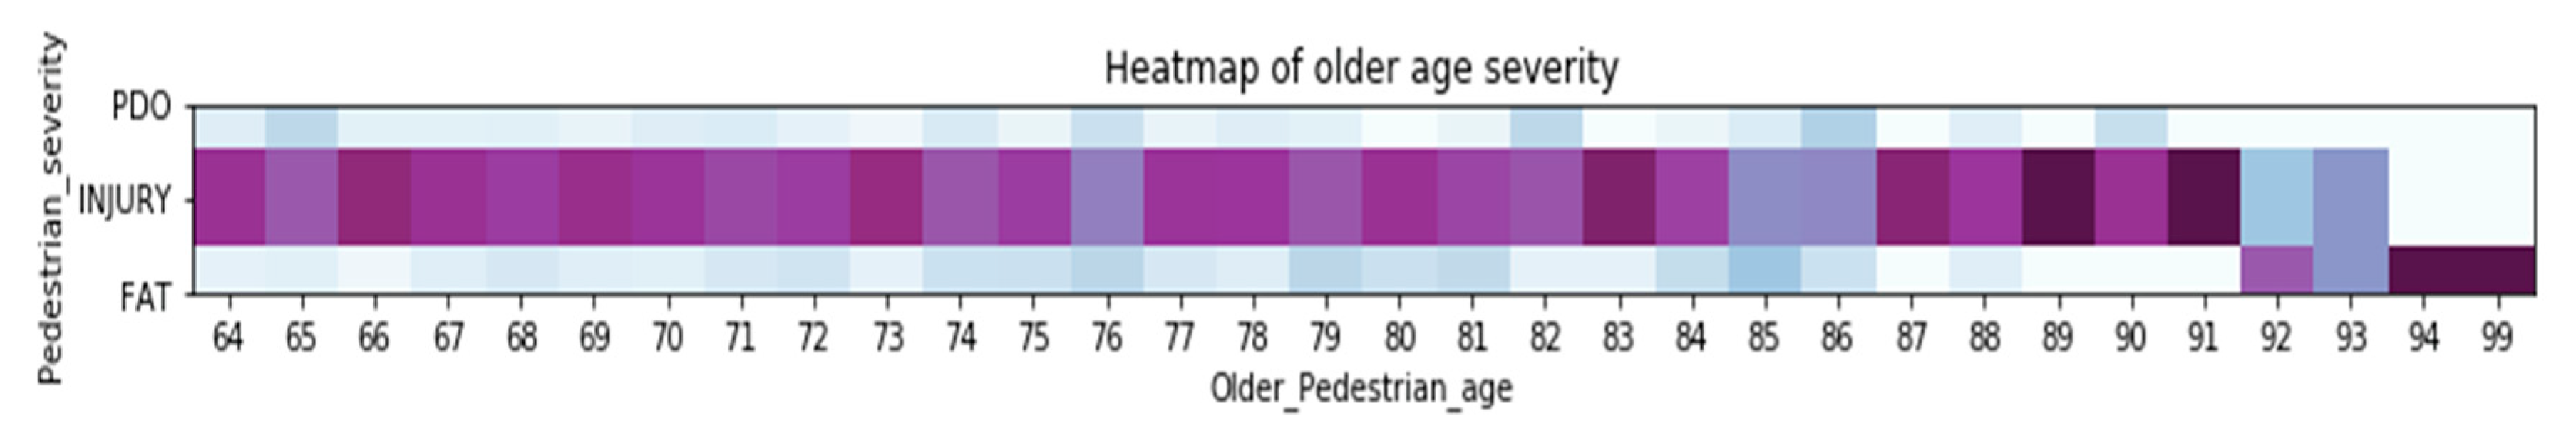
Figure 5 shows the proportion of crash severity in different ages. The severity levels are classified as: Property damage only(PDO), Injury, Fatal in this study. Almost every time older pedestrians involved in a crash, the severity level of this crash was injury or fatality, which means that the older pedestrians are vulnerable and need protection.
In the data of older pedestrian crashes, the driver age, pedestrian age, vehicle speed, pedestrian speed, and the number of people in the crash are continuous variables. Other features are categorical variables shown in
Table 1.
4. Methodology
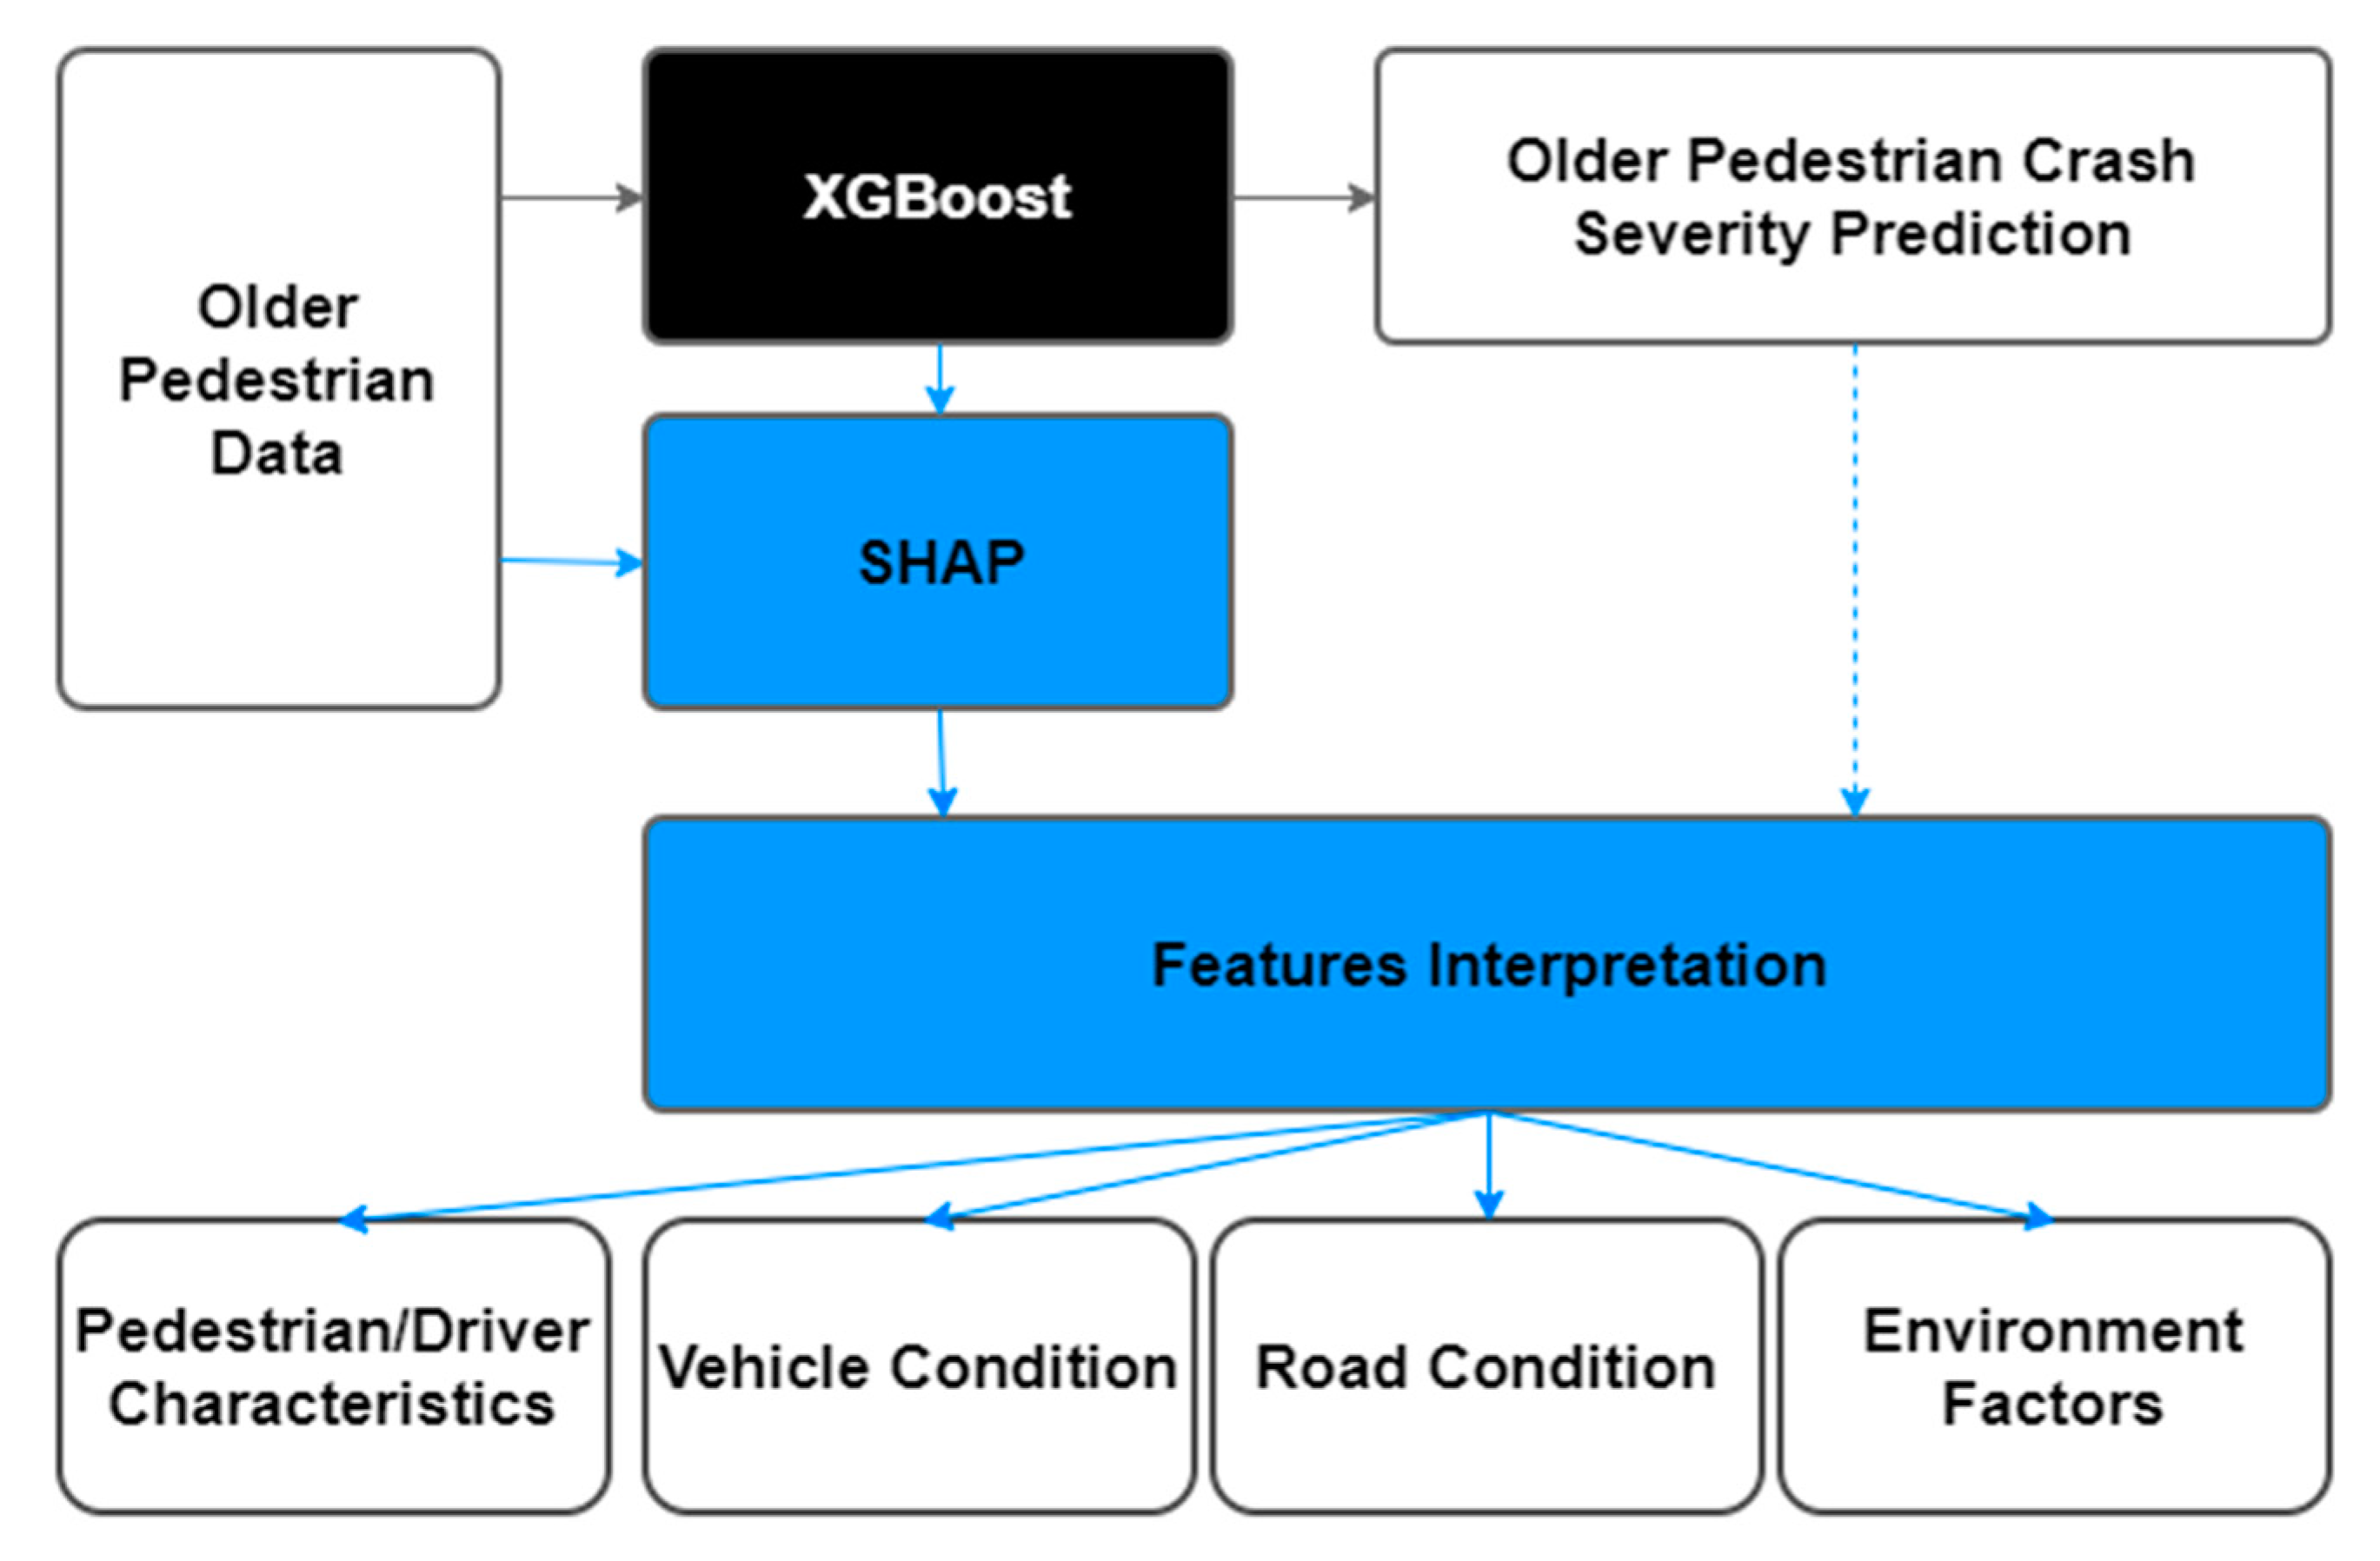
Based on the data procession, the method flow chart of this study is proposed and is shown in
Figure 6.
This study is modeled using XGBoost. Additionally, SHAP is used to interpret the XGBoost result. It can precisely calculate the correlation between each feature and the older pedestrian crash severity level and provide a qualified summary for the researchers.
4.1. XGBoost
The machine learning algorithm adopted in this paper is a further optimized and improved method based on the Gradient Boosting Method (G.B.M.): Extreme Gradient Boost (XGBoost) [
40].
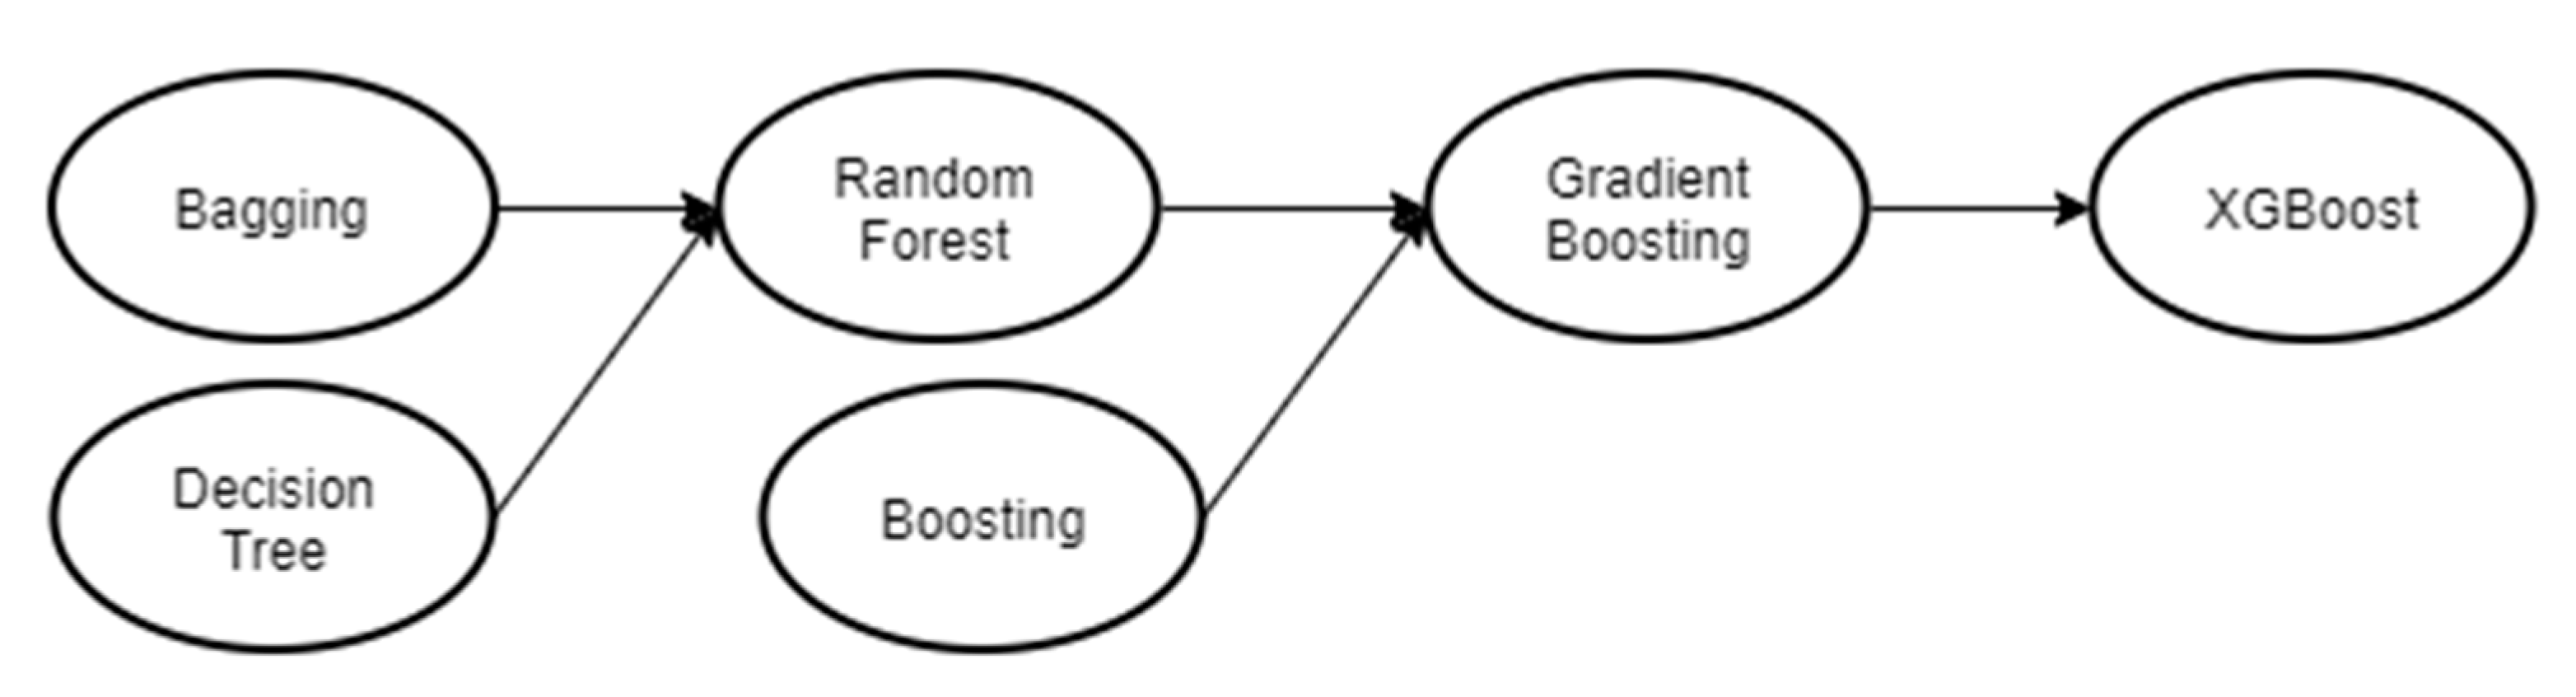
Figure 7 shows the evolution of the XGBoost algorithm. All the algorithms shown in
Figure 2 are based on the Decision Tree. The Decision Tree is a single system making decisions based on all data features. While the Decision tree is a single system that makes decisions based on all data features, the Bagging method joins the voting process to multiple decision trees, improving on them. Then Random Forest combines the advantages of Bagging and Decision trees but makes decisions based on a subset of randomly selected features. On this basis, Gradient Boosting Method (G.B.M.) forms a powerful tree-based learner through continuous iterations of the gradient optimization algorithm. The result is XGboost, which builds on the combination of software and hardware optimization techniques, is more powerful, faster than other GBM.s, and is capable of both regression and classification problems.
XGBoost is an addition operation composed of
k tree functions shown in Equation (1):
where:
is the predicted older crash severity after iterations by adding one tree function to the predicted value of iteration corresponding to th crashes.
is the number of additive trees.
is the number of iterations.
is the tree function of the older pedestrian variables .
is the predicted response value from the last iteration.
is the tree function in iteration.
The objective function of the process shown in Equation (2) is to minimize the loss
with regularization term
to reduce the complexity and prevent overfitting.
where:
is the number of leaves.
is the norm of leaf scores.
is the total number of older pedestrian crashes in sample data.
To use traditional optimization techniques, XGBoost implemented Taylor approximation to transform the objective function to the Euclidean domain, as shown in Equation (3).
where:
is the first-order gradient statistic on the loss function;
is the second-order gradient statistic on the loss function; and,
, are already known as the sum of the first-order gradient and the second-order gradient of loss function.
Then, by solving Equation (3), the optimal value can be calculated for . The smaller , the better the tree model.
The gain of one split at one leaf is shown in Equation (4).
where:
are the sum of the first-order gradient of loss function on the left and right leaf of the split, respectively; and,
are the sum of the second-order gradient of loss function on the left and right leaf of the split, respectively.
The tree structure will continue to split if is positive or some other criteria are satisfied, such as the max depth of a tree and minimum child weight that users require in XGBoost parameters tuning.
4.2. SHAP
SHAP (Shapley additive explanations) [
51], using the principle of data visualization and looking at how different features will influence the probability of event occurrence in a large sample with a new model for further analysis and present the results by intuitive plots. SHAP detects how the input data changes the underlying probability prediction result by changing its value line by line, recombining, and keeping other conditions the same, which results in a marginal probability of each input feature. The traditional feature importance only tells which part is important, but it is not clear how it affects the prediction results. The most significant advantage of SHAP interpretation is that SHAP can reflect the influence of features in each sample, and it also shows the positive and negative effects.
Inspired by cooperative game theory, SHAP constructed an additive explanatory model in which all features are defined as “contributors.” For each predicted older pedestrian crash severity, the model generates an expected value. The SHAP value, which is expressed by Equation (5), is the value assigned to each feature in the sample.
Suppose older crash is, the feature of the older crash sample is , the predicted value of the model for this sample is , and the baseline of the entire model is , is SHAP value of , which is the contribution of the older pedestrian crash feature in the older crash to the final predicted value. Each older-related feature’s SHAP value represents the change of predicted probability by the interpreted model based on this feature. In each function, the SHAP value describes each feature’s contribution to illustrate the difference between the average model prediction of the sample and the actual prediction. indicates that this feature increases the predicted probability, and conversely, it suggests that this feature has a negative contribution.
4.3. Comparison between Multinomial Logistic Regression and Xgboost Model
Multinomial Logistic regression (MNL) is implemented in this study to compare with XGBoost. It relies on the assumption of independence of irrelevant alternatives (IIAs), which is not always desirable in real-world data [
52]. Although there is no need for those independent variables to be statistically independent from each other, the multicollinearity should be low enough for MNL to differentiate the impact of different variables, which is also challenging to achieve in this study [
53]. Severe multicollinearity is a problem because it can increase the variance of the coefficient estimates and make the estimates sensitive to any small changes in the model, which makes MNL unstable and hard to interpret.
Then, in our study, we implemented XGBoost to solve this problem. XGBoost can handle the possible multicollinearity of the input data and has no restriction on IIAs, because XGBoost is a tree-based model that is inherently immune to multicollinearity. For example, suppose we have two 99% correlated features when deciding upon a split during a tree-based model building process. In that case, the tree will choose only one of them to avoid the multicollinearity problem. Other models, such as Logistic regression, would use both the features.
So, the problem of independent assumptions with the MNL is fundamentally solved, which also approves that XGBoost is more capable of multidimensional data.
5. Results and Analysis
The following sections are XGBoost modeling result, model performance, model interpretation, and feature analysis.
5.1. XGBoost Model
XGBoost modeling is processed in Jupyter lab using python coding, 80% of the randomly selected data was used to train the model, and 20% of the data was used to test the model.
XGBoost traverses the entire data set, finding the right separation point, which has the largest to split the tree. Through continuous iterations, the result after training is finally obtained.
A baseline model’s accuracy shown in
Table 2 is introduced as one of the benchmark values to verify the necessity of a higher performance model. The baseline model’s accuracy is the accuracy of the test dataset when all the prediction results are the most frequently occurring level in the training dataset. If the newly built model’s accuracy is lower than the benchmark, there is no need to accept and apply the new model. On the contrary, if the freshly made model’s accuracy is significantly higher than the baseline model’s accuracy, it is proved that the newly built one, which has the higher precision, is necessary for this study. In this study, the XGBoost final prediction accuracy for the severity classification of older pedestrian crashes is 80.35%. The baseline accuracy was 69.94%. The feasibility of XGBoost modeling is illustrated.
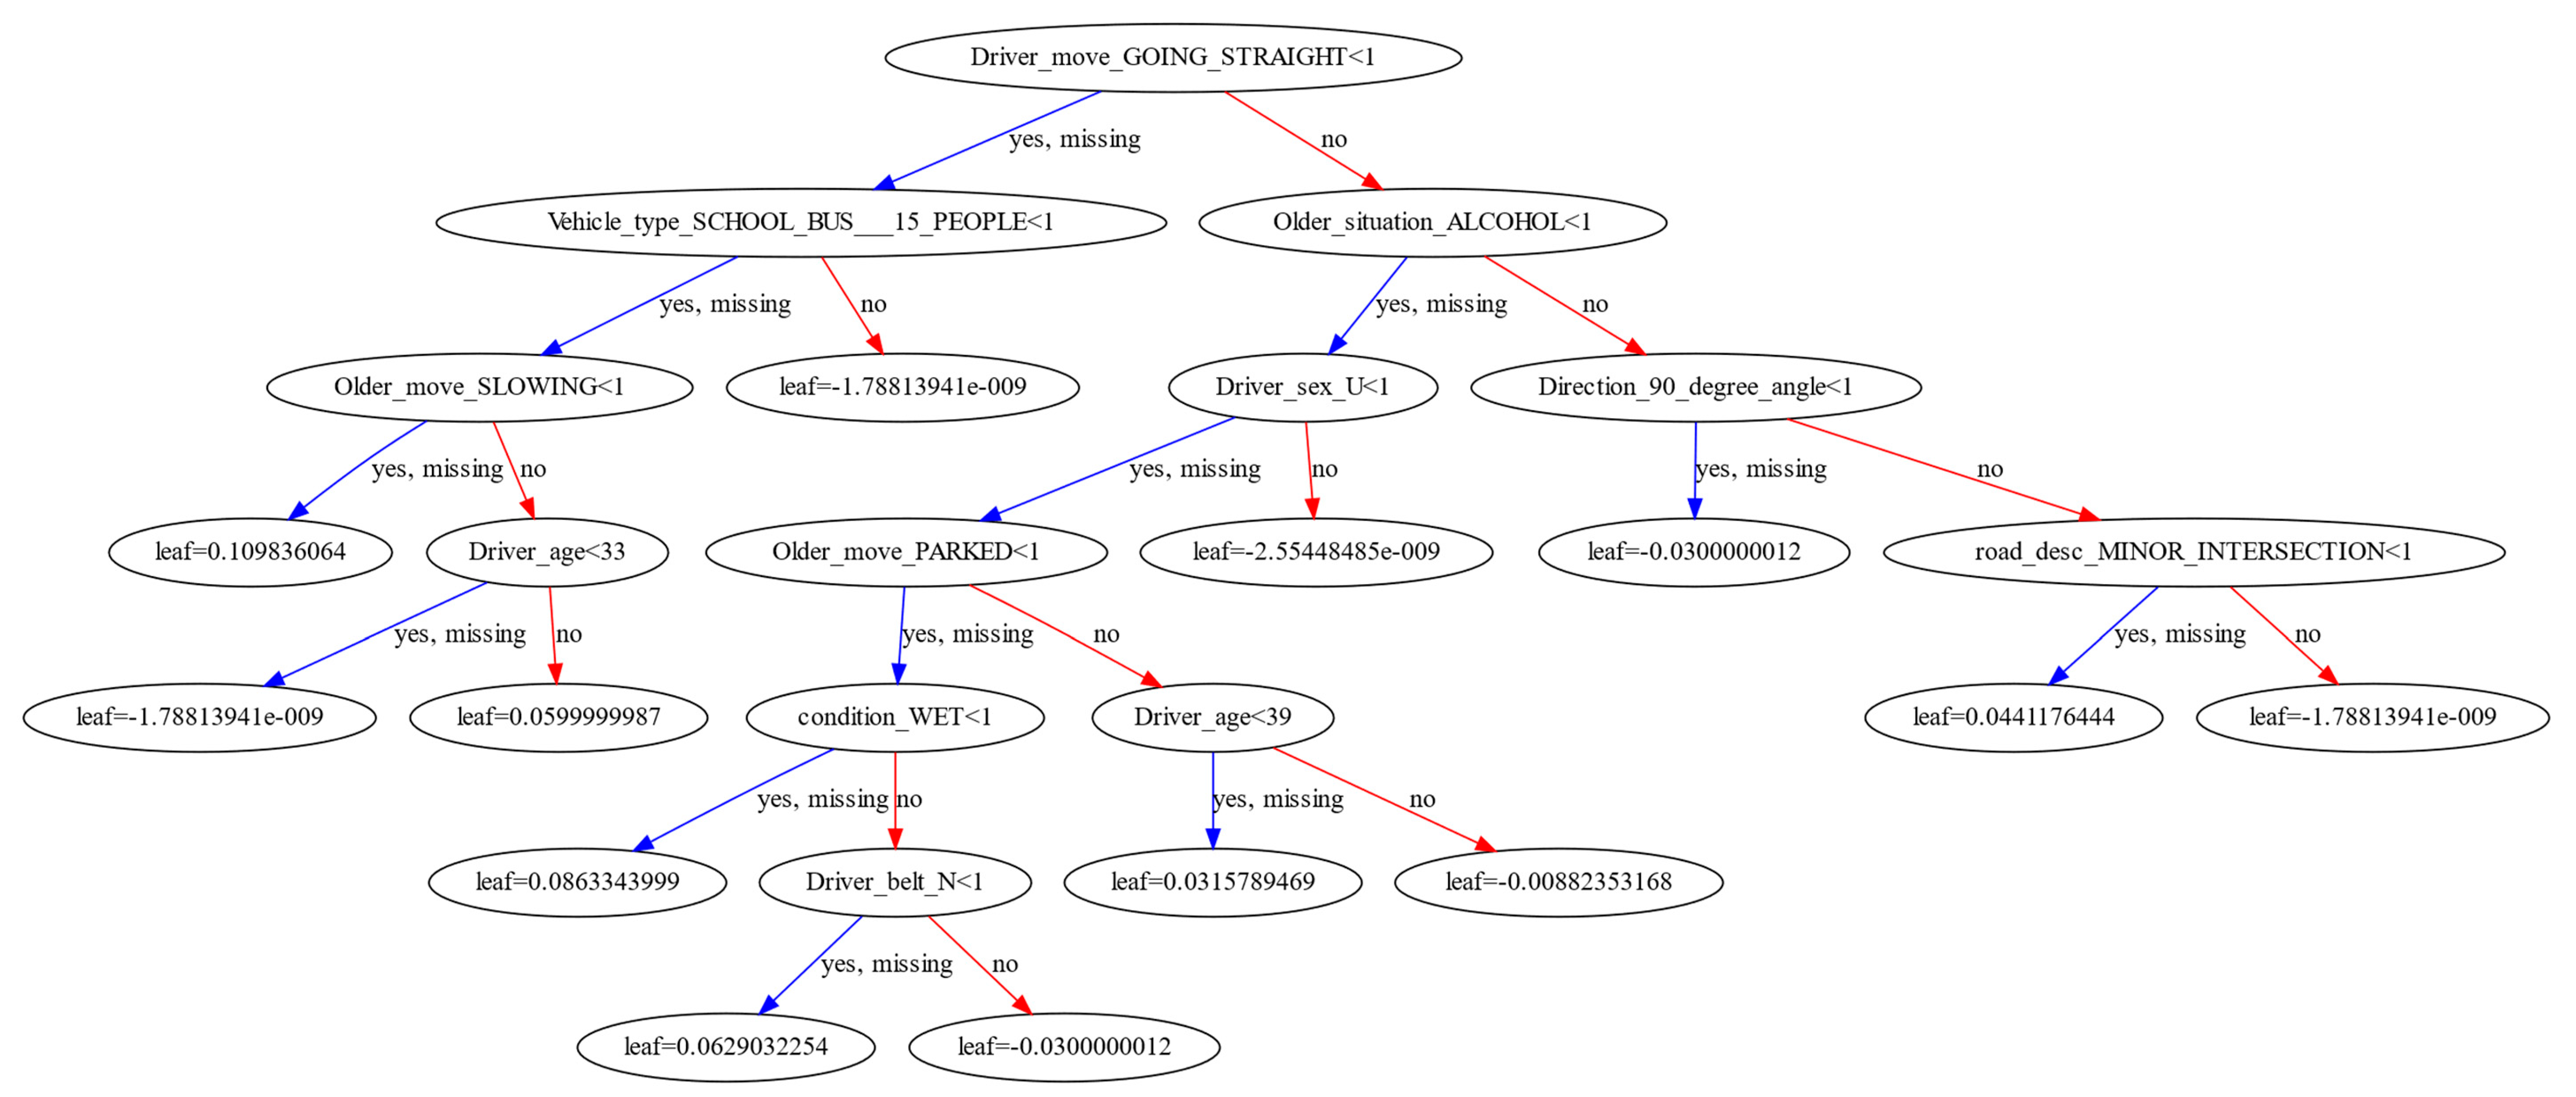
The severity levels in the model are classified as 0: INJURY 1: FATAL 2: PDO. The tree structure of the final iteration is shown in
Appendix A. The final tree shows how XGBoost learning from the older pedestrian data and split the whole tree. It also shows that different nodes have different leaves with correlated features.
During the modeling process, XGBoost requires more hyperparameters tuning for precision, conservativeness, and overfitting prevention. The series of parameters used in XGBoost after tuning in this study are shown in
Table 3.
Besides, this paper uses the multinomial Logistic model’s accuracy as another benchmark and compares it with XGBoost accuracy. The accuracy of the Multinomial Logistic model shown in
Table 2 is 72.89%, which is lower than the accuracy of XGBoost, which shows the superiority of XGBoost.
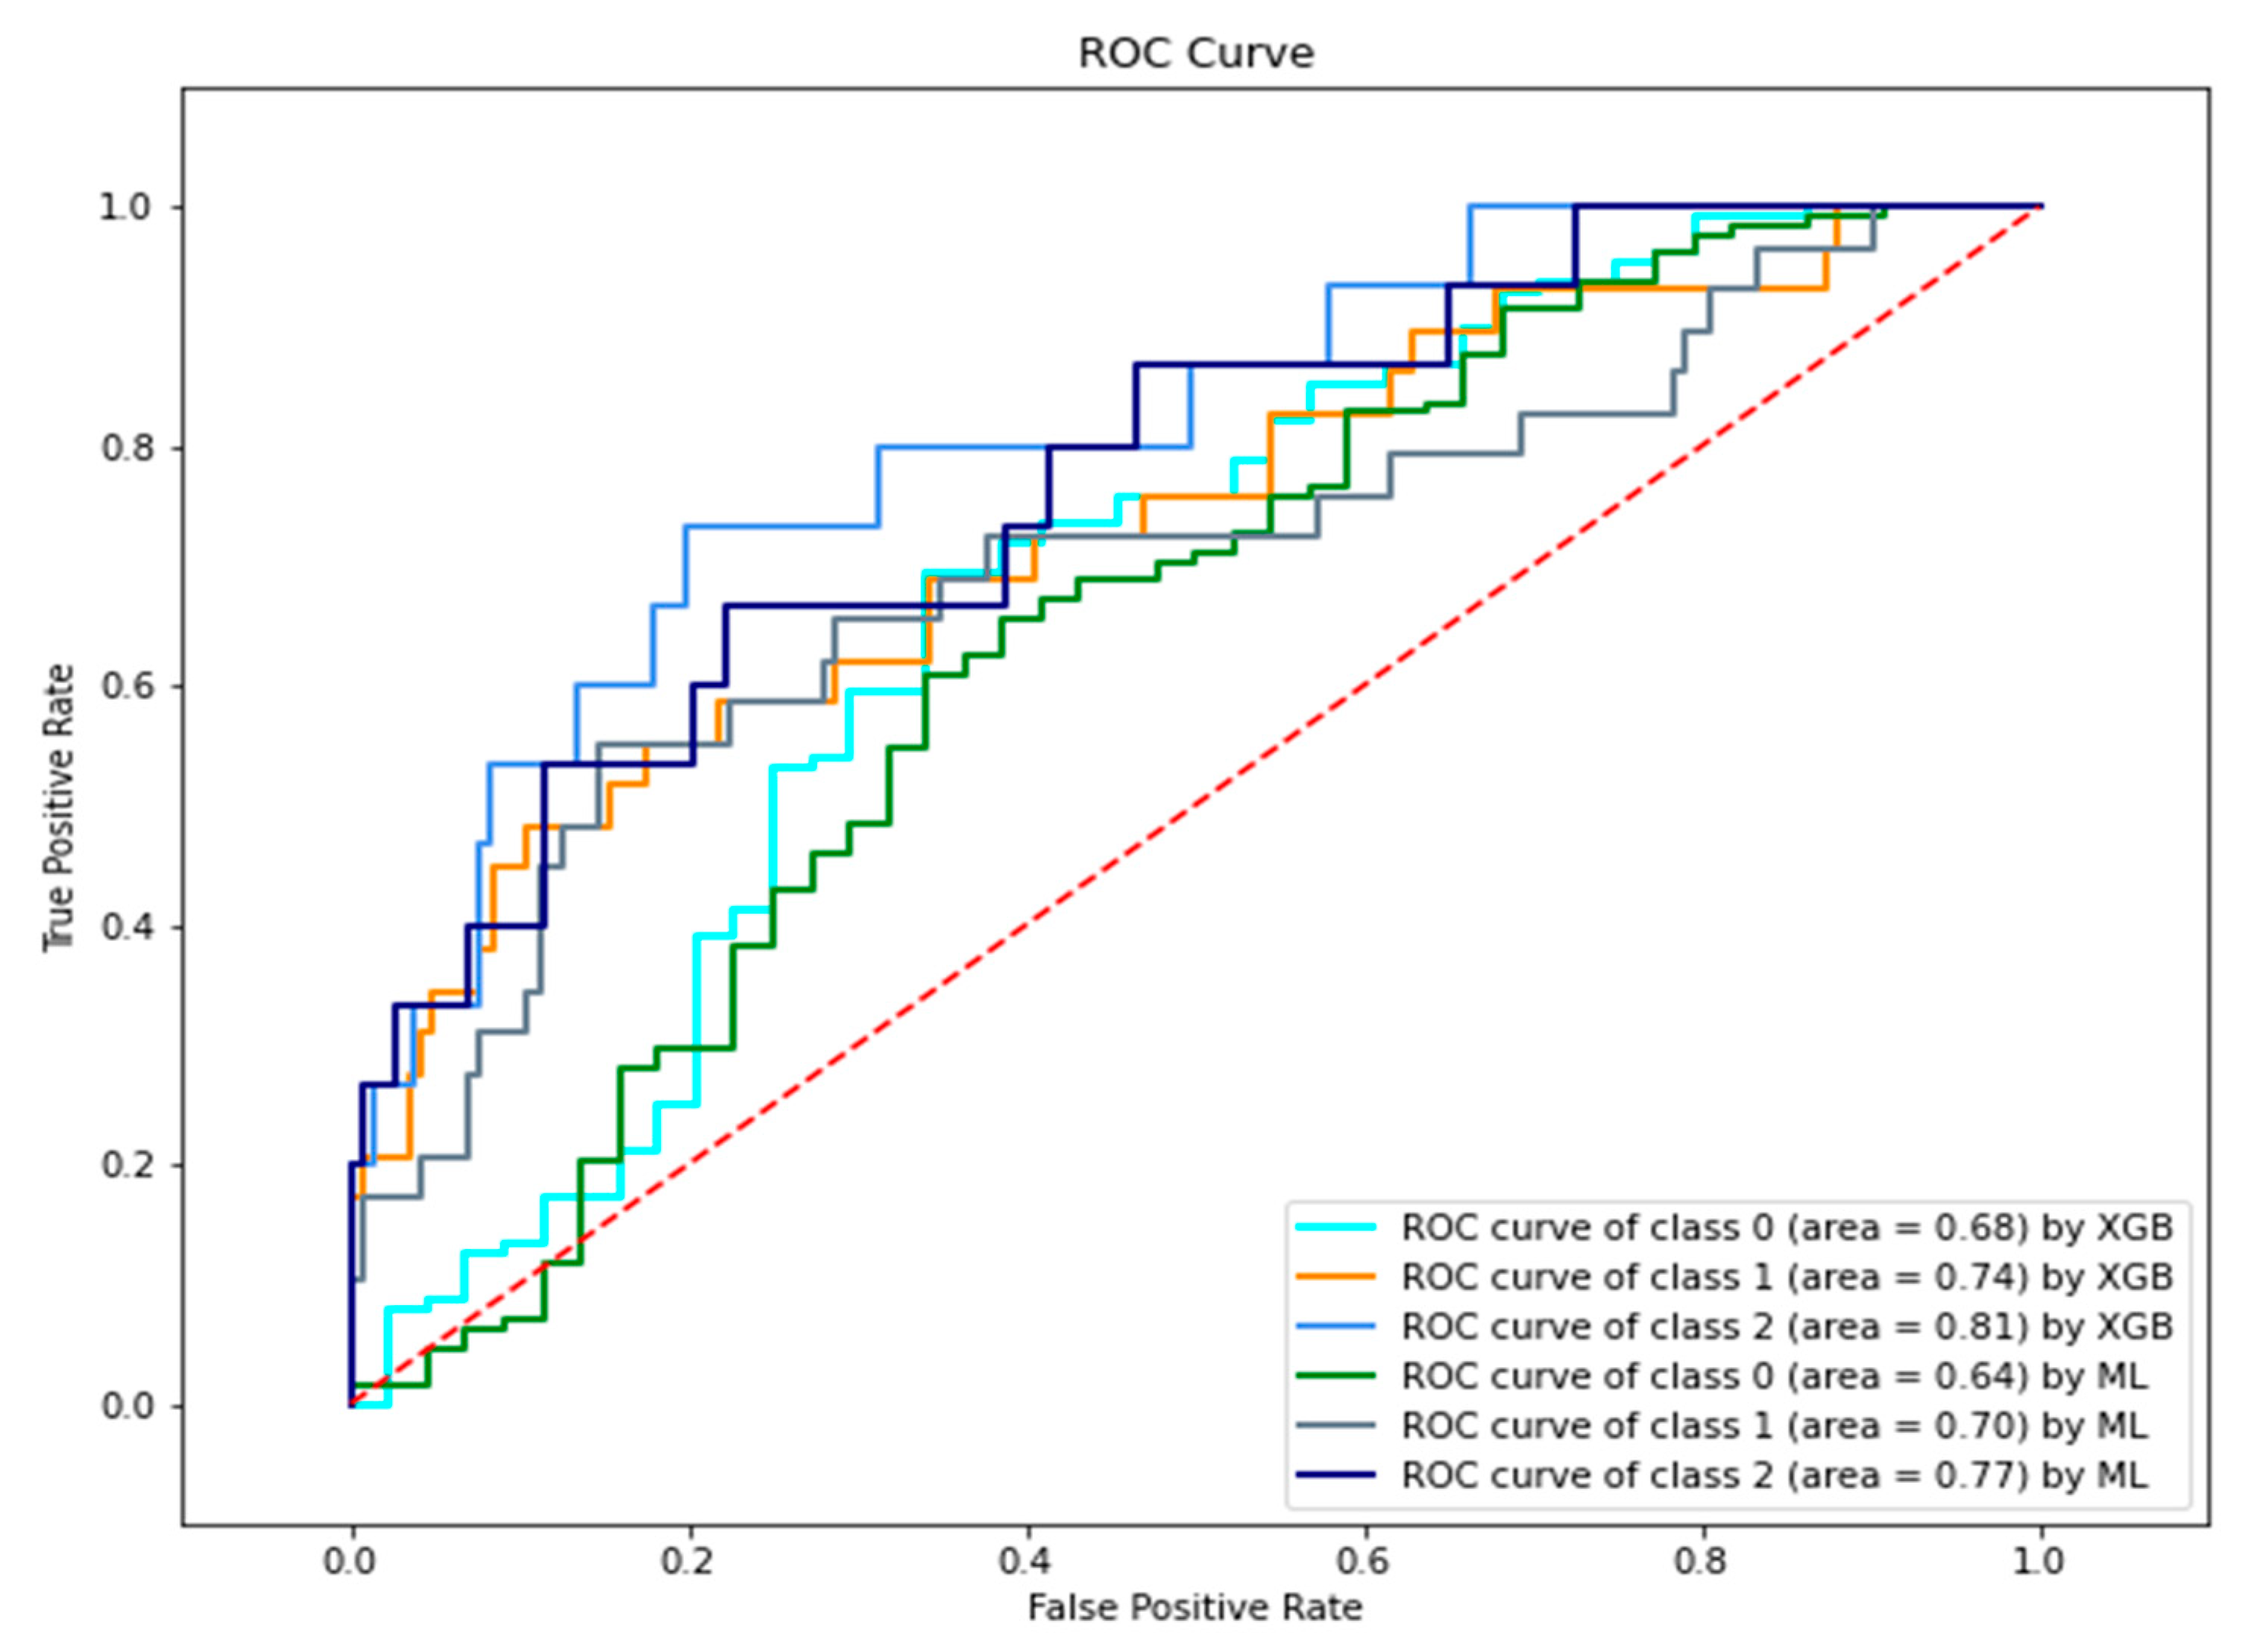
5.2. ROC Test
Accuracy is the most commonly used indicator of model performance, which focuses on the effectiveness of the prediction results. Usually, the accuracy is directly used as the evaluation benchmark of the model. However, in some specific situations, when the distribution of the response variable in the sample data is unbalanced, like when the older fatal crashes usually occur less than other types of crashes, accuracy has certain limitations. That means the accuracy is not a perfect performance metric. ROC (Receiver Operating Characteristic) is introduced as a better metric to represent the classification performance of models in this study. The ROC curve is plotted with the true positive rate (TPR) against the false positive rate (FPR), where TPR is on the y-axis and FPR is on the x-axis. It indicates how capable the model is in distinguishing between classes. The curve that is closer to the upper left corner, its corresponding model has a better classification prediction ability. Then, the area (AUC) in
Figure 8 measures the entire two-dimensional area underneath the entire ROC curve.
ROC and AUC indicate the classification performance of the model. They consider the model’s ability to classify positive and negative classes, to make a reasonable assessment of the model.
Figure 8 shows the ROC curve of the XGBoost prediction model based on the model prediction results. The multinomial logistic model RO is also calculated to compare with XGboost. Overall, the XGboost model ROC results are better than the multinomial logistic model. The AUC for older pedestrian injury crashes by XGboost is 68%, which means there is 68% chance that the model can distinguish the injury level crash and non-injury crashes. Furthermore, the AUC of the older pedestrian fatal crashes is 74% from XGBoost, and the AUC by the multinomial logistic model is 70%. Lastly, the AUC of older pedestrian PDO by the XGboost model is 81%, while the multinomial logistic model is 77%.
Table 2 shows the model performance metrics comparison, including accuracy and AUC. In both accuracy and AUC, XGBoost is dominated in this study.
5.3. Feature Importance Discussion for MNL Model and XGBoost Model
Table 4 compares important features of older pedestrian fatal level crashes modeled by MNL, XGBoost, and some other existing studies. In this table, the estimated coefficients from MNL, which indicate the directional contribution of one unit increment of different features to the utility of the fatal level crash, are shown as Log odds. XGBoost itself does not have the interpretability to figure out the contribution or importance of a feature. That is the motivation we used SHAP to interpret XGBoost. SHAP introduced the marginal contribution of different features by game theory. For different observations, even the same value of one feature has a different contribution to the output because it is marginal.
First, it is very hard to compare the magnitude of feature impact from MNL and XGBoost, because they have entirely different definitions. Other than that, we can compare the identified factors between both models.
The driver speed, number of crashes people, older age, driver age, and older speed are all important features that significantly influence the occurrence of a fatal level pedestrian crash from both models. This means those two models are able to find and catch some of the basic and important factors. However, MNL introduced the light condition (Dark-lighted, Dark-Unlighted, and Dawn/Dusk) as important features, while XGBoost considered driver demographic (driver age, gender), vehicle (vehicle movement, vehicle type), and pedestrian (pedestrian movement). This is because the algorithm and the structure behind both models are different. MNL uses the maximum likelihood algorithm to estimate the effect of each feature, and the structure of MNL is inherently a non-linear model. XGBoost is a data learning process from one iteration to another iteration with the gradient descent algorithm to minimize the error in every iteration and ensemble them to get the optimal result. Moreover, XGBoost is a tree-based model.
Another reason that they have different important features is that their data extraction performance is different. By comparing model accuracy and AUC in
Table 2, XGBoost offers better capability than MNL model and is more precise. So, XGBoost can extract the information that MNL failed to extract from the data.
Then, the important features cited from previous studies can be described as the combination of the result of MNL and XGBoost. They have some other features like road features, residential environment, and diversity of facilities. Those features are worth to analyze in our future study.
Overall, the two models show consistency in analyzing some important features, while XGBoost shows higher performance in extracting information from multidimensional data.
5.4. SHAP for Model Explanation and Discussion
5.4.1. Overall SHAP Results and Discussion
In the above section, the overall accuracy of XGBoost is verified, which indicates that the XGBoost model has strong model effectiveness. Most of the machine learning algorithms, including XGBoost, suffer from criticism on their interpretability, which is hard to explain feature importance and eigenvalues contributions for the model. Therefore, a further interpretation of XGBoost model results such as permutation importance, partial dependence plots by SHAP is implemented in this study. For a tree-based prediction model, including XGBoost, the feature’s value contributed to the prediction of this particular instance compared to the average forecast for the dataset is defined as importance or SHAP values. The detailed generation of SHAP value is introduced in the methodology section. In this section, SHAP is used to build an interpreter for all features used in XGBoost and visualize the interpretation of the XGBoost model prediction.
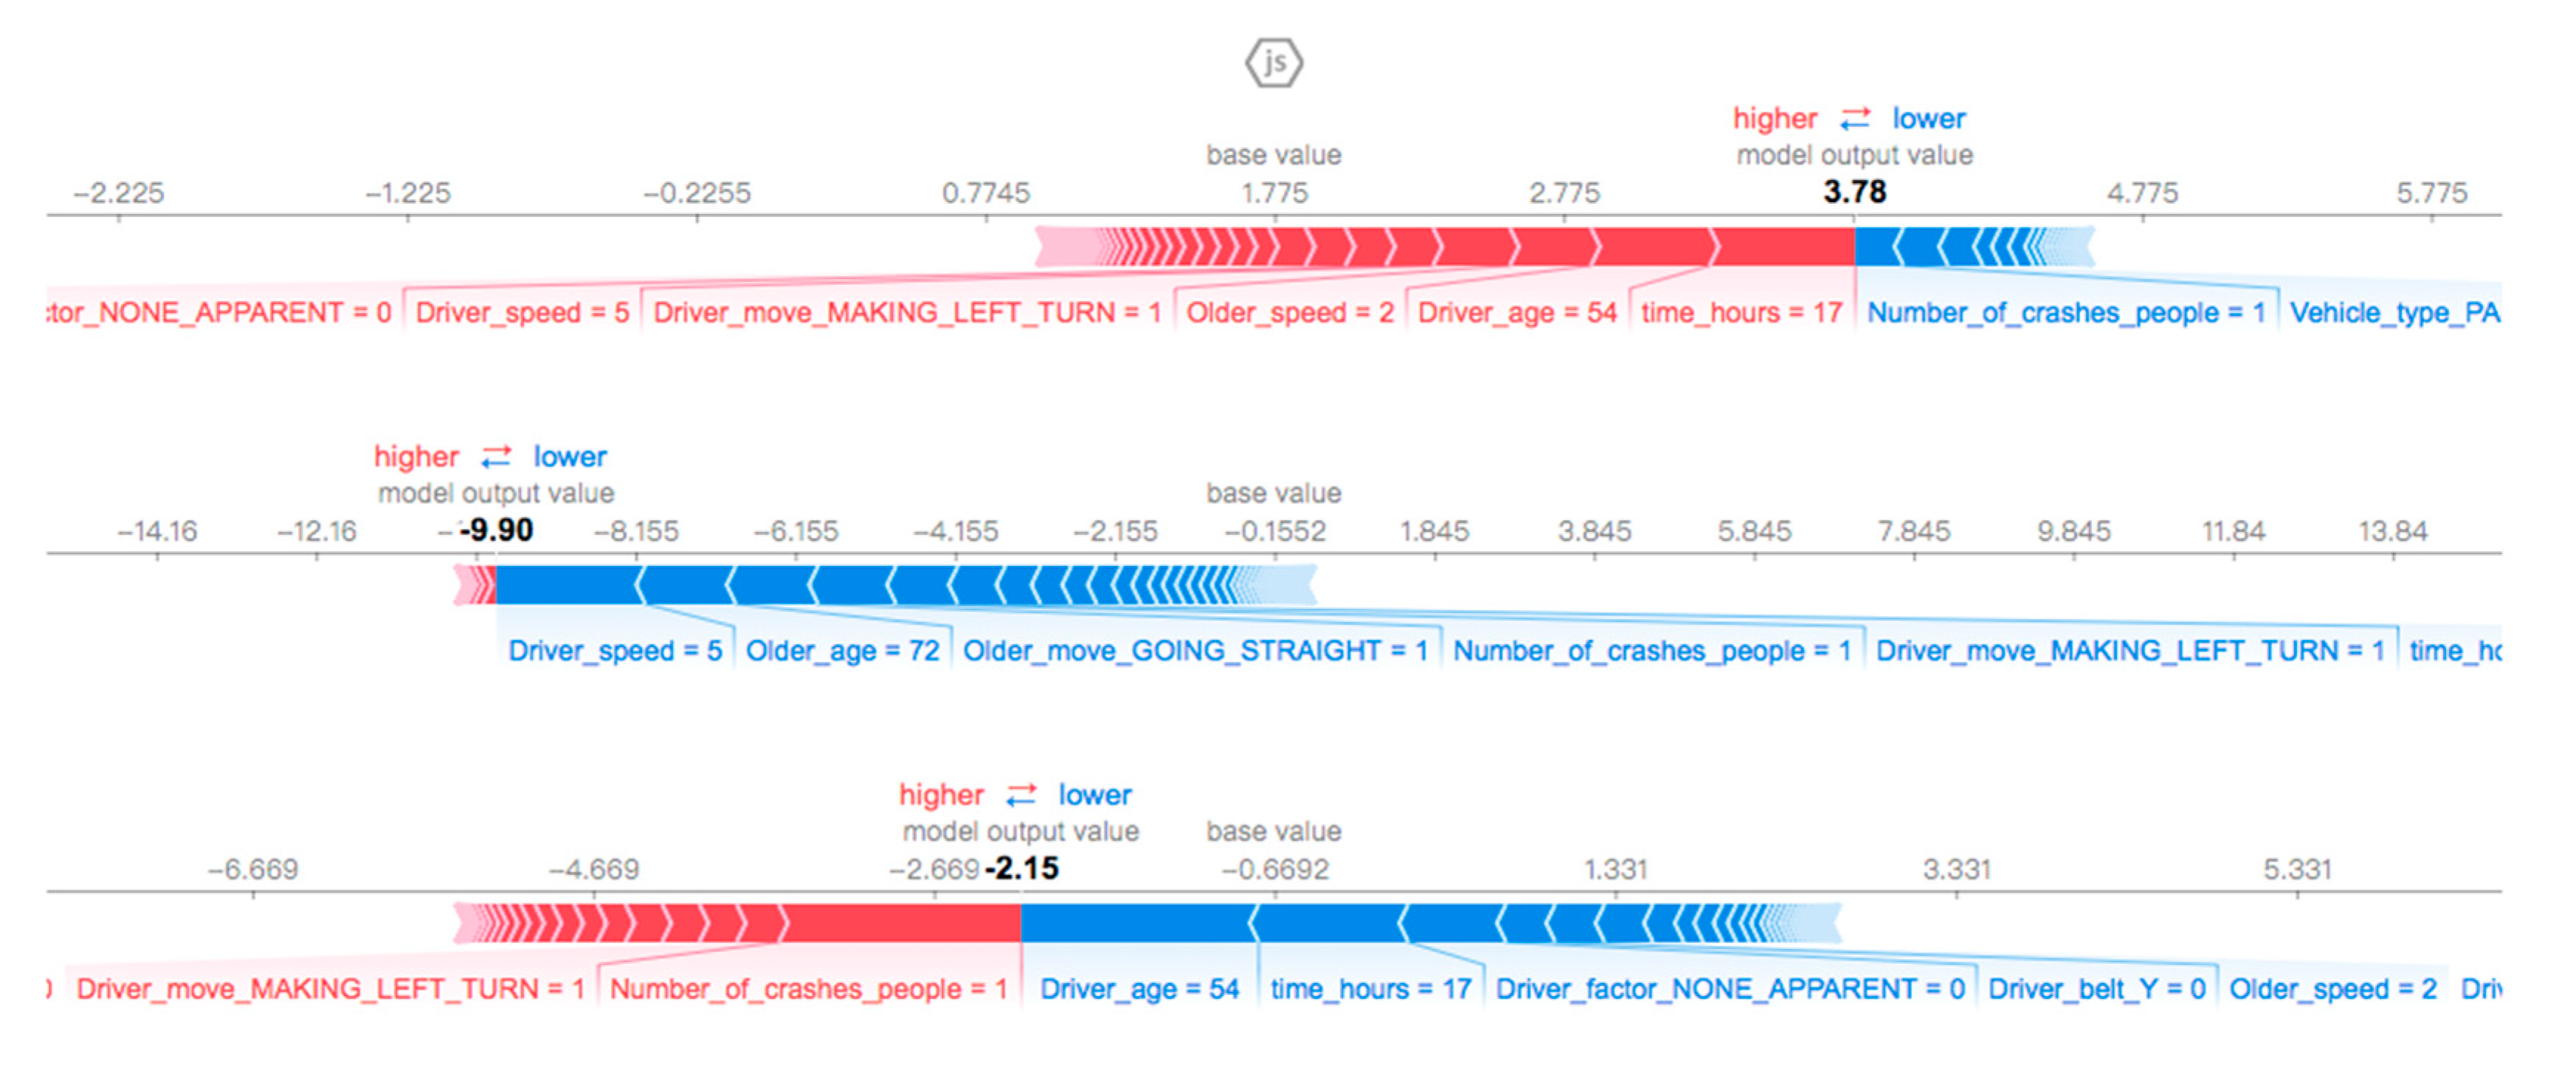
Figure 9 shows the SHAP modeling prediction process trends among the three severity levels of older pedestrian crashes. The prediction result shows separately through the first line to the third line and represents injury, fatal, and PDO. The base value 1.775 in the first axis is the base logit value for the injury level over the training dataset. Furthermore, the model output value 3.78 is shown as the logit prediction value, which converts to a probability is 97.8%. That means for this particular row of predict crash data, the older pedestrian has the possibility of 97.8% going through injury crashes.
SHAP value trends show whether each factor positively or negatively influences a single older pedestrian crash. For example, in the first axis, the time at 17:00 has a positive impact. The number of involved people and passenger car/vans make this particular older pedestrian injury crash less likely to happen. The model output logit value is the combination of the effects of all features. In the older fatal crash prediction situation, when driver speed is 5 miles per hour, it means the older pedestrian has a low probability of being a fatality because of the low rate of the involved vehicle. Besides, on the third axis of
Figure 8, with the driver age of 54, the travel time at 17:00, the driver’s belt use, and the low walking speed of this older pedestrian, the probability of the severity of this older pedestrian crash being PDO is low.
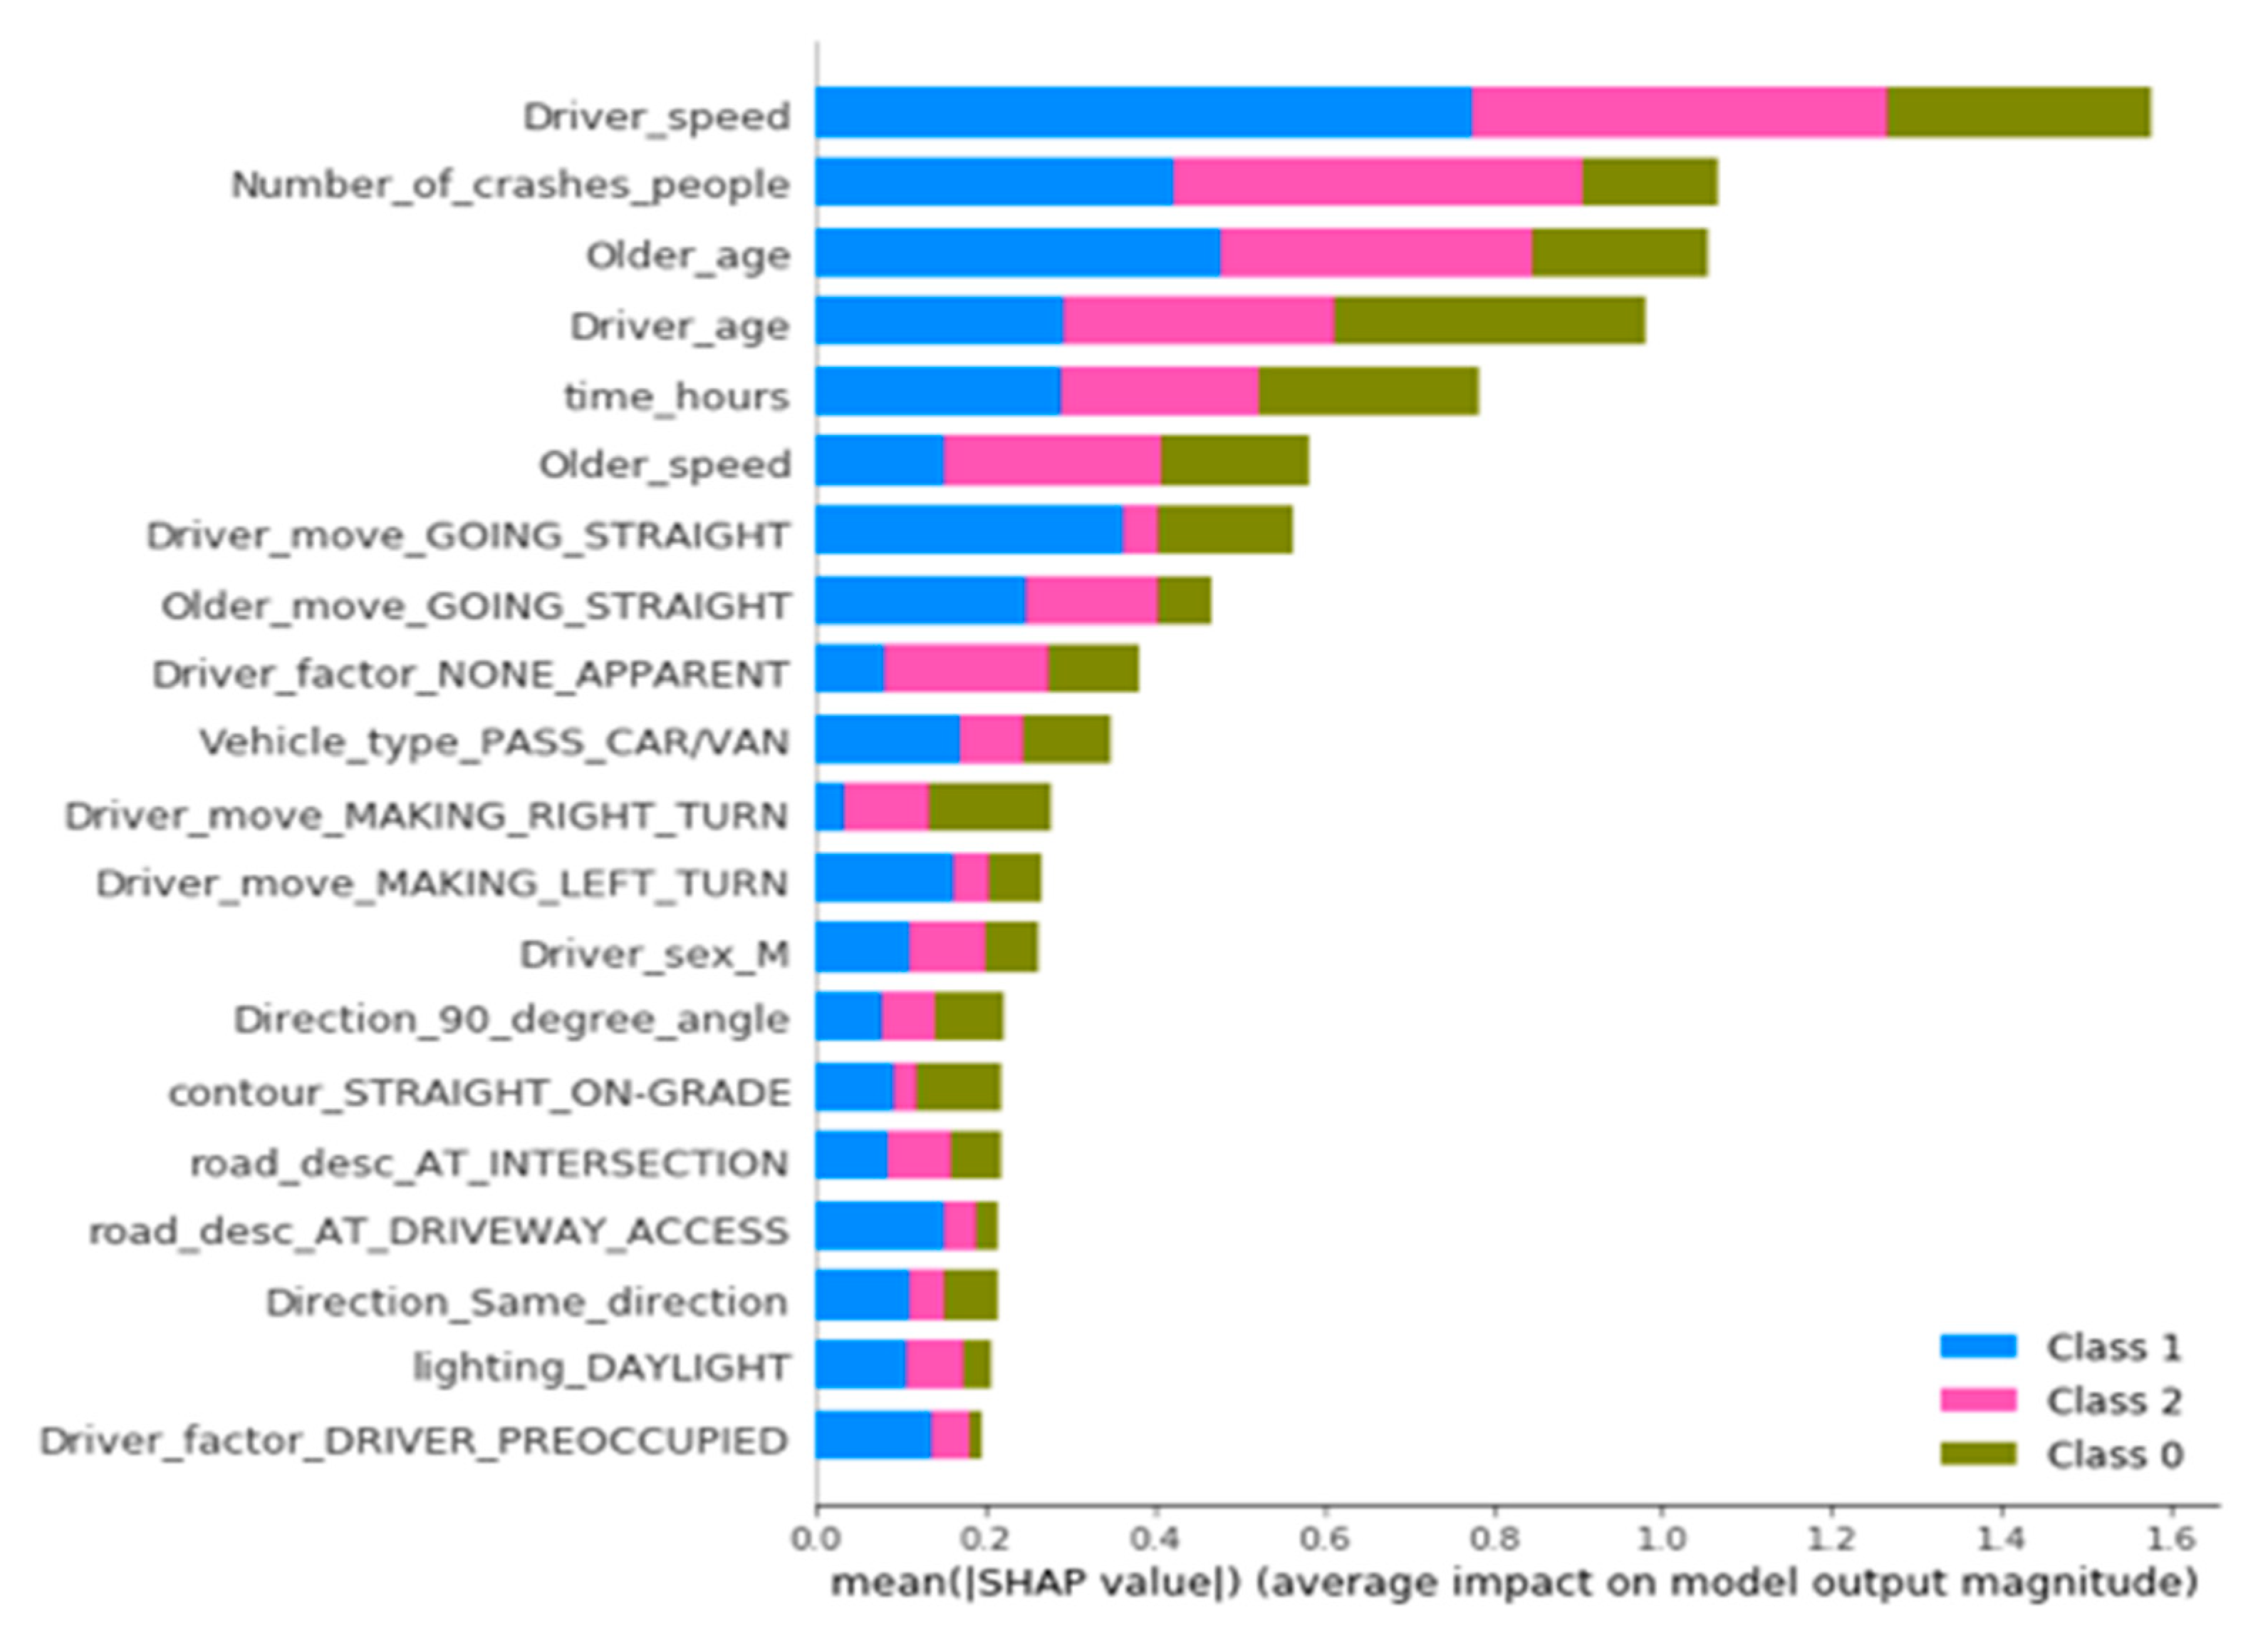
Figure 10 shows the average absolute impact of each feature on the model output magnitude (the top 20 are shown in
Figure 10). The different colors indicate the different severity levels of older pedestrian crashes. For example, the blue bar of Driver speed suggests that the average absolute impact of vehicle speed on fatal older pedestrian crash occurrence is about 0.72, and a more extended bar represents a more significant impact of the corresponding feature on the probability of the related crash severity level. The rank of feature impact is shown in
Figure 10. The driver characteristics, older pedestrian characteristics, vehicle movements such as driver speed, older pedestrian age, and vehicle traveling straight are the most important features affecting the probability of older pedestrian crashes in all severity levels. Some interesting points are also reflected in
Figure 9, like the numbers of people in the collision directly influence older fatal crashes and PDO crashes. Still, there is a small impact on older pedestrian injury crashes. Drivers driving straight ahead had a serious impact on older pedestrian fatalities, while contributing negligibly to older PDO crashes. This may be because when the vehicle is going directly forwards, the speed is usually faster than when it is turning, causing higher severity pedestrian crashes.
5.4.2. SHAP Results of Different Severity Levels
The summary plots of the XGBoost prediction result made by SHAP are shown in
Figure 11,
Figure 12 and
Figure 13 below. Each field represents the impact of the features on the occurrence probability of each severity level of the older pedestrian crash.
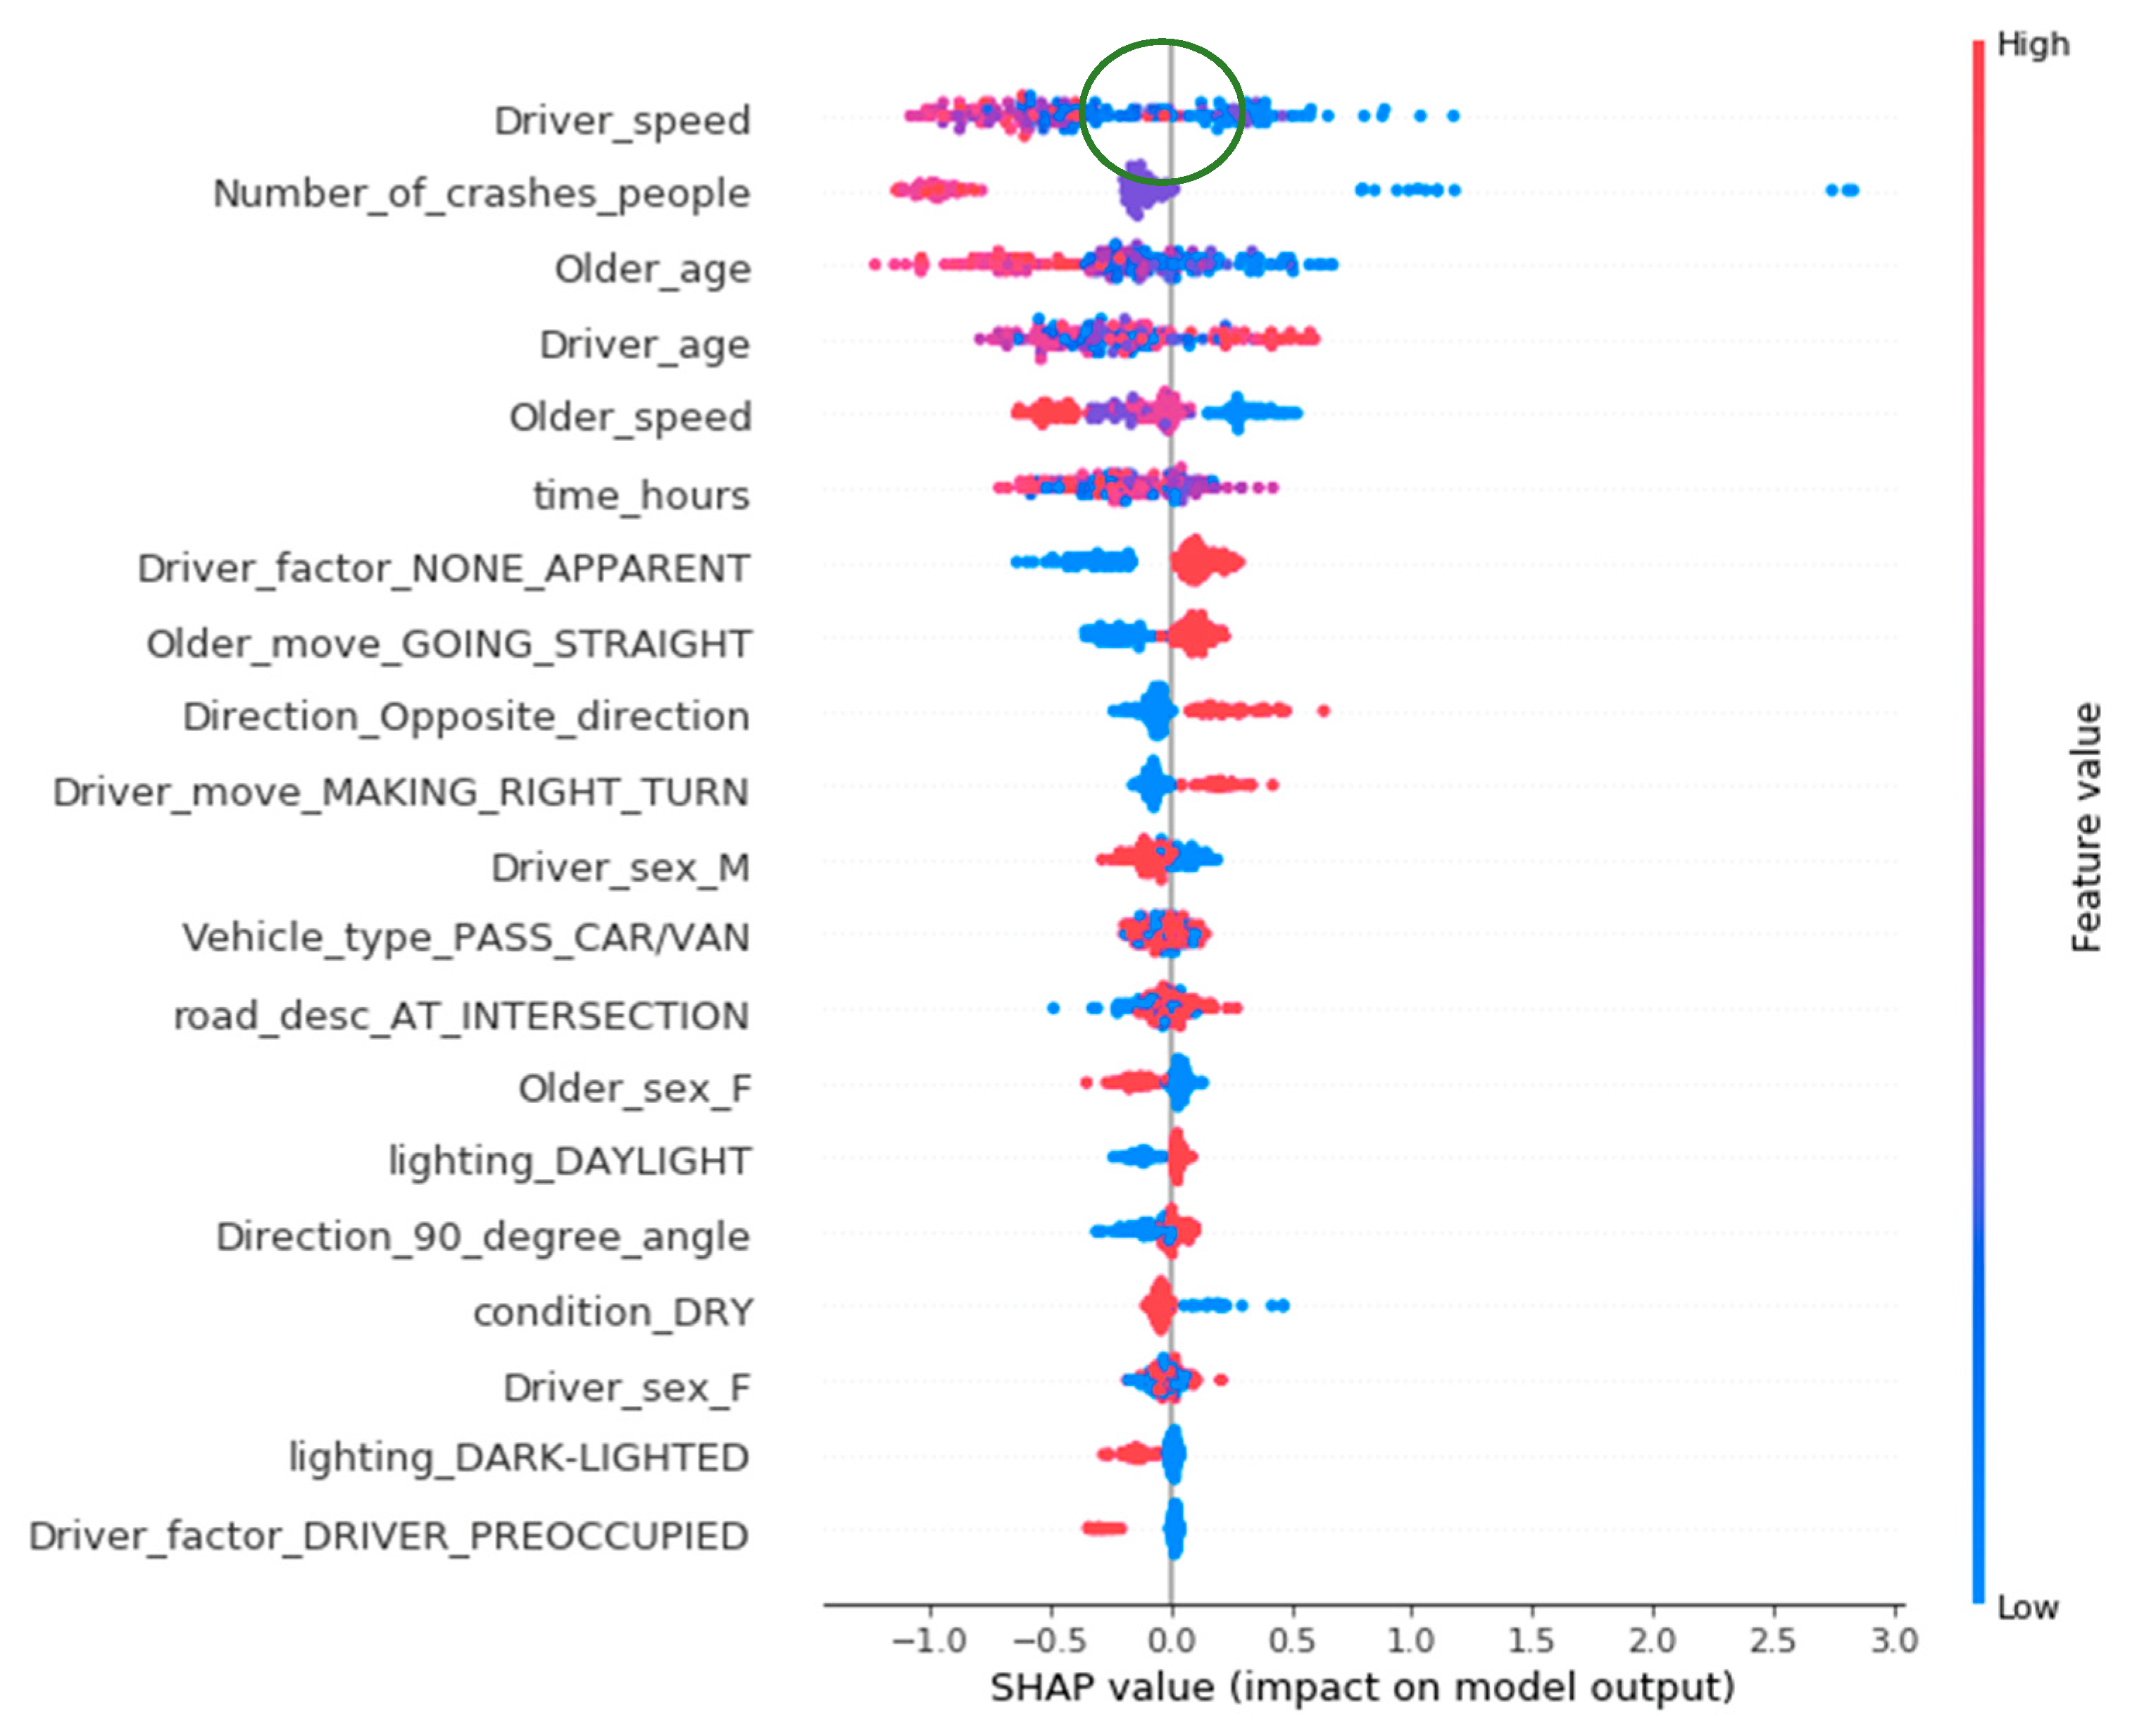
The SHAP values sort the features’ rank on the left side of the y-axis in
Figure 10, which corresponds to the top 20 essential elements. The x-axis is the scale of all data records calculated SHAP values. The color bar on the right side of the y-axis represents the relative value of a particular feature among all the importance of the same feature. Each point in the plot represents one data recording of the corresponding component. For example, the green circled point in
Figure 10 indicates that the low driver speed has a strong positive impact on the occurrence probability of PDO level crash.
Older Pedestrian PDO Crashes
The comprehensive evaluation of feature impact on PDO crashes shows in
Figure 11. In terms of the impact features that have a positive impact on the incidence of PDO crashes, for the traffic participants, the relatively young older pedestrians, the older pedestrian who is walking straight, the older drivers, the drivers who are driving in the opposite direction of pedestrians, and the drivers who are turning right, are more likely to be involved in PDO crashes.
Possible explanations for those findings are that, first, the relatively young older pedestrians react more quickly than other older pedestrians [
12,
17,
55]; second, when walking straight ahead, the pedestrians’ vision is often wider to see the surroundings [
56,
57]; third, the older drivers have longer reaction time, but their driving speed is relatively slow; fourth, when driving in the opposite direction, the drivers can see them coming pedestrian more transparent and avoid a severe crash by turning to crash the properties. On the contrary, it is hard for drivers to see the pedestrians on the right blind spot when drivers are turning right at an intersection.
Furthermore, in terms of the environmental features, the risk of older pedestrian PDO crash is positively influenced by the daylight lighting and the mid-range time hours, which indicates the off-peak hours. The findings are reasonable since when the light and traffic condition is good, the proportion of severe crashes in all pedestrian crashes will be low; on the contrary, PDO’s proportion will be high [
58,
59].
Older Pedestrian Injury Crashes
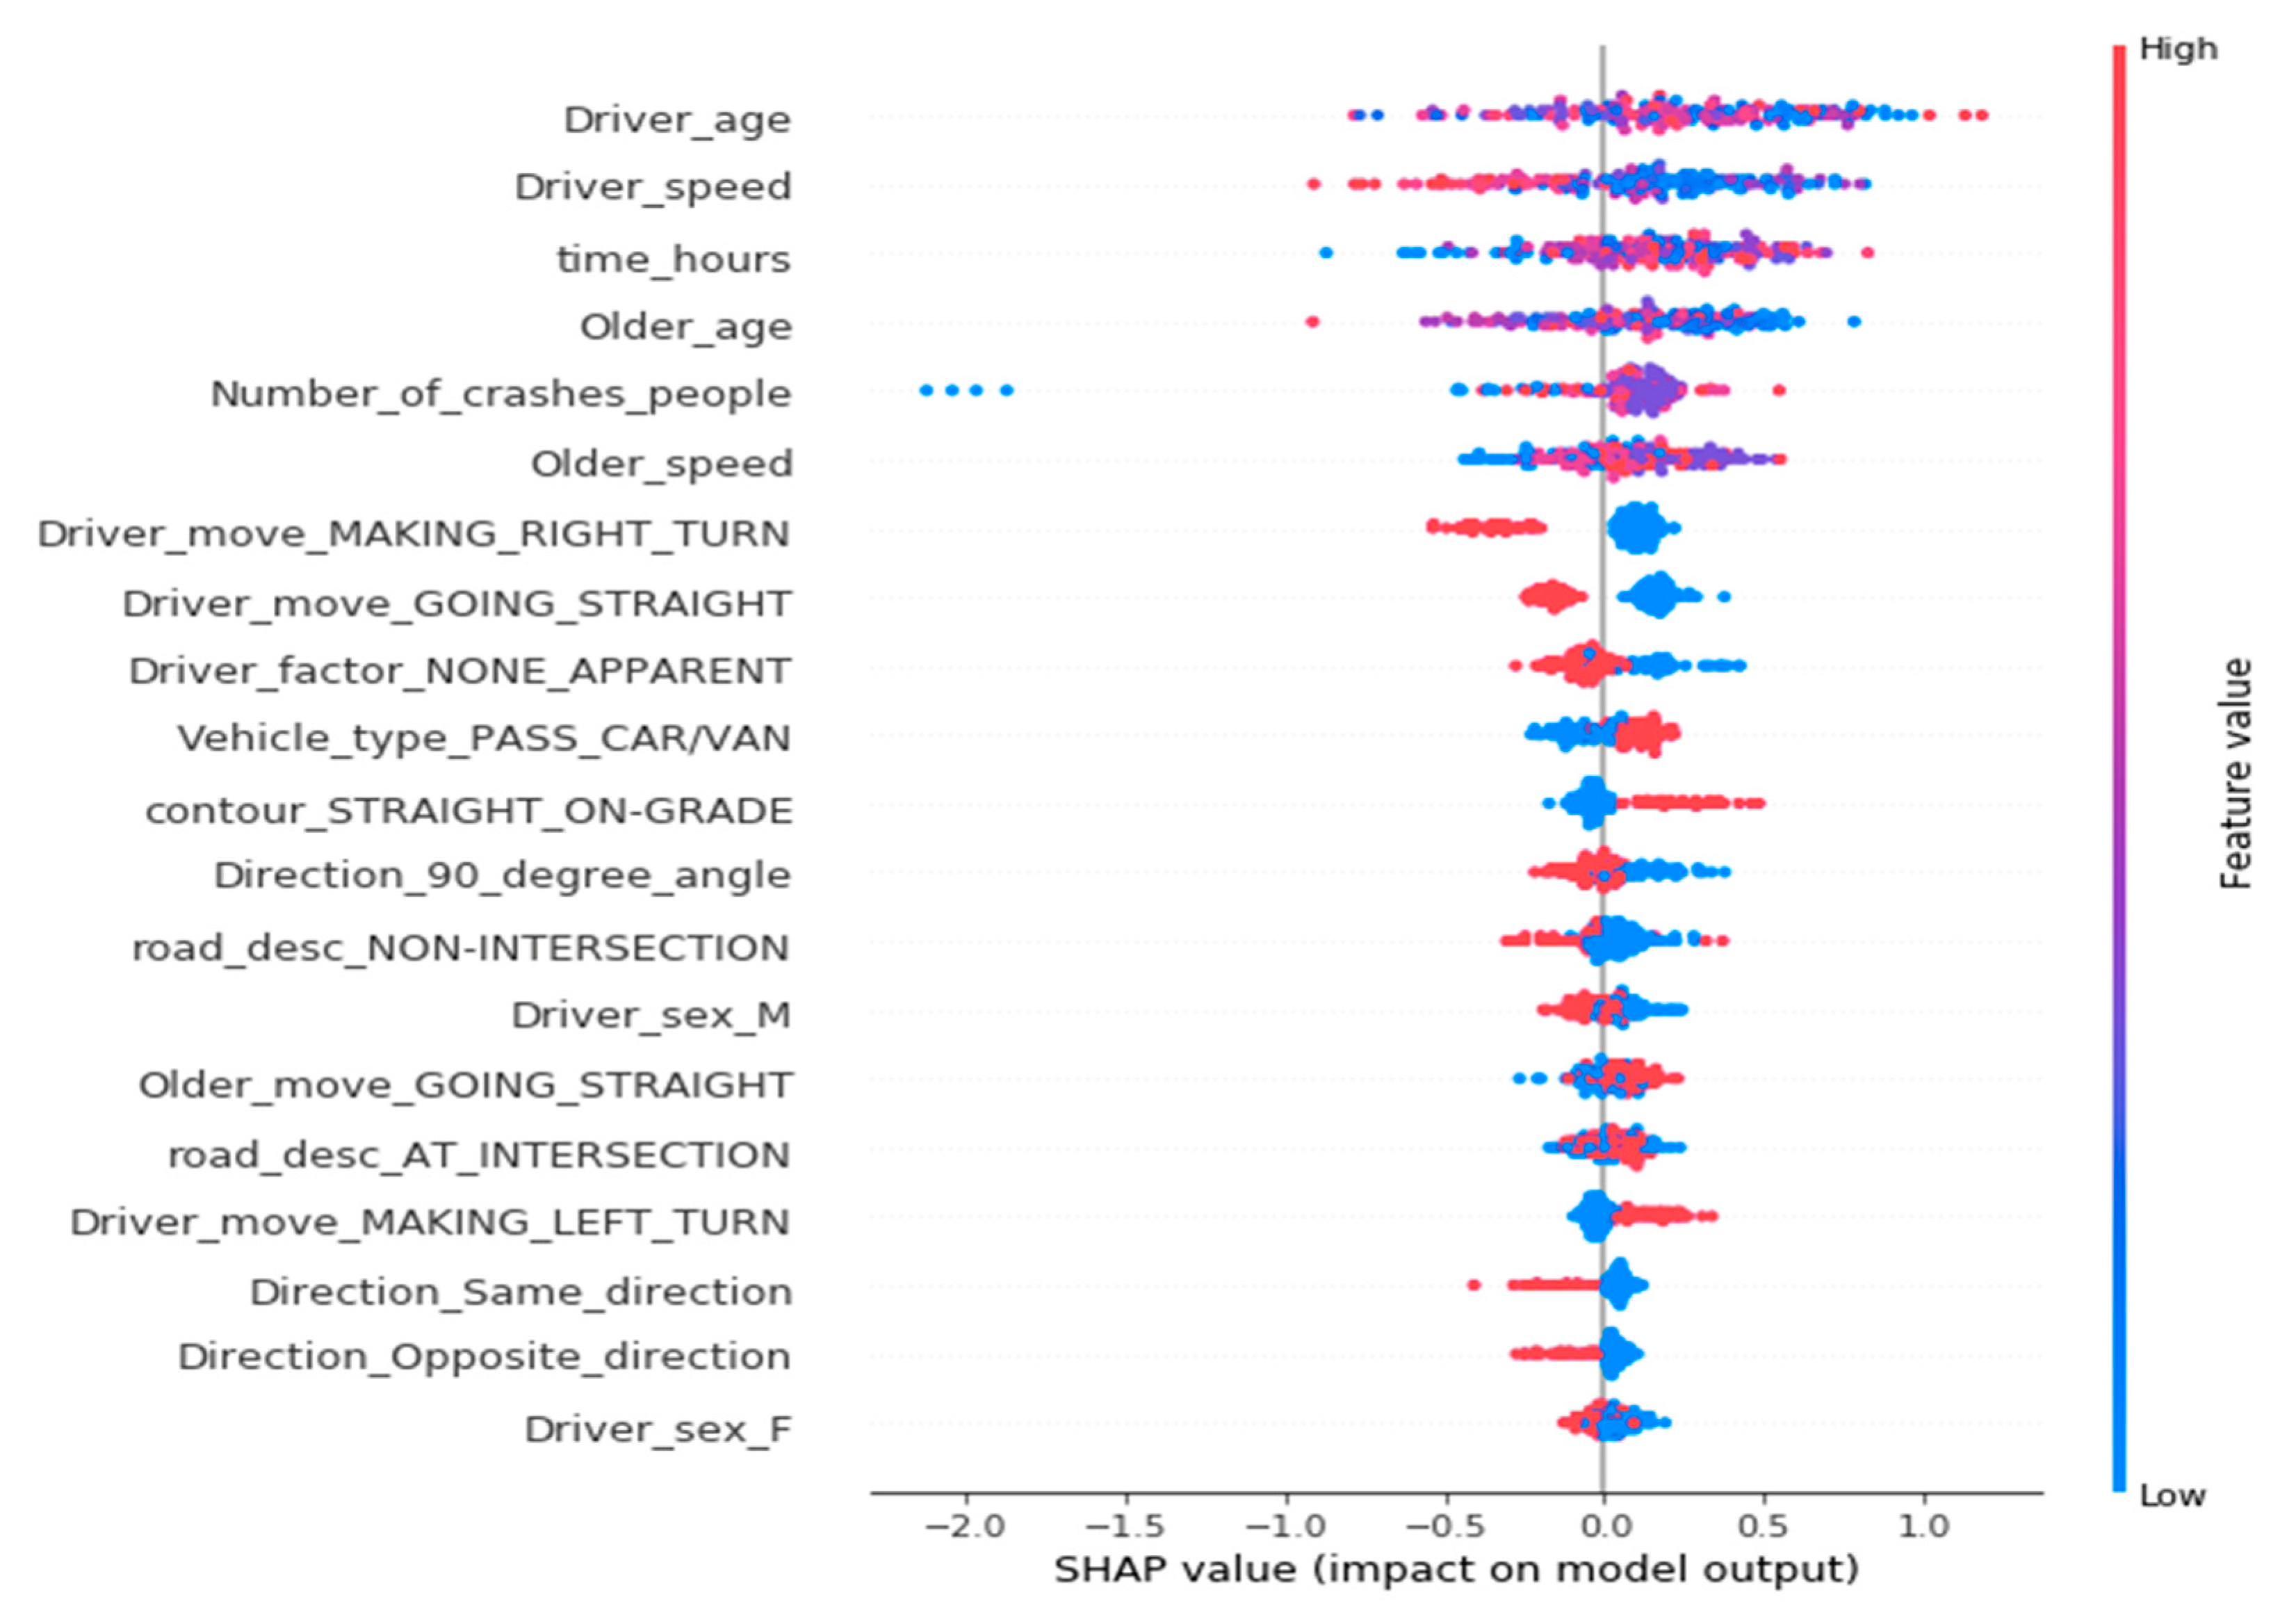
Figure 12 is the summary plot of essential features for predicting injury-level older pedestrian crashes. Based on this figure, the relatively low vehicle speed, the relatively late travel period, the relatively high walking speed of older pedestrians, the vehicle’s left-turn movement, the female drivers, etc., will increase the possibility of injury level crashes. In terms of road conditions, when drivers drive on a road that is not level (contour_straight on grade), the risk of injury level older pedestrian crashes will be relatively higher than drivers driving on a level road [
60]. Injury level crashes are more likely to occur when drivers are driving on the sloping road because the variation of speed on grade is more extensive, and the stop sight distance increases on downgrades and decreases on upgrades [
61]. Besides, road linearity and the driver’s driving psychology, vision, and reaction have a close relationship. Due to the driver’s error in judgment of road conditions, the traffic will be prone to deviate from the lane to rush down the road, resulting in a crash. Based on this particular feature, we suggest installing pedestrian guardrails, grade signs, and speed limit signs to lower the risk of pedestrian crashes.
Older Pedestrian Fatal Crashes
The comprehensive impact features evaluation of fatal older pedestrian crashes shown in
Figure 12 concludes that the relatively young older pedestrians, the low driving speed, the relatively late time, the left-turn movement of the vehicle, and the intersection can reduce the occurrence of fatal crashes to some extent. It is not difficult to understand that human factors are one of the critical factors causing crashes. For instance, the relatively late time has a negative impact on the fatal crash probability because the volume of traffic is low in the off-peak hours. Furthermore, drivers at road intersections are restricted to being very cautious when facing older pedestrians crossing the street by the traffic lights [
62]. However, when drivers are distracted by the outside world, such as playing on mobile phones and eating food in the car, as reflected in the accident report, their inattention will be aggravated, and the probability of fatal crashes will increase [
63].
Figure 13 also shows that under a good light condition, the female drivers driving straight can also be correlated to a low probability of fatal pedestrian crashes and may contribute to avoid the occurrence of fatal older pedestrian crashes. The feature “road_desc_at_driveway_access” positively influences fatal crashes, which means the pedestrian crashes that happened at the driveway have a high probability of being a fatal crash. On the one hand, it may be because the greenery blocked drivers’ sight at the driveway access, which causes drivers’ carelessness. On the other hand, the driving speed is fast on the main road, leading to fatal crashes. It is recommended that the road construction department may need to set up speed bumps, install entrance signs, or speed limit signs in communities [
64].
Further Discussion on Fatal Crashes
Since the summary plot can only investigate the correlation between the severity level and the features, it is hard to observe the relationship between pairs of features. SHAP dependency plots show the relationship between some features and how they impact one’s probability for the severity level of the older pedestrian crash.
Figure 14 and
Figure 15 show the impact of driver gender and the impact of the crash time on the predictions. The left side y-axis is the impact value of the single feature. The x-axis is the value of this single feature. The right-side color bar is the value indicator of the second feature that may affect the single feature.
Figure 14 shows that when the gender of drivers is female, and the older pedestrian is relatively young, the negative SHAP value means that the probability of fatal crashes of older pedestrians can be reduced. The reason may be because female drivers are more likely to maintain regular living habits and good driving habits [
54,
65], which can effectively reduce improper driving behaviors in driving and avoid fatal crashes of older pedestrians. Compared with those two clusters in
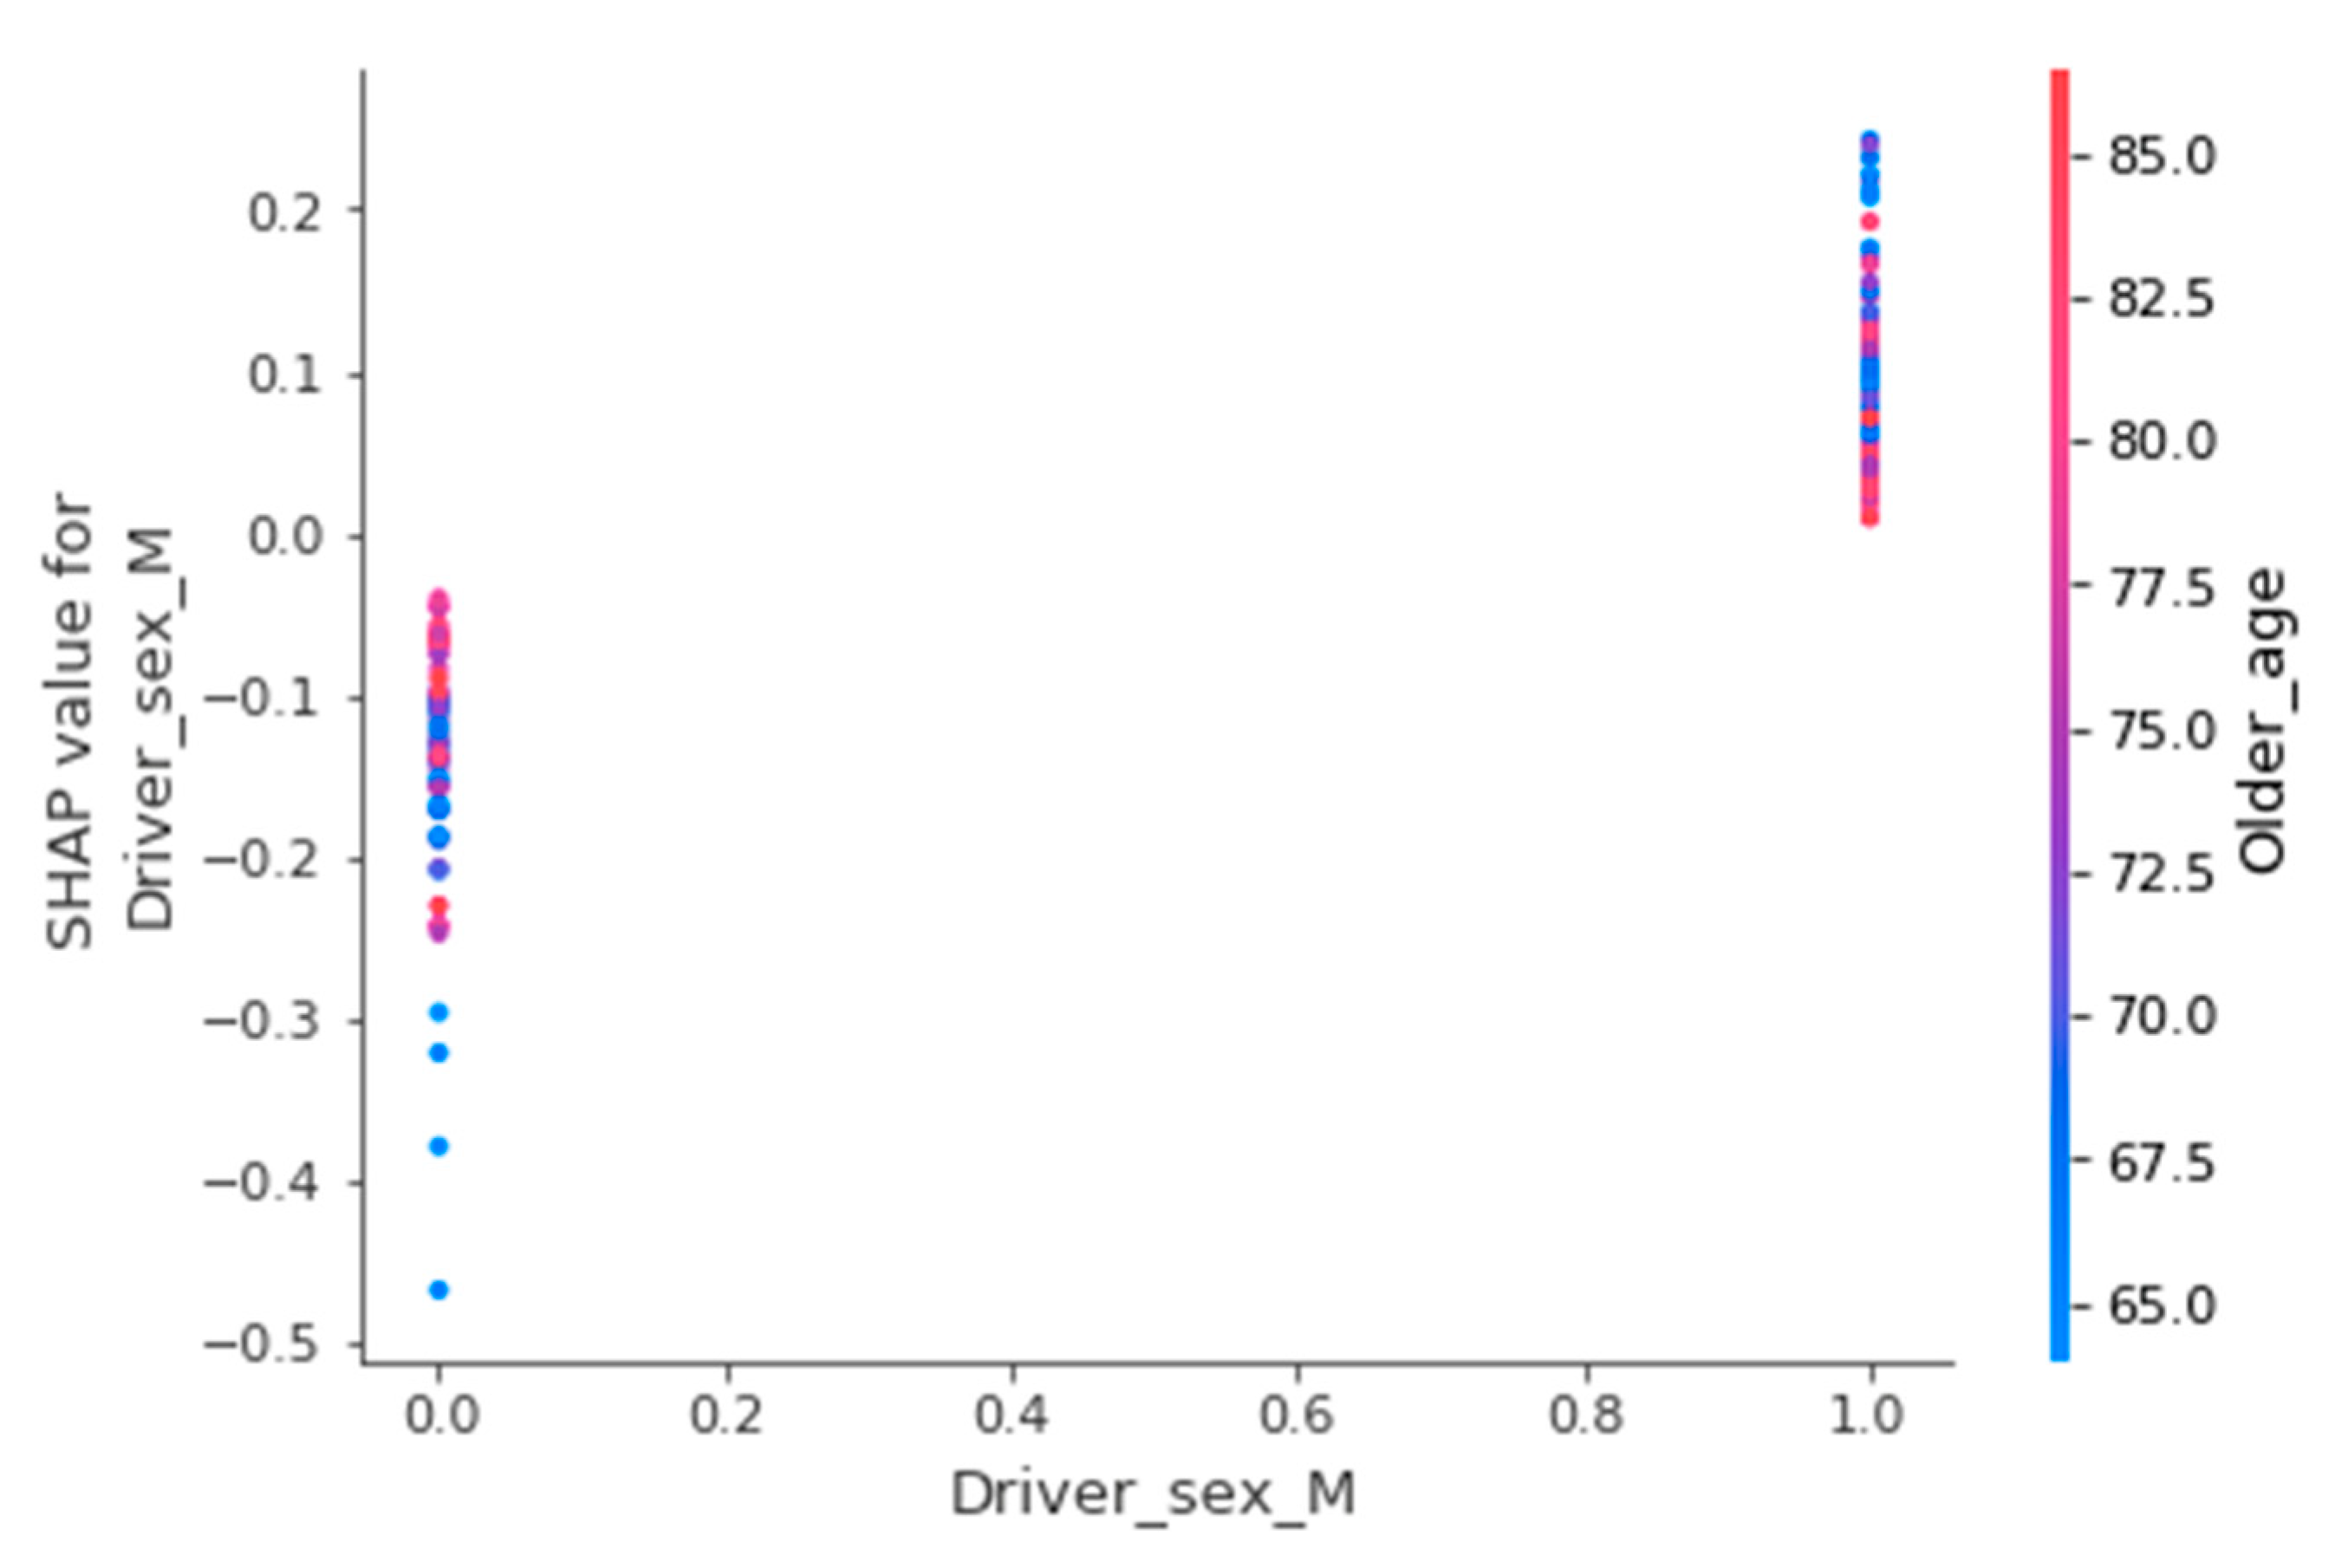
Figure 13, it is interesting to find that both driver genders’ impact with relatively old age is approaching SHAP value 0. Crash factors for very aged pedestrians at the time of the collision were independent of driver gender. Still, a female driver encounter with a relatively young older pedestrian may lower the risk of being involved in a fatal crash. In comparison, male drivers’ impact with a relatively young older pedestrian is increased to positive values.
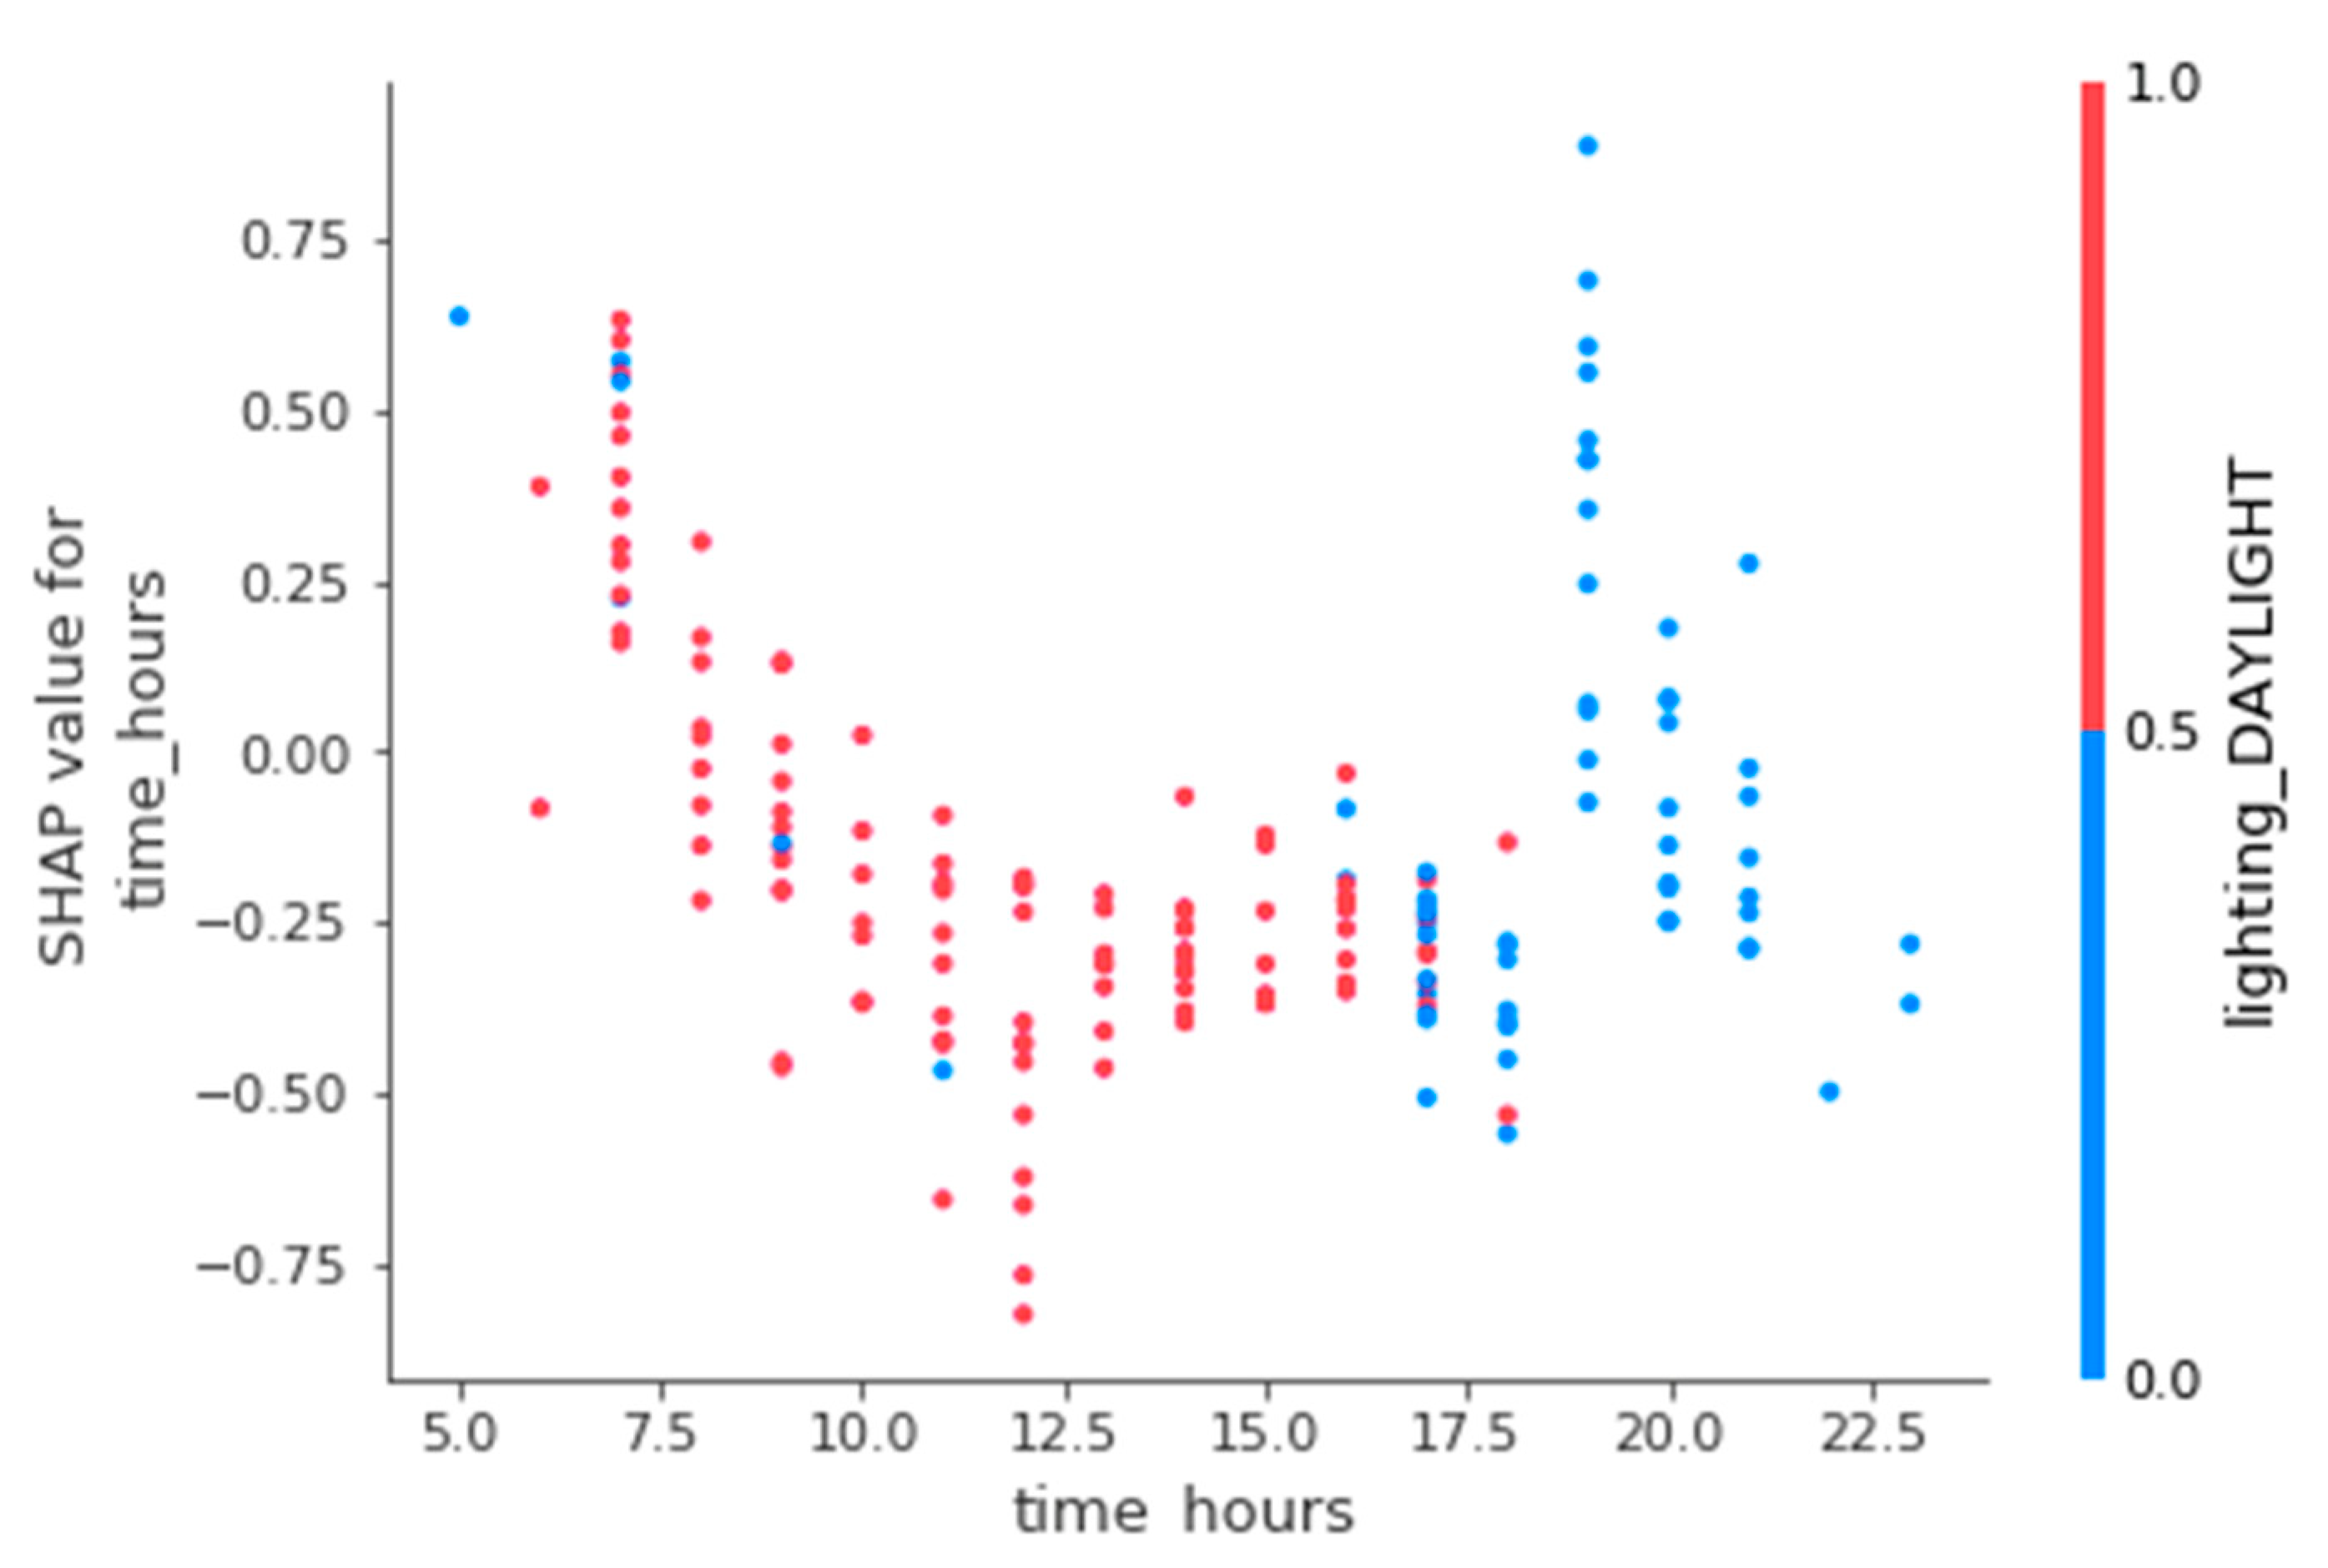
Figure 15 shows that older pedestrians are more likely to be involved in fatal crashes from 5 AM to 7 AM when the light conditions only depend on the natural light. Moreover, in the evening peak period around 7 PM, the traffic volume is high, and there may be no natural light. The street lights have not been turned on, which means the light condition may be insufficient for drivers and pedestrians. Thus, it can be seen that this period is the period requiring the attention of the transportation department. It can be suggested that the transportation department may work with the city council to switch on/off the light dynamically or control the light switch by the light sensor to provide sufficient lights for drivers and pedestrians to avoid crashes fundamentally.
SHAP causes the study to better interpret the comprehensive results predicted by XGBoost with data visualization plots and further improves the interpretability of XGBoost, meaning the information is conveyed by the model results effectively. Besides, each feature’s impact on the severity levels of older pedestrian crashes found by interpreting the model is also conducive to further research in the future.
6. Conclusions
In this study, a machine learning method XGBoost is used to analyze and study the factors causing the older pedestrian crash severity with different levels. XGBoost makes use of its data mining performance and an optimization algorithm to help this analysis achieve a higher prediction accuracy even with a small data volume. The level of older pedestrian crash severity modeled in this study is divided into three classes, PDO, injury, and fatal. The overall prediction accuracy of the model was evaluated. Regardless of whether for Model accuracy or ROC test result for both methods, XGBoost shows higher performance.
Machine learning is rarely used in older pedestrian traffic crashes severity analysis. XGBoost, as an emerging high-performance machine learning algorithm and one of the innovative applications in this study, achieved higher accuracy than other traditional models, which confirms that it is a relatively new and better algorithm to model older pedestrian traffic crashes severity.
This second highlight for this study is using SHAP to interpret the model result by breaking the explain limitations of the XGBoost. SHAP model is implemented to interpret the results of XGBoost and visualize the results. Instead of analyzing single feature importance, the SHAP interpretations in the result section enriched this study by analyzing features between different crash factors and features.
The interpretation results of three levels of the severity of older pedestrian traffic crashes could suggest the department of traffic management and road infrastructure to prevent older pedestrians.
The most significant factor related to the older pedestrian crashes is the driving speed. It suggests that the speed limit for vehicles in specific places or at a particular time should be emphasized. The light condition plays an important role in this study. The analysis result shows that older pedestrians are more likely to be involved in fatal crashes from 5 AM to 7 AM.
From the department of traffic management perspective, these changes can include sufficient light at dawn and dusk, additional precaution signals, grade signs, speed limit signs, markers for pedestrians in high-speed limit areas, or any other associated improvements.
For the department of road infrastructure, we suggest installing pedestrian guardrails, bumpers, and pedestrian crosswalks near the driveway access area.
In terms of the policy, the policymakers should pay more attention to the education program, which helps pedestrians and drivers increase their safety consciousness. The characteristic of drivers and pedestrians is critical in this study, which suggests that road user training and psychological education should be encouraged to provide in communities. For example, the Georgia Office of Highway Safety has provided a safety education program to those grantees who lived in cities with significant increases in pedestrian fatalities. These programs have been focused on areas where numbers of people take walking as the primary form of transportation and other high-risk zones [
66,
67]. Connecticut, Tennessee, and Asheville introduced the “Watch for Me” campaigns to help promote driver awareness of pedestrian safety [
68,
69]
In this study, the data have coordinates of the pedestrian crash location, which can be used in future research by combining other environmental factors. For example, neighborhood economic attributes in the crash area are also likely to be correlated to older pedestrian crashes. Based on this geographic data availability, future studies will focus on the impact of environmental factors such as neighborhood economic attributes.
Author Contributions
Conceptualization, Z.Y. and M.G.; methodology, Y.P., M.G.; software, M.G. and Y.P.; validation, M.G. and Y.Y.; formal analysis, W.W. and Y.Y.; resources, B.J.; data curation, B.J. and M.G.; writing—original draft preparation, M.G. and Z.Y.; writing—review and editing, B.J. All authors have read and agreed to the published version of the manuscript.
Funding
This research received no external funding.
Acknowledgments
The authors thank Andrew Hogle at the Colorado D.O.T. for providing the pedestrian crash data analyzed in this study. The authors also thank Bruce Janson provide research help.
Conflicts of Interest
The authors declare no conflict of interest.
Appendix A
Figure A1.
XGBoost model tree.
Figure A1.
XGBoost model tree.
References
- Cameron, M. World Report on Road Traffic Injury Prevention; World Health Organization: Geneva, Switzerland, 2004. [Google Scholar]
- Traffic Safety Facts. 2017 Data; NHTSA’s National Center for Statistics and Analysis: Washington, DC, USA, 2019; pp. 1–11.
- National Pedestrian Crash Report; U.S. Department of Transportation: Washington, DC, USA, 2008.
- Ortman, J.M.; Velkoff, V.; Hogan, H. An Aging Nation: The Older Population in the United States. In Current Population Reports 2014; U.S. Census Bureau: Washington, DC, USA, 2014. [Google Scholar]
- Retting, R.; Schwartz Consulting, S. Pedestrian Traffic Fatalities by State 2019 Preliminary Data; Spotlight on Highway Safety; Governors Highway Safety Association: Washington, DC, USA, 2019; pp. 1–44. [Google Scholar]
- Schmid, K. World Population Ageing 2019; Department of Economic and Social Affairs Population Division: New York, NY, USA, 2020. [Google Scholar]
- Granville, G. Harold Brenner and Emer Shelley, Adding Years to Life, Life to Years a Health Promotion Strategy for Older People, Report No. 50, National Council on Ageing and Older People, Dublin, 1998, 88 Pp, £5.00, ISBN 1 900378 08 6. Ageing Soc. 1998, 18, 721–732. [Google Scholar] [CrossRef]
- 25 Years of the European Transport Safety Council; European Transport Safety Council: Brussels, Belgium, 2018.
- Romero-Ortuno, R.; Cogan, L.; Cunningham, C.U.; Kenny, R.A. Do Older Pedestrians Have Enough Time to Cross Roads in Dublin? A Critique of the Traffic Management Guidelines Based on Clinical Research Findings. Age Ageing 2010, 39, 80–86. [Google Scholar] [CrossRef] [PubMed]
- Fu, T.; Miranda-Moreno, L.; Saunier, N. A Novel Framework to Evaluate Pedestrian Safety at Non-Signalized Locations. Accid. Anal. Prev. 2018, 111, 23–33. [Google Scholar] [CrossRef] [PubMed]
- Papadimitriou, E.; Yannis, G.; Evgenikos, P. About Pedestrian Safety in Europe. Adv. Transp. Stud. 2009, 6. [Google Scholar] [CrossRef]
- Oxley, J.; Fildes, B.; Ihsen, E.; Charlton, J.; Day, R. Differences in Traffic Judgements between Young and Old Adult Pedestrians. Accid. Anal. Prev. 1997, 29, 839–847. [Google Scholar] [CrossRef]
- Lee, H.-J.; Kim, E.-M. Traffic Safety Countermeasures for the Elderly Considering Traffic Accidents Causes. Transp. Technol. Policy 2011, 8, 63–75. [Google Scholar]
- Mcdowd, J.; Craik, F. Effects of Aging and Task Difficulty on Divided Attention Performance. J. Exp. Psychol. Hum. Percept. Perform. 1988, 14, 267. [Google Scholar] [CrossRef]
- Al Bargi, W.A.; Daniel, B.D. Modelling Pedestrians’ Utilization of Crossing Facilities along Urban Streets. Case Stud. Transp. Policy 2020, 8, 593–598. [Google Scholar] [CrossRef]
- Duim, E.; Lebrão, M.L.; Antunes, J.L.F. Walking Speed of Older People and Pedestrian Crossing Time. J. Transp. Heath 2017, 5, 70–76. [Google Scholar] [CrossRef]
- Liu, Y.-C.; Tung, Y.-C. Risk Analysis of Pedestrians’ Road-Crossing Decisions: Effects of Age, Time Gap, Time of Day, and Vehicle Speed. Saf. Sci. 2014, 63, 77–82. [Google Scholar] [CrossRef]
- Lee, C.; Abdel-Aty, M. Comprehensive Analysis of Vehicle–Pedestrian Crashes at Intersections in Florida. Accid. Anal. Prev. 2005, 37, 775–786. [Google Scholar] [CrossRef] [PubMed]
- Ginter, E.; Simko, V. Women Live Longer than Men. Bratisl. Lek. Listy 2013, 114, 45–49. [Google Scholar] [CrossRef] [PubMed]
- Ward, H.W.; Cave, J.; Morrison, A.; Allsop, R.; Evans, A.; Kuiper, C.; Willumsen, L. Pedestrian Activity and Accident Risk; AA Foundation for Road Safety Research; Transport Research Laboratory: Crowthorne, UK, 1996; pp. 62–73. [Google Scholar]
- Raharjo, T.R. The Effects of Age and Gender on Pedestrian Traffic Injuries: A Random Parameters and Latent Class Analysis. Master’s Thesis, University of South Florida, Tampa, FL, USA, 2016. [Google Scholar]
- Ahmed, H.M.; Blaha, M.J.; Nasir, K.; Rivera, J.J.; Blumenthal, R.S. Effects of Physical Activity on Cardiovascular Disease. Am. J. Cardiol. 2012, 109, 288–295. [Google Scholar] [CrossRef] [PubMed]
- Yang, Y.; Yuan, Z.; Chen, J.; Guo, M. Assessment of Osculating Value Method Based on Entropy Weight to Transportation Energy Conservation and Emission Reduction. Environ. Eng. Manag. J. 2017, 16, 2413–2423. [Google Scholar] [CrossRef]
- Wang, W.; Yuan, Z.; Yang, Y.; Yang, X.; Liu, Y. Factors Influencing Traffic Accident Frequencies on Urban Roads: A Spatial Panel Time-Fixed Effects Error Model. PLoS ONE 2019, 14, e0214539. [Google Scholar] [CrossRef]
- Dunn, A.L.; Jewell, J.S. The Effect of Exercise on Mental Health. Curr. Sports Med. Rep. 2010, 9, 202–207. [Google Scholar] [CrossRef]
- Cho, H.; Lee, S. A Study on the Effects of Neighborhood Environmental Characteristics on the Level of the Social Capital: Focused on the Mediating Effect of Walking Activity. J. Korea Plan. Assoc. 2017, 52, 111–134. [Google Scholar] [CrossRef]
- Woo, A.; Yu, C.-Y. Beyond Affordable Shelters: Subsidized Housing and Surrounding Environments for Pedestrian Safety. Appl. Geogr. 2017, 83, 37–45. [Google Scholar] [CrossRef]
- Wang, W.; Yuan, Z.; Liu, Y.; Yang, X.; Yang, Y. A Random Parameter Logit Model of Immediate Red-Light Running Behavior of Pedestrians and Cyclists at Major-Major Intersections. J. Adv. Transp. 2019, 2019, 1–13. [Google Scholar] [CrossRef]
- Yang, Y.; Yuan, Z.Z.; Li, J.Y.; Wang, Y.H.; Wang, W. Multi-Mode Public Transit OD Prediction and Scheduling Model. Adv. Transp. Stud. 2018, 3, 133–146. [Google Scholar] [CrossRef]
- Lee, S.; Yoon, J.; Woo, A. Does Elderly Safety Matter? Associations between Built Environments and Pedestrian Crashes in Seoul, Korea. Accid. Anal. Prev. 2020, 144, 105621. [Google Scholar] [CrossRef] [PubMed]
- Hwang, J.; Joh, K.; Woo, A. Social Inequalities in Child Pedestrian Traffic Injuries: Differences in Neighborhood Built Environments near Schools in Austin, TX, USA. J. Transp. Health 2017, 1–10. [Google Scholar] [CrossRef]
- Zegeer, C.V.; Stutts, J.; Rodgman, E. Analysis of Elderly Pedestrian Accidents and Recommended Countermeasures. J. Saf. Res. 1996, 27. [Google Scholar] [CrossRef]
- Yu, C.-Y. How Differences in Roadways Affect School Travel Safety. J. Am. Plann. Assoc. 2015, 81, 203–220. [Google Scholar] [CrossRef]
- Das, S.; Bibeka, A.; Sun, X.; Zhou, H.; Jalayer, M. Elderly Pedestrian Fatal Crash-Related Contributing Factors: Applying Empirical Bayes Geometric Mean Method. Transp. Res. Rec. J. Transp. Res. Board 2019. [Google Scholar] [CrossRef]
- Dommes, A.; Cavallo, V.; Dubuisson, J.-B.; Tournier, I.; Vienne, F. Crossing a Two-Way Street: Comparison of Young and Old Pedestrians. J. Saf. Res. 2014, 50. [Google Scholar] [CrossRef]
- Dommes, A.; Cavallo, V.; Vienne, F.; Aillerie, I. Age-Related Differences in Street-Crossing Safety before and after Training of Older Pedestrians. Accid. Anal. Prev. 2012, 44, 42–47. [Google Scholar] [CrossRef]
- Dommes, A.; Tristan, L.L.; Vienne, F.; Dang, N.T.; Perrot, A.; Do, M.-C. Towards an Explanation of Age-Related Difficulties in Crossing a Two-Way Street. Accid. Anal. Prev. 2015, 85, 229–238. [Google Scholar] [CrossRef]
- Abbreviated Injury Scale. 2015. Available online: https://www.aaam.org/abbreviated-injury-scale-ais/ (accessed on 25 December 2020).
- Niebuhr, T.; Junge, M.; Rosén, E. Pedestrian Injury Risk and the Effect of Age. Accid. Anal. Prev. 2015, 86, 121–128. [Google Scholar] [CrossRef]
- Li, F.; Chen, C.-H.; Khoo, L.P. Information Requirements for Vessel Traffic Service Operations. World Acad. Sci. Eng. Technol. Int. J. Comput. Electr. Autom. Control Inform. Eng. 2016, 10, 881–885. [Google Scholar]
- Zhao, H.; Yu, H.; Li, D.; Mao, T.; Zhu, H. Vehicle Accident Risk Prediction Based on AdaBoost-SO in VANETs. IEEE Access 2019, 7, 14549–14557. [Google Scholar] [CrossRef]
- Gu, T.; Yang, S. Duration Prediction for Truck Crashes Based on the XGBoost Algorithm; CICTP: Nanjing, China, 2019; p. 5031. [Google Scholar]
- Das, S.; Dutta, A.; Dey, K.; Jalayer, M.; Mudgal, A. Vehicle Involvements in Hydroplaning Crashes: Applying Interpretable Machine Learning. Transp. Res. Interdiscip. Perspect. 2020, 6, 100176. [Google Scholar] [CrossRef]
- Li, F.; Chen, C.-H.; Zheng, P.; Feng, S.; Xu, G. An Explorative Context-Aware Machine Learning Approach to Reducing Human Fatigue Risk of Traffic Control Operators. Saf. Sci. 2020, 125. [Google Scholar] [CrossRef]
- Shi, X.; Wong, Y.; Li, M.; Palanisamy, C.; Chai, C. A Feature Learning Approach Based on XGBoost for Driving Assessment and Risk Prediction. Accid. Anal. Prev. 2019, 129, 170–179. [Google Scholar] [CrossRef] [PubMed]
- Parsa, A.B.; Movahedi, A.; Taghipour, H.; Derrible, S.; Mohammadian, A. Toward Safer Highways, Application of XGBoost and SHAP for Real-Time Accident Detection and Feature Analysis. Accid. Anal. Prev. 2019, 136, 105405. [Google Scholar] [CrossRef] [PubMed]
- Badr, W. Why Feature Correlation Matters A Lot. 2019. Available online: https://towardsdatascience.com/why-feature-correlation-matters-a-lot-847e8ba439c4 (accessed on 23 December 2020).
- Batouli, G.; Guo, M.; Janson, B.; Marshall, W. Analysis of Pedestrian-Vehicle Crash Injury Severity Factors in Colorado 2006–2016. Accid. Anal. Prev. 2020, 148, 105782. [Google Scholar] [CrossRef]
- Siram, S.; Sonaike, V.; Bolorunduro, O.; Greene, W.; Gerald, S.; Chang, D.; Cornwell, E.; Oyetunji, T. Does the Pattern of Injury in Elderly Pedestrian Trauma Mirror That of The Younger Pedestrian? J. Surg. Res. 2010, 167, 14–18. [Google Scholar] [CrossRef]
- DiExSysTM Roadway Safety Systems General Summary of Crashes Report Report; Job #: 20180523084017; Colorado Department of Transportation: Denver, CO, USA, 2018.
- Lundberg, S.; Lee, S.-I. A Unified Approach to Interpreting Model Predictions. In Proceedings of the 31st International Conference on Neural Information Processing Systems, Long Beach, CA, USA, 4–9 December 2017. [Google Scholar]
- Savolainen, P.T.; Mannering, F.L.; Lord, D.; Quddus, M.A. The Statistical Analysis of Highway Crash-Injury Severities: A Review and Assessment of Methodological Alternatives. Accid. Anal. Prev. 2011, 43, 1666–1676. [Google Scholar] [CrossRef]
- Belsley, D.A. Conditioning Diagnostics: Collinearity and Weak Data in Regression; Wiley: New York, NY, USA, 1991; ISBN 0-471-52889-7. [Google Scholar]
- Thomas, K. Why Women Live Longer. 2010. Available online: https://www.scientificamerican.com/article/why-women-live-longer/ (accessed on 23 December 2020).
- Oxley, J.; Fildes, B.; Ihsen, E.; Day, R.; Charlton, J. An Investigation of Road Crossing Behaviour of Older Pedestrians. 1995. Available online: http://www.monash.edu.au/muarc/reports/rpts95.html (accessed on 23 December 2020).
- Enzweiler, M.; Gavrila, D.M. Monocular Pedestrian Detection: Survey and Experiments. IEEE Trans. Pattern Anal. Mach. Intell. 2009, 31, 2179–2195. [Google Scholar] [CrossRef]
- Schroeder, B.; Hughes, R.; Rouphail, N.; Cunningham, C.; Salamati, K. Crossing Solutions at Roundabouts and Channelized Turn Lanes for Pedestrians with Vision Disabilities (2011); Transport Research Board: Washington, DC, USA, 2011. [Google Scholar]
- Uttley, J.; Fotios, S. Using the Daylight Savings Clock Change to Show Ambient Light Conditions Significantly Influence Active Travel. J. Environ. Psychol. 2017, 53, 1–10. [Google Scholar] [CrossRef]
- Sullivan, J.; Flannagan, M. Differences in Geometry of Pedestrian Crashes in Daylight and Darkness. J. Saf. Res. 2011, 42, 33–37. [Google Scholar] [CrossRef] [PubMed]
- Fu, R.; Guo, Y.; Yuan, W.; Feng, H.; Ma, Y. The Correlation between Gradients of Descending Roads and Accident Rates. Saf. Sci. 2011, 49, 416–423. [Google Scholar] [CrossRef]
- Li, Z.; Chen, C.; Ci, Y.; Zhang, G.; Wu, Q.; Liu, C.; Qian, Z.S. Examining Driver Injury Severity in Intersection-Related Crashes Using Cluster Analysis and Hierarchical Bayesian Models. Accid. Anal. Prev. 2018, 120, 139–151. [Google Scholar] [CrossRef]
- 19 Pedestrian Safety Tips for Drivers. 2020. Available online: https://www.defensivedriving.org/dmv-handbook/19-pedestrian-safety-tips-for-drivers/ (accessed on 23 December 2020).
- Distract Driving. 2020. Available online: https://www.cdc.gov/motorvehiclesafety/distracted_driving/index.html (accessed on 23 December 2020).
- Pau, M.; Angius, S. Do Speed Bumps Really Decrease Traffic Speed? An Italian Experience. Accid. Anal. Prev. 2001, 33, 585–597. [Google Scholar] [CrossRef]
- Ralph, R.M.D. The Powerful Psychology Behind Cleanliness. 2016. Available online: https://www.psychologytoday.com/us/blog/the-truisms-wellness/201607/the-powerful-psychology-behind-cleanliness (accessed on 23 December 2020).
- Governors Highway Safety Association Pedestrian Traffic Fatalities by State: 2018 Preliminary Data. 2018. Available online: https://www.ghsa.org/resources/Pedestrians19 (accessed on 23 December 2020).
- Yvonne, L.M. 2002 Annual Report of the Governor’s Office of Highway Safety; One Park Tower: Atlanta, GA, USA, 2002. [Google Scholar]
- Abigail, G. Watch for Me Campaign Wraps up with Citywide Pedestrian and Bicycle Crash Reduction. Available online: https://mountainx.com/blogwire/watch-for-me-campaign-wraps-up-with-citywide-pedestrian-and-bicycle-crash-reduction/ (accessed on 11 January 2017).
- We All Share the Responsibility to Keep Our Roadways Safe. To Save Lives, We Have to Watch out for Each Other. 2017. Available online: https://watchformect.org/about/ (accessed on 23 December 2020).
| Publisher’s Note: MDPI stays neutral with regard to jurisdictional claims in published maps and institutional affiliations. |
© 2021 by the authors. Licensee MDPI, Basel, Switzerland. This article is an open access article distributed under the terms and conditions of the Creative Commons Attribution (CC BY) license (http://creativecommons.org/licenses/by/4.0/).

 ,
, 


