On Earth as It Is in Heaven: Proxy Measurements to Assess Sustainable Development Goals at the Company Level through CSR Indicators

 ,
,  ,
, 
Abstract
1. Introduction
2. Background and Literature Review
2.1. Corporate Social Responsibility and Corporate Social Performance
2.2. The 2030 Agenda and the Sustainable Development Goals (SDGs)
3. Materials and Methods
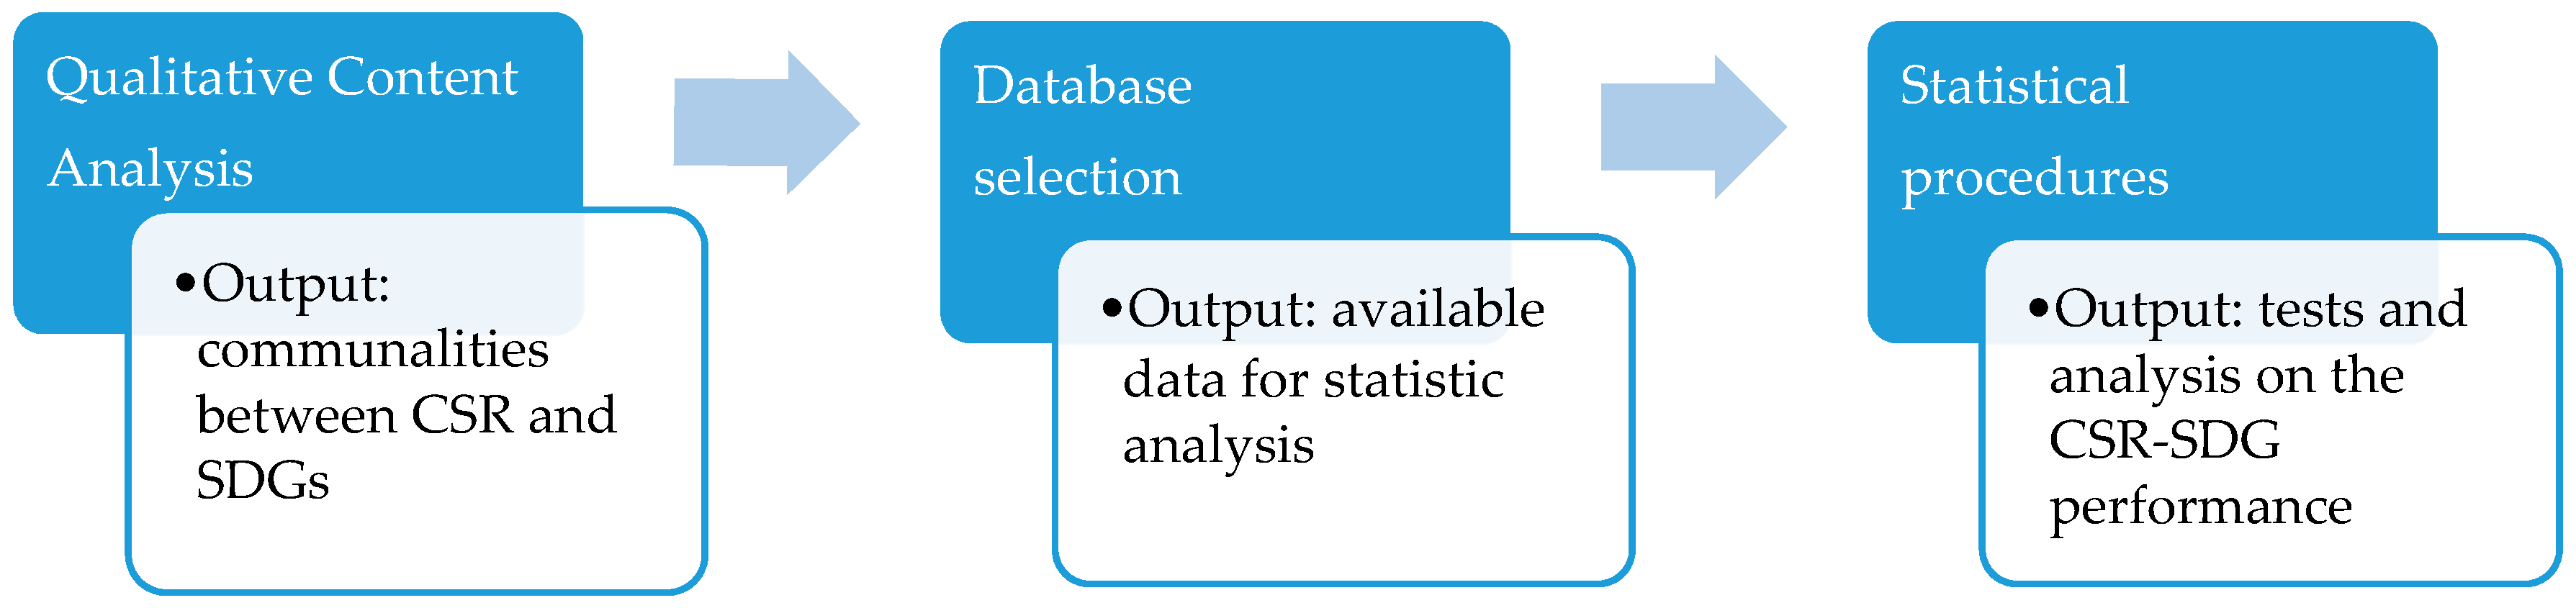
3.1. Research Overview
3.2. CSR–SDGs: Content Analysis
3.3. Database Used in the Study
3.4. Statistical Procedures
4. Results
4.1. Communalities between CSR and SDGs
4.2. CSR and SDG Performance
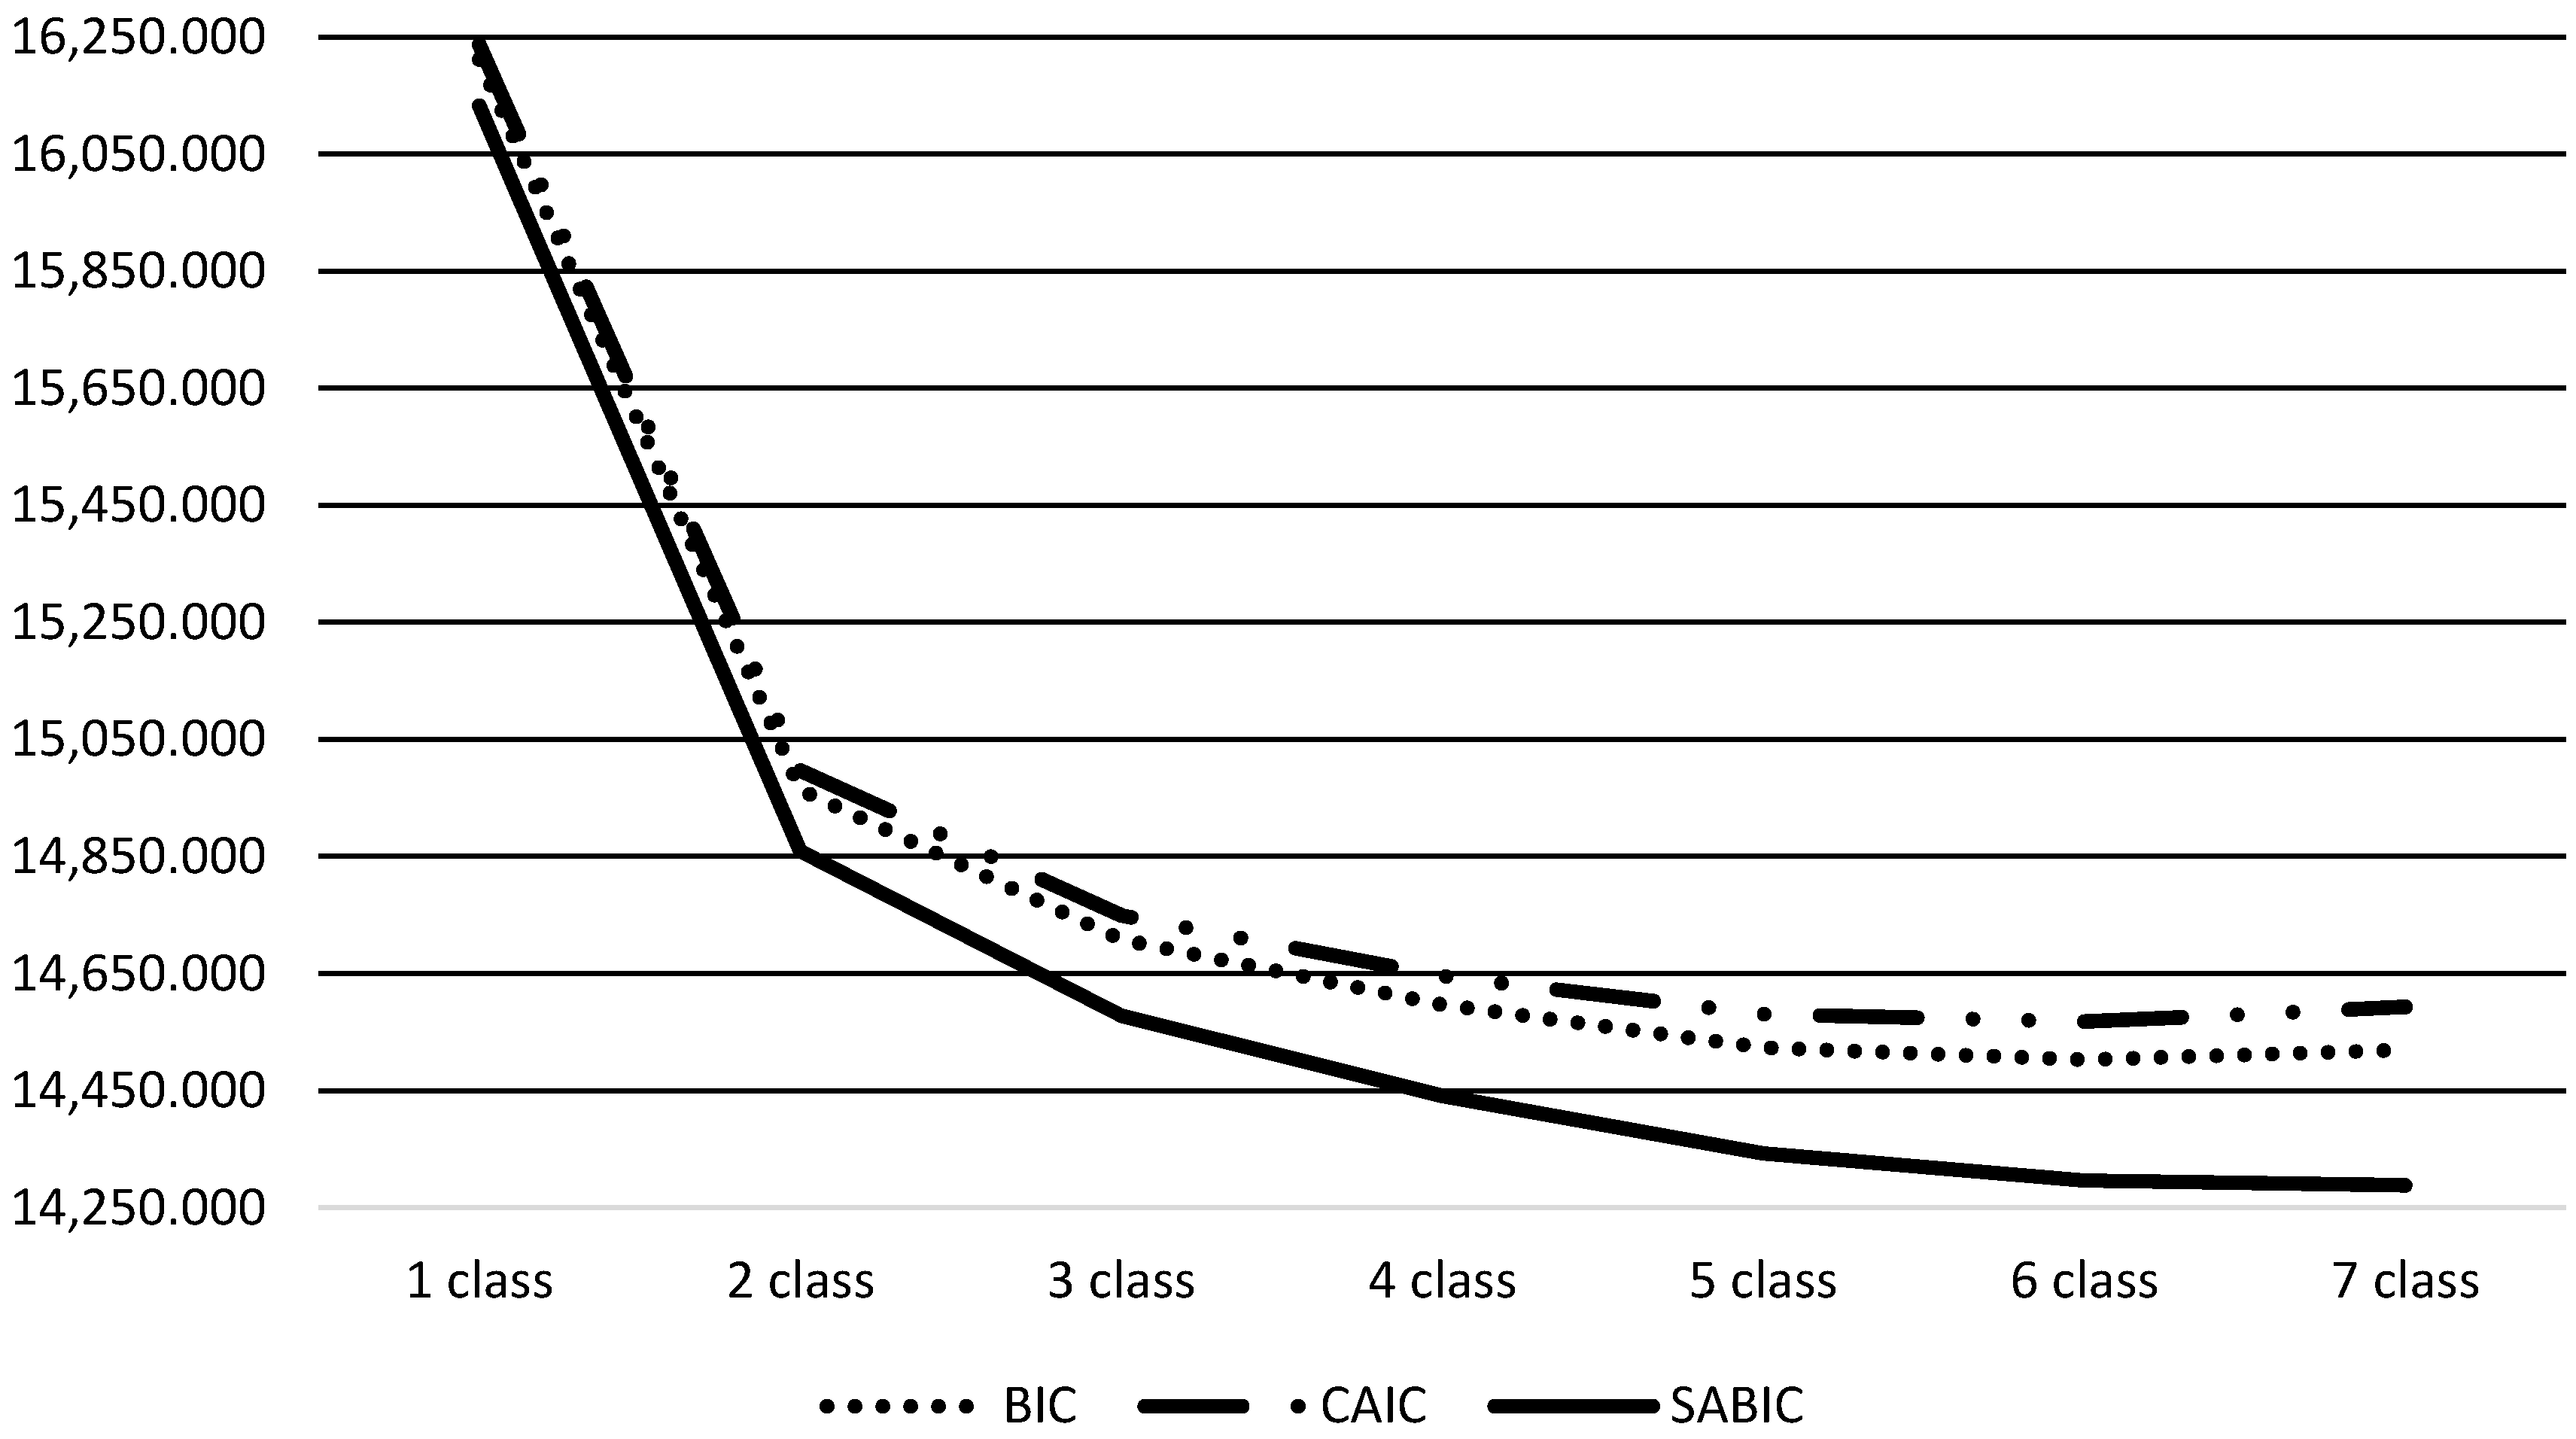
4.3. Latent Class Analysis
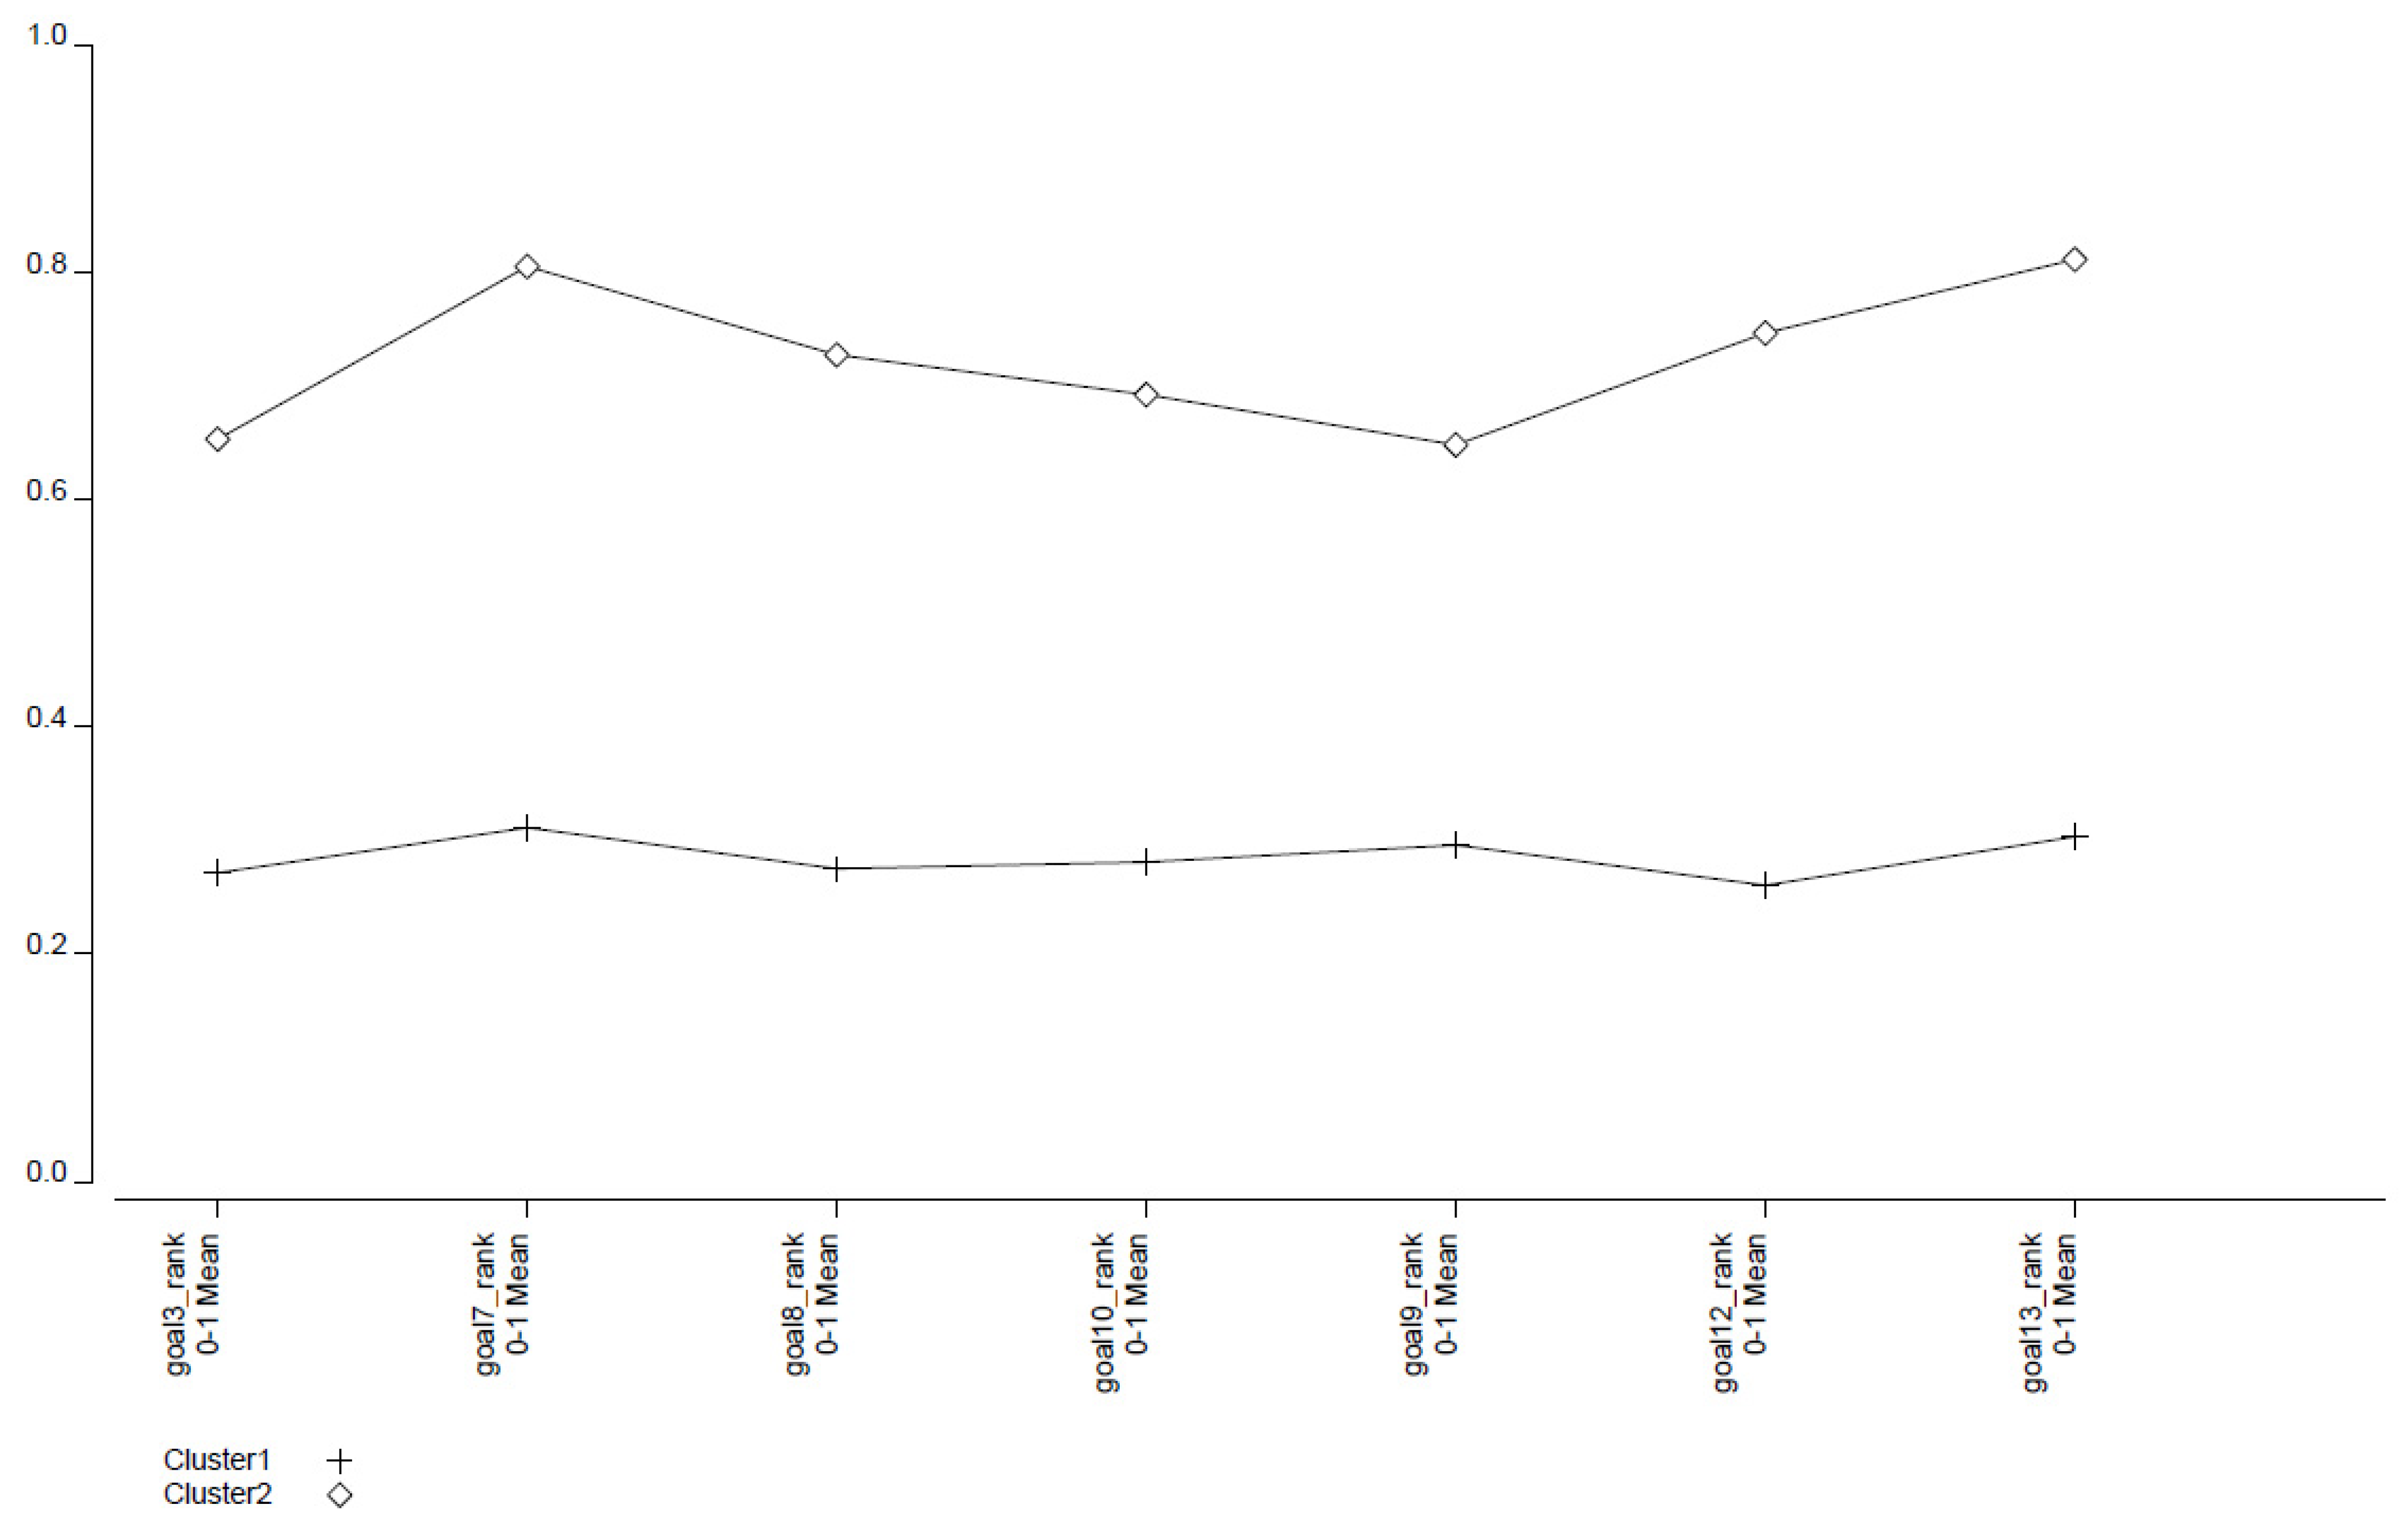
4.4. Class Characteristics
4.5. Multinomial Logistic Regression
5. Discussion and Conclusions
Author Contributions
Funding
Institutional Review Board Statement
Informed Consent Statement
Data Availability Statement
Conflicts of Interest
References
- Gallardo-Vázquez, D.; Sánchez-Hernández, M.I. Measuring Corporate Social Responsibility for competitive success at a regional level. J. Clean Prod. 2014, 72, 14–22. [Google Scholar] [CrossRef]
- Gallardo-Vázquez, D.; Sánchez-Hernández, M.I. Structural analysis of the strategic orientation to environmental protection in SME’s. BRQ Bus. Res. Q. 2014, 17, 115–128. [Google Scholar] [CrossRef]
- Valdez-Juárez, L.E.; Gallardo-Vázquez, D.; Ramos-Escobar, E.A. CSR and the supply chain: Effects on the results of SMEs. Sustainability 2018, 10, 2356. [Google Scholar] [CrossRef]
- Gallardo-Vázquez, D.; Sánchez-Hernández, M.I. Impact analysis of Managerial Social Responsibility in competitive success of microenterprises and the role of innovation. Universia Bus. Rev. 2013, 38, 14–31. [Google Scholar]
- Miras Rodríguez, M.M.; Escobar, B.; Carrasco, A. The impact of the economic crisis on the environmental responsibility of the companies. In Proceedings of the 2013 International Conference on Environment, Energy, Ecosystems and Development, Rhodes, Greece, 16–19 July 2013. [Google Scholar]
- Commission of the European Communities. Green Paper. Promoting a European Framework for Corporate Social Responsibility; European Commission: Brussels, Belgium, 2001; Available online: http://eur-lex.europa.eu (accessed on 18 January 2013).
- Commission of the European Communities. Renewed European Union Strategy for 2011–2014 on Social Responsibility; European Commission: Brussels, Belgium, 2011; Available online: http://eur-lex.europa.eu (accessed on 18 January 2013).
- European Parliament. Report on the Social Responsibility of Business: To Promote the Interests of Society and a Path to Sustainable and Inclusive Recovery; (2012/2097(INI)); Howitt, R., Ed.; European Parliament: Brussels, Belgium, 2013. [Google Scholar]
- European Parliament. Report on Social Responsibility of Business: Responsible and Transparent Business Behavior and Sustainable Growth; 2012/2098 (INI); Baldassarre, R., Ed.; European Parliament: Brussels, Belgium, 2013. [Google Scholar]
- Hart, S.L. Capitalism at the Crossroads, 2nd ed.; Wharton School Publishing: Upper Saddle River, NJ, USA, 2007. [Google Scholar]
- Sachs, J.D. From Millennium Development Goals to Sustainable Development Goals. Lancet 2012, 379, 2206–2211. [Google Scholar] [CrossRef]
- Bertazzi, P.; Hansen, O.L.; Didden, M.; Buck, B.; Danciu, D.; Espinach, L.; Williams, A. The Guide for Business Action on the SDGs; GRI: Amsterdam, The Netherlands; UN Global Compact: New York, NY, USA; WBCSD: Geneva, Switzerland, 2016; Volume 30, Available online: https://sdgcompass.org/wp-content/uploads/2016/06/SDG_Compass_Spanish-one-pager-view.pdf (accessed on 15 December 2020).
- Pizzi, S.; Rosati, F.; Venturelli, A. The determinants of business contribution to the 2030 Agenda: Introducing the SDG Reporting Score. Bus. Strateg. Environ. 2020, 1–18. [Google Scholar] [CrossRef]
- SDG Compass. The Guide for Business Action on the SDGs; GRI: Amsterdam, The Netherlands; UN Global Compact: New York, NY, USA; WBCSD: Geneva, Switzerland, 2015; Available online: https://sdgcompass.org/ (accessed on 15 May 2020).
- Ducassy, I. Does Corporate Social Responsibility pay off in times of crisis? An alternate perspective on the relationship -between financial and corporate social performance. Corp. Soc. Responsib. Environ. Manag. 2013, 20, 157–167. [Google Scholar] [CrossRef]
- Bansal, P.; Song, H.C. Similar but not the same: Differentiating corporate sustainability from corporate responsibility. Acad. Manag. Ann. 2017, 11, 105–149. [Google Scholar] [CrossRef]
- Carroll, A.B. A three dimensional conceptual model of corporate social performance. Acad. Manag. Rev. 1979, 4, 497–505. [Google Scholar] [CrossRef]
- Carroll, A.N.; Bucholtz, A.K. Business and Society: Ethics and Stakeholder Management; Thomson Learning: Mason, OH, USA, 2003; pp. 47–65. [Google Scholar]
- Yelkikalan, N.; Köse, C. The effects of the financial crisis on Corporate Social Responsibility. Int. J. Bus. Soc. Sci. 2012, 3, 292–300. [Google Scholar]
- Mintzberg, H. The case for corporate social responsibility. J. Bus. Strateg. 1983, 4, 3–15. [Google Scholar] [CrossRef]
- Werther, W.B.J.; Chandler, D. Strategic Corporate Social Responsibility as Global Brand Insurance. Bus. Horiz. 2005, 48, 317–324. [Google Scholar] [CrossRef]
- McWilliams, A.; Siegel, D.; Wright, P.M. Corporate social responsibility: Strategic implications. J. Manag. Stud. 2006, 43, 2–18. [Google Scholar] [CrossRef]
- Husted, B.W. Risk management, real options, Corporate Social Responsibility. J. Bus. Ethics 2005, 60, 175–183. [Google Scholar] [CrossRef]
- Orlitzky, M.; Benjamin, J.D. Corporate Social Responsibility and firm risk: A meta-analytic review. Bus. Soc. 2001, 40, 369–396. [Google Scholar] [CrossRef]
- Story, D.; Price, T.J. Corporate Social Responsibility and risk management? J. Corp. Citizensh. 2006, 22, 39–51. [Google Scholar] [CrossRef]
- Fassin, Y.; Van Rossem, A.; Buelens, M. Small-Business Owner-Managers’ Perceptions of Business Ethics and CSR-Related Concepts. J. Bus. Ethics 2011, 98, 425–453. [Google Scholar] [CrossRef]
- Vázquez-Carrasco, R.; López-Pérez, M.E. Small & Medium-Sized Enterprises and Corporate Social Responsibility: A Systematic Review of the Literature. Qual. Quant. 2013, 47, 3205–3218. [Google Scholar] [CrossRef]
- López-Cózar-Navarro, C.; Benito-Hernández, S. Responsabilidad Social Empresarial en la Industria Manufacturera: Ámbitos Social y Económico. Dyna 2017, 92, 308–313. [Google Scholar] [CrossRef]
- Moneva-Abadía, J.M.; Gallardo-Vázquez, D.; Sánchez-Hernández, M.I. Corporate Social Responsibility as a Strategic Opportunity for Small Firms during Economic Crises. J. Small Bus. Manag. 2018, 57, 172–199. [Google Scholar] [CrossRef]
- Margolis, J.D.; Elfenbein, H.A.; Walsh, J.P. Does it Pay to be Good? A Meta-Analysis and Redirection of Research on the Relationship between Corporate Social and Financial Performance; Working paper; Harvard Business School: Boston, MA, USA, 2007. [Google Scholar]
- Orlitzky, M.; Schmidt, F.L.; Rynes, S.L. Corporate Social and Financial Performance: A Metaanalysis. Organ. Stud. 2003, 24, 403–441. [Google Scholar] [CrossRef]
- Margolis, J.D.; Walsh, J.P. Misery Loves Companies: Rethinking Social Initiatives by Business. Adm. Sci. Q. 2003, 48, 268–305. [Google Scholar] [CrossRef]
- McGuire, J.B.; Sundgren, A.; Schneeweis, T. Corporate social responsibility and firm financial performance. Acad. Manag. J. 1988, 31, 854–872. [Google Scholar]
- Wartick, S.L.; Cochran, P.L. The Evolution of the Corporate Social Performance Model. Acad. Manag. Rev. 1985, 10, 758–769. [Google Scholar] [CrossRef]
- Waddock, S.A.; Graves, S.B. The corporate social performance- financial performance link. Strateg. Manag. J. 1997, 18, 303–319. [Google Scholar] [CrossRef]
- Stevens, J.M.; Steensma, H.K.; Harrison, D.A.; Cochran, P.L. Symbolic or substantive document? The influence of ethics codes on financial executives decisions. Strateg. Manag. J. 2005, 26, 181–195. [Google Scholar] [CrossRef]
- Glavas, A.; Piderit, S.K. How does doing good matter? Effects of corporate citizenship on employees. J. Corp. Citizensh. 2009, 36, 51–70. [Google Scholar] [CrossRef]
- Brammer, S.; Millington, A. Does it pay to be different? An analysis of the relationship between corporate social and financial performance. Strateg. Manag. J. 2008, 29, 1325–1343. [Google Scholar] [CrossRef]
- Luo, X.; Bhattacharya, C.B. Corporate social responsibility, customer satisfaction, and market value. J. Mark. 2006, 70, 1–18. [Google Scholar] [CrossRef]
- Greening, D.W.; Turban, D.B. Corporate social performance as a competitive advantage in attracting a quality workforce. Bus. Soc. 2000, 39, 254–280. [Google Scholar] [CrossRef]
- Chang, C.H. The influence of Corporate Environment Ethics on Competitive Advantage: The mediation role of Green Innovation. J. Bus. Ethics 2011, 104, 361–370. [Google Scholar] [CrossRef]
- Boulouta, I.; Pitelis, C.N. Who needs CSR? The impact of Corporate Social Responsibility on National Competitiveness. J. Bus. Ethics 2013, 119, 349–364. [Google Scholar] [CrossRef]
- UN—United Nations. Transforming our World: The 2030 Agenda for Sustainable Development. 2015. Available online: http://www.un.org/ga/search/view_doc.asp?symbol=A/RES/70/1&Lang=E (accessed on 20 July 2020).
- UN—United Nations. The Sustainable Development Agenda. 2017. Available online: http://www.un.org/sustainabledevelopment/development-agenda/ (accessed on 20 July 2020).
- Costanza, R.; Daly, L.; Fioramonti, L.; Giovannini, E.; Kubiszewski, I.; Mortensen, L.F.; Pickett, K.E.; Ragnarsdottir, K.V.; De Vogli, R.; Wilkinson, R. Modelling and measuring sustainable wellbeing in connection with the UN Sustainable Development Goals. Ecol. Econ. 2016, 130, 350–355. [Google Scholar] [CrossRef]
- Hák, T.; Janoušková, S.; Moldan, B. Sustainable Development Goals: A need for relevant indicators. Ecol. Indic. 2016, 60, 565–573. [Google Scholar] [CrossRef]
- Sánchez-Medina, A.J.; Benítez-del-Rosario, J.M.; Blázquez-Santana, F. Anomia and displacement of responsibility as determinants of tourist company manager’s non-involvement in alleviating poverty. Sustainability 2017, 9, 802. [Google Scholar] [CrossRef]
- Debnath, A.; Roy, J.; Kar, S.; Zavadskas, E.K.; Antucheviciene, J. A hybrid MCDM approach for strategic project portfolio selection of agro by products. Sustainability 2017, 9, 1302. [Google Scholar] [CrossRef]
- Conte, F.; Vitale, P.; Vollero, A.; Siano, A. Designing a data visualization dashboard for managing the sustainability communication of healthcare organizations on Facebook. Sustainability 2018, 10, 4447. [Google Scholar] [CrossRef]
- Eizaguirre, A.; García-Feijoo, M.; Laka, J.P. Defining sustainability core competencies in business and management studies based on multinational stakeholders’ perceptions. Sustainability 2019, 11, 2303. [Google Scholar] [CrossRef]
- Miotto, G.; Polo López, M.; Rom Rodríguez, J. Gender equality and UN Sustainable Development Goals: Priorities and correlations in the top business schools’ communication and legitimation strategies. Sustainability 2019, 11, 302. [Google Scholar] [CrossRef]
- Gilsbach, L.; Schütte, P.; Franken, G. Applying water risk assessment methods in mining: Current challenges and opportunities. Water Resour. Ind. 2019, 22, 100118. [Google Scholar] [CrossRef]
- Lu, J.; Ren, L.; Qiao, J.; Yao, S.; Strielkowski, W.; Streimikis, J. Corporate social responsibility and corruption: Implications for the sustainable energy sector. Sustainability 2019, 11, 4128. [Google Scholar] [CrossRef]
- Harangozo, G.; Csutora, M.; Kocsis, T. How big is big enough? Toward a sustainable future by examining alternatives to the conventional economic growth paradigm. Sustain. Dev. 2018, 26, 172–181. [Google Scholar] [CrossRef]
- Martínez-Alonso, R.; Martínez-Romero, M.J.; Rojo-Ramírez, A.A. Examining the impact of innovation forms on sustainable economic performance: The influence of family management. Sustainability 2019, 11, 6132. [Google Scholar] [CrossRef]
- Wang, C.N.; Le, A.P. Application of mult-criteria decision-making model and GM (1,1) theory for evaluating efficiency of FDI on economic growth: A case study in developing countries. Sustainability 2019, 11, 2389. [Google Scholar] [CrossRef]
- Wang, Y.; Du, M.; Zhou, L.; Cai, G.; Bai, Y. A novel evaluation approach of county-level city disaster resilience and urban environmental cleanliness based on SDG11 and deqing county’s situation. Sustainability 2019, 11, 5713. [Google Scholar] [CrossRef]
- Ceptureanu, E.G.; Ceptureanu, S.I.; Orzan, M.C.; Bordean, O.N.; Radulescu, V. Empirical study on sustainable opportunities recognition. A polyvinyl chloride (PVC) joinery industry analysis using augmented sustainable development process model. Sustainability 2017, 9, 1779. [Google Scholar] [CrossRef]
- Tsai, W.H.; Chang, J.C.; Hsieh, C.L.; Tsaur, T.S.; Wang, C.W. Sustainabilily concept in decision-making: Carbon tax consideration for joint product mix decision. Sustainability 2016, 8, 1232. [Google Scholar] [CrossRef]
- Fasoulis, I.; Kurt, R.E. Embracing sustainability in shipping: Assessing indutry’s adaptations incited by the, newly, introduced “triple bottom line” approach to sustainable maritime development. Soc. Sci. 2019, 8, 208. [Google Scholar] [CrossRef]
- Huang, W.C.; Lee, Y.Y. Strategic Planning for land use under extreme climate changes: A case study in Taiwan. Sustainability 2016, 8, 53. [Google Scholar] [CrossRef]
- Navarro-Galera, A.; Alcaraz-Quiles, F.J.; Ortiz-Rodríguez, D. Enhancing sustainability transparency in local governments. An empirical research in Europe. Sustainability 2018, 10, 2161. [Google Scholar] [CrossRef]
- González-Moreno, A.; Ruiz-Palomino, P.; Sáez-Martínez, F. Can CEOs’ Corporate social responsibility orientation improve firms’ cooperation in international scenarios? Sustainability 2019, 11, 6936. [Google Scholar] [CrossRef]
- Abbott, W.F.; Monsen, R.J. On the measurement of Corporate Social Responsibility: Self-reported disclosures as a method of measuring Corporate Social Involvement. Acad. Manag. J. 1979, 22, 501–515. [Google Scholar]
- Quazi, A.M.; O’Brien, D. An empirical test of a cross-national model of Corporate Social Responsibility. J. Bus. Ethics 2000, 25, 33–51. [Google Scholar] [CrossRef]
- Maignan, I.; Ferrell, O.C. Measuring corporate citizenship in two countries: The case of the United States and France. J. Bus. Ethics 2000, 23, 283–297. [Google Scholar] [CrossRef]
- Turker, D. Measuring Corporate Social Responsibility: A scale development study. J. Bus. Ethics 2009, 85, 411–427. [Google Scholar] [CrossRef]
- Clarkson, P.M.; Li, Y.; Richardson, G.D.; Vasvari, F.P. Revisiting the relation between environmental performance and environmental disclosure: An empirical analysis. Account. Organ. Soc. 2008, 33, 303–327. [Google Scholar] [CrossRef]
- Gallardo Vázquez, D.; Sánchez Hernández, M.I.; Corchuelo Martínez-Azúa, M.B. Validación de un instrumento de medida para la relación entre la orientación a la Responsabilidad Social Corporativa y otras variables estratégicas de la empresa. Rev. Contab. 2013, 16, 11–23. [Google Scholar] [CrossRef]
- Sánchez-Hernández, M.I.; Gallardo-Vázquez, D. Market information on corporate social responsibility issues as antecedent of the orientation to environmental responsibility in SMEs: An empirical Study. In Marketing Management; Selected Issues; Janicki, J., Barcik, R., Eds.; University of Bielsko-Biala: Bielsko-Biala, Poland, 2012; pp. 29–46. [Google Scholar]
- Sánchez Hernández, M.I.; Gallardo Vázquez, D.; Dziwinski, P.; Barcik, A. Sustainable development at enterprise level: CSR in Spain and Poland. J. Secur. Sustain. Issues 2012, 2, 77–82. [Google Scholar]
- Gallardo Vázquez, D.; Sánchez Hernández, M.I. Information on Corporate Social Responsibility and SME’s environmental responsiveness: A regional study. Econ. Sociol. 2012, 5, 103–115. [Google Scholar] [CrossRef]
- Schreier, M. Qualitative Content Analysis in Practice; Sage: Thousand Oaks, CA, USA, 2012. [Google Scholar]
- Hsieh, H.F.; Shannon, S.E. Three Approaches to Qualitative Content Analysis. Qual. Health Res. 2005, 15, 1277–1288. [Google Scholar] [CrossRef]
- Ciarli, T.; Ràfols, I. The relation between research priorities and societal demands: The case of rice. Res. Policy 2019, 48, 949–967. [Google Scholar] [CrossRef]
- Pasquetto, I.V.; Randles, B.M.; Borgman, C.L. On the Reuse of Scientific Data. Data Sci. J. 2017, 16. [Google Scholar] [CrossRef]
- Pasquetto, I.V.; Borgman, C.L.; Wofford, M.F. Uses and reuses of scientific data: The data creators’ advantage. Harv. Data Sci. Rev. 2019, 1. [Google Scholar] [CrossRef]
- Curty, R.G.; Crowston, K.; Specht, A.; Grant, B.W.; Dalton, E.D. Attitudes and norms affecting scientists’ data reuse. PLoS ONE 2017, 12, e0189288. [Google Scholar] [CrossRef]
- Kim, Y.; Yoon, A. Scientists’ data reuse behaviors: A multilevel analysis. J. Assoc. Inf. Sci. Tech. 2017, 68, 2709–2719. [Google Scholar] [CrossRef]
- Nylund-Gibson, K.; Choi, A.Y. Ten frequently asked questions about latent class analysis. Transl. Issues Psychol. Sci. 2018, 4, 440. [Google Scholar] [CrossRef]
- Vermunt, J.K.; Magidson, J. How to perform three-step latent class analysis in the presence of measurement non-invariance or differential item functioning. Struct. Equ. Modeling Multidiscip. J. 2020, 1–9. [Google Scholar] [CrossRef]
- Rhead, R.; Elliot, M.; Upham, P. Using latent class analysis to produce a typology of environmental concern in the UK. Soc. Sci. Res. 2018, 74, 210–222. [Google Scholar] [CrossRef]
- Oliva, I.; Galilea, P.; Hurtubia, R. Identifying cycling-inducing neighborhoods: A latent class approach. Int. J. Sustain. Transp. 2018, 12, 701–713. [Google Scholar] [CrossRef]
- Nunnally, J.C.; Bernstein, I.H. Psychometric Theory, 3rd ed.; McGraw-Hill: New York, NY, USA, 1994. [Google Scholar]
- Hair, J.F., Jr.; Howard, M.C.; Nitzl, C. Assessing measurement model quality in PLS-SEM using confirmatory composite analysis. J. Bus. Res. 2020, 109, 101–110. [Google Scholar] [CrossRef]
- Moyer, J.D.; Bohl, D.K. Alternative pathways to human development: Assessing trade-offs and synergies in achieving the Sustainable Development Goals. Futures 2019, 105, 199–210. [Google Scholar] [CrossRef]
- Biggeri, M.; Clark, D.A.; Ferrannini, A.; Mauro, V. Tracking the SDGs in an ‘integrated’ manner: A proposal for a new index to capture synergies and trade-offs between and within goals. World Dev. 2019, 122, 628–647. [Google Scholar] [CrossRef]
- Hourneaux, F., Jr.; da Silva Gabriel, M.L.; Gallardo-Vázquez, D.A. Triple bottom line and sustainable performance measurement in industrial companies. REGE Revista Gestão 2018, 25, 413–429. [Google Scholar] [CrossRef]
- Porter, M.E.; Kramer, M.R. The link between competitive advantage and corporate social responsibility. Harv. Bus. Rev. 2006, 84, 78–92. [Google Scholar] [PubMed]
- Carroll, A.B.; Shabana, K.M. The Business Case for Corporate Social Responsibility: A Review of Concepts, Research and Practice. Int. J. Manag. Rev. 2010, 12, 85–105. [Google Scholar] [CrossRef]
- Freeman, R.E.; Harrison, J.S.; Wicks, A.C.; Parmar, B.L.; de Colle, S. Stakeholder Theory: The State of the Art; Cambridge University Press: Cambridge, UK, 2010; Available online: https://books.google.com.mx/books?id=xF8-WN1QlIMC (accessed on 18 November 2020).
- Bourne, M.C.S.; Mills, J.F.; Wilcox, M.; Neely, A.D.; Platts, K.W. Designing, implementing and updating performance measurement systems. Int. J. Oper. Prod. Manag. 2000, 20, 754–771. [Google Scholar] [CrossRef]
- Richard, P.J.; Devinney, T.M.; Yip, G.S.; Johnson, G. Measuring organisational performance: Towards methodological best practice. J. Manag. 2009, 35, 718–804. [Google Scholar]
- Carroll, A.B. The pyramid of corporate social responsibility: Toward the moral management of organizational stakeholders. Bus. Horiz. 1991, 34, 39–48. [Google Scholar] [CrossRef]
- Preuss, L.; Perschke, J. Slipstreaming the Larger Boats: Social Responsibility in Medium-Sized Businesses. J. Bus. Ethics 2010, 92, 531–551. [Google Scholar] [CrossRef]
- Steinhofel, E.; Galeitzke, M.; Kohl, H.; Orth, R. Sustainability reporting in German manufacturing SMEs. Procedia Manuf. 2019, 33, 610–617. [Google Scholar] [CrossRef]
- Spence, L.J. Small Business Social Responsibility. Bus. Soc. 2016, 55, 23–55. [Google Scholar] [CrossRef]
- Carayannis, E.G.; Grigoroudis, E.; Campbell, D.F.J.; Meissner, D.; Stamati, D. The ecosystem as helix: An exploratory theory-building study of regional co-opetitive entrepreneurial ecosystems as Quadruple/Quintuple Helix Innovation Models. R&D Manag. 2018, 48, 148–162. [Google Scholar] [CrossRef]
- Kudłak, R.; Szőcs, I.; Krumay, B.; Martinuzzi, A. The future of CSR-Selected findings from a Europe-wide Delphi study. J. Clean Prod. 2018, 183, 282–291. [Google Scholar] [CrossRef]


| Goal | Definition |
|---|---|
| Goal 1 | End poverty in all its forms everywhere |
| Goal 2 | End hunger, achieve food security and improved nutrition, and promote sustainableagriculture |
| Goal 3 | Ensure healthy lives and promote well-being for all ages |
| Goal 4 | Ensure inclusive and equitable quality education and promote lifelong learning opportunities for all |
| Goal 5 | Achieve gender equality and empower all women and girls |
| Goal 6 | Ensure availability and sustainable management of water and sanitation for all |
| Goal 7 | Ensure access to affordable, reliable, sustainable, and modern energy for all |
| Goal 8 | Promote sustained, inclusive and sustainable economic growth, full and productive employment, and decent work for all |
| Goal 9 | Build resilient infrastructure, promote inclusive and sustainable industrialisation, and foster innovation |
| Goal 10 | Reduce inequality within and among countries |
| Goal 11 | Make cities and human settlements inclusive, safe, resilient, and sustainable |
| Goal 12 | Ensure sustainable consumption and production patterns |
| Goal 13 | Take urgent action to combat climate change and its impacts |
| Goal 14 | Conserve and sustainably use the oceans, seas, and marine resources for sustainable development |
| Goal 15 | Protect, restore, and promote sustainable use of terrestrial ecosystems, sustainably manage forests, combat desertification; halt and reverse land degradation; and halt biodiversity loss |
| Goal 16 | Promote peaceful and inclusive societies for sustainable development; provide access to justice for all; and build effective, accountable, and inclusive institutions at all levels |
| Goal 17 | Strengthen the means of implementation and revitalize the global partnership for sustainable development |
| Goal | Author | Objective | Result |
|---|---|---|---|
| Goal 1 | Sánchez-Medina et al. [47] | This study analyzed how a certain negative mood state (anomia) influences the fact that managers do not consider it advisable for their companies to become involved in reducing poverty. Also, the study also examined whether a moral disengagement mechanism, displacement of responsibility, is a mediator variable in this relationship. | The results show that anomia has a positive influence on resisting the firm’s involvement in activities related to mitigating poverty. At the same time, displacement of responsibility acts as a mediator variable between anomia and non-involvement in activities related to mitigating poverty. |
| Goal 2 | Debnath et al. [48] | The increasing size of the population poses a challenge for sustainable agricultural production in the selection of strategic projects. This work studied the socioeconomic characteristics of the portfolio of these projects before the purchase of transgenic foods. | This framework can unify the policies of agro technological improvement, corporate social responsibility, and agro export promotion. |
| Goal 3 | Conte et al. [49] | This paper studied how leading healthcare organizations are using Facebook to communicate their sustainability in terms of their focus on different components of the 3Ps (people, profit, and planet) and interactive communication strategies on social media. | The social component of sustainability prevails over environmental and economic issues, although it does not seem to generate increased consumer engagement. |
| Goal 4 | Eizaguirre et al. [50] | The objective of this paper was to determine which are the sustainability core competencies, considering three different geographical regions (Europe, Latin America, and Central Asia) and the perspective of four different stakeholders (graduates, employers, students, and academics). | Using an exploratory factor analysis, the results of this study reveal the existence of a factor intimately related to sustainability, which includes competencies such as commitment to the preservation of the environment, social responsibility, or respect for diversity and multiculturality, among others. |
| Goal 5 | Miotto et al. [51] | The main objective of this research was to analyze business schools’ communication priorities related to gender equality projects and policies in their sustainability reports, considering these as a fundamental tool for corporate legitimacy. | The results show that gender equality-related topics are a source of positive impact and legitimacy for top business schools. |
| Goal 6 | Gilsbach et al. [52] | This study tested the ability of three assessment methods to adequately reflect water-related risks of a mining operation based on a case study approach for six copper mines. | The findings indicate that the methods show potential to support water stewardship strategies. |
| Goal 7 | Lu et al. [53] | This study analyzed the main areas of CSR policies where energy companies are expected to make a positive contribution to sustainable energy development: mitigation of environmental impact, economic and social development, and good governance. | The results show that CSR can play a vital role in dealing with corruption in the energy sector at the enterprise level. |
| Goal 8 | Harangozo et al. [54] | This paper identified and discussed three alternatives, namely negative, zero, and positive economic growth, which are compared from a feasibility and policy perspective in relation to the transition toward sustainable development. | The shortcomings of the alternatives hinder the transition and must be further addressed by policymakers in the public and private sectors as well as by civil society. |
| Goal 9 | Martínez-Alonso et al. [55] | The aim of this research was to explore the effect that innovation, as a potential source of sustained competitive advantage and firm growth, has on the achievement of sustainable economic performance. In particular, this paper empirically examined the influence of four innovation forms (intramural R&D, extramural R&D, product innovation, and process innovation) on firms’ sustainable economic performance, considering the moderating effect of family involvement in management. | The results show a negative effect of intramural and extramural R&D on sustainable economic performance and a positive effect of process innovation on sustainable economic performance. |
| Goal 10 | Wang & Le [56] | This study focused on foreign direct investment and corporate social responsibility spending as some of the major factors in improving sustainable economic development of a country. | The results clearly highlight that a few countries have witnessed great improvement in terms of productivity and technological progression. Therefore, the decision makers must adopt the model of those countries with respect to sustainable development of the nation. |
| Goal 11 | Wang et al. [57] | The goal of this paper was to find a new calculation method to apply the index of urban disaster resilience and urban environmental cleanliness to the evaluation of county-level areas. | The evaluation showed that city disaster resilience is maintained at a low level, while indicators of urban cleanliness are lower than standards. |
| Goal 12 | Ceptureanu et al. [58] | This paper analyzed factors influencing recognition of sustainable opportunities by using an augmented sustainability process model. | The perception of the threat of the natural/communal environment and altruism toward others have the poorest impacts on opportunity recognition. |
| Goal 13 | Tsai et al. [59] | The aim of this paper was to apply activity-based costing (ABC) and the theory of constraints to analyze green product mix decision-making for joint products using a mathematical programming model and the joint production data of pharmaceutical industry companies for the processing of active pharmaceutical ingredients in drugs for medical use. | The results shows that the time-driven ABC model leads to optimal joint product mix decisions and performs a sensitivity analysis to study how the optimal solution will change with the carbon tax. |
| Goal 14 | Fasoulis & Kurt [60] | This empirical study aimed to investigate maritime industry’s insights and attitudes in relation to the newly introduced triple bottom line approach to global sustainable development. | The findings highlighted increasing awareness and adaptation of the maritime sector to the triple bottom line approach and, subsequent, sustainability absorption under the auspices of a corporate social responsibility (CSR) business model. |
| Goal 15 | Huang & Lee [61] | This study addressed climate change as references for policy-makers. | The findings of this study can contribute to consensus formation among multiple stakeholders on the sustainable development of soil and water resources and to devising foresight strategies in short-, middle-, and long-term bases. |
| Goal 16 | Navarro-Galera et al. [62] | The aim of this study was to identify factors that can help politicians and managers improve practices of sustainability information disclosed by European local governments. | The study results highlight various demographic, socioeconomic, financial, and legal factors that may be useful to policymakers and managers in promoting the online provision of sustainability information in Anglo-Saxon, Nordic, and Southern European countries. |
| Goal 17 | González-Moreno et al. [63] | This paper analyzed the role of the chief executive officer’s (CEO) corporate social responsibility orientation on interfirm cooperation. | The findings thus highlight the importance of leading firms in a socially responsible direction to boost their interfirm cooperation levels in international scenarios. |
| Scale for the Orientation to Corporate Social Responsibility in Extremadura |
|---|
| Social Dimension |
| S1 We support the employment of people at risk of social exclusion. |
| S2 We value the contribution of disabled people to the business world. |
| S3 We are aware of the employees’ quality of life. |
| S4 We pay wages above the industry average. |
| S5 Employee compensation is related to their skills and their results. |
| S6 We have standards of health and safety beyond the legal minimum. |
| S7 We are committed to job creation (fellowships, creation of job opportunities in the firm, etc.). |
| S8 We foster our employees´ training and development. |
| S9 We have human resource policies aimed at facilitating the conciliation of employees´ professional and personal lives. |
| S10 Employees´ initiatives are taken seriously into account in management decisions. |
| S11 Equal opportunities exist for all employees. |
| S12 We participate in social projects to the community. |
| S13 We encourage employees to participate in volunteer activities or in collaboration with NGOs. |
| S14 We have dynamic mechanisms of dialogue with employees. |
| S15 We are aware of the importance of pension plans for employees. |
| Economic Dimension |
| E1 We take particular care to offer high-quality products and/or services to our customers. |
| E2 Our products and/or services satisfy national and international quality standards. |
| E3 We are characterized as having the best quality-to-price ratio. |
| E4 The guarantee of our products and/or services is broader than the market average. |
| E5 We provide our customers with accurate and complete information about our products and/or services. |
| E6 Respect for consumer rights is a management priority. |
| E7 We strive to enhance stable relationships of collaboration and mutual benefit with our suppliers. |
| E8 We understand the importance of incorporating responsible purchasing (i.e., we prefer responsible suppliers). |
| E9 We foster business relationships with companies in this region. |
| E10 We have effective procedures for handling complaints. |
| E11 Our economic management is worthy of regional or national public support. |
| Environmental Dimension |
| M1 We are able to minimize our environmental impact. |
| M2 We use consumables, goods to process, and/or processed goods of low environmental impact. |
| M3 We take energy savings into account in order to improve our levels of efficiency. |
| M4 We attach high value to the introduction of alternative sources of energy. |
| M5 We participate in activities related to the protection and enhancement of our natural environment. |
| M6 We are aware of the relevance of firms planning their investments to reduce the environmental impact that they generate. |
| M7 We are in favour of reductions in gas emissions and in the production of wastes and in favour of recycling materials. |
| M8 We have a positive predisposition to the use, purchase, or production of environmentally friendly goods. |
| M9 We value the use of recyclable containers and packaging. |
| Data Sheet | |
|---|---|
| Universe | Extremadura companies: 67,181 companies (Source: DIRCE 2009) |
| Geographical Scope | Extremadura region (Spain) |
| Data gathering method | Telephone |
| Sample unit | Executives |
| Calls made | 19,292 |
| Population census | 7022 companies |
| Sample | 777 companies |
| Participation rate | 11.07% |
| Sample error | 3.3% |
| Confidence level | 95% z = 1.96 p = q = 0.5 |
| Sampling method | Simple Random for each extract |
| Interview average time | 14:35 min |
| Goal 3 | S3 We are aware of the employees´ quality of life. |
| S9 We have human resource policies aimed at facilitating the conciliation of employees´ professional and personal lives. | |
| Goal 7 | M3 We take energy savings into account in order to improve our levels of efficiency. |
| M4 We attach high value to the introduction of alternative sources of energy. | |
| Goal 8 | S4 We pay wages above the industry average. |
| S5 Employee compensation is related to their skills and their results. | |
| S6 We have standards of health and safety beyond the legal minimum. | |
| S7 We are committed to job creation (fellowships, creation of job opportunities in the firm, etc.). | |
| S8 We foster our employees´ training and development. | |
| S10 Employees´ initiatives are taken seriously into account in management decisions. | |
| S13 We encourage employees to participate in volunteer activities or in collaboration with NGOs. | |
| S14 We have dynamic mechanisms of dialogue with employees. | |
| S15 We are aware of the importance of pension plans for employees. | |
| Goal 9 | E9 We foster business relationships with companies in this region. |
| E11 Our economic management is worthy of regional or national public support. | |
| Goal 10 | S1 We support the employment of people at risk of social exclusion. |
| S2 We value the contribution of disabled people to the business world. | |
| S11 Equal opportunities exist for all employees. | |
| S12 We participate in social projects to the community. | |
| Goal 12 | E1 We take particular concern to offer high-quality products and/or services to our customers. |
| E2 Our products and/or services satisfy national and international quality standards. | |
| E3 We are characterized as having the best quality-to-price ratio. | |
| E4 The guarantee of our products and/or services is broader than the market average. | |
| E5 We provide our customers with accurate and complete information about our products and/or services. | |
| E6 Respect for consumer rights is a management priority. | |
| E7 We strive to enhance stable relationships of collaboration and mutual benefit with our suppliers. | |
| E8 We understand the importance of incorporating responsible purchasing (i.e., we prefer responsible suppliers). | |
| E10 We have effective procedures for handling complaints. | |
| M1 We are able to minimize our environmental impact. | |
| M2 We use consumables, goods to process, and/or processed goods of low environmental impact. | |
| M5 We participate in activities related to the protection and enhancement of our natural environment. | |
| M6 We are aware of the relevance of firms´ planning their investments to reduce the environmental impact that they generate. | |
| M8 We have a positive predisposition to the use, purchase, or production of environmentally friendly goods. | |
| M9 We value the use of recyclable containers and packaging. | |
| Goal 13 | M7 We are in favour of reductions in gas emissions and in the production of wastes and in favour of recycling materials. |
| SDG Groups | Mean | SD | 20th perc | 40th perc | 60th perc | 80th perc |
|---|---|---|---|---|---|---|
| goal3_score | 15.310 | 3.393 | 13.000 | 15.000 | 16.000 | 18.000 |
| goal7_score | 15.408 | 4.311 | 12.000 | 16.000 | 17.000 | 20.000 |
| goal8_score | 58.147 | 13.311 | 48.000 | 56.000 | 61.000 | 69.000 |
| goal9_score | 12.860 | 4.785 | 9.000 | 12.000 | 15.000 | 17.000 |
| goal10_score | 26.838 | 6.822 | 21.000 | 25.000 | 29.000 | 33.000 |
| goal12_score | 116.332 | 19.021 | 101.000 | 115.000 | 124.000 | 132.000 |
| goal13_score | 8.579 | 1.846 | 8.000 | 9.000 | 10.000 | 10.000 |
| K | LL | BIC | CAIC | SABIC | AWE | Entropy |
|---|---|---|---|---|---|---|
| 1 | −8022.821 | 16,212.029 | 16,237.029 | 16,132.642 | 16,453.415 | - |
| 2 | −7372.367 | 14,964.364 | 14,997.364 | 14,859.574 | 15,478.081 | 0.819 |
| 3 | −7217.739 | 14,708.351 | 14,749.351 | 14,578.157 | 15,454.425 | 0.786 |
| 4 | −7135.550 | 14,597.216 | 14,646.216 | 14,441.617 | 15,526.015 | 0.780 |
| 5 | −7072.425 | 14,524.211 | 14,581.211 | 14,343.208 | 15,369.594 | 0.767 |
| 6 | −7035.273 | 14,503.150 | 14,568.150 | 14,296.744 | 15,776.454 | 0.761 |
| 7 | −7017.263 | 14,520.373 | 14,593.373 | 14,288.563 | 15,921.108 | 0.760 |
| Characteristics | Class 1 Indifferent (n = 412) | Class 2 Engaged (n = 365) | Statistics |
|---|---|---|---|
| Economic Sector * | |||
| Secondary | 111 (26.9%) | 68 (18.6%) | |
| Tertiary | 301 (73.1%) | 297 (81.4%) | |
| Number of Employees | |||
| 1 to 9 | 390 (94.7%) | 320 (87.7%) | |
| 10 to 49 | 17 (4.1%) | 31 (8.5%) | |
| 50 to 199 | 3 (0.7%) | 9 (2.5%) | |
| more than 200 | 2 (0.5%) | 5 (1.4%) | |
| Annual Turnover (in €) | |||
| 0~300,000 | 196 (47.6%) | 164 (44.9%) | |
| 300,001~700,000 | 21 (5.1%) | 20 (5.5%) | |
| 700,001~1,500,000 | 10 (2.4%) | 17 (4.7%) | |
| 1,500,001~6,000,000 | 4 (1.0%) | 5 (1.4%) | |
| more than 6,000,000 | 4 (1.0%) | 6 (1.6%) | |
| not informed | 177 (3.0%) | 153(1.9%) |
| Wald | df | p-Value | |
|---|---|---|---|
| goal3_rank | 135.636 | 1 | <0.001 |
| goal7_rank | 156.278 | 1 | <0.001 |
| goal8_rank | 137.368 | 1 | <0.001 |
| goal9_rank | 114.904 | 1 | <0.001 |
| goal10_rank | 132.286 | 1 | <0.001 |
| goal12_rank | 144.624 | 1 | <0.001 |
| goal13_rank | 145.822 | 1 | <0.001 |
| Estimate | SE | Z | p | OR | OR (CI 95%) | ||
|---|---|---|---|---|---|---|---|
| goal3_rank | |||||||
| low—very low | 0.899 | 0.260 | 3.464 | <0 .001 | 2.458 | 1.478 | 4.089 |
| medium—very low | 1.439 | 0.285 | 5.047 | <0 .001 | 4.217 | 2.411 | 7.375 |
| high—very low | 2.763 | 0.269 | 10.282 | < 0.001 | 15.846 | 9.358 | 26.833 |
| very high—very low | 3.768 | 0.343 | 10.997 | < 0.001 | 43.309 | 22.125 | 84.774 |
| goal7_rank | |||||||
| low—very low | 1.734 | 0.331 | 5.233 | <0 .001 | 5.665 | 2.959 | 10.847 |
| medium—very low | 2.708 | 0.397 | 6.829 | < 0.001 | 14.999 | 6.895 | 32.628 |
| high—very low | 4.115 | 0.333 | 12.344 | <0 .001 | 61.240 | 31.864 | 117.698 |
| goal8_rank | |||||||
| low—very low | 1.770 | 0.408 | 4.337 | <0 .001 | 5.870 | 2.638 | 13.062 |
| medium—very low | 2.591 | 0.399 | 6.489 | <0 .001 | 13.348 | 6.102 | 29.199 |
| high—very low | 4.044 | 0.407 | 9.936 | <0 .001 | 57.071 | 25.702 | 126.728 |
| very high—very low | 5.743 | 0.499 | 11.500 | < 0.001 | 312.057 | 117.256 | 830.485 |
| goal9_rank | |||||||
| low—very low | 0.663 | 0.269 | 2.465 | 0.014 | 1.940 | 1.145 | 3.285 |
| medium—very low | 1.443 | 0.252 | 5.722 | <0 .001 | 4.235 | 2.583 | 6.943 |
| high—very low | 2.353 | 0.281 | 8.359 | <0 .001 | 10.513 | 6.055 | 18.251 |
| very high—very low | 3.807 | 0.347 | 10.955 | <0 .001 | 45.005 | 22.776 | 88.930 |
| goal10_rank | |||||||
| low—very low | 1.412 | 0.354 | 3.983 | < 0.001 | 4.102 | 2.048 | 8.216 |
| medium—very low | 2.390 | 0.335 | 7.133 | <0 .001 | 10.910 | 5.658 | 21.036 |
| high—very low | 3.607 | 0.355 | 10.153 | <0 .001 | 36.871 | 18.376 | 73.982 |
| very high—very low | 5.079 | 0.445 | 11.420 | <0 .001 | 160.643 | 67.188 | 384.090 |
| goal12_rank | |||||||
| low—very low | 2.132 | 0.627 | 3.401 | <0 .001 | 8.431 | 2.468 | 28.805 |
| medium—very low | 3.987 | 0.603 | 6.607 | <0 .001 | 53.891 | 16.514 | 175.861 |
| high—very low | 5.191 | 0.617 | 8.418 | <0 .001 | 179.609 | 53.638 | 601.427 |
| very high—very low | 6.507 | 0.662 | 9.831 | <0 .001 | 670.095 | 183.099 | 2.452.371 |
| goal13_rank | |||||||
| low—very low | 2.256 | 0.264 | 8.559 | < 0.001 | 9.544 | 5.693 | 15.998 |
| medium—very low | 3.465 | 0.249 | 13.935 | < 0.001 | 31.980 | 19.643 | 52.065 |
| 1 | 2 | 3 | 4 | 5 | 6 | 7 | |
|---|---|---|---|---|---|---|---|
| 1. goal3_rank | — | ||||||
| 2. goal7_rank | 0.305 *** (0.240; 0.368) | — | |||||
| 3. goal8_rank | 0.562 *** (0.512; 0.608) | 0.369 *** (0.360; 0.428) | — | ||||
| 4. goal9_rank | 0.370 *** (0.308; 0.429) | 0.249 *** (0.182; 0.314) | 0.450 *** (0.392; 0.504 | — | |||
| 5. goal10_rank | 0.444 *** (0.386; 0.499) | 0.368 *** (0.306; 0.427) | 0.580 *** (0.532; 0.625) | 0.342 *** (0.278; 0.403) | — | ||
| 6. goal12_rank | 0.402 *** (0.341; 0.459) | 0.666 *** (0.625; 0.703) | 0.474 *** (0.418; 0.527) | 0.396 *** (0.335; 0.454) | 0.443 *** (0.385; 0.498) | — | |
| 7. goal13_rank | 0.306 *** (0.241; 0.369) | 0.565 *** (0.516; 0.611) | 0.297 *** (0.231; 0.360) | 0.252 *** (0.185; 0.317) | 0.325 *** (0.261; 0.387) | 0.606 *** (0.560; 0.649) | — |
Publisher’s Note: MDPI stays neutral with regard to jurisdictional claims in published maps and institutional affiliations. |
© 2021 by the authors. Licensee MDPI, Basel, Switzerland. This article is an open access article distributed under the terms and conditions of the Creative Commons Attribution (CC BY) license (http://creativecommons.org/licenses/by/4.0/).
Share and Cite
Gallardo-Vázquez, D.; Hourneaux Junior, F.; da Silva Gabriel, M.L.D.; Valdez-Juárez, L.E. On Earth as It Is in Heaven: Proxy Measurements to Assess Sustainable Development Goals at the Company Level through CSR Indicators. Sustainability 2021, 13, 914. https://doi.org/10.3390/su13020914
Gallardo-Vázquez D, Hourneaux Junior F, da Silva Gabriel MLD, Valdez-Juárez LE. On Earth as It Is in Heaven: Proxy Measurements to Assess Sustainable Development Goals at the Company Level through CSR Indicators. Sustainability. 2021; 13(2):914. https://doi.org/10.3390/su13020914
Chicago/Turabian StyleGallardo-Vázquez, Dolores, Flavio Hourneaux Junior, Marcelo Luiz Dias da Silva Gabriel, and Luis Enrique Valdez-Juárez. 2021. "On Earth as It Is in Heaven: Proxy Measurements to Assess Sustainable Development Goals at the Company Level through CSR Indicators" Sustainability 13, no. 2: 914. https://doi.org/10.3390/su13020914
APA StyleGallardo-Vázquez, D., Hourneaux Junior, F., da Silva Gabriel, M. L. D., & Valdez-Juárez, L. E. (2021). On Earth as It Is in Heaven: Proxy Measurements to Assess Sustainable Development Goals at the Company Level through CSR Indicators. Sustainability, 13(2), 914. https://doi.org/10.3390/su13020914