Article

Integrated Approach for the Assessment of Strategies for the Decarbonization of Urban Traffic

1
Chair of Methods for Product Development and Mechatronics, Technische Universität Berlin, Straße des 17. Juni 135, 10623 Berlin, Germany
2
Chair of Transport Systems Planning and Transport Telematics, Technische Universität Berlin, Salzufer 17-19, 10587 Berlin, Germany
*
Author to whom correspondence should be addressed.
Sustainability 2021, 13(2), 839; https://doi.org/10.3390/su13020839
Submission received: 4 December 2020 / Revised: 13 January 2021 / Accepted: 13 January 2021 / Published: 16 January 2021

Abstract

:
This paper presents a new methodology to derive and analyze strategies for a fully decarbonized urban transport system which combines conceptual vehicle design, a large-scale agent-based transport simulation, operational cost analysis, and life cycle assessment for a complete urban region. The holistic approach evaluates technical feasibility, system cost, energy demand, transportation time, and sustainability-related impacts of various decarbonization strategies. In contrast to previous work, the consequences of a transformation to fully decarbonized transport system scenarios are quantified across all traffic segments, considering procurement, operation, and disposal. The methodology can be applied to arbitrary regions and transport systems. Here, the metropolitan region of Berlin is chosen as a demonstration case. The first results are shown for a complete conversion of all traffic segments from conventional propulsion technology to battery electric vehicles. The transition of private individual traffic is analyzed regarding technical feasibility, energy demand and environmental impact. Commercial goods, municipal traffic and public transport are analyzed with respect to system cost and environmental impacts. We can show a feasible transition path for all cases with substantially lower greenhouse gas emissions. Based on current technologies and today’s cost structures our simulation shows a moderate increase in total systems cost of 13–18%.

1. Introduction

The issues of climate protection, protection of local air quality, limited urban space, and the scarcity of resources suggest that the transport system needs to adjust to these challenges. In 2019, the European Commission agreed on the “European Green Deal”, which includes having net zero emissions of greenhouse gases (GHG) by 2050 and decoupling of the economic growth from resource use. To achieve this goal, “a 90% reduction in transport emissions is needed by 2050” [1]. With 162 million tons emitted GHG-equival. in 2018, the transport sector is the third largest cause of GHG emissions in Germany, and progress in GHG reduction in this sector over the last decade was slower than in other sectors. Approx. 59% of the transport-related GHG emissions are caused by private cars and more than 35% are caused by trucks and buses [2]. In addition, increased concentrations of nitrogen oxide and particulate matter caused by internal combustion engines are held responsible for health issues in metropolitan areas. Furthermore, many urban transport systems are already at the limit of their capacity. Overcrowded public transport and traffic jams during rush hours as well as a shortage of parking spaces are problems known from many metropolises. In addition, both a higher individual mobility demand and a further growth of cities is predicted for the future. To maintain operation in the same way, urban transport systems would have to be massively expanded. Since the transport system competes for the scarce urban space with urgently needed living space, pedestrian zones and local recreation areas such as parks and playgrounds, its further increase would have consequences in terms of social equality and urban quality of life. Furthermore, insisting on fossil fuels for urban transport systems would further increase the problems of air pollution and climate change. Last but not least, petroleum-based transport systems are dependent on fossil, limited resources, which might cause shortages in the future.
Several variations to the transport system have been developed and introduced in recent years. Firstly, the share of vehicles with locally emission-free drive trains—battery electric and fuel cell electric—is increasing. These technologies hold the potential to drastically reduce local as well as global emissions. Next, the mode of transportation is under review: a shift from motorized individual transport to more environmentally friendly modes such as public transport are encouraged and supported in many places. Finally, new modes of transport evolve. These are mainly located in the field of the sharing economy and range from various vehicle sharing concepts to ride sharing and ride pooling. Together with the possible breakthrough of autonomous driving, they offer a high potential to revolutionize urban transport. A large number of research projects on the individual technologies and innovations have been carried out and published. An example from the vast body of literature on this topic is [3,4,5,6].
However, all of the above studies only consider individual modes of transport and not the entire transport system. Furthermore, the cost and the environmental effects of procurement, operation and disposal are not taken into account. It is also assumed that electricity can be generated entirely from renewable sources. Finally, previous scientific papers focus one-sidedly on the introduction of either battery electric vehicles or fuel cell electric vehicles (or other alternatives) as a possible strategy. However, to provide useful insights into possible strategies for decarbonizing urban traffic, this perspective has to be significantly broadened. The entire transport system, including production, procurement and disposal of its vehicles, has to be considered. Also, all relevant carbon free propulsion systems have to be investigated, both as individual solutions and in economically and ecologically optimized combinations.
Such a holistic view of the transport system and all available drive technologies can provide realistic and feasible solutions and also show their ecological, economic and social effects at a significant level, namely for an entire urban region. This is the approach of the project zeroCUTS (zero carbon urban transport system) [7,8].
This project investigates several different strategies through the development of technical concepts for vehicles and infrastructure, the vehicle concepts’ deployment in a multi-agent transport simulation, and the subsequent analysis of complete life cycle implications. The life cycle analysis includes ecological, social and economic investigations and the development of charging strategies for the operation. In contrast to previous work, the consequences of a transformation to several fully decarbonized transport system scenarios will be quantified across all traffic segments, taking into account procurement, operation, and disposal. In this context, we develop and combine methods to examine both current and expected future usage profiles and consider battery-electric vehicles and fuel cell electric vehicles. The results are compared to conventional drives, which serve as a baseline. Our framework combines vehicle design, agent-based transport simulation, cost, environmental, and operational analyses. The aim and mission of this project is the development of a framework which enables us to analyze, optimize and verify different scenarios to decarbonize urban transport. It can be applied to arbitrary regions and transport systems; we choose the metropolitan region of Berlin-Brandenburg as a demonstration case. We develop and analyze three different strategies and various technological options to make recommendations on decarbonization pathways for transport authorities and decision makers. In this paper, we will present insights into the methodology as well as the first results of this research project and thus aim to contribute to the efficient and sustainable creation of tomorrow’s urban transport system.

2. State of the Art

Damidavičius et al. [9] assessed sustainable mobility measures. They applied multi criteria decision making methods to urban transport systems to analyse their sustainability and enable the comparison of cities. Alves et al. [10] used agent-based simulation to investigate impacts of delivery lockers and the number of delivery attempts in parcel delivery. They analyzed operational and external costs. Their results show that delivery lockers and the exclusion of the third delivery attempt produce benefits. Figliozzi et al. [11] compared the full life cycle emissions of urban parcel delivery with diesel powered vans to a service using only electric cargo tricycles. To do so, they developed an algorithm that optimizes delivery tours in terms of life cycle emissions and apply it to a small delivery service in Portland, Oregon. They came to the obvious conclusion that electric tricycles cause significantly fewer emissions than diesel vans. However, they also found that more vehicles are needed, and thus more drivers. The resulting economic disadvantages are noted, but not quantified. A comparison with BEV vans was also not carried out, so that a real benefit assessment of the tricycles is not possible. Also, only the last mile of one segment of urban transport is addressed. The big picture, including heavy duty trucks which are responsible for a large share of emissions and noise, is not considered. Spangher et al. [12] used a novel agent-based simulation to quantify the impact of electric vehicle sales on light-duty vehicle fleet CO 2 emissions in the US. Their model enables analyses of transportation policies which affect vehicle adoption scenarios. They focused on nation-wide effects and passenger cars. Dhar et al. [13] also focused on nation-wide effects. They investigated future scenarios for India’s transport sector, their main focus is on passenger and freight transport, but not on urban areas with their individual requirements. They showed that in order to achieve 1.5 °C temperature stabilization, direct actions and transformations in technology and human behaviour are essential. Golightly et al. [14] developed a multi-modelling approach for urban rail decarbonization but did not include other transport segments. Küng et al. [15] analyzed CO 2 reduction potential of different vehicle fleet compositions, considering different CO 2 intensities of the electricity mix. They found that the CO 2 -optimized fleet is strongly dependent on electricities’ CO 2 intensity. To the best of our knowledge, there is no project which covers various urban transport strategies supported by vehicle design, agent-based traffic simulation, development of charging concepts and sustainability assessments with life cycle perspective. In the following section, we therefore discuss the state of the art in these four fields separately.

2.1. Vehicle Design

Designing vehicles for a given requirements profile is one of the core activities of automotive companies. Accordingly, this process is at a high level of maturity, even for advanced technologies such as the battery electric drive. For the development of specific vehicles there are a multitude of references which cannot be listed here entirely. An overview is given in [16,17].
The role of scientific research is in the conceptual development of significant new vehicle concepts or their application strategies. For example, Gherairi [18] presented an architecture and a management system for a battery supercap fuel cell hybrid storage system that can compensate for the problems of poor fuel cell response time and, due to the high peak performance of the ultracapacitor, shows better behavior in phases with high power demand. Lee et al. [19] on the other hand, have presented an approach based on reliability-based design optimization that optimizes shared autonomous electric vehicles (SAEV’s) deployment planning and strategy to better deal with uncertainties and disruptions. Last, Göhlich et al. [20] focused on the optimal layout of batteries in the conceptual design process of electric bus systems for urban applications. All three presented directions of research, overall system design, component optimization and operational strategy optimization have intersections with this project. However, there are significant additional needs resulting from the scope of this research work. It is not sufficient to focus on a specific vehicle. In fact, different vehicles have to be designed for different applications, since all traffic segments are considered in different future scenarios.
To the best of the authors’ knowledge, no such framework exists.

2.2. Traffic Simulation

Traffic simulation allows an exact illustration of essential aspects of a transport system. This can be, e.g., the traffic flow along certain roads or the number of passengers in a train. The so-called four-step process for traffic modeling [21] consists of the following steps: (1) trip generation, (2) trip distribution, (3) modal split and (4) route assignment. Thanks to increasingly powerful computers as well as more complex data and econometric methods, traffic models have moved more and more away towards dynamic modeling of individual road users in recent decades. Two major developments are:
  • The activity-based demand generation replaces the first three steps of the four-step process e.g., [22,23,24,25,26]. These models typically assume a synthetic population [27,28,29], for which person- or household-related activity chains or daily plans are created.
  • The dynamic assignment replaces the static assignment of origin-destination-pairs to flows on a link by an iterative, time-dependent simulation of trips defined by starting time, origin and destination e.g., [30].
Both approaches are linked by time-dependent, usually hourly, origin-destination matrices. These matrices, however, only pass hour flows, but no information about synthetic travellers, so that person-related aspects such as different monetary or time constraints are no longer available at the level of the dynamic assignment. From this reasoning follows the approach of the completely person-centered (“agent-based”) traffic simulation, which merges all four stages into an integrated approach [31,32,33,34,35,36].
In this simulation, synthetic persons are microscopically modelled along their daily activity chains according to a predetermined plan. Between two activities, the agents interact in the traffic with each other. At the end of the simulated period, usually one day, the executed plans of each agent are evaluated on the basis of the activities carried out.
Afterwards some of the agents have the opportunity to modify their daily plans, for example by switching to other transport modes or changing the route used. This iterative process is repeated several times until an equilibrium-like state is achieved [37]. In addition to passenger transport, freight transport is also considered [38,39,40] and currently under development. This includes solving a Vehicle Routing Problem (VRP) based on the transport simulation data e.g., [41,42].

2.3. Charging Concepts

For the complete electrification of urban road traffic, a sensible and efficient design of the charging infrastructure is one key factor [43]. This includes the location, the construction and the technical configuration of charging infrastructure. Accordingly, the development of charging strategies is highly relevant and requires verification to provide the necessary charging infrastructure for a 100% BEV strategy. There are some approaches to determine the required infrastructure: In Ireland, real data is collected from charging infrastructure in operation. The charging behavior of electric vehicle users is used to predict the necessary future charging systems [44]. Furthermore, Almaghrebi et al. [45] use machine learning approaches to predict the charging behaviour of electric vehicles before the start of the charging process to allow for a more efficient charging management. Micari et al. [46] analyze traffic flow data from a highway network. Based on the data, they place charging infrastructure and calculate the number of charging points. Another method determines the needed infrastructure by calculating an equivalent electric quantity based on fuel sales at gas stations [47]. Marquez-Fernandez et al. [48] integrated charging assessments in MATSim. However, the used MATSim scenario is designed for long-distance traffic in Sweden and urban areas’ challenges are not accosted explicitly. Liimatainen et al. [49] point out that even with today’s battery and charging technology, electric trucks can have great potential. For example, Libby Bradley [50] develop a method for a charging strategy for electrified trucks in Southern California. They use modelled truck travel pattern data to determine the optimal positions of the charging stations.

2.4. Life Cycle Perspective

In the context of our work, the life cycle perspective includes economic, ecological and social sustainability. Sustainability has been addressed by several models. Most models define three aforementioned main dimensions of sustainability [51,52]. Some models weigh all dimensions equally [51,52]. Others emphasize the ecological dimension above the social and the social above the economic, as societies cannot exist without ecosystems and economies cannot exist without societies [53].
The standard DIN EN ISO 14040 [54] offers a method to investigate possible environmental impacts for goods and services but lacks in describing how to deal with products in the development phase. Additionally, in the publications from recent years, results of life cycle assessments (LCA) in the field of EVs vary widely [55,56]. Several studies often address only the climate-related emissions rather than the overall environmental impact or concentrate on only one transport sector or vehicle [56,57,58]. Other studies such as [59] include several impact categories to evaluate the environmental impact, but neglect the production and end of life phase of the considered products. A more detailed description of LCAs in the field of vehicles and urban transport is presented in [60]. Along with changes in drive train technology and transportation strategies, implications for social and economic sustainability arise. Martinez and Viegas [61] underline that especially for urban regions, mobility is a key factor for human activities and thus influences economic development and social equity. Consequently, the impacts of the change of drive train technology and transport strategies need to be evaluated holistically, regarding ecological, social and economic sustainability.
In industry, automation technology has long been established and recently it has become popular in the service sector [62]. As a result of this development, autonomous vehicles no longer move only in enclosed but also public spaces. Projects such as [63] along with projects on automated service robots such as SWEEP [64] and MURMEL [65] are developed. Therefore, automation technologies will not only interact with specialized employees, but with natural persons in public areas. To tackle arising challenges and risks as early as possible, we already consider sustainability in the design phase of new robots and vehicles. Sustainability in product development is addressed by ecodesign tools [66] which only consider ecological aspects. Additionally, Sustainable Product Design [67] offers a more holistic approach, including economic and social concerns. However, as the method is based on quantitative indicators, its evaluation of social aspects is limited. A more detailed approach on social sustainability is possible with a social life cycle assessment (S-LCA) [68], but the analysis of products in the early concept phase has limited access to life cycle inventory (LCI) data. Schulte and Hallstedt [69] have integrated social aspects in risk management.
To tackle the economic dimension of sustainability, the total cost of ownership (TCO) is a widely used method, which has proven itself for the evaluation of the economic effects of transport systems. Kunith et al. applied the methodology to public transport systems [70]. Jefferies and Göhlich [71] refined the tool. Furthermore, the TCO method enables the evaluation of business-related aspects such as specific costs for vehicles per kilometer. As a result, we can estimate costs for the users of a transport system and demonstrate the feasibility of different strategies for the decarbonization of urban transport systems for businesses.

3. Overall Methodology

In the zeroCUTS project (zero Carbon Urban Transport System), we develop a new methodology to derive and analyze strategies for a fully decarbonized urban transport system. Our methodology combines vehicle design, a large-scale agent-based transport simulation, operational cost analysis, and life cycle assessment for a complete urban region. Our holistic approach evaluates technical feasibility, system cost, energy demand, transportation time and sustainability-related impacts of various decarbonization strategies which are applied to all segments of urban traffic. The methodology follows the approach depicted in Figure 1.
As a first step, we partition the entire urban road transport activity into five segments, as discussed in Section 3.1. As a baseline, we analyze the status quo of each segment. Then we generate different decarbonization strategies described in Section 3.2. We first consider a complete conversion of all segments from conventional propulsion technology (using internal combustion engines) to (zero emission) battery electric vehicles. In a second strategy, we assume the replacement of privately owned vehicles with a fleet of shared electric autonomous vehicles. A third strategy investigates other zero emission vehicle technologies, e.g., using fuel cell technology.
These strategies are applied to the different transport segments, and the combinations are evaluated. For the combinations of segments and strategies we specify vehicle concepts, infrastructure concepts and transport planning, as described in Section 3.3. These so-called scenarios are analyzed with our zeroCUTS Toolbox which is described in Section 4. In this paper we do not intend to analyze the complete combination of five transport segments with all three strategies. In this paper, we concentrate on the underlying approach and show the first results on the full conversion to BEVs in all segments.
The zeroCUTS methodology enables us to analyze, optimize and verify different strategies to decarbonize urban transport. It can be applied to arbitrary regions and transport systems, if an appropriate transport database is available; we choose the metropolitan region of Berlin-Brandenburg as a demonstration case. The results for the investigated strategies are compared to each other and to the reference case.

3.1. Transport Segments

As is common, we divide traffic into different transport segments, and build separate models for them. The segmentation is based on the way in which transport surveys are segmented in Germany. In the following, we describe these segments as we use them.
Private Individual Traffic: This segment describes all routes traveled by private vehicles, including the way to and from work.
Public Transport: In our work, public transport is defined as the modes of passenger transport provided by non-private, shared vehicles (buses, light rail, subways).
Commercial Goods Traffic: We consider commercial goods as being transported on a hub-and-spoke network—a widely used system in logistics. In contrast to transporting the goods directly between start and end point (e.g., producer and consumer), the goods are transported via one or more intermediate points (hubs). In the collection run (first mile), the goods from several shippers or shipment points are collected and transported to the first hub. There they are bundled for the main run to the next hub, etc. From the last hub, located in the region of the recipient, the goods are delivered to the recipients in the distribution run (last mile; refs. [72,73]. Because of our focus on urban traffic, we only consider the tours from the last hub to the recipients (distribution run).
Commercial Person Traffic: Commercial passenger transport is defined as “that part of commercial transport in which the main purpose of the transport is to carry passengers, as opposed to goods transport” [74]; commercial person traffic then is the traffic generated by those transports. Examples are nursing services or craftspeople on their way to the customer. Business trips are included, but not the journey to and from work.
Municipal Traffic: Municipal transport is another category of commercial traffic which includes, for example, waste disposal, street cleaning, emergency services and the police.

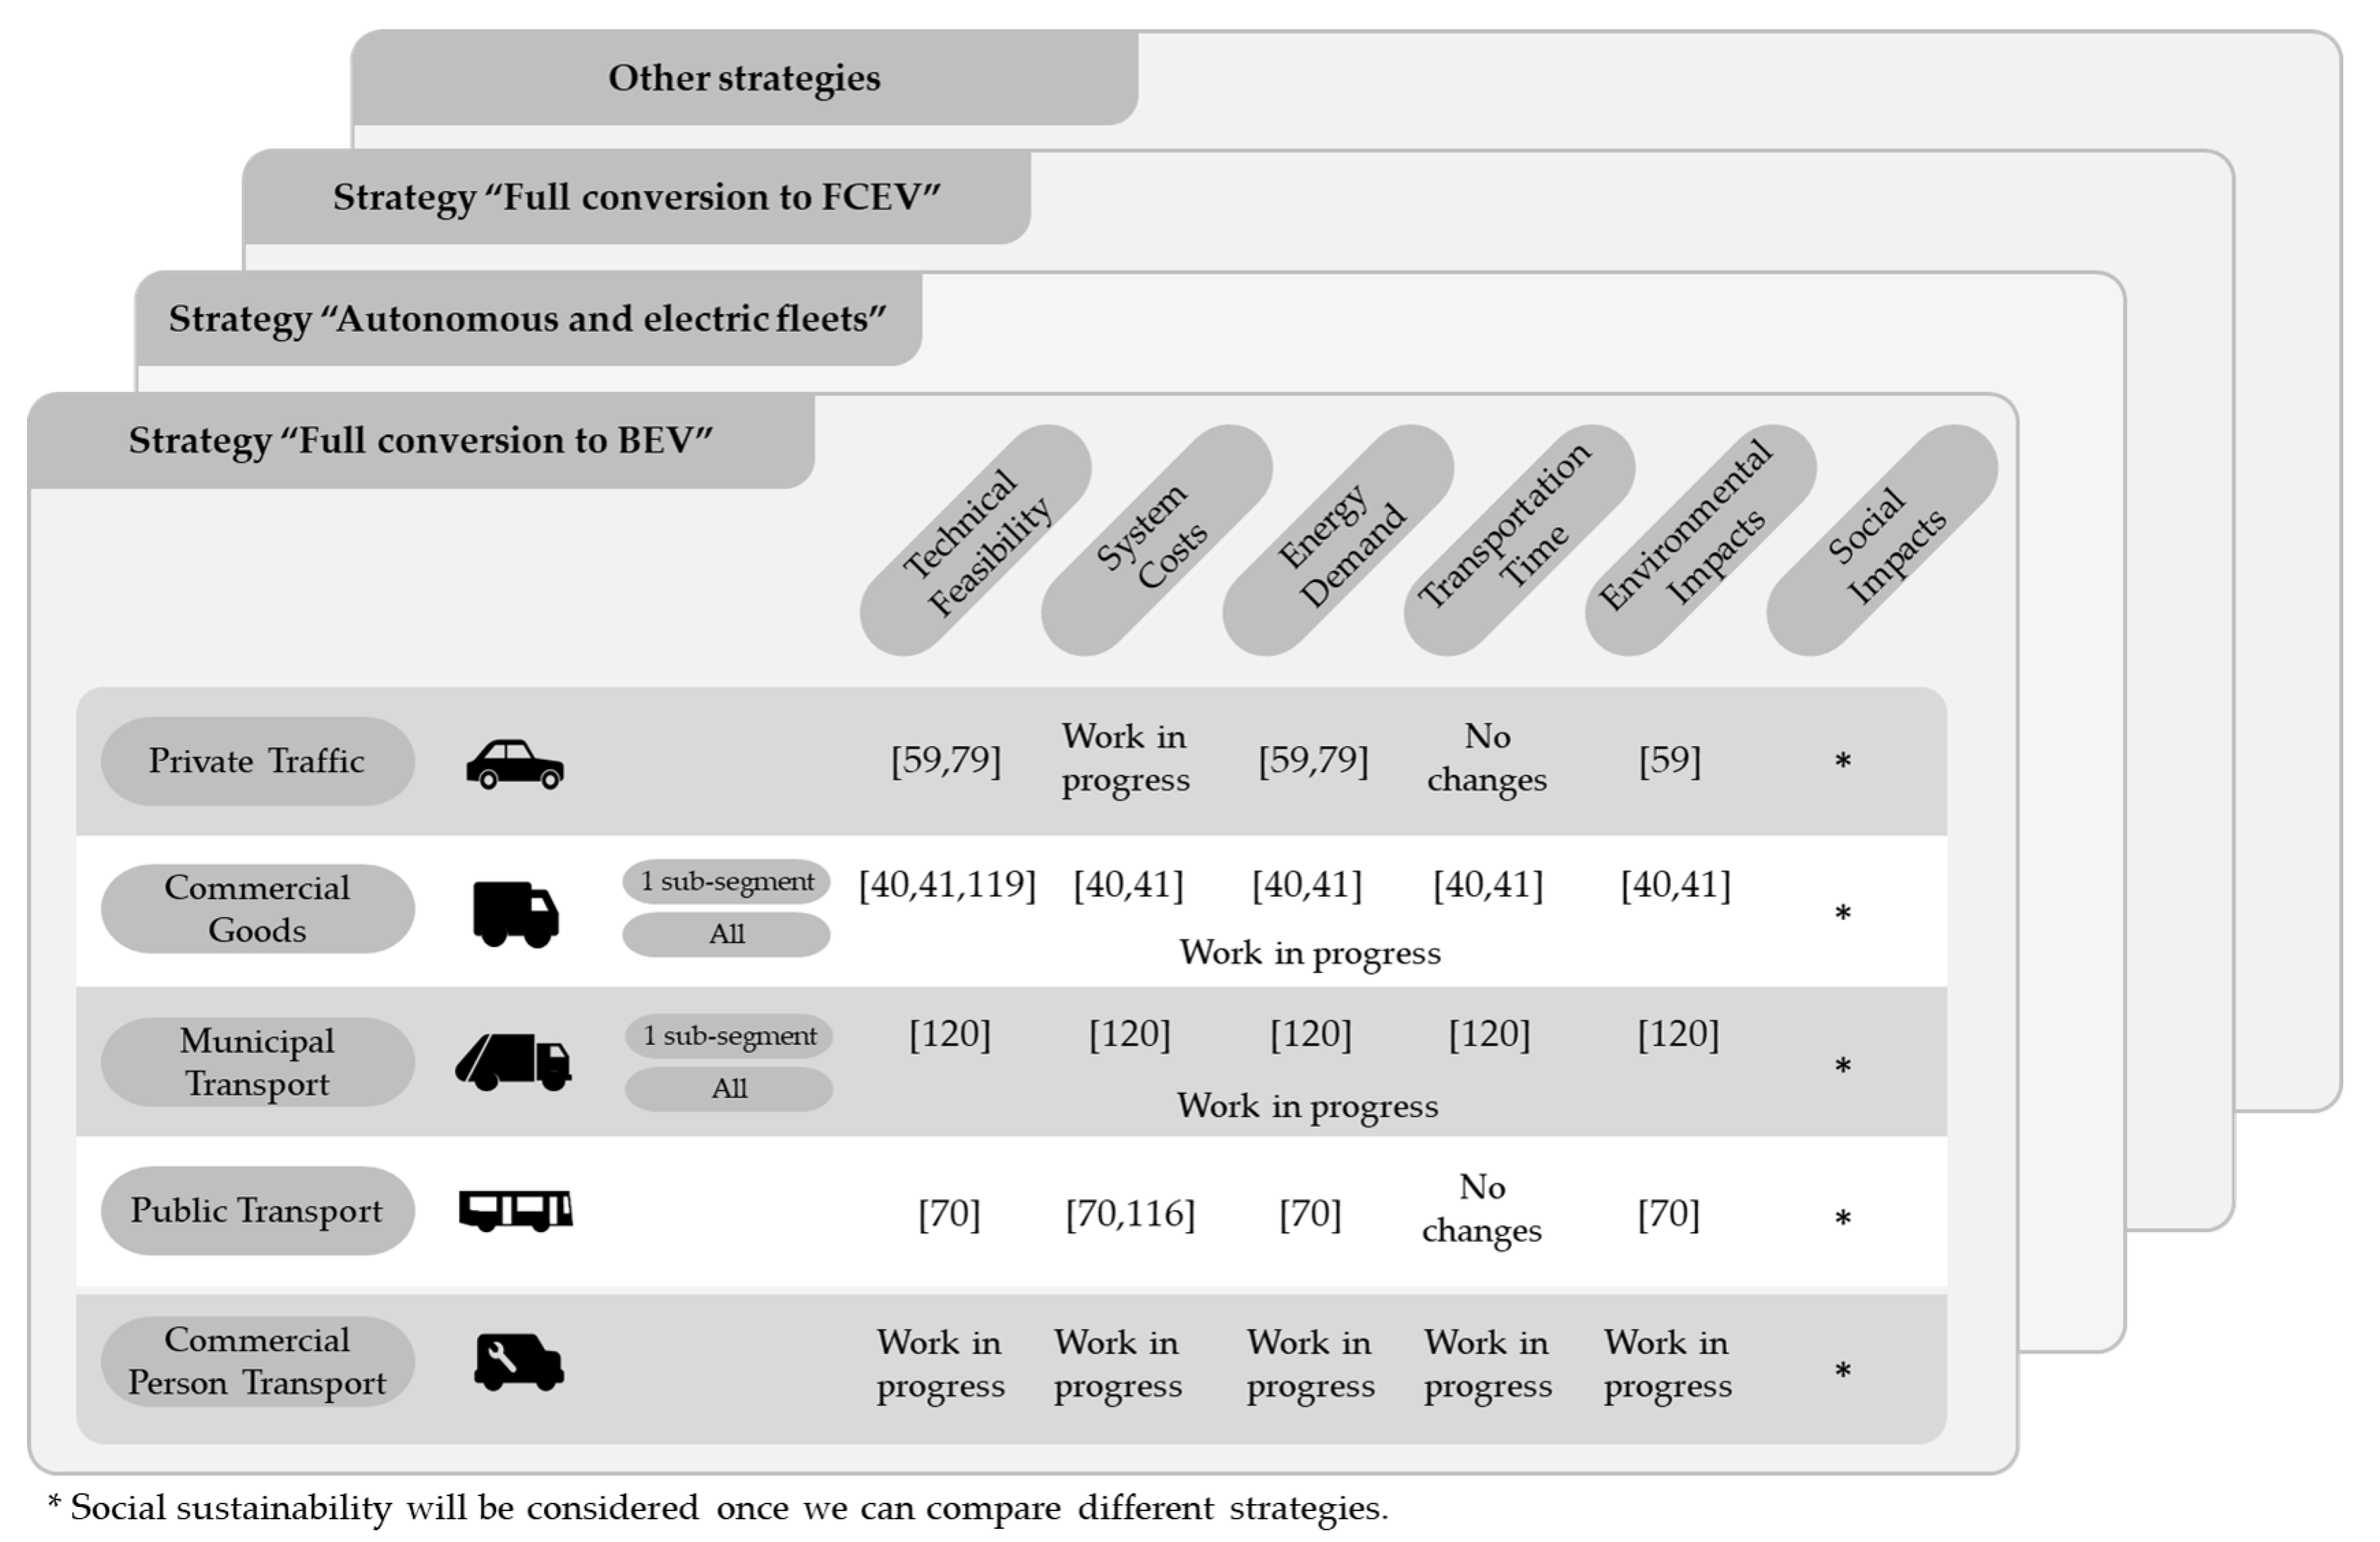
3.2. Possible Decarbonization Strategies

As the development of transport systems is subject to political decisions and technological developments, a singular prediction of their future state is impossible. Rather, different development options are conceivable. To take this into account, this project considers three different strategies that represent different visions for future urban transport.
Full Conversion to Battery Electric Vehicles: In the first strategy, we assume that the motorized part of today’s transport system changes to 100% battery electric vehicles while keeping the current operation, modal split and ownership structures unchanged. This strategy is the direct continuation of the electrification trend currently being pursued by many governments and the automotive industry. However, this strategy holds challenges. Firstly, adequate charging infrastructure is still under development and a challenge, especially in urban regions. Secondly, it is questionable whether the transition leads to a sufficient reduction of greenhouse gas emissions and air pollutants due to the high environmental impacts of the production of electric vehicles’ batteries. At the same time, problems such as congestion and competition for space are not addressed by a sole drivetrain transition.
Electric and Autonomous Fleets: Autonomous Vehicles will have a substantial impact on individuals, society, and on the environment. New transport modes, such as demand responsive transport systems and mobility as a service will change today’s mobility patterns drastically [75]. We investigate the impact with our second strategy. It envisions a fleet of shared autonomous electric vehicles (SAEVs) which replaces current individually owned vehicles (compare [76,77]). Several authors conclude that with this strategy, significantly fewer vehicles will be needed for the same mobility performance and that the problem of the charging infrastructure can be solved by intelligent route planning [61,78].
Conversion to Hydrogen Fuel Cell Vehicles: In addition to battery-electric vehicles, fuel cell technology also offers the potential for climate-neutral transport if the required hydrogen is produced using renewable energies. Therefore, strategies have been developed in numerous countries to use “green hydrogen” in combination with fuel cells on a large scale in the transport sector, e.g., in Germany with the National Hydrogen Strategy [79]. The high energy density of hydrogen storage is an advantage compared to batteries, but the poor efficiency chain is a problem. In this strategy, the advantages and disadvantages of hydrogen-based drive concepts (Fuel Cell Electric Vehicles, FCEV) are systematically investigated for all transport segments. Well-to-wheel (W2W) efficiency plays a particularly important role here. The production of hydrogen by electrolysis is an energy-intensive process. The question is whether the lower W2W efficiency can be offset by advantages in range and refuelling time in some cases, such as long range commuters or long range freight transport.

3.3. Segment-Specific Decarbonization Scenarios

The strategies described above are applied to the individual transport segments, if possible and reasonable (this is not the case for all combinations). The combinations of segment and strategy, which we refer to as scenarios, are specified in terms of vehicle and infrastructure concepts and transport planning. The scenarios considered for the previously defined segments are described below.
Private Individual traffic: Applying the 100% battery electric-strategy to the passenger transport seems technically and financially feasible. Battery electric passenger vehicles are technically on a high level of maturity and commercially available. For the complete electrification of urban private traffic, the development of an efficient charging infrastructure is one main factor. Questions on the location, the construction and the technical configuration of charging infrastructure are currently discussed by many researchers [44,46,80]. Previous research shows that taxis can be fully electrified without additional cost, including the additional acquisition/reprocurement costs of the battery and including investments in the charging infrastructure [81]. Long-distance car commuters could easily be converted to electric vehicles—they usually have good access to charging infrastructure at home, and battery capacities are already sufficient for most of the necessary distances.
Another promising approach is the replacement of private vehicles with a fleet of electrically powered autonomous vehicles (AVs) [76,82,83]. In Berlin, for example, this would result in 13% more traffic due to empty trips [83]; this could probably be compensated by a correspondingly higher performance of the roads when used by autonomous vehicles [84,85]. This results in an important symbiosis between automation and electrification, since the charging problem with autonomous vehicles largely disappears: It is now—according to Bischoff and Maciejewski [81]—the easily solvable task of the operator to charge the fleet as required for the expected demand. This also eliminates the problem of providing public charging infrastructure in urban areas, as the fleet operator can now set up and also manage corresponding charging points. Nonetheless, typical objections to such a scenario, in particular to driverless automation of vehicles, arise, for example, from the perspective of pedestrians or cyclists. The question of social acceptance of AVs, especially due to the aforementioned issue, is unsolved.
It is also possible to provide private passenger transport using vehicles with fuel cells. Well-to-wheel efficiency plays a particularly important role here because of the lower energy efficiency compared to BEV passenger cars.
Public Transport: In many cities, large proportions of public transport are already (locally) emission free. This includes most light rails, commuter trains and subways. The majority of rail transport services in Germany are operated electrically. On non-electrified lines, diesel trains can in some cases be substituted by battery-powered trains, which (similarly to e-buses) are recharged at stations or on sections of line with overhead lines [86].
The remaining segment of public transport which still relies on fossil fuels and covers important parts of public transport in Germany is bus transport. We therefore focus on this sub-segment.
Due to fixed routes and timetables, the full electrification of urban bus transport is subject to less organisational barriers than the electrification of private transport. It is, therefore, plausible to apply the 100% electric strategy to this transport segment. Indeed, public transport operators around the world are already in the process of transforming their bus fleets from conventional to electric vehicles, and many cities have made commitments to complete their bus fleet electrification during the next decade [87].
Due to high investment costs for batteries and charging infrastructure, electric bus systems currently still have an economic disadvantage compared with diesel buses [71]; this situation may be reversed by around 2025 as a result of rapidly declining battery prices [88].
If the autonomous fleet strategy is applied to private passenger transport, it automatically affects public transport as well, since the boundaries between the two segments blur. This raises the question of whether autonomous fleets will establish themselves as a complement or alternative to PT. This has implications for whether PT will remain in its current form or be completely replaced by the more flexible service of autonomous fleets, as described in [89,90]. Electric buses which are exclusively charged in depots still have severe range limitations when compared to diesel buses [71]. FCEV buses do not suffer from these range restrictions.
Commercial Goods Traffic: The 100% electrification of urban freight transport seems manageable, due to mainly short and medium distances, well planned routes and several options for charging infrastructure [41,42]. Autonomous electric fleets could also be an opportunity for urban freight transport. Many concept studies for autonomous shuttles are already equipped with interchangeable or combi bodies for people and freight transport (e.g., vision urbanetic [91], e-Palette Concept [92] ). It can therefore be advantageous to use autonomous vehicles to transport passengers during peak periods and goods during off-peak periods. This could increase the utilization of capacity, which could have positive effects on cost, environmental balance and traffic density [93]. The use of alternatives to the battery electric powertrain also seems promising for urban freight transport. For example, FCEV trucks could be a promising alternative to BEVs for very long routes. For this segment, a combination of scenarios holds additional potential. Fuel cell electric vehicles could operate the routes that exceed the reasonable ranges for battery electric trucks.
Commercial Person Traffic: Commercial person traffic is a very inhomogeneous segment that combines different vehicle types and different usage profiles. For a large part of this segment, 100% electrification seems to be a suitable strategy, as the vehicles are passenger cars and manageable distances are covered within the city limits (e.g., care services). The same holds true for light transport vehicles as used by craftsmen. For parts of the segment where little or no equipment needs to be transported, using autonomous electric fleets would also be conceivable. For heavier vehicles such as transport vehicles for construction workers, a strategy with fuel cells can also play a role for longer routes.
Municipal Traffic: Since police and emergency vehicles must be available at all times and therefore the long charging times of BEVs are a disqualifying factor, there are particularly difficult constraints for a conversion of the powertrain. Therefore we focus our work on the two groups waste disposal and road cleaning. Currently, these vehicles cause the highest specific noise and pollutant emissions of all the vehicle types considered. The challenges are among others: Special-purpose vehicles are characterized by energy-intensive auxiliary units, of which the energy requirement can be many times higher than energy requirement for driving—in the case of a street cleaning vehicle approx. 300% [94]; the economical operation of special electric vehicles is only possible if an appropriate charging infrastructure is available.
Due to the high specific energy consumption of the vehicles in this segment, the application of the 100% electric strategy may not be ecologically and economically feasible. The high energy demand and the resulting disadvantages of battery electric vehicles provide a high potential for fuel cell vehicles in this segment.
Finally, the application of the scenario with autonomous vehicles to the municipal services area could, for example, be the emptying of garbage cans with autonomous fleets of service robots [95].

4. zeroCUTS Toolbox

The building blocks of our zeroCUTS toolbox are shown in Figure 1. Realistic input data is crucial to perform meaningful simulations. For the reference case we can use the current vehicles population and the existing data on fuel consumption, cost etc. However, future scenarios are based on completely new vehicle technologies, which are currently evolving. The vehicle types and their specifications are set-up in the first module called “conceptual vehicle design” as described in Section 4.1. With these vehicles, we carry out an agent-based transport simulation described in Section 4.2. For buses, we rely on a different methodology described in Section 4.3. The results of the simulation are then used in subsequent analysis tools. First, the necessary charging/refueling infrastructure is determined by analyzing the simulated energy demand as described in Section 4.4. The last three tools are used to quantify the impact of our strategies on the overall sustainability of the transport system. As described in Section 2.4, we consider not only the ecological but also the social and economic dimensions of sustainability. To quantify the ecological impact of the considered strategies, Section 4.5 describes a life cycle assessment of whole transport systems using transport simulation outputs. Section 4.6 describes a method that reveals the social impact of the different strategies. This is important since especially the automation of vehicles has severe consequences on the social level. These consequences range from the loss of driver jobs to sociological and ethical questions about non-discriminatory, barrier-free and safe access to the transport system and individual mobility. To complete our consideration of the three sustainability dimensions and to ensure that an improvement of the mobility system in terms of ecological and social sustainability remains affordable for society and the individual, we perform a total cost of ownership (TCO) analysis which is described in Section 4.7.

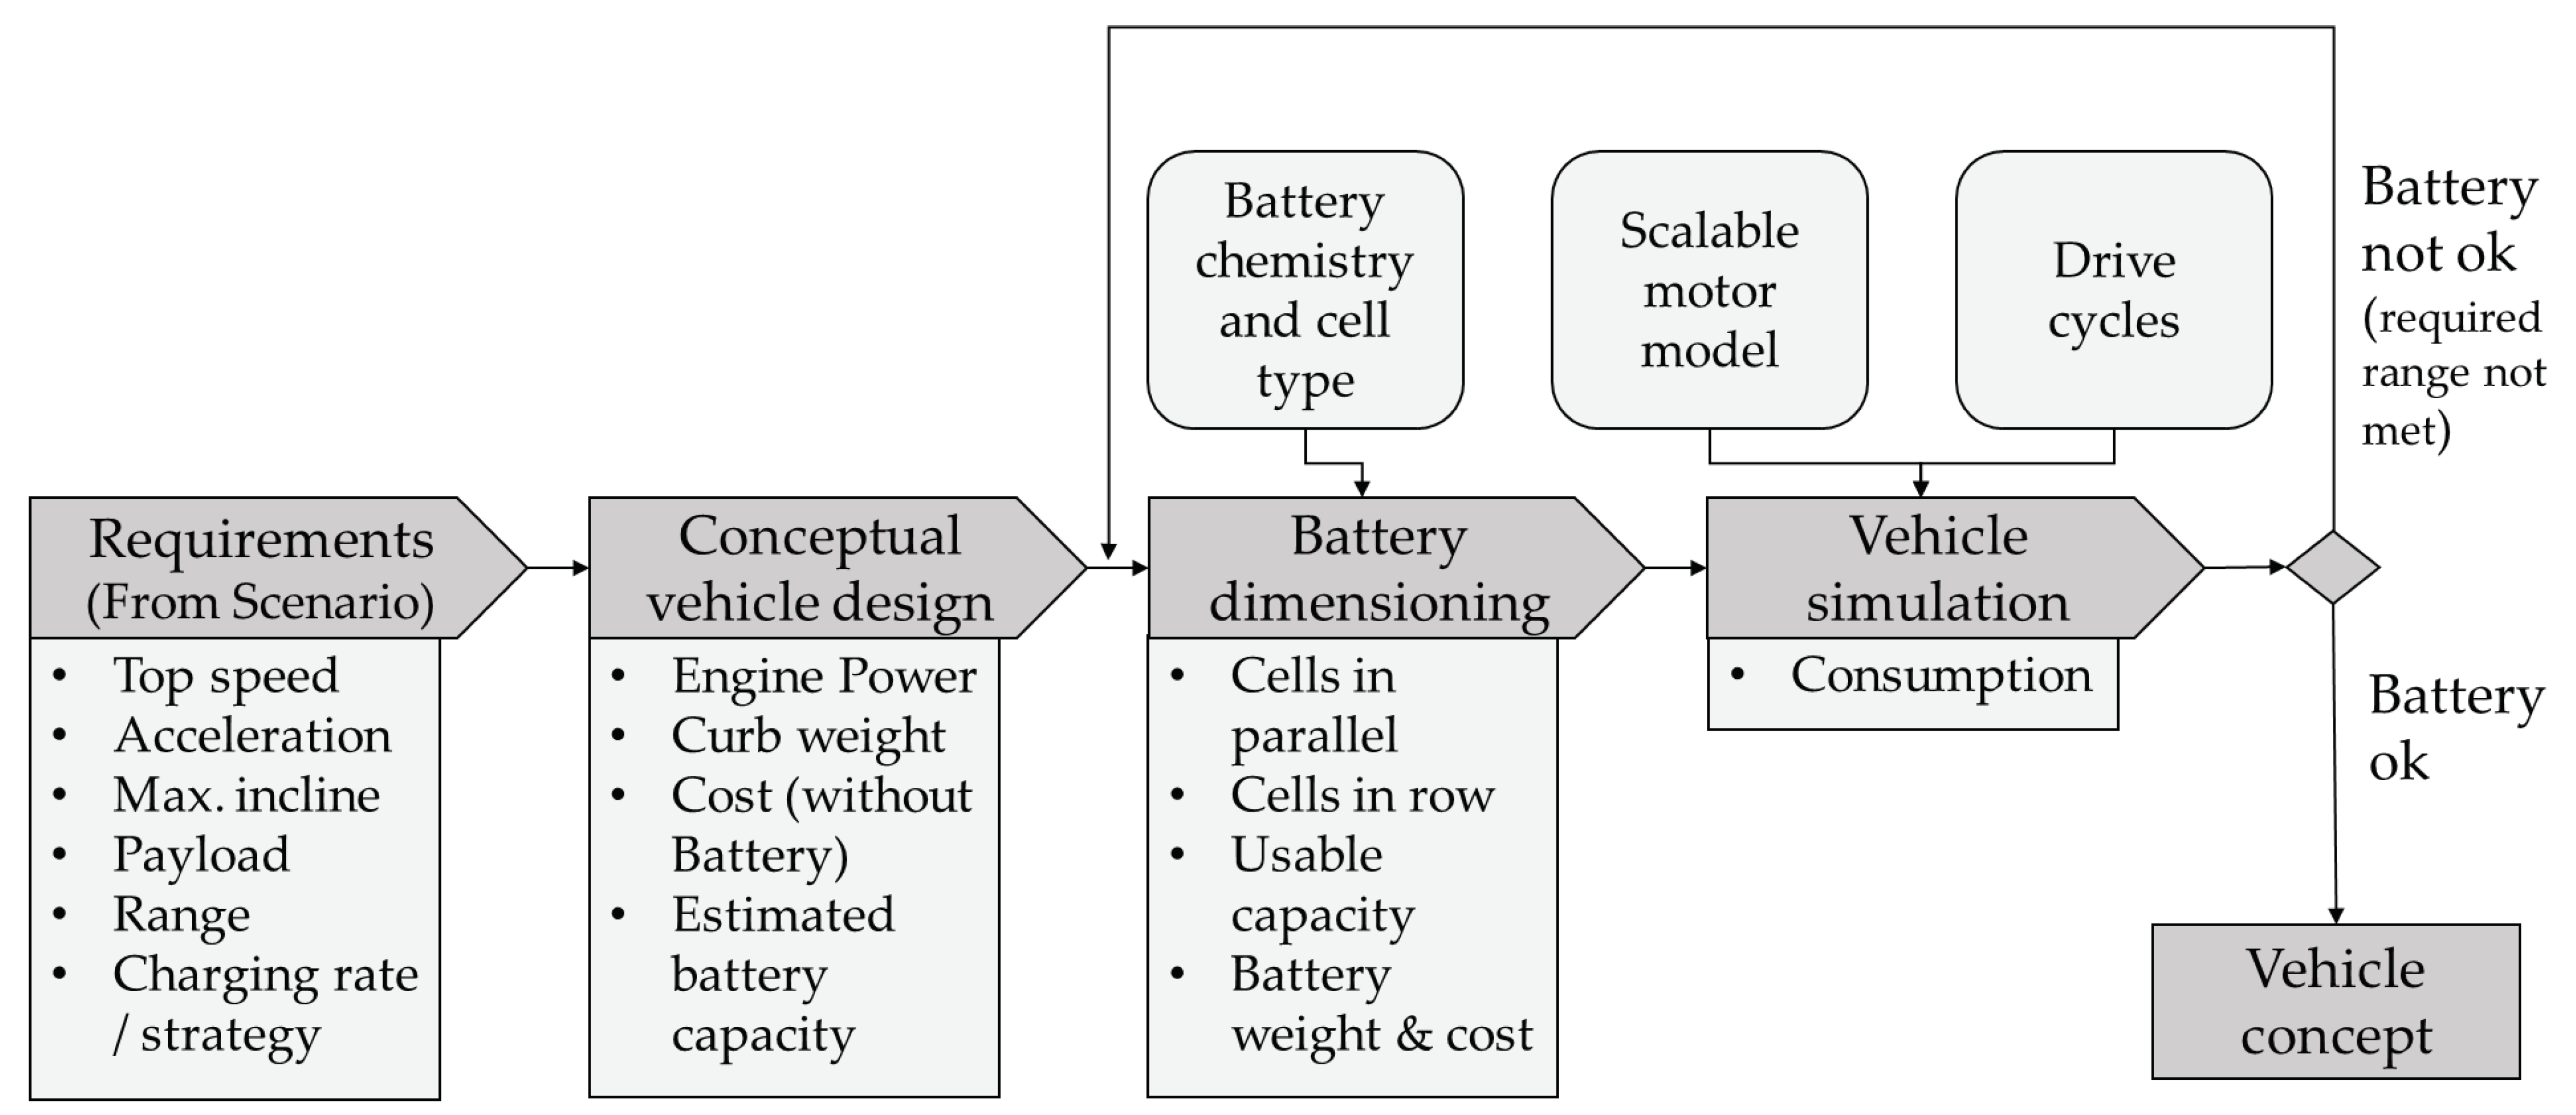
4.1. Conceptual Vehicle Design Method

For all methods in our toolbox (traffic simulation, TCO, LCA), detailed information about the vehicles under consideration is needed. Besides payload or maximum number of passengers, this especially concerns consumption, materials and costs. As soon as series production vehicles exist, it is possible to rely on manufacturer information, list prices and independent consumption tests under real conditions, e.g., from the ADAC [96] (a German passenger car association). For all conventional vehicles, this is a viable source of information.
In this project, however, many of the vehicle concepts under consideration are far from going into series production. In fact, electric cars and electric buses are the only vehicle types for which the required information can be obtained in the way described above. Some other vehicle types, such as electric trucks, already exist as prototypes or small series vehicles. Although credible information on the physical vehicle specifications can be obtained from the manufacturer, consumption data is not reliable and the current prices do not reflect the high market penetration we assume in this project. Other vehicles, especially autonomous fleet vehicles, exist only as studies and concepts.
This implies that the required information must be obtained by other means. Therefore, a design process for vehicle concepts is developed, which can specify the crucial components of the vehicle based on basic requirements. This is followed by a longitudinal dynamic simulation model to generate plausible consumption data. A scalable engine model is used in order to represent different power levels. An iterative process between battery dimensioning and simulation is used in order to right size the battery for the required range. The whole process is shown in Figure 2 and described in detail in the following.
The first step of the process is the identification of requirements for the needed vehicle concept. For scenarios that could be realized in the near future and only involve slight modifications of the current situation (e.g., electrification of urban logistics without adapting existing processes), a survey of potential users of the vehicles can be conducted. This process is in accordance with the requirement definition described in established engineering literature (compare [97]) and shall therefore not be described here. However, in this project, scenarios are considered that represent a possible condition that lies further in the future (e.g., autonomous shuttles for private transportation). Consequently, the standard requirement elicitation is no longer useful. To cope with this issue, a method for requirement elicitation in very early design phases is developed. First, the environment of the vehicle concept is analyzed. All factors influencing the possible concept or being influenced by it have to be found. Afterwards, the technique of scenario planning in combination with an expert workshop is used to determine the changes in the environmental factors in various conceivable future scenarios. This makes it possible to derive requirements that are at best applicable in all future scenarios. If this is not possible, a best-case and a worst-case requirement can be defined. This method is described in detail in [63].
Next, the conceptual design of the vehicle is carried out. This process also does not differ from existing methods described in the literature, except for the powertrain layout. For the powertrain layout, especially for the battery dimensioning, a tool developed by [98] has been adapted and enhanced. Since the existing model was used for a specific electric bus, a specific motor model was sufficient. In contrast, this project has to consider multiple different vehicle concepts from different segments. Therefore, a high variance in propulsion power and maximum torque is needed. Thus, a scalable engine model capable of modeling permanent magnet synchronous as well as induction motors is developed. Two different approaches were examined. Firstly, an attempt was made to obtain characteristic maps of existing engines in different power and torque classes and to map any desired power and torque by interpolation. The second approach involves physical modeling of the engines. Both models were verified using maps of existing motors with known characteristics.
In the map-based simulation model, several engine maps with different maximum torques would be required per power output. This would allow more specific scaling for the desired engine characteristics. Unfortunately, these maps are not freely available to this extent. With the physical simulation model, this problem is eliminated. Power and maximum torque can be specified as required. Here it can be seen that areas from medium to high load show a particularly good agreement with the reference characteristic map. Therefore, this form of modeling serves best for our approach.
Afterwards, a longitudinal dynamics simulation based on Fay [98] is used to calculate the driving consumption using different drive cycles. So far, only NEDC and WLTP have been applied. However it is planned to generate more specific cycles for urban traffic.
Based on the requirements, the maximum range to be covered with one battery charge can be determined. In addition, the battery type (cell chemistry) must be determined based on the charging strategy. Since the battery has a decisive influence on the vehicle weight, which in turn has an impact on consumption, an iterative process is used to determine the required battery capacity. The longitudinal dynamics simulation is performed with a default capacity. Subsequently, it is determined how large the deviation of the simulated range from the range specification is. The battery capacity is adjusted accordingly and the simulation is repeated. This is done until the deviation between required and simulated range falls below a specific limit (0.1%). The result is the needed number of cells as well as the average consumption of the vehicle concept. These values can afterwards be used for the subsequent processes of the toolbox.
In the last step, based on the chosen technology, cost estimations are made. These are based on current prices or predictions for future price developments of the specific components.

4.2. Traffic Simulation

We then put the developed vehicle concepts into a traffic simulation. The traffic simulation “knows”, for example, the daily distance that each vehicle drives, or is able to compute the travel time and environmental consequences of pooled electric vehicles. For a traffic simulation to have that kind of information, it needs to follow each synthetic vehicle and each synthetic person individually. We use MATSim (Multi-Agent Transport Simulation), which is an open source software for building microscopic models of the transport phenomena under investigation [99]. The following three steps are necessary in order to investigate the effects of a policy measure:
  • Building a model of the base case
  • building a model of the policy case(s) and
  • comparing the results, e.g., costs and benefits.
Building a base case scenario for such a model is a considerable effort. Ziemke et al. [100] describe the process of initial demand generation for the Open Berlin scenario based on census data and commuter statistics. Hörl and Balac [101] describe an open-source workflow for generating fully replicable synthetic populations in the context of agent-based transport simulation. Another option is to use data that is generated by a privacy-compliant synthesization process from mobile phone data [102].
For our current project, we start from the pre-existing MATSim Open Berlin scenario [100], which includes a timetable-based public transit assignment and thus a simulation of individual public transport vehicles. For freight, we currently consider only certain sub-segments, mostly foods distribution, with the intention of using the same approach for other freight sub-segments. The general approach for freight traffic is to define the goods distribution centers and the receivers for urban goods, to define carriers that are responsible for a certain part of them, and then to run a fleet assignment and vehicle routing problem algorithm to produce concrete fleets and tours. This is achieved by the jsprit library [103], which is available as a plugin to MATSim. It uses elements such as fixed costs, variable costs, or range constraints as given by the vehicle design above.
It turns out that the remaining traffic segments, i.e., commercial person traffic as well as municipal traffic, can be modelled by a similar approach. e.g., services taking care of the elderly can also be modelled as fleet assignment and vehicle routing problem; even garbage collection can be modelled in that way by inverting the logic: Many “senders” send their material to one “receiver” (the waste processing plant). The latter case is treated in more detail in Section 5.4.

4.3. Electric Bus System Planning

Electric buses can be operated with several charging strategies: Depot charging, opportunity charging (usually at terminal stops), in-motion charging and battery swapping. Depot charging and opportunity charging are the most commonly used technologies [87].
Due to the limited range of depot charging buses and the charging time required at terminal stops for opportunity charging, existing schedules originally planned for conventional buses often cannot be served by electric buses, as Jefferies and Göhlich [71] demonstrate for a real-world bus network. Thus, bus operations have to be re-scheduled to be able to serve existing timetables with electric buses, i.e., the vehicle scheduling problem (VSP) has to be solved under range and charging time constraints. For TCO and LCA analysis, the resulting fleet size as well as infrastructure demand, energy demand and staff demand have to be determined. Jefferies and Göhlich [71] conduct a detailed review of existing methods to achieve this; they also present their own methodology comprising a greedy scheduling algorithm, a combined fleet and depot model based on discrete-event simulation and a genetic algorithm for cost-optimised charging infrastructure placement.
The MATSim public transport module models public transport buses based on real-world timetables. However, it currently does not generate vehicle schedules, but instead creates and destroys vehicle objects for every passenger trip. Therefore, only the peak in-service vehicle demand can be determined from MATSim simulations. Depot operations are currently not modelled. However, to obtain the actual fleet size, the charging process at the bus depot must be considered also, as Jefferies and Göhlich [71] illustrate. Therefore, we rely on the methodology and results presented therein to determine the implications of bus fleet electrification in our 100% electric strategy with unchanged bus timetables.

4.4. Charging Methodology for Traffic Simulation

The method is based on two steps as can be seen in Figure 3. In the first step, the charging demands are calculated by assigning simulated vehicle mileages to specific electric vehicle designs. The battery capacity, the consumption, the possible charging power, and the range of the vehicles are defined by the conceptual vehicle design method (see Section 4.1) or determined by current market data. We compute driven distances, activity types, activity durations, and the number of vehicles which are simultaneously at the same location by analyzing the respective MATSim scenario [80].
In the second step, we calculate temporally and locally resolved charging demands and full charging cycles (FCC). In doing so we differentiate between public charging at the roadside and charging on private parking spaces. This differentiation affects the positions and thus the number of charging stations. While the positions for private charging are necessarily on the private parking space, for public charging they must be identified based on the locally resolved charging demand. Afterwards, the number of charging stations have to be determined for each position.
In case of public charging, the number of charging stations is presented as a possible range, including normal and fast charging stations. For charging stations with small charging powers, the upper limit of the number of charging points is determined by the total number of vehicles that have a charging demand. To define the lower limit, we assume that vehicles are only charged when the state of charge (SOC) is 10% or below. However, the number of charging stations is not only determined by the theoretical demand. It depends on the behavior of the vehicles’ users. Sun et al. found that most private vehicle owners charge their vehicles at an SOC of 50% or higher [104]. Accordingly, we assume a threshold SOC to show the possible variation in the number of charging points.
For fast charging points, we derive another method, as the stop duration at those chargers is shorter compared to chargers with small charging power. The upper limit for those charging points is defined by the sum of the maximum number of vehicles at one certain link at the same time, neglecting the actual duration of the activity the agents are executing while charging. Therefore, the calculated number of charging points could be higher than the total number of vehicles. However, the theoretical demand alone is not sufficient to determine a realistic number of fast charging points. Hence, we assume that a vehicle is only charged if it stays at the activity for a certain time and we calculate the possible number of charging points for the different minimum length of stay [80].
To determine the charging power, we check the remaining distance the vehicles have to cover after charging and whether they reach their next destination without running into critical SOC. The charging power should not be over-dimensioned, but still high enough for the vehicles to reach the next possible charging destination. For this purpose, we look at the percentage of vehicles that manage to cover their route with different charging powers. When selecting the optimal charging performance, the costs of charging stations should also be taken into account, as for example fast charging stations are more expensive than normal charging stations [105].
The method is also applied to commercial fleets. We assume that the vehicles are parked in non-public depots. In the worst case, each vehicle has its own charging station overnight and the maximum number of charging stations is equal to the number of vehicles. In addition, fast charging points can be installed for short standing times during the day. The number of fast charging points is based on the number of vehicles that are in a depot at the same time. As these can also be used at night, the number of fast charging points is subtracted from the maximum number to obtain the number of normal charging points. This number can be minimised by charging several trucks one after the other at one single charging point overnight. For this purpose, the time that can be used for charging is multiplied by the charging power to derive the charging capacity. Now the charging demands of all vehicles are analyzed and the vehicles are assigned to the charging points. While regarding maximum charging power and available time, the vehicles are charged in a way that the charging capacity is used sufficiently without exceeding it. This problem corresponds to the “subset sum problem”, where a certain number of items should be selected from a set of items in order to reach a target value as high as possible without exceeding it [106]. An algorithm distributes the vehicles with different consumptions to a charging station and returns all remaining ones. Iteratively, the vehicles are distributed to the charging points. If the theoretical minimum number in this depot is less than the number of fast charging stations, this number is used. The total number is the sum of the number from each depot.

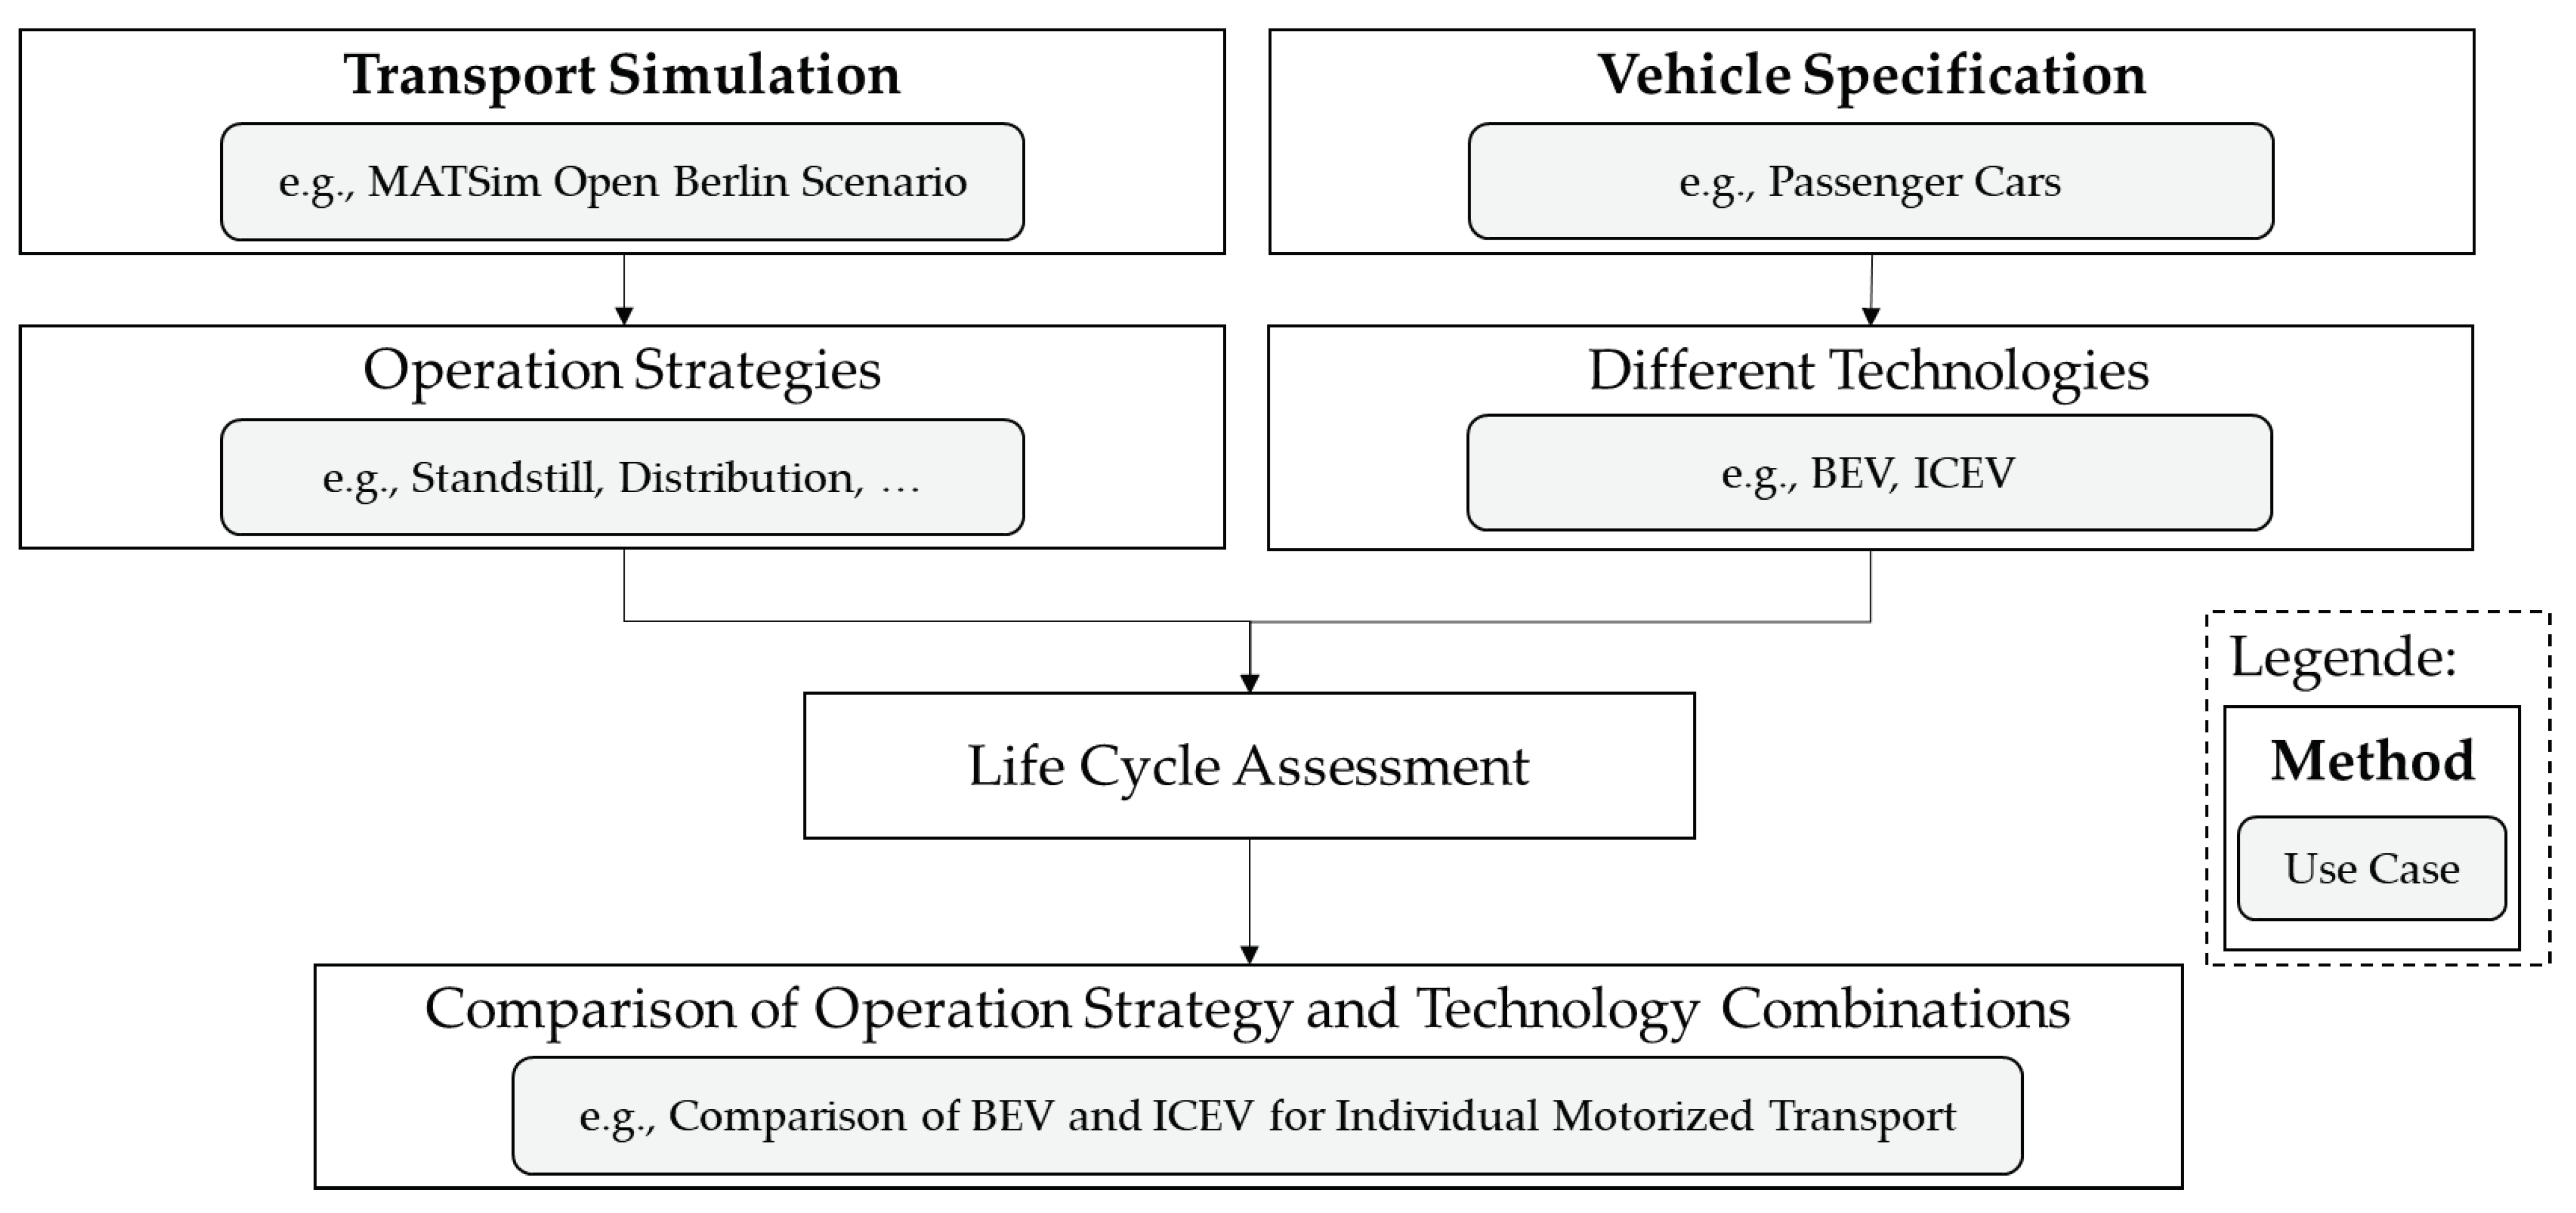
4.5. Life Cycle Assessment of Transport Systems

New drive train options result in a shift of environmental impacts within the vehicle life cycle. While Internal Combustion Engine Vehicles (ICEVs) emit the predominant share of their life time emissions as a result of the combustion of fossil fuels in the use phase, BEVs and FCEVs have higher emissions during the production, dominated by the battery production. New strategies, such as autonomous driving or Mobility on Demand (MoD), and new conditions (e.g., additional time required for battery charging) lead to varying numbers of vehicles and mileages for the same tasks. To compare the effects of such changes in the transport system with each other and with the status quo, a holistic assessment of emissions over the life cycle is necessary. The tool presented here (depicted in Figure 4) combines LCAs and the MATSim scenarios within one framework to derive results for vehicles with different drive train options and varying operation strategies [60].
First, single vehicle LCAs enable the validation of the results against other LCA results of comparable vehicles. After that, we perform the transport system LCAs (in which the vehicles operate) to investigate their environmental impacts. The well-to-wheel (WTW) methodology is used to analyze the environmental impact of the driving emissions of the simulated scenarios. This approach includes the GHG emissions from the production of the energy (diesel, electricity) as well as their use in the vehicle. The values are calculated per energy unit used. The WTW GHG emissions are then calculated ex-post by multiplying the observed kilometers driven by a vehicle as result of the transport simulation with its vehicle type specific energy consumption and the corresponding emissions factor per energy unit.
The agent-based transport simulation delivers several parameters for the use phase of the vehicles:
Road Categories: The links (from MATSim networks) differ in free speeds. We define three types of road categories with different free speeds: urban (free speed smaller or equal to 50 km/h; suburban (free speed greater than 50 and smaller or equal to 100 km/h); and highway (free speed greater than 100 km/h).
Lifetime Mileage: The MATSim scenarios cover one synthetic day [99]. In contrast, LCAs have to include the whole use phase of the vehicles. Therefore, we extrapolate the single simulation day to the whole vehicle lifetime. This approach differs for the respective transport segments: for the private transportation segment, we assume five unchanged simulation days per week plus two modified days with 82% of the simulated mileage representing the reduced traffic volume on weekends (based on [107]. For commercial segments (e.g., waste collection), we take the number of working days in the vehicle’s lifetime (days in the period without weekends and holidays) to calculate the lifetime mileage. A sensitivity analysis discloses the effect of increasing and decreasing lifetime mileage.
Synthetic Vehicles: The scope of this approach depends on the respective MATSim scenario and the corresponding vehicles. For the private segment (e.g., in Open Berlin v5.3), the simulation uses one generic vehicle. However, one vehicle does not represent the variety of vehicle segments in private transportation. Therefore, we defined three vehicle classes (small, medium, large) and parameterized respective dummies (compare [60]). For other transport segments (e.g., freight traffic), different vehicle types are already available in the traffic simulation and chosen by the tour planning algorithm depending on their cost effectiveness. For commercially available vehicles we compute their consumption for each vehicle class or type, along with the vehicle weight, the respective weight contributions of the vehicle body, powertrain and battery, as well as battery capacity, chemistry and weight based on manufacturer information and open available real driving emission (RDE) data. The same holds true for the respective parts of fuel cell electric vehicles (FCEV). When there are no commercially available vehicles or no RDE data, we use our vehicle design tool along with a vehicle simulation to create plausible vehicle specifications and consumption values. Literature review and common data sets (e.g., greet or ecoinvent) deliver the information to calculate the emissions of production and End-of-Life (EoL) of the vehicles. Additionally, the data serves to compute the fuel, hydrogen and electricity supply chains and the emissions from fuel combustion with their respective bio fuel shares, according to the WTW methodology. The emissions arising from electricity and hydrogen use strongly depend on their respective production. Sensitivity analyses provide clarity on their emissions regarding different scenarios with, e.g., only renewable energy sources.
Functional Unit: LCA uses the term “functional unit” to declare how results are made comparable. We compute the results, depending on the circumstances, per vehicle-km, per person-km, or per ton-km.
Impact Assessment: We assess several impact categories (for example the global warming potential) analogous to current studies [58,108,109]. Especially for the single vehicle LCAs, the results serve as validation against other studies [60].

4.6. Social Sustainability in Automation Technologies

There are several approaches to define sustainable ecosystems, for example the ecological footprint: Humanity’s ecological footprint must be smaller or equal to earth’s biocapacity. When defining key aspects for social sustainability, one question arises: What is a sustainable society? Biart distinguishes between sustainable and desirable societies [110]. There are normative and descriptive aspects, which need to be considered for the determination of societies’ sustainability goals [111]. Littig and Griessler [111] and Cocklin and Alston [112] offer definitions of social sustainability which we use as a first indication. Upon this indication, we developed a guideline to evaluate the quality of life for societies [113]. With several perspectives of social sustainability, accompanied by the sustainable development goals (UN), four key areas for social sustainability in automation technology arise: Quantitative effects on work, qualitative effects on work, peripheral effects and accessibility and equal opportunity [95]. These four areas are divided into sub-areas. The guideline includes recommendations and possibilities for evaluation.
Our guideline [113] shows for which tasks of automation it is not needed (because only advantages result from automation), for which tasks it is not applicable and for which it should be applied urgently or very urgently.
In the area “quantitative effects on work” the guideline suggests that automation should preferably transform jobs instead of completely replacing them and that involved employees should be included in the decision making process instead of just transferring them to different positions. In the area “qualitative effects on work”, the guideline suggests that automation should maximize the quality of work, including a diversity of tasks, and minimize physical and psychological dangers for human health. The third area deals with “peripheral effects”. Therein, the guideline suggests prevention instead of mitigation for the sub-area “ethical complications and responsibility issues”; the automation of tasks without human contact instead of tasks with human contact for the second for the sub-area “loss of socially viable services and contacts”, and in the sub-area “creation of hostile environments” a design for emotional responses instead of sole design for technical fulfilment. Furthermore, the guideline categorizes which subarea addresses which kind of automation and which kind of automation offers potential benefits or dangers to social sustainability.
As social sustainability is one part of overall sustainability, the analysis of possible interdependencies of the elaborated areas of social sustainability with the ecological and economic dimension of sustainability is included. All areas of social sustainability are connected to areas of ecological and economic sustainability. To demonstrate different levels of interconnections, the interdependencies are divided into weak and strong [95].
The method was developed originally for a service robot [95]. In the project zeroCUTS it will be adapted to the strategy “electric and autonomous fleets” and applied to the scenario of motorized individual traffic.

4.7. Total Cost of Ownership

When analyzing and comparing the long-term financial impacts of procurement decisions, the total cost of ownership (TCO) analysis is a commonly used tool which includes purchase and whole life cycle variable costs [114,115].
Several authors applied this method successfully to investigate various technological options of electric mobility solutions under development [116]. Therefore, this method is well suited for the presented work. Our adapted approach follows Jefferies and Göhlich [117].
The product lifetime of vehicles amounts to 10 years, of charging infrastructure to 20 years and we expect the capital expenditure’s annualization with an average interest rate of 4%, based on Jefferies and Göhlich [117].
According to current research, electric passenger cars are subject to less maintenance effort compared to conventional ones [118]. Nonetheless, a reliable quantification of the changes in maintenance costs has not yet been determined. Therefore, we neglect potential savings for EVs and consider maintenance costs of ICEVs. The same holds true for taxes. Even though tax benefits for emission free vehicles are conceivable, we assume equal taxes for both conventional and electric vehicles. However, the method retains the option to include tax incentives and hindrances due to future political decisions.
For each segment, the presented approach needs slight adaptation, but basically follows the same general procedure: the results of the MATSim simulation for the respective segment and scenario serve as input to quantify the driven distances of each considered vehicle within the simulated time period (one day for private transport, several days for commercial vehicles). Afterwards these distances are upscaled to the 10 year depreciation time under consideration of weekends and holidays. With the derived lifetime performance of the vehicles, variable costs can be calculated and specific costs per distance as well as per time become predictable.

5. First Results

In this section, we will show the first results of different case studies for the Berlin metropolitan region. We present the results for the fields of private individual traffic (Section 5.1), public transport with buses (Section 5.2), commercial goods traffic (Section 5.3) and municipal traffic (Section 5.4).

5.1. Private Individual Traffic

For private individual traffic, we have so far analyzed the life cycle emissions and charging strategies for a full conversion to BEV. The cost of this transition, however, will be analyzed once more strategies are modeled.

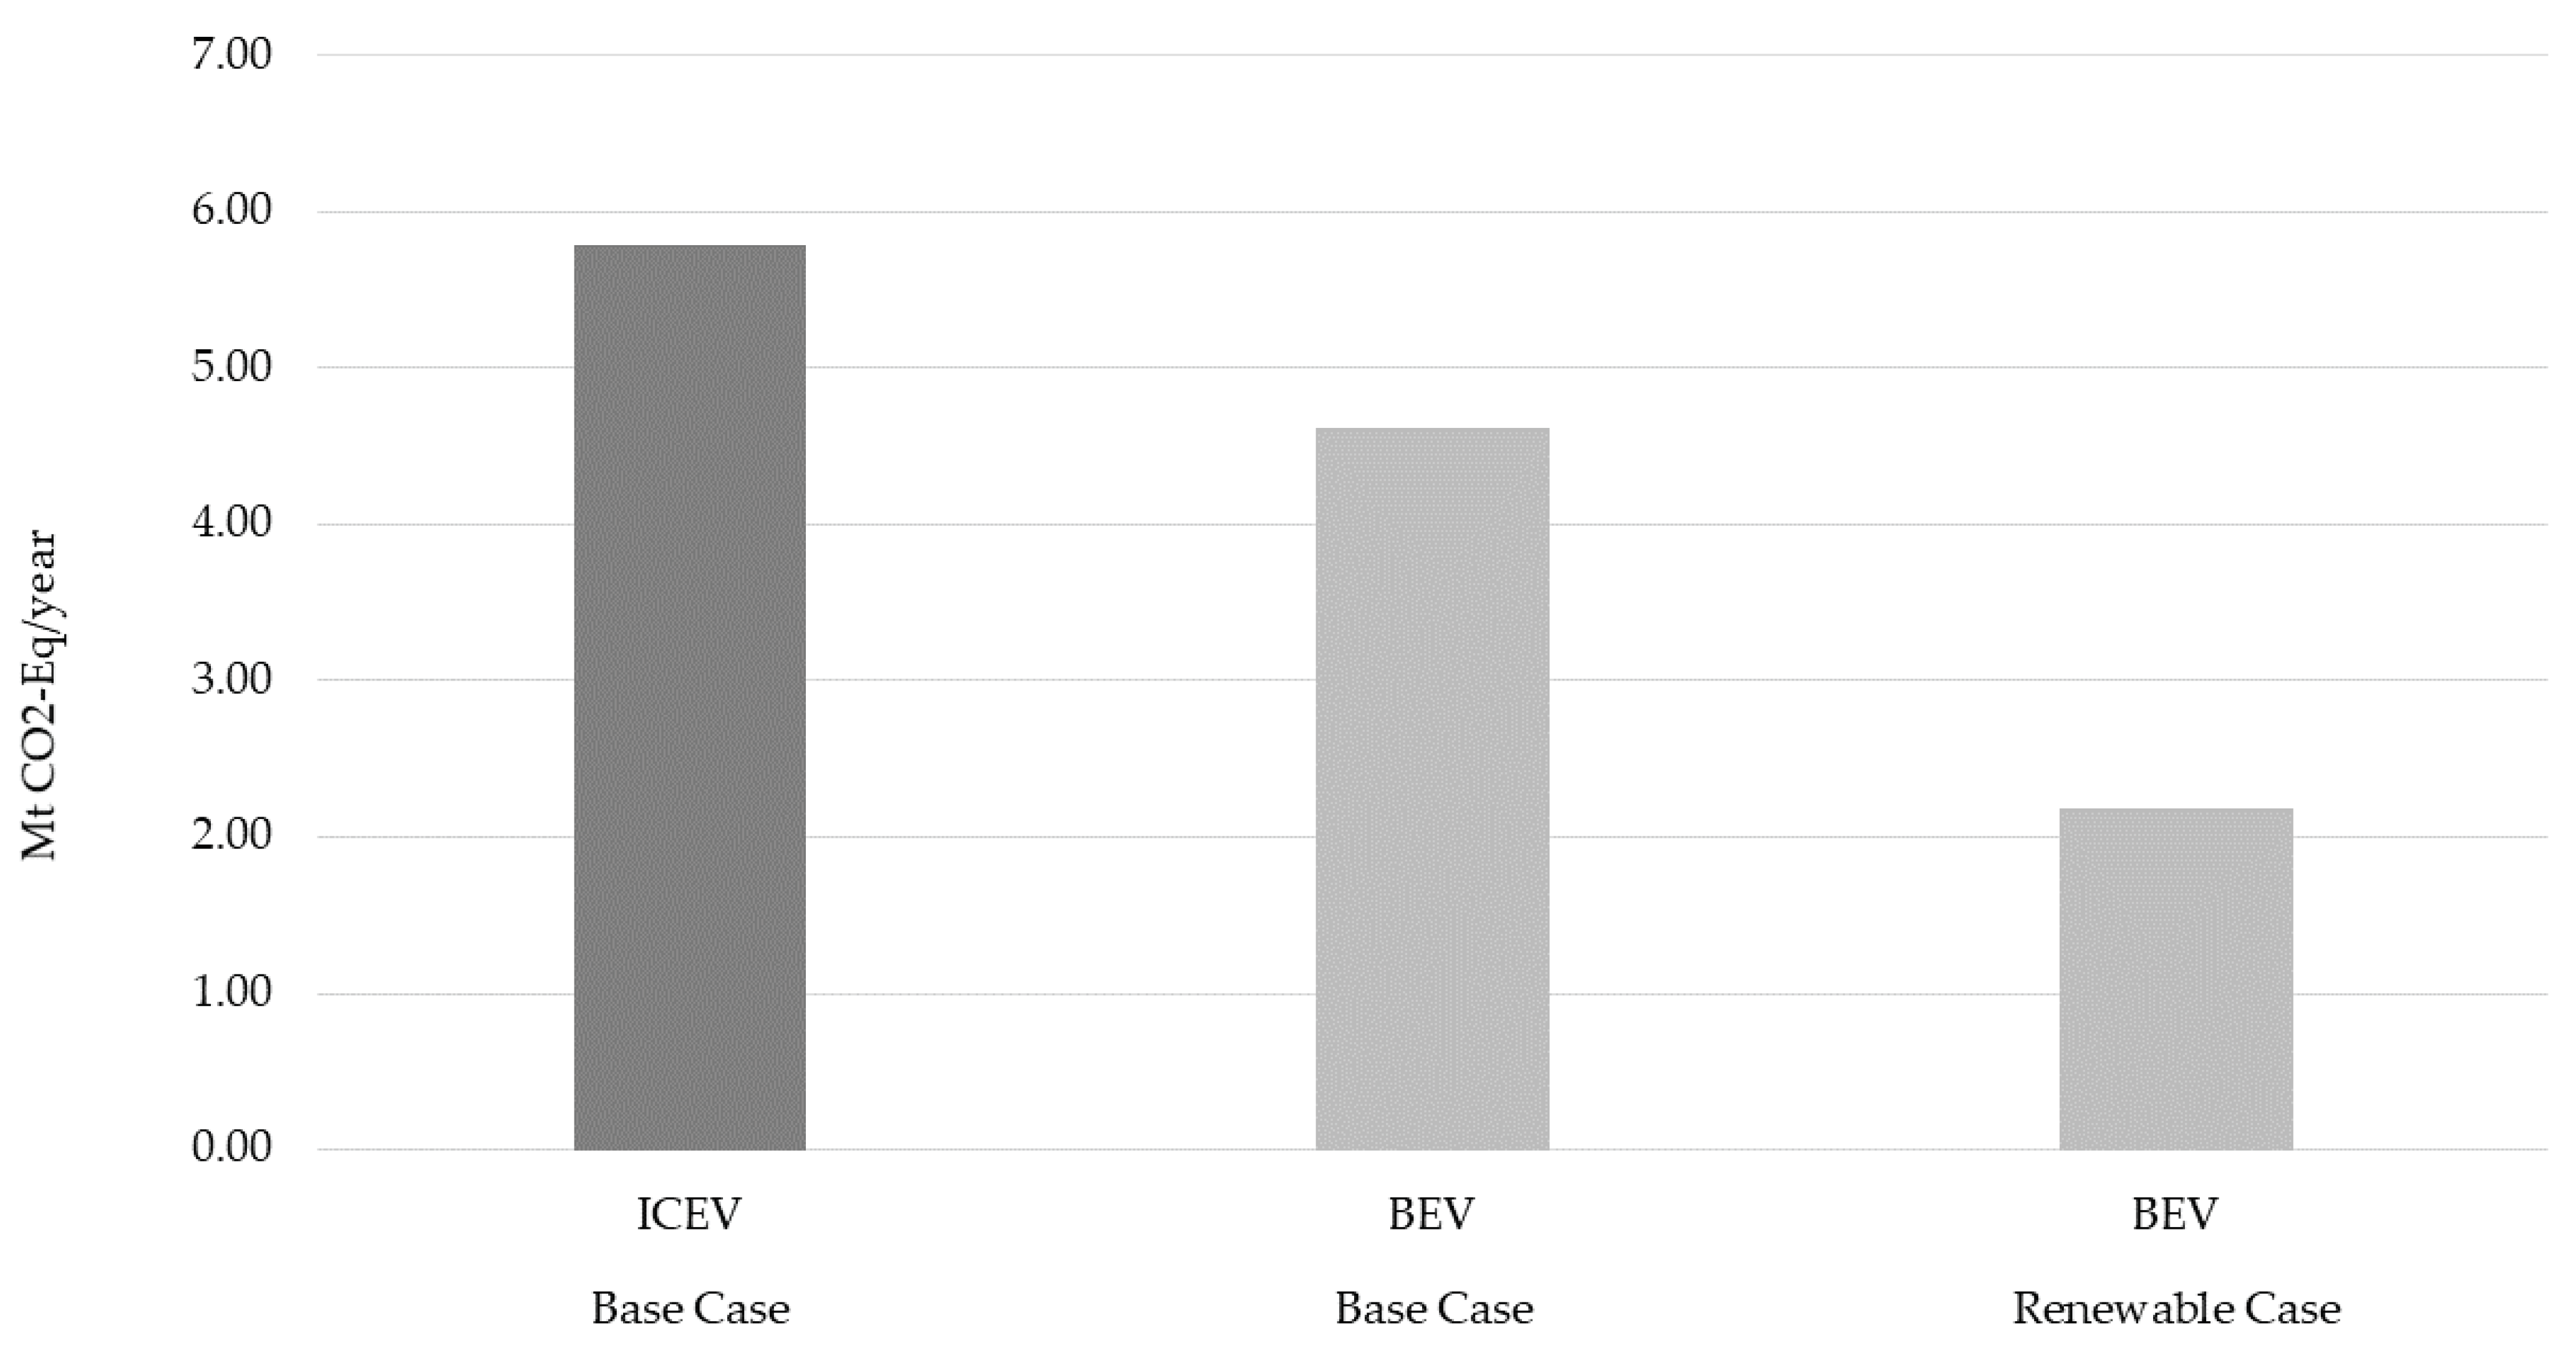
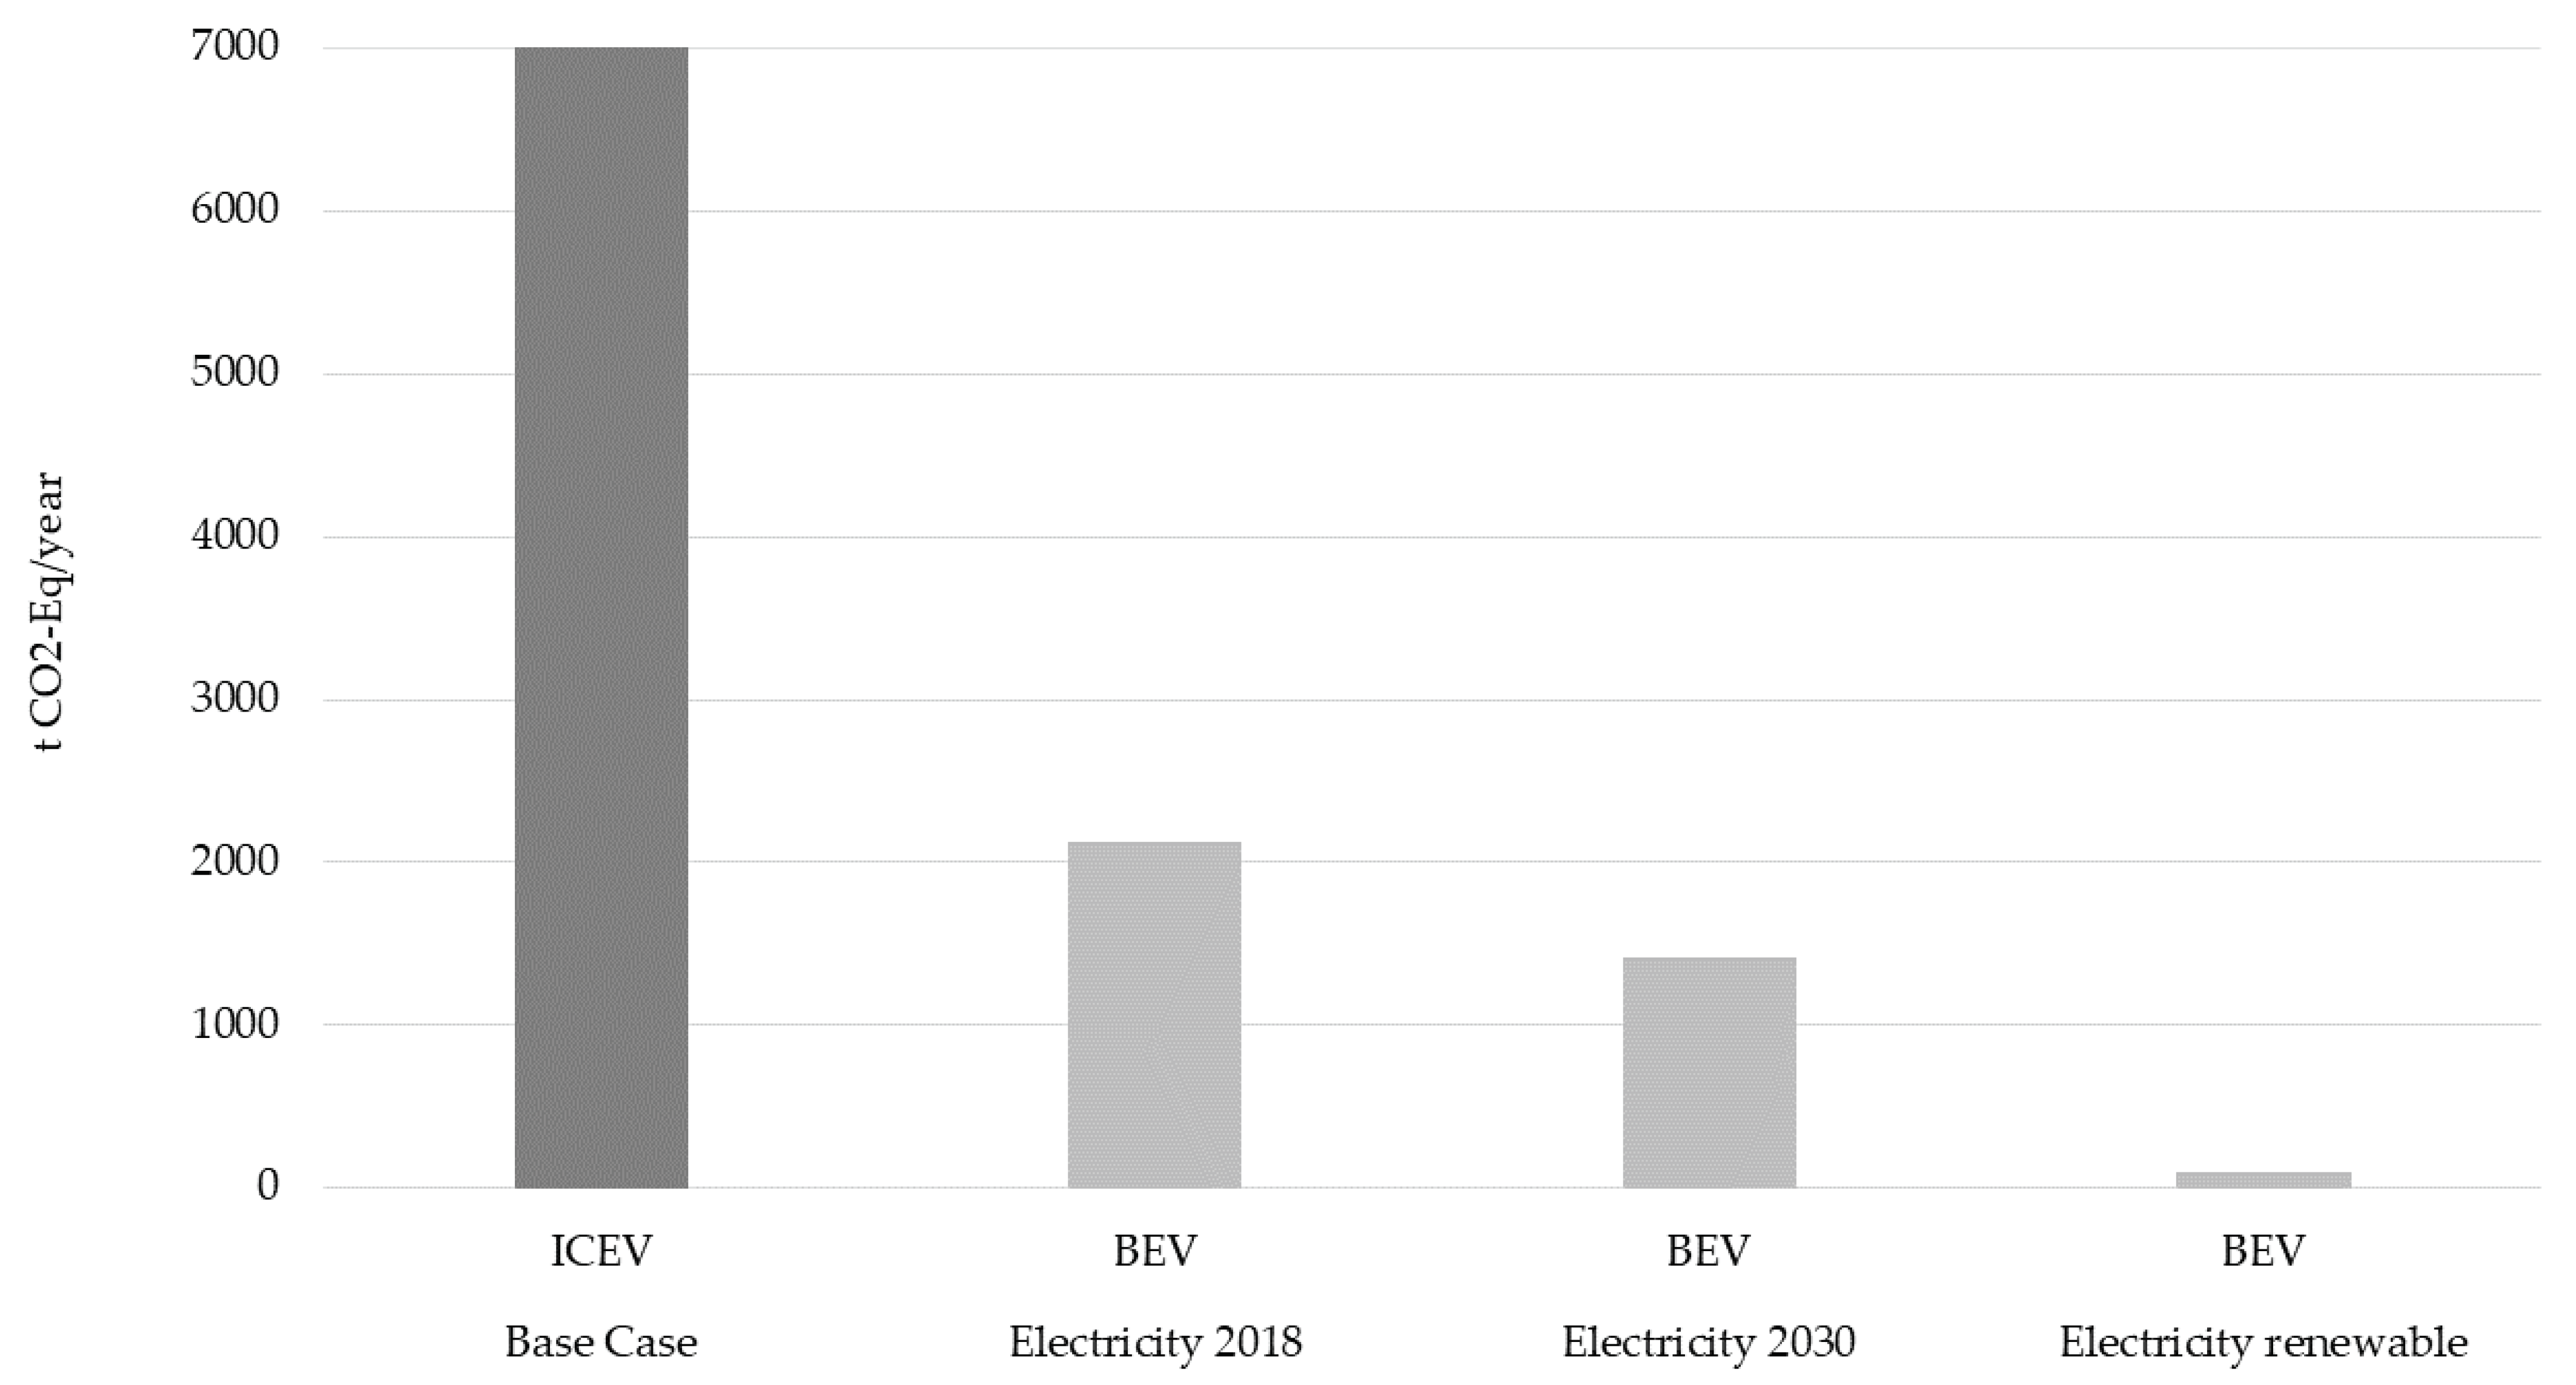
5.1.1. Life Cycle Assessment

We apply the methodology described in Section 4.5. The first use case is the private individual traffic simulated in the Open Berlin v5.3 scenario. Since we are only concerned with traffic that currently generates GHG emissions, we consider motorized vehicles only. The whole life cycle of the vehicles is analyzed.
Three vehicle classes (small, medium and large) represent the variability of vehicle sizes (Table 1). The vehicle distribution for the base case relies on the vehicle distribution in Germany in 2018 (Table 2). The conventional case consists of diesel- and gasoline-fuelled vehicles, the electrified case of BEVs. The conducted sensitivity analysis shows a renewable energy case (with electricity supply from 100% renewable sources for the BEV’s use phase).
Our key findings are shown in Figure 5 and Figure 6 and can be summarized as follows:
  • The BEVs offer benefits in the impact categories global warming and photochemical ozone formation potential.
  • The ICEVs offer benefits for acidification, particulate matter formation and metal depletion potential.
  • Metal depletion for the BEV case is high due to lithium demand for the batteries. However, the potential of recycling has not been considered here.
  • However, in some of these categories, BEVs can break even with ICEVs if the vehicles’ lifetime mileage is increased. This is because the BEVs’ emissions are dominated by the production and EoL phases (see Section 4.5).
  • The renewable case shows additional BEV advantages for particulate matter formation potential.
The detailed results can be found in Syré et al. [60].

5.1.2. Charging Strategies

We apply the method described in Section 4.4 to the MATSim Open Berlin Scenario (10%, version 5.3). This way we are able to geographically and temporally resolve the charging demands for the individual motorized transport sector of Berlin. The private vehicle distribution of Berlin consists of 25.44% mini compact, 36.04% compact, 28.62% mid-size and 9.54% large vehicles which we randomly assign to the agents of the simulation. As the charging curve between 10% to 90% SOC is almost linear, we consider the battery capacity in this range for the calculations.
We separately consider three different activity types which are home, work and leisure (shopping, leisure and other). As a first approach, we calculate the charging points individually for complete home charging, work charging and leisure charging strategies. The home activities are characterized by a long duration and small frequencies, the work activities lie in midfield and the leisure activities stand out due to high frequencies and a short activity duration. Therefore, the leisure activities are predestined for high power charging points and the home and work activities for lower power charging infrastructure.
Finally, a comparison is made to see whether a SOC of 100% is reached after home, work or the last leisure activity. In this case, the daily demand of the vehicle can be covered. The proportion of vehicles that can be charged is important for the correct choice of charging power, because this ensures that a high proportion of vehicles can be charged without over dimensioning the charging power:
  • Home: With 7.4 kW, almost all vehicles can be charged with 99,709 to 418,420 charging points.
  • Workplace: 11 kW is sufficient. In this strategy it is not possible to cover all vehicles, because not every vehicle is used to get to work. Even with an increase in charging power, the proportion of charged vehicles does not increase. The number of charging points is between 64,471 and 235,105.
  • Leisure Activities: The same applies to charging during leisure activities. 43 kW would be the optimal charging power. However, this would require expensive fast charging stations. With 22 kW only 5% fewer vehicles can be charged, and the cost of charging stations would be many times lower. The number of charging points is between 345,190 and 545,650.
We provide more information and detailed results in Jahn et al. [80].

5.2. Public Transport with Buses

As laid out in Section 4.3, we rely on the methodology and data from [71] to determine the implications of bus fleet electrification. The results can be summarized as follows:
  • No current or plausible future electric bus configuration was identified that enables unchanged operation of the vehicle schedules designed for diesel buses. When using depot charging, even with a high vehicle range of 300 km, only 77% of the existing schedules can be covered. For opportunity charging at terminal stops, the current dwell times are often too short to enable stable operation in the presence of delays. Even with a charging power of 450 kW, at least 9% of schedules cannot be serviced.
  • Full electrification with new schedules adapted to electric buses will entail an increase in fleet size and cost. Using depot charging vehicles with a range of 120 km would result in a 30% increase in fleet size and an 18% increase in cost compared to the diesel reference case. Using opportunity charging at terminal stops with 300 kW charging power, fleet size and cost would increase by 12% and 14%, respectively. These are technologies readily available today.
  • In the future, a range of 300 km for depot charging vehicles appears reasonable; this would, with corresponding schedules, increase the fleet size by just 1% and the cost by 15% compared to diesel. Finally, opportunity charging with 450 kW—already available, but not yet common today—would result in a 9% increase in fleet size and 13% higher cost compared to the diesel case, making it the most cost-competitive option.
Life cycle assessments for battery electric buses based on these figures will be presented in a future publication.

5.3. Commercial Goods Traffic

Within this segment of goods transport, there are several groups of goods, e.g., bulk materials, electronics, parcels, etc. Most of our work in freight until now is concerned with the supply of retailing shops. As a result of the traffic simulation the base scenario needs 283 trucks, 36,783 vehicle-km, and costs 67,288€ per day, 38,814€ of which is personnel cost. Next, the ICEV fleet is replaced by a fleet of BEVs. Chassis prices are assumed to be equal for BEV and ICEV; the battery comes on top. In this study the range limitation of BEVs is not considered. The central results of that study are:
  • We observe a cost increase of 11,713 €/day (17%) in total costs for the carriers.
  • The overall distance driven (+2.7%) and time travelled (+1.5%) increases slightly. At the same time, the number of vehicles is slightly reduced. This is due to the higher vehicle cost, i.e., the tour planning algorithm tries to save on vehicles at the expense of tour efficiency.
  • Fifty-six percent of the resulting tours can be driven with battery electric trucks without recharging during the day. For another 34% of the tours, the tour distance is smaller or equal than twice the net range, i.e., they could be driven with a single recharging during the day. Only 10% of the tours need more than one re-charge during the day.
Figure 7 shows the resulting annual well-to-wheel greenhouse gas emissions. For the BEV scenario, the results are shown for three different energy mixes. We published the full study with more detailed results separately Martins-Turner et al. [41].
A closer inspection of the above results show that out of the 44% tours that need within-day recharging, 34% of them have an intermediate stop at the depot that is sufficiently long to recharge for the rest of the day. With this recharging during the necessary reloading times at the depot about 90% of the tours would be feasible. Based on that, we investigated the possible charging strategies for the BEV trucks. It can be shown that with 71 fast chargers with 400 kW at the depots around 89% of the tours are possible without exceeding re-loading times. These fast charging stations would also make slow chargers for overnight charging unnecessary if the fast charging stations are shared by multiple vehicles at night. Even higher charging power hardly increases the share of charged vehicles and therefore does not justify the additional cost. To raise the share of tours possible with a BEV to 100%, 31 additional public high performance opportunity chargers with 400 kW could be implemented at central locations within the city. This would increase the tour duration by a maximum of 30 min for charging, plus additional driving time to and from these charging stations. In contrast to the charging during reloading times, this time is not productive and therefore raises the cost of operation due to the driver cost. More details about this study are published in Miranda Jahn et al. [119].
The above approaches first plan the tours, and then address the charging problem. Evidently, this could be improved by taking the charging into account already during the tour planning. We performed a first step in this direction by modifying the tour planning such that the electric range constraint is taken into account. This avoids tours that exceed the range of the battery electric vehicles. An important result is that the share of tours that could be electrified with overnight recharging increases from 56% to 69%. The remaining tours still need at least one within-day recharging, or some other technology such as fuel cells. Further results can be found in Ewert et al. [42].

5.4. Municipal Traffic

One example of urban municipal traffic is regular waste collection. Therefore, we constructed a synthetic model of household waste collection in Berlin. Structurally, it is once more a pickup-and-delivery problem, where the pickups are at the households, and the delivery is at the waste disposal plant. That pickup-and-delivery problem was once run with ICEVs and once with BEVs. The resulting fleet sizes of the scenario are in good agreement with the existing fleet size. For the BEV scenario the simulations are run for different weekdays with different collection areas and various bin sizes. Since the results for electrification are more or less in the same range, one case is presented in the following.
The base scenario being generated with the traffic simulation results in a fleet of 233 trucks, a driven distance of 11,863 vehicle-km, and costs of 239,710€ per working day, 171,166€ of which personnel cost. The usage of only battery electric vehicles leads to the following main results:
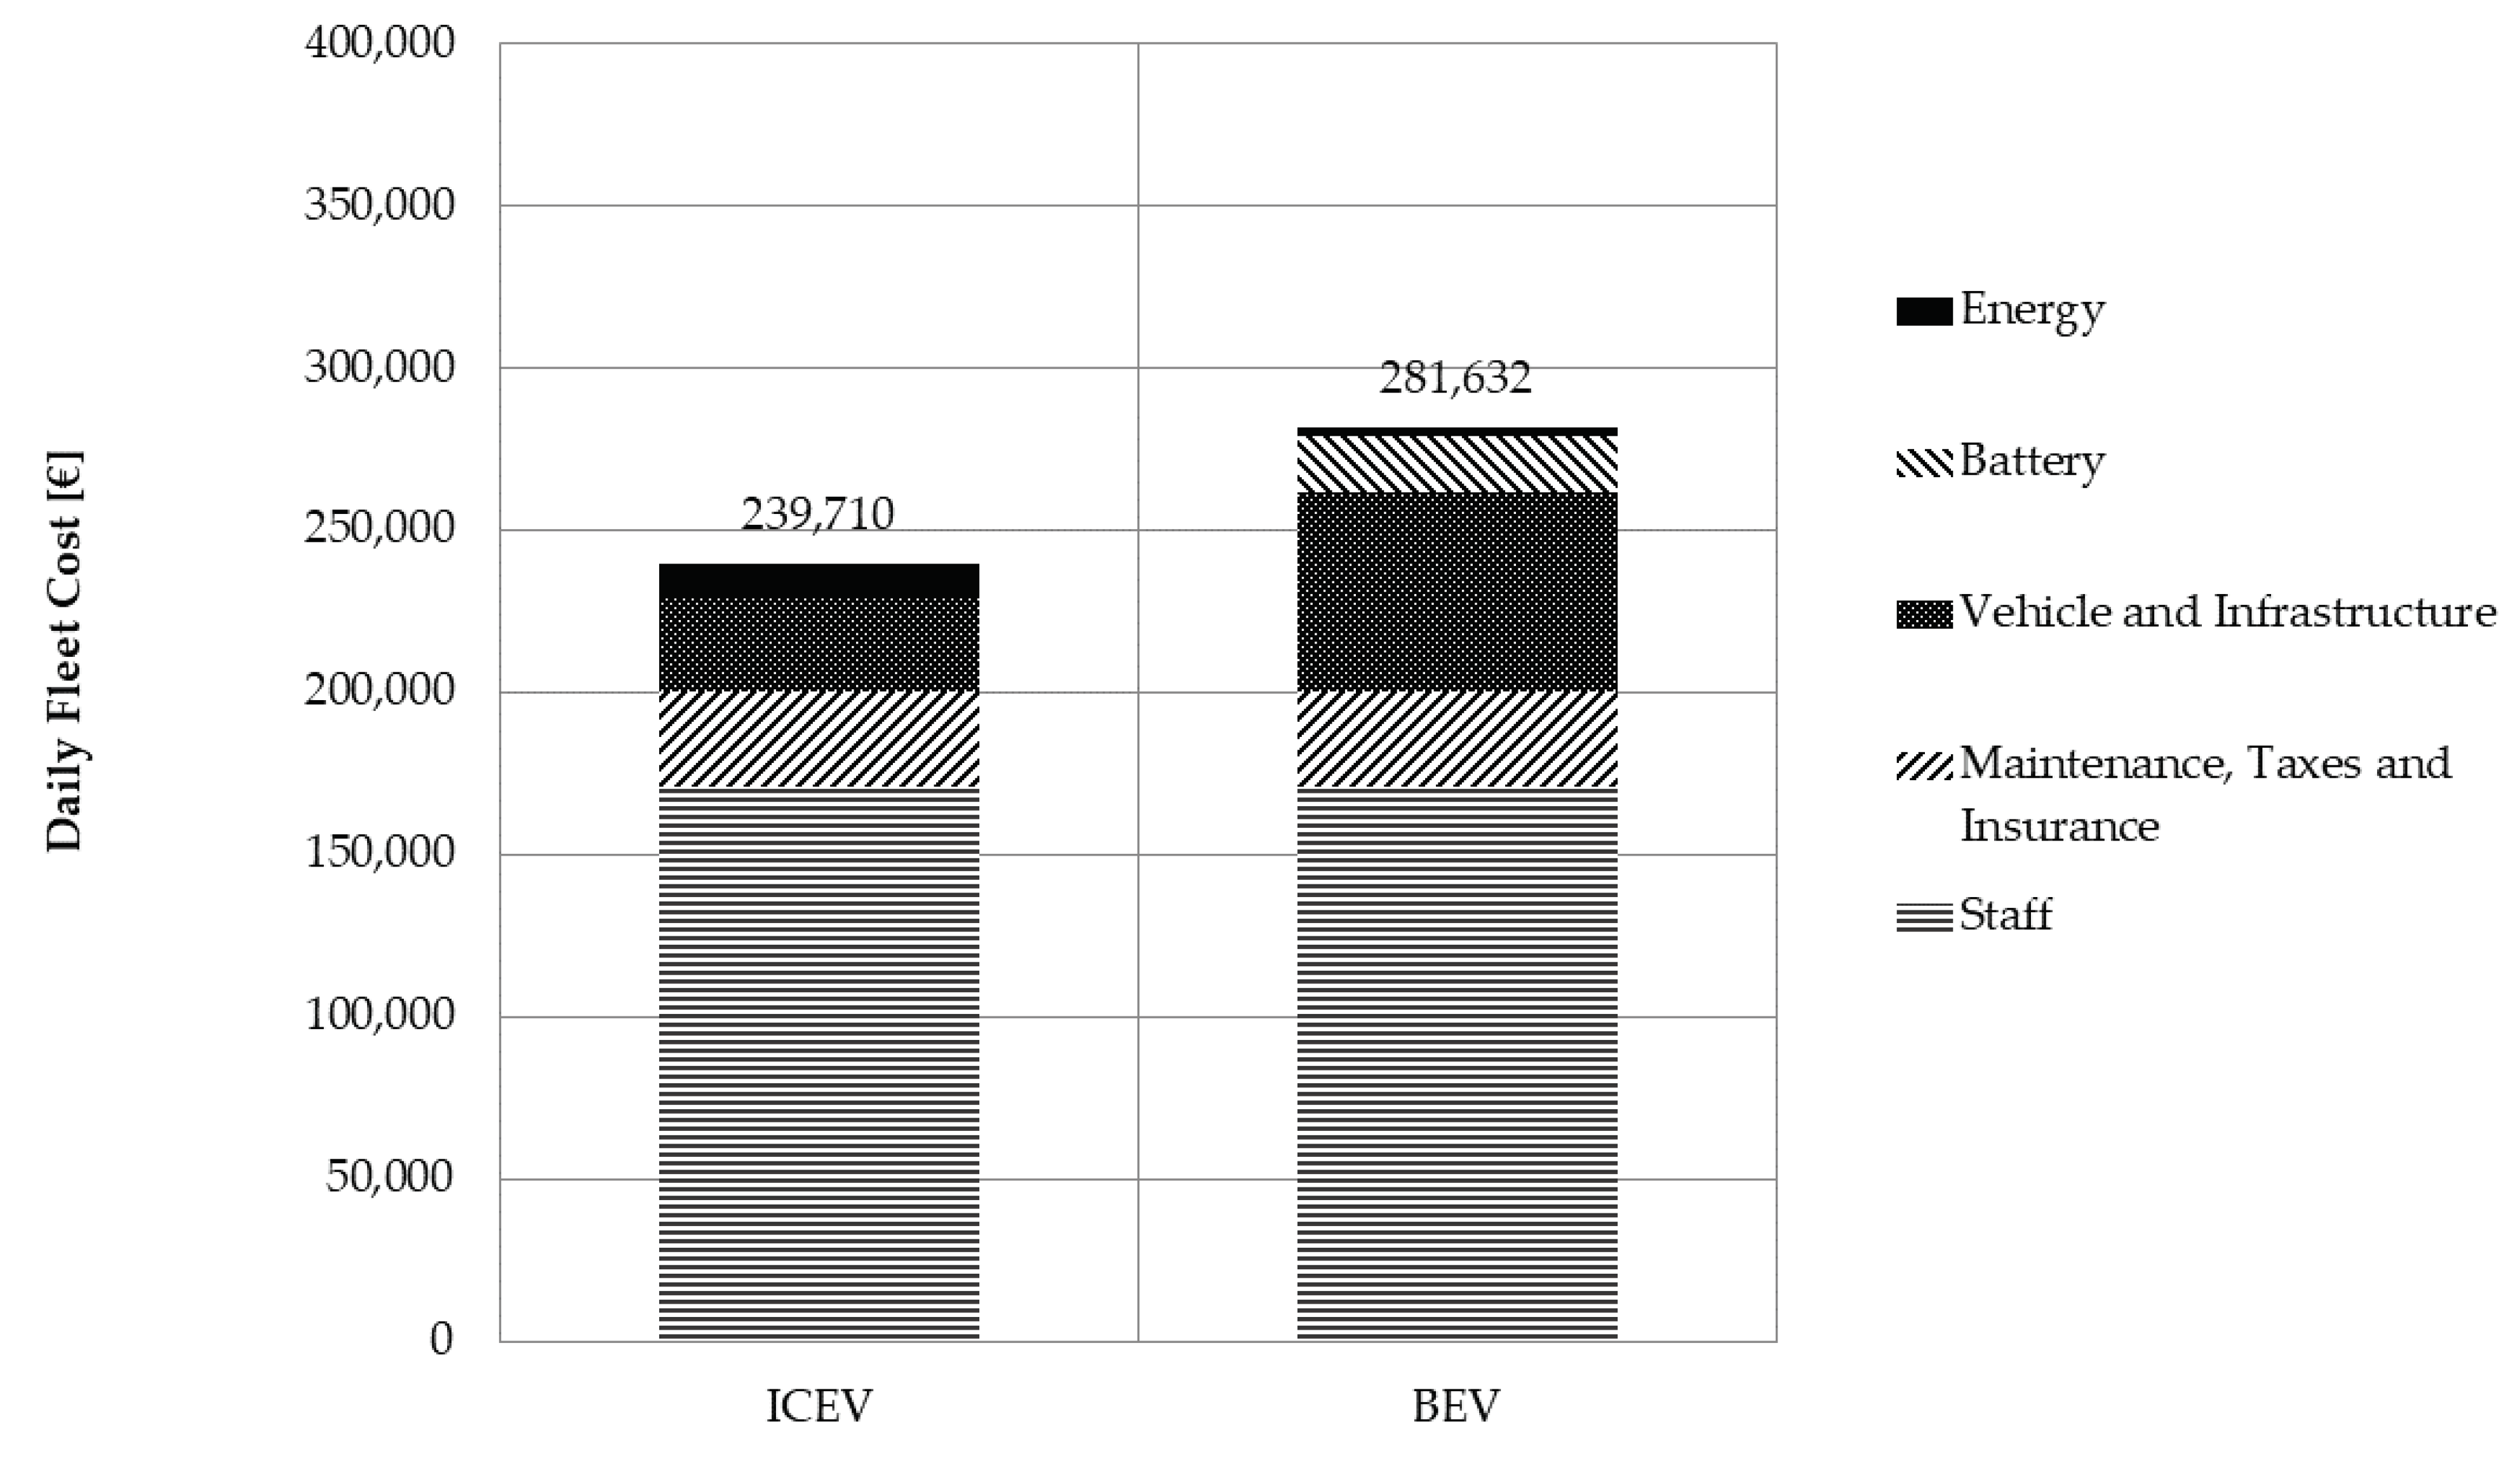
  • No tour is longer than 114 km and needs more than 142 kWh, where the electricity consumption of the waste compression is already included. Somewhat surprisingly, there exist already electric waste collection vehicles that have ranges larger than this and the same waste capacity.
  • Investments for charging infrastructure are only necessary for the depots, because only overnight charging is sufficient. No battery exchange is required during the assumed 10 years of operation.
  • Assuming that personnel and fleet management costs remain the same between ICEVs and BEVs, the cost maximally increases by 18% which is shown in Figure 8.
Figure 9 shows the resulting annual well-to-wheel greenhouse gas emissions. For the BEV scenario, the results are shown for three different energy mixes. The description of the constructed synthetic model and more detailed results are published in Ewert et al. [120].
As we found in our other studies, the personnel cost dominates the cost calculation (rather than the technology cost). Against this background, even the more than doubled investment cost for using the BEVs lead to a manageable increase in total cost. However, it can be expected that the cost disadvantage of BEVs will decrease substantially in the near future. Heavy duty BEVs are just entering the market and economies of scale due to mass production have not been exploited yet. Furthermore, a reduction of battery cost can be expected for commercial vehicles similarly to passenger cars.

6. Discussion and Outlook

This paper develops strategies and describes a toolbox to assess the system cost and other impacts of the decarbonization of the transport sector. Our current project is concerned with the decarbonization of urban transport; inter-urban and long-distance traffic will be the subject of future projects. Within urban transport, our aspiration is to account for all physical transport. To achieve this, we construct models of all segments of transport. Our results for the first strategy—full conversion of BEV—show the applicability of our approach. Already today, a one-to-one electrification of all vehicles, using the current energy mix, saves 20% (passenger cars, full life cycle analysis) to 70% (waste collection vehicles, well-to-wheel analysis) GHG emissions. This outstanding savings potential for waste collection vehicles can be attributed to their specific driving profiles. As these vehicles have a large share of stop-and-go driving, the BEVs have a greater efficiency advantage over the ICEVs due to recuperation.
When considering only renewable electricity for driving, the lief-cycle GHG emissions of the motorized individual transport segment can be reduced by 62%. The remaining 38% are mainly due to the production process of the vehicles. A transformation of the production process towards zero GHG emissions is currently under way. However, this aspect is outside of the scope of our investigation.
Up to this point, we were not yet able to assess all five transport segments shown in Figure 10. The transition of private individual traffic is analyzed for the entire region of Berlin with respect to technical feasibility, energy demand and environmental impact; the assessment of system cost will follow once we have implemented simulation scenarios for the remaining decarbonization strategies. For commercial goods and municipal traffic, we analyze system cost and environmental impacts. For both cases, our analysis is, thus far, limited to a specific sub-segment; we are currently in the process of compiling the necessary data for the analysis of commercial person transport. Similarly, our analysis of public transport—focused solely on buses as trams and trains are already electrified—is currently limited to the evaluation of system cost.
Social sustainability will be considered once we can compare different strategies. In this context, fully autonomous fleets will be of special interest.
We determine environmental impacts for current and future technologies. We not only predict the GHG impact but analyze other emissions on the basis of a full life cycle analysis. Due to the rapid development of BEVs and FCEVs, however, the data for the production of these vehicles is quickly outdated. Moreover, End-of-Life paths are still subject to uncertainties. However, it may be assumed that vehicle-specific impacts decrease and End-of-Life paths improve due to larger series productions and advancement of technologies (e.g., enhanced battery manufacturing and recycling, a higher share of renewable energy in grid mixes) [56]. Therefore, our assumptions are probably pessimistic.
For the particulate matter formation potential and photochemical oxidant potential, the full life cycle analysis of passenger cars shows a reduction of 5% (renewable case) and 30% (base case), respectively. This data can aid in the analysis of how the implementation of zero emission power trains would affect the local concentrations of toxic gases such as nitrogen oxides or carbon monoxide in the air. However, since also industry and heating of homes play a role here, this problem is out of the scope of this work.
We mostly use the term “cost” in the present text, but in fact mean two things: Financial costs, e.g., to freight carriers, but also full economic cost to society in the sense of combined monetary and utility changes in typical transport infrastructure assessments. There are two differences:
  • Financial costs to commercial entities includes taxes etc. In an economic appraisal, they cancel out, since, for example, tax losses incurred by commercial entities are compensated for by tax income by the government [121]. Where appropriate, we calculate both financial and economic costs.
  • Full economic appraisal includes utility changes that go beyond monetary changes, such as travel time changes, or switching from one destination to another since the relative transport costs to reach them have changed. For example, switching urban person transport from individual cars to mobility-as-a-service means that one may have to wait for a shared vehicle where previously one walked to the individually owned one, and it is not clear into which direction the net effect of this change goes. For our current approach, we mostly assume decarbonization without behavioral changes. In consequence, there are no utility changes, and thus the technological (economic) cost is all there is. Evidently, one could imagine other scenarios that are cheaper on the technological side but put a larger burden on travel times.
Although the toolbox is able to assess multiple decarbonization strategies, our current approach is more direct: We define one possible decarbonization scenario for each segment, and then assess the cost of that scenario. The idea is that, if we can find a technically feasible scenario, we have shown that decarbonization of that segment is possible in principle, and how much it will cost. This provides an upper limit on the cost that we, as a society, will have to incur to decarbonize the transport sector. As of now, we do not investigate possible pathways to that solution. As Arroyo et al. [122] show, this is a relevant question, especially in urban delivery traffic. For package delivery with vans, they show that for short daily distances, very high carbon prices or high subsidies on vehicle prices are needed to make BEVs economically advantageous. Even though we are able to show that the price difference is smaller for larger trucks, this difference also represents an obstacle in this segment. Therefore, the transition paths to the possible scenarios shown in this work can be an important extension to this research.
We also do not discuss behavioral adaptation, e.g., people switching to less carbon-intensive modes, or choosing destinations closer to home. Such adaptations may come on top of the technical solutions—or they may, indeed, counteract them, e.g., by people choosing destinations farther away from their homes. The trend towards heavier passenger cars (especially due to the increase in the share of sport utility vehicles) is also not considered in this paper. We addressed this issue in a study on the environmental impact of different subsidy programs for passenger vehicles in [123]. Here, in contrast, we analyse a direct transition of the current fleet to new drive technologies. In our view, this is necessary to ensure clear comparability between the base case and the various strategies.
For our decarbonization strategies, one energy scenario is the assumption that it will be possible to obtain all the electricity needed from renewable sources. We know that this is currently not the case, and will not be for some years to come. To give a more complete picture, we also provide decarbonization gains with today’s electricity mix and with the electricity mix expected for 2030; evidently, after electrification, all gains that the electricity sector makes would be passed on to the transport sector [124].
In the near future we will complete our work with the analysis of two more decarbonization strategies: Fully autonomous fleets of BEV and a conversion to hydrogen powered FCEVs. Further strategies may be considered in the future as well. The results for these strategies will be compared to each other and to the reference case. This holistic approach will allow us to make recommendations on decarbonization pathways for transport authorities and decision makers.

Author Contributions

Conceptualization, D.G. and K.N.; Methodology, All; Software, K.M.-T., A.M.S., R.E., R.M.J., A.G. and D.J.; Validation, K.N., D.G., K.M.-T., A.M.S., R.E. and A.G.; Investigation, K.M.-T., A.M.S., R.E., R.M.J., A.G. and D.J.; Resources, K.N. and D.G.; Data Curation, K.M.-T., A.M.S., R.E., R.M.J., A.G. and D.J.; Writing—Original Draft Preparation, All; Writing—Review & Editing, All; Visualization, K.M.-T., A.M.S., R.E., R.M.J., A.G. and D.J.; Funding Acquisition, D.G., K.N. and D.J. All authors have read and agreed to the published version of the manuscript.

Funding

This work was funded by the Deutsche Forschungsgemeinschaft (DFG, German Research Foundation) as project number 398051144.

Institutional Review Board Statement

Not applicable.

Informed Consent Statement

Not applicable.

Data Availability Statement

Not applicable.

Acknowledgments

We acknowledge support by the German Research Foundation and the Open Access Publication Fund of TU Berlin for the open access publication.

Conflicts of Interest

The authors declare no conflict of interest.

References

  1. Europäische Kommission. Der Europäische Grüne Deal; COM(2019) 640 Final; Europäische Kommission: Berlin, Germany, 2019; Available online: https://eur-lex.europa.eu/legal-content/DE/ALL/?uri=CELEX:52019DC0640 (accessed on 14 January 2021).
  2. Bundesministerium für Umwelt, Naturschutz und Nukleare Sicherheit (BMU). Klimaschutz in Zahlen. Fakten, Trends und Impulse Deutscher Klimapolitik. Ausgabe 2020. Available online: https://www.bmu.de/fileadmin/Daten_BMU/Pools/Broschueren/klimaschutz_zahlen_2020_broschuere_bf.pdf (accessed on 2 December 2020).
  3. Brown, A.L.; Fleming, K.L.; Safford, H.R. Prospects for a Highly Electric Road Transportation Sector in the USA. Curr. Sustain. Energy Rep. 2020, 7, 84–93. [Google Scholar] [CrossRef]
  4. Eckhardt, J.; Lauhkonen, A.; Aapaoja, A. Impact assessment of rural PPP MaaS pilots. Eur. Transp. Res. Rev. 2020, 12. [Google Scholar] [CrossRef]
  5. Shaheen, S.; Bouzaghrane, M.A. Mobility and Energy Impacts of Shared Automated Vehicles: A Review of Recent Literature. Curr. Sustain. Energy Rep. 2019, 6, 193–200. [Google Scholar] [CrossRef] [Green Version]
  6. Li, L.; Loo, B.P.Y. Alternative and Transitional Energy Sources for Urban Transportation. Curr. Sustain. Energy Rep. 2014, 1, 19–26. [Google Scholar] [CrossRef]
  7. Deutsche Forschungsgemeinschaft (DFG). Analyse von Strategien zur vollständigen Dekarbonisierung des Urbanen Verkehrs. Available online: https://gepris.dfg.de/gepris/projekt/398051144?context=projekt&task=showDetail&id=398051144& (accessed on 30 November 2020).
  8. Syré, A.M.; Grahle, A. zeroCUTS: Zero Carbon Urban Transport System. Available online: https://www.mpm.tu-berlin.de/menue/forschung/projekte/zerocuts/ (accessed on 28 November 2020).
  9. Damidavičius, J.; Burinskienė, M.; Antuchevičienė, J. Assessing Sustainable Mobility Measures Applying Multicriteria Decision Making Methods. Sustainability 2020, 12, 6067. [Google Scholar] [CrossRef]
  10. Alves, R.; da Silva Lima, R.; Custódio de Sena, D.; Ferreira de Pinho, A.; Holguín-Veras, J. Agent-Based Simulation Model for Evaluating Urban Freight Policy to E-Commerce. Sustainability 2019, 11, 4020. [Google Scholar] [CrossRef] [Green Version]
  11. Figliozzi, M.; Saenz, J.; Faulin, J. Minimization of urban freight distribution lifecycle CO2 emissions: Results from an optimization model and a real-world case study. Transp. Policy 2020, 86, 60–68. [Google Scholar] [CrossRef]
  12. Spangher, L.; Gorman, W.; Bauer, G.; Xu, Y.; Atkinson, C. Quantifying the impact of U.S. electric vehicle sales on light-duty vehicle fleet CO2 emissions using a novel agent-based simulation. Transp. Res. Part D Transp. Environ. 2019, 72, 358–377. [Google Scholar] [CrossRef]
  13. Dhar, S.; Pathak, M.; Shukla, P.R. Transformation of India’s transport sector under global warming of 2 °C and 1.5 °C scenario. J. Clean. Prod. 2018, 172, 417–427. [Google Scholar] [CrossRef] [Green Version]
  14. Golightly, D.; Gamble, C.; Palacin, R.; Pierce, K. Multi-modelling for Decarbonisation in Urban Rail Systems. Urban Rail Transit 2019, 5, 254–266. [Google Scholar] [CrossRef] [Green Version]
  15. Küng, L.; Bütler, T.; Georges, G.; Boulouchos, K. Decarbonizing passenger cars using different powertrain technologies: Optimal fleet composition under evolving electricity supply. Transp. Res. Part C Emerg. Technol. 2018, 95, 785–801. [Google Scholar] [CrossRef]
  16. Hick, H.; Küpper, K.; Sorger, H. (Eds.) Systems Engineering for Automotive Powertrain Development; Powertrain; Springer International Publishing: Cham, Switzerland, 2020. [Google Scholar] [CrossRef]
  17. Gascoin, N.; Balasubramanian, E. Innovative Design, Analysis and Development Practices in Aerospace and Automotive Engineering; Springer: Singapore, 2021. [Google Scholar] [CrossRef]
  18. Gherairi, S. Hybrid Electric Vehicle: Design and Control of a Hybrid System (Fuel Cell/Battery/Ultra-Capacitor) Supplied by Hydrogen. Energies 2019, 12, 1272. [Google Scholar] [CrossRef] [Green Version]
  19. Lee, J.; Arts, J.; Vanclay, F.; Ward, J. Examining the Social Outcomes from Urban Transport Infrastructure: Long-Term Consequences of Spatial Changes and Varied Interests at Multiple Levels. Sustainability 2020, 12, 5907. [Google Scholar] [CrossRef]
  20. Göhlich, D.; Fay, T.A.; Park, S. Conceptual Design of Urban E-Bus Systems with Special Focus on Battery Technology. Proc. Des. Soc. Int. Conf. Eng. Des. 2019, 1, 2823–2832. [Google Scholar] [CrossRef] [Green Version]
  21. Ortúzar, J.D.D.; Willumsen, L.G. Modelling Transport, 4th ed.; Wiley: Hoboken, NJ, USA, 2011. [Google Scholar]
  22. Bhat, C.; Guo, J.; Srinivasan, S.; Sivakumar, A. CEMDAP User’ s Manual; Version 3.1.; University of Texas at Austin: Austin, TX, USA, 2008. [Google Scholar]
  23. Bhat, C.; Goulias, K.; Pendyala, R.; Paleti, R.; Sidharthan, R.; Schmitt, L.; Hu, H.H. A household-level activity pattern generation model with an application for Southern California. Transportation 2013, 40, 1063–1086. [Google Scholar] [CrossRef] [Green Version]
  24. Arentze, T.; Timmermans, H.J.P. (Eds.) ALBATROSS Version 2.0—A Learning Based Transportation Oriented Simulation System; EIRASS (European Institute of Retailing and Services Studies), TU Eindhoven: Eindhoven, The Netherlands, 2005. [Google Scholar]
  25. Kutter, E.; Mikota, H.J. Weiterentwicklung des Personenverkehrsmodells Berlin auf der Basis der Verkehrsentstehungsmatrix 1986 (BVG); Technical Report; Untersuchung im Auftrag des Senators für Arbeit, Verkehr und Betriebe: Berlin, Germany, 1990. [Google Scholar]
  26. Mallig, N.; Vortisch, P. Incorporating Stability of Mode Choice into an Agent-Based Travel Demand Model. In Communications in Computer and Information Science, Proceedings of the Highlights of Practical Applications of Cyber-Physical Multi-Agent Systems: International Workshops of PAAMS 2017, Porto, Portugal, 21–23 June 2017; Bajo, J., Ed.; Springer International Publishing: Cham, Switzerland, 2017; pp. 28–39. [Google Scholar] [CrossRef]
  27. Beckman, R.; Baggerly, K.; McKay, M. Creating synthetic baseline populations. Transp. Res. Part A 1996, 30, 415–429. [Google Scholar] [CrossRef]
  28. Pritchard, D.; Miller, E. Advances in Agent Population Synthesis and Application in an Integrated Land Use/Transportation Model; Technical Report; University of Toronto, Department of Civil Engineering: Toronto, ON, Canada, 2008. [Google Scholar]
  29. Ye, X.; Konduri, K.; Pendyala, R.; Sana, B.; Waddell, P. A Methodology to Match Distributions of both Household and Person Attributes in the Generation of Synthetic Populations; Annual Meeting Preprint 09-2096; Transportation Research Board: Washington, DC, USA, 2009. [Google Scholar]
  30. Chiu, Y.C.; Bottom, J.; Mahut, M.; Paz, A.; Balakrishna, R.; Waller, T.; Hicks, J. A Primer for Dynamic Traffic Assignment; Transportation Research Circular E-C153; Transportation Research Board: Washington, DC, USA, 2011; Available online: http://onlinepubs.trb.org/onlinepubs/circulars/ec153.pdf (accessed on 14 January 2021).
  31. Balmer, M.; Cetin, N.; Nagel, K.; Raney, B. Towards truly agent-based traffic and mobility simulations. In Proceedings of the Third International Joint Conference on Autonomous Agents and Multiagent Systems (AAMAS’04), New York, NY, USA, 19–23 July 2004. [Google Scholar]
  32. Hao, J.Y.; Hatzopoulou, M.; Miller, E.J. Integrating an Activity-Based Travel Demand Model with Dynamic Traffic Assignment and Emission Models—Implementation in the Greater Toronto, Canada, Area. Transp. Res. Rec. J. Transp. Res. Board 2010, 2176, 1–13. [Google Scholar] [CrossRef]
  33. Krajzewicz, D.; Erdmann, J.; Behrisch, M.; Bieker, L. Recent Development and Applications of SUMO-Simulation of Urban MObility. Int. J. Adv. Syst. Meas. 2012, 5, 128–138. [Google Scholar]
  34. Zheng, H.; Son, Y.J.; Chiu, Y.C.; Head, L.; Feng, Y.; Xi, H.; Kim, S.; Hickman, M. A Primer for Agent-Based Simulation and Modeling in Transportation Applications; Technical Report FHWA-HRT-13-054; Federal Highway Administration: McLean, VA, USA, 2013. Available online: https://www.fhwa.dot.gov/advancedresearch/pubs/13054/index.cfm (accessed on 14 January 2021).
  35. Auld, J.; Hope, M.B.; Ley, H.; Sokolov, V.; Xu, B.; Zhang, K. POLARIS: Agent-Based Modeling Framework Development and Implementation for Integrated Travel Demand and Network and Operations Simulations; Annual Meeting Preprint 15-5072; Transportation Research Board: Washington, DC, USA, 2015. [Google Scholar]
  36. Vovsha, P. Microsimulation Travel Models in Practice in the US and Prospects for Agent-Based Approach. In Communications in Computer and Information Science, Proceedings of the Highlights of Practical Applications of Cyber-Physical Multi-Agent Systems: International Workshops of PAAMS 2017, Porto, Portugal, 21–23 June 2017; Bajo, J., Ed.; Springer International Publishing: Cham, Switzerland, 2017; pp. 52–68. [Google Scholar] [CrossRef]
  37. Nagel, K.; Kickhöfer, B.; Horni, A.; Charypar, D. A Closer Look at Scoring. In The Multi-Agent Transport Simulation MATSim; Horni, A., Nagel, K., Axhausen, K.W., Eds.; Ubiquity: London, UK, 2016; Chapter 3. [Google Scholar] [CrossRef]
  38. Schröder, S.; Liedtke, G. Modeling and Analyzing the Effects of Differentiated Urban Freight Measures—A Case Study of the Food Retailing Industry; Annual Meeting Preprint 14-5015; Transportation Research Board: Washington, DC, USA, 2014. [Google Scholar]
  39. Zilske, M.; Joubert, J.W. Freight Traffic. In The Multi-Agent Transport Simulation MATSim; Horni, A., Nagel, K., Axhausen, K.W., Eds.; Ubiquity: London, UK, 2016; Chapter 24. [Google Scholar] [CrossRef]
  40. Zilske, M.; Schröder, S.; Nagel, K.; Liedtke, G. Adding Freight Traffic to MATSim; VSP Working Paper 12-02; TU Berlin, Transport Systems Planning and Transport Telematics: Berlin, Germany, 2012; Available online: http://www.vsp.tu-berlin.de/publications (accessed on 14 January 2021).
  41. Martins-Turner, K.; Grahle, A.; Nagel, K.; Göhlich, D. Electrification of Urban Freight Transport—A Case Study of the Food Retailing Industry. Procedia Comput. Sci. 2020, 170, 757–763. [Google Scholar] [CrossRef]
  42. Ewert, R.; Martins-Turner, K.; Thaller, C.; Nagel, K. Using a Route-Based and Vehicle Type Specific Range Constraint for Improving Vehicle Routing Problems with Electric Vehicles; VSP Working Paper; TU Berlin, Transport Systems Planning and Transport Telematics: Berlin, Germany, 2020; Available online: http://www.vsp.tu-berlin.de/publications (accessed on 14 January 2021).
  43. Karohs, K.; Göhlich, D.; Lauth, E. Research Campus Mobility2Grid: From Lab to Reality. In Proceedings of the 2nd E-Mobility Power System Integration Symposium, Stockholm, Sweden, 15 October 2018; pp. 1–7. [Google Scholar]
  44. Morrissey, P.; Weldon, P.; O’Mahony, M. Future standard and fast charging infrastructure planning: An analysis of electric vehicle charging behaviour. Energy Policy 2016, 89, 257–270. [Google Scholar] [CrossRef]
  45. Almaghrebi, A.; Aljuheshi, F.; Rafaie, M.; James, K.; Alahmad, M. Data-Driven Charging Demand Prediction at Public Charging Stations Using Supervised Machine Learning Regression Methods. Energies 2020, 13, 4231. [Google Scholar] [CrossRef]
  46. Micari, S.; Polimeni, A.; Napoli, G.; Andaloro, L.; Antonucci, V. Electric vehicle charging infrastructure planning in a road network. Renew. Sustain. Energy Rev. 2017, 80, 98–108. [Google Scholar] [CrossRef]
  47. Guo, C.; Yang, J.; Yang, L. Planning of Electric Vehicle Charging Infrastructure for Urban Areas with Tight Land Supply. Energies 2018, 11, 2314. [Google Scholar] [CrossRef] [Green Version]
  48. Marquez-Fernandez, F.J.; Bischoff, J.; Domingues-Olavarria, G.; Alakula, M. Using Multi-Agent Transport Simulations to Assess the Impact of EV Charging Infrastructure Deployment. In Proceedings of the 2019 IEEE Transportation Electrification Conference and Expo (ITEC), Detroit, MI, USA, 19–21 June 2019; pp. 1–6. [Google Scholar] [CrossRef] [Green Version]
  49. Liimatainen, H.; van Vliet, O.; Aplyn, D. The potential of electric trucks—An international commodity-level analysis. Appl. Energy 2019, 236, 804–814. [Google Scholar] [CrossRef]
  50. Bradley, L. Charging Infrastructure Strategies: Maximizing the Deployment of Electric Drayage Trucks in Southern California. 2019. Available online: https://escholarship.org/uc/item/7pk425v7 (accessed on 14 January 2021).
  51. Brundtland. Brundtland Comission Report: Our Common Future: Report of the World Commission on Environment and Development; Oxford University Press: New York, NY, USA, 1987. [Google Scholar]
  52. Elkington, J. Accounting for the Triple Bottom Line. Meas. Bus. Excell. 1998, 2, 18–22. [Google Scholar] [CrossRef]
  53. McKenzie, S. Social Sustainability: Towards Some Definitions. 2004. Available online: https://www.unisa.edu.au/siteassets/episerver-6-files/documents/eass/hri/working-papers/wp27.pdf (accessed on 14 January 2021).
  54. DIN e. V. DIN EN ISO 14040: Umweltmanagement–Ökobilanz—Grundsätze und Rahmenbedingungen (ISO 14040:2006); Deutsche und Englische Fassung EN ISO 14040:2006; DIN: Berlin, Germany, November 2009. [Google Scholar] [CrossRef]
  55. Peters, J.F.; Baumann, M.; Zimmermann, B.; Braun, J.; Weil, M. The environmental impact of Li-Ion batteries and the role of key parameters—A review. Renew. Sustain. Energy Rev. 2017, 67, 491–506. [Google Scholar] [CrossRef]
  56. Helms, H.; Kämper, C.; Biemann, K.; Lambrecht, U.; Julius, J.; Meyer, K. Klimabilanz von Elektroautos. Einflussfaktoren und Verbesserungspotenzial. 2019. Available online: https://www.agora-verkehrswende.de/veroeffentlichungen/klimabilanz-von-elektroautos/ (accessed on 14 January 2021).
  57. Burchart-Korol, D.; Jursova, S.; Folęga, P.; Korol, J.; Pustejovska, P.; Blaut, A. Environmental life cycle assessment of electric vehicles in Poland and the Czech Republic. J. Clean. Prod. 2018, 202, 476–487. [Google Scholar] [CrossRef]
  58. Del Pero, F.; Delogu, M.; Pierini, M. Life Cycle Assessment in the automotive sector: A comparative case study of Internal Combustion Engine (ICE) and electric car. Procedia Struct. Integr. 2018, 12, 521–537. [Google Scholar] [CrossRef]
  59. Jaeger, F.A.; Müller, K.; Petermann, C.; Lesage, E. LCA in Strategic Decision Making for Long Term Urban Transportation System Transformation. In Designing Sustainable Technologies, Products and Policies; Benetto, E., Gericke, K., Guiton, M., Eds.; Springer International Publishing: Cham, Switzerland, 2018; pp. 193–204. [Google Scholar] [CrossRef] [Green Version]
  60. Syré, A.M.; Heining, F.; Göhlich, D. Method for a Multi-Vehicle, Simulation-Based Life Cycle Assessment and Application to Berlin’s Motorized Individual Transport. Sustainability 2020, 12, 7302. [Google Scholar] [CrossRef]
  61. Martinez, L.M.; Viegas, J.M. Assessing the impacts of deploying a shared self-driving urban mobility system: An agent-based model applied to the city of Lisbon, Portugal. Int. J. Transp. Sci. Technol. 2017, 6, 13–27. [Google Scholar] [CrossRef]
  62. Tractica. Robotics Market Revenue Worldwide 2017/2025|Statista. 2018. Available online: https://www.statista.com/statistics/760190/worldwide-robotics-market-revenue/ (accessed on 14 January 2020).
  63. Grahle, A.; Song, Y.W.; Brüske, K.; Bender, B.; Göhlich, D. Autonomous shuttles for urban mobility on demand applications—ecosystem dependent requirement elicitation. Proc. Des. Soc. Des. Conf. 2020, 1, 887–896. [Google Scholar] [CrossRef]
  64. Schneider, J. Studio LS301 Casestudy Sweep. 27 October 2019. Available online: https://www.studio-hint.com/studio-ls301-casestudy-sweep.html (accessed on 4 November 2019).
  65. MPM TU Berlin. MURMEL: Mobiler Urbaner Roboter zur MüllEimer Leerung. 2019. Available online: https://www.mpm.tu-berlin.de/menue/forschung/projekte/murmel/ (accessed on 4 November 2019).
  66. Kattwinkel, D.; Song, Y.W.; Bender, B. Analysis of ecodesign and sustainable design in higher education. In Proceedings of the Design 2018 15th International Design Conference, Dubrovnic, Croatia, 21–24 May 2018; Faculty of Mechanical Engineering and Naval Architecture, University of Zagreb: Zagreb, Croatia; The Design Society: Glasgow, UK, 2018; pp. 2451–2460. [Google Scholar] [CrossRef]
  67. Buchert, T.; Stark, R. Decision support tool to derive sustainable product configurations as A basis for conceptual design. In Proceedings of the DESIGN 2018 15th International Design Conference, Dubrovnic, Croatia, 21–24 May 2018; Faculty of Mechanical Engineering and Naval Architecture, University of Zagreb: Zagreb, Croatia; The Design Society: Glasgow, UK, 2018; pp. 2609–2620. [Google Scholar] [CrossRef]
  68. Benoît, C.; Mazijn, B. Guidelines for Social Life Cycle Assessment of Products; [deslibris e-book] ed.; United Nations Environment Programme: Paris, France, 2009. [Google Scholar]
  69. Schulte, J.; Hallstedt, S.I. Sustainability risk management for product innovation. In Proceedings of the DESIGN 2018 15th International Design Conference, Dubrovnic, Croatia, 21–24 May 2018; Faculty of Mechanical Engineering and Naval Architecture, University of Zagreb: Zagreb, Croatia; The Design Society: Glasgow, UK, 2018; pp. 655–666. [Google Scholar] [CrossRef]
  70. Kunith, A.; Mendelevitch, R.; Goehlich, D. Electrification of a city bus network—An optimization model for cost-effective placing of charging infrastructure and battery sizing of fast-charging electric bus systems. Int. J. Sustain. Transp. 2017, 11, 707–720. [Google Scholar] [CrossRef] [Green Version]
  71. Jefferies, D.; Göhlich, D. A Comprehensive TCO Evaluation Method for Electric Bus Systems Based on Discrete-Event Simulation Including Bus Scheduling and Charging Infrastructure Optimisation. World Electr. Veh. J. 2020, 11, 56. [Google Scholar] [CrossRef]
  72. Ehmke, J.F. Integration of Information and Optimization Models for Routing in City Logistics; International Series in Operations Research & Management Science; Springer Science + Business Media: Berlin/Heidelberg, Germany, 2012; Volume 177. [Google Scholar]
  73. Verein Netzwerk Logistik (VNL). Logistik-Wörterbuch. Hub and Spoke Systeme. Available online: https://www.vnl.at/de/services/logistik-woerterbuch/logistik-woerterbuch-detail/?no_cache=1&tx_ecxdictionary_pi%5Bitem%5D=196 (accessed on 2 December 2020).
  74. Wermuth, M. Personen- und Personenwirtschaftsverkehr. In Handbuch Verkehrspolitik; Springer Nature: Berlin/Heidelberg, Germany, 2007; pp. 323–347. [Google Scholar] [CrossRef]
  75. Coppola, P.; Esztergár-Kiss, D. (Eds.) Autonomous Vehicles and Future Mobility; Elsevier: Amsterdam, The Netherlands; Cambridge, MA, USA, 2019. [Google Scholar]
  76. Axhausen, K.W. Sind wir bald alle Passagiere? Neue Zür. Ztg. 2016, 4, 2016. [Google Scholar]
  77. Bischoff, J. Friend or foe? A data driven analysis of free-floating car sharing and taxi traffic in Berlin. Presented at the NECTAR Cluster 8 Workshop, Sevilla, Spain, 10–11 March 2016. [Google Scholar]
  78. Basu, R.; Araldo, A.; Akkinepally, A.P.; Nahmias Biran, B.H.; Basak, K.; Seshadri, R.; Deshmukh, N.; Kumar, N.; Azevedo, C.L.; Ben-Akiva, M. Automated Mobility-on-Demand vs. Mass Transit: A Multi-Modal Activity-Driven Agent-Based Simulation Approach. Transp. Res. Rec. J. Transp. Res. Board 2018, 2672, 608–618. [Google Scholar] [CrossRef]
  79. Bundesministerium für Wirtschaft und Energie. Nationales Reformprogramm 2020—Die Nationale Wasserstoffstrategie. Available online: https://www.bmbf.de/files/die-nationale-wasserstoffstrategie.pdf (accessed on 14 December 2020).
  80. Jahn, R.M.; Syré, A.; Grahle, A.; Schlenther, T.; Göhlich, D. Methodology for Determining Charging Strategies for Urban Private Vehicles based on Traffic Simulation Results. Procedia Comput. Sci. 2020, 170, 751–756. [Google Scholar] [CrossRef]
  81. Bischoff, J.; Maciejewski, M. Electric taxis in Berlin—Analysis of the feasibility of a large-scale transition. In Tools of Transport Telematics; Mikulski, J., Ed.; Springer International Publishing: Cham, Switzerland, 2015. [Google Scholar] [CrossRef]
  82. Levinson, D.M.; Krizek, K.J. The End of Traffic and the Future of Transport, 2nd ed.; Amazon Digital Services LLC: Seattle, WA, USA, 2015. [Google Scholar]
  83. Bischoff, J.; Maciejewski, M. Simulation of City-wide Replacement of Private Cars with Autonomous Taxis in Berlin. Procedia Comput. Sci. 2016, 83, 237–244. [Google Scholar] [CrossRef] [Green Version]
  84. Pavone, M. Autonomous Mobility-on-Demand Systems for Future Urban Mobility. In Autonomes Fahren: Technische, Rechtliche und Gesellschaftliche Aspekte; Maurer, M., Gerdes, J.C., Lenz, B., Winner, H., Eds.; Springer: Berlin/Heidelberg, Germany, 2015; pp. 399–416. [Google Scholar] [CrossRef] [Green Version]
  85. Wagner, P. Steuerung und Management in einem Verkehrssystem mit autonomen Fahrzeugen. Auton. Fahr. 2015, 313–330. [Google Scholar] [CrossRef] [Green Version]
  86. Von Mach, S.; Buschbeck, J.; Flerlage, H.; Zimmermann, U.; Boev, P. Die Entwicklung und Markteinführung des TALENT 3 Batterietriebzuges. Eisenbahntech. Rundsch. 2018, 9, 115–119. [Google Scholar]
  87. ZeEUS Project. ZeEUS eBus Report #2: An Updated Overview of Electric Buses in Europe. 2018. Available online: http://zeeus.eu/uploads/publications/documents/zeeus-report2017-2018-final.pdf (accessed on 25 June 2020).
  88. Lajunen, A.; Lipman, T. Lifecycle cost assessment and carbon dioxide emissions of diesel, natural gas, hybrid electric, fuel cell hybrid and electric transit buses. Energy 2016, 106, 329–342. [Google Scholar] [CrossRef]
  89. Leich, G.; Bischoff, J. Should Autonomous Shared Taxis Replace Buses? A Simulation Study; VSP Working Paper 18-05; TU Berlin, Transport Systems Planning and Transport Telematics: Berlin, Germany, 2018; Available online: http://www.vsp.tu-berlin.de/publications (accessed on 14 January 2021).
  90. Pakusch, C.; Stevens, G.; Boden, A.; Bossauer, P. Unintended Effects of Autonomous Driving: A Study on Mobility Preferences in the Future. Sustain. Sci. Pract. Policy 2018, 10, 2404. [Google Scholar] [CrossRef] [Green Version]
  91. Daimler AG. Vision Urbanetic. Available online: https://www.mercedes-benz.com/en/vehicles/transporter/vision-urbanetic-the-mobility-of-the-future/ (accessed on 1 December 2020).
  92. Toyota Motor Corporation. e-Palette Concept. Available online: https://www.toyota-global.com/pages/contents/innovation/intelligent_transport_systems/world_congress/2018copenhagen/pdf/e-Palette_CONCEPT.pdf (accessed on 1 December 2020).
  93. Schlenther, T.; Martins-Turner, K.; Bischoff, J.F.; Nagel, K. Potential of Private Autonomous Vehicles for Parcel Delivery. Transp. Res. Rec. 2020, 2674, 520–531. [Google Scholar] [CrossRef]
  94. Göhlich, D.; Gräbener, S. Identification of User-oriented Electric Commercial Vehicle Concepts with a Particular Focus on Auxiliaries. In Proceedings of the 25th Aachen Colloquium Automobile and Engine Technology, Aachen, Germany, 10–12 October 2016. [Google Scholar]
  95. Kohl, J.L.; van der Schoor, M.J.; Syré, A.M.; Göhlich, D. Social sustainability in the development of service robots. Proc. Des. Soc. Des. Conf. 2020, 1, 1949–1958. [Google Scholar] [CrossRef]
  96. ADAC (Allgemeiner Deutscher Automobil Club). ADAC Ecotest. Available online: https://www.adac.de/infotestrat/tests/eco-test/default.aspx?redirectId=quer.ecotest (accessed on 1 December 2020).
  97. Bender, B.; Gerike, K. (Eds.) Pahl/Beiz Konstruktionslehre, 9th ed.; Springer: Berlin, Germany, 2020. [Google Scholar] [CrossRef]
  98. Fay, T.A. Methodischer Technologievergleich von Systemkonzepten für die Elektrifizierung von Stadtbussen; Epubli: Berlin, Germany, 2019. [Google Scholar]
  99. Horni, A.; Nagel, K.; Axhausen, K.W. (Eds.) The Multi-Agent Transport Simulation MATSim; Ubiquity: London, UK, 2016. [Google Scholar] [CrossRef]
  100. Ziemke, D.; Kaddoura, I.; Nagel, K. The MATSim Open Berlin Scenario: A multimodal agent-based transport simulation scenario based on synthetic demand modeling and open data. Procedia Comput. Sci. 2019, 151, 870–877. [Google Scholar] [CrossRef]
  101. Hörl, S.; Balac, M. Reproducible Scenarios for Agent-Based Transport Simulation; Technical Report; ETH Zürich: Zürich, Switzerland, 2020. [Google Scholar] [CrossRef]
  102. Neumann, A.; Balmer, M. Mobility Pattern Recognition (MPR) und Anonymisierung von Mobilfunkdaten; White Paper; Senozon Deutschland GmbH: Berlin, Germany; Senozon AG: Zürich, Switzerland, 2020; V1.0; Available online: https://senozon.com/wp-content/uploads/Whitepaper_MPR_Senozon_DE-3.pdf (accessed on 14 January 2021).
  103. jsprit. Available online: https://github.com/graphhopper/jsprit (accessed on 2 December 2020).
  104. Sun, X.H.; Yamamoto, T.; Morikawa, T. Fast-charging station choice behavior among battery electric vehicle users. Transp. Res. Part D Transp. Environ. 2016, 46, 26–39. [Google Scholar] [CrossRef]
  105. Nicholas, M. Estimating Electric Vehicle Charginginfrastructure Costs Across Major U.S. Metropolitan Areas. 2019. Available online: https://theicct.org/publications/charging-cost-US (accessed on 14 January 2021).
  106. Caprara, A.; Kellerer, H.; Pferschy, U. The Multiple Subset Sum Problem. SIAM J. Optim. 2000, 11, 308–319. [Google Scholar] [CrossRef] [Green Version]
  107. Bäumer, M.; Hautzinger, H.; Pfeiffer, M.; Stock, W. Fahrleistungserhebung 2014: Inlandsfahrleistung und Unfallrisiko. 2014. Available online: https://www.bast.de/BASt_2017/DE/Publikationen/Berichte/unterreihe-v/2018-2017/v291.html (accessed on 14 January 2021).
  108. Girardi, P.; Gargiulo, A.; Brambilla, P.C. A comparative LCA of an electric vehicle and an internal combustion engine vehicle using the appropriate power mix: The Italian case study. Int. J. Life Cycle Assess. 2015, 20, 1127–1142. [Google Scholar] [CrossRef]
  109. Bauer, C.; Hofer, J.; Althaus, H.J.; Del Duce, A.; Simons, A. The environmental performance of current and future passenger vehicles: Life cycle assessment based on a novel scenario analysis framework. Appl. Energy 2015, 157, 871–883. [Google Scholar] [CrossRef]
  110. Biart, M. Social Sustainability as Part of the Social Agenda of the European Community. Nachhalt. Soz. Nachhalt. Umweltpolit. Nachhalt. Informationen Umweltpolit. 2002, 149, 5–10. [Google Scholar]
  111. Littig, B.; Griessler, E. Social sustainability: A catchword between political pragmatism and social theory. Int. J. Sustain. Dev. 2005, 8, 65. [Google Scholar] [CrossRef] [Green Version]
  112. Cocklin, C.; Alston, M. Community Sustainability in Rural Australia: A Question of Captial? Centre for Rural Social Research: Wagga Wagga, NSW, Australia, 2002. [Google Scholar]
  113. Van der Schoor, M.J. Methoden der Produktentwicklung und Mechatronik: MURMEL Guideline. Available online: https://www.mpm.tu-berlin.de/fileadmin/fg89/PDFs/Forschung/MURMEL/Guideline.pdf (accessed on 14 January 2021).
  114. Geissdörfer, K.; Gleich, R.; Wald, A. Standardisierungspotentiale lebenszyklusbasierter Modelle des strategischen Kostenmanagements. Z. Betriebswirtschaft 2009, 79, 693–715. [Google Scholar] [CrossRef]
  115. Götze, U.; Weber, T. ZP-Stichwort: Total Cost of Ownership. Z. Plan. Unternehmenssteuerung 2008, 19, 249–257. [Google Scholar] [CrossRef]
  116. Goehlich, D.; Spangenberg, F.; Kunith, A. Stochastic total cost of ownership forecasting for innovative urban transport systems. In Proceedings of the 2013 IEEE International Conference on Industrial Engineering and Engineering Management, Bangkok, Thailand, 10–13 December 2013; pp. 838–842. [Google Scholar] [CrossRef]
  117. Jefferies, D.; Göhlich, D. Integrated TCO Assessment of Bus Network Electrification Considering Rescheduling and Delays: Modelling Framework and Case Study. In Proceedings of the EVS31 International Electric Vehicle Symposium & Exhibition, Kobe, Japan, 1–3 October 2018. [Google Scholar]
  118. Propfe, B.; Redelbach, M.; Santini, D.; Friedrich, H. Cost analysis of Plug-in Hybrid Electric Vehicles including Maintenance & Repair Costs and Resale Values. World Electr. Veh. J. 2012, 5, 886–895. [Google Scholar] [CrossRef] [Green Version]
  119. Miranda Jahn, R.; Syré, A.M.; Grahle, A.; Martins-Turner, K.; Göhlich, D. Methodology for Determining Charging Strategies for Freight Traffic Vehicles Based on Traffic Simulation Results; Technische Universität Berlin: Berlin, Germany, 2020. [Google Scholar] [CrossRef]
  120. Ewert, R.; Grahle, A.; Martins-Turner, K.; Syré, A.; Nagel, K.; Göhlich, D. Electrification of Urban Waste Collection: Introducing a Simulation-Based Methodology for Feasibility, Impact and Cost Analysis; Technische Universität Berlin: Berlin, Germany, 2020. [Google Scholar] [CrossRef]
  121. PTV; TCI; Mannh, H.U. Methodenhandbuch zum Bundesverkehrswegeplan 2030 (Entwurf). 2016. Available online: https://www.bmvi.de/SharedDocs/DE/Anlage/G/BVWP/bvwp-methodenhandbuch.pdf?__blob=publicationFile (accessed on 14 January 2021).
  122. Arroyo, J.L.; Felipe, Á.; Ortuño, M.T.; Tirado, G. Effectiveness of carbon pricing policies for promoting urban freight electrification: Analysis of last mile delivery in Madrid. Cent. Eur. J. Oper. Res. 2020, 28, 1417–1440. [Google Scholar] [CrossRef]
  123. Scharf, M.; Heide, L.; Grahle, A.; Syré, A.M.; Göhlich, D. Environmental Impact of Subsidy Concepts for Stimulating Car Sales in Germany. Sustainability 2020, 12, 10037. [Google Scholar] [CrossRef]
  124. Bundesministerium für Umwelt, Naturschutz und nukleare Sicherheit (BMU). Wie klimafreundlich sind Elektroautos? 2019. Available online: https://www.bmu.de/fileadmin/Daten_BMU/Download_PDF/Verkehr/emob_klimabilanz_2017_bf.pdf (accessed on 14 January 2021).
Figure 1. zeroCUTS methodology.
Sustainability 13 00839 g001
Figure 2. Conceptual vehicle design process.
Sustainability 13 00839 g002
Figure 3. Charging methodology.
Sustainability 13 00839 g003
Figure 4. Life cycle assessment methodology.
Sustainability 13 00839 g004
Figure 5. Individual traffic—life cycle assessment results for greenhouse gas emissions.
Sustainability 13 00839 g005
Figure 6. Individual traffic—life cycle assessment results for all considered impact categories.
Sustainability 13 00839 g006
Figure 7. Calculated well-to-wheel GHG emissions of the food retailing scenario per year.
Sustainability 13 00839 g007
Figure 8. Calculated daily total cost of the simulated waste collection in Berlin on fleet-level.
Sustainability 13 00839 g008
Figure 9. Calculated well-to-wheel GHG emissions of the simulated waste collection in Berlin per year.
Sustainability 13 00839 g009
Figure 10. zeroCUTS roadmap.
Sustainability 13 00839 g010
Table 1. Vehicle Specifications.
Battery ElectricGasoline-FuelledDiesel-Fuelled
Vehicle body share
[%]
91 (w/o battery)7469
Vehicle classessmallmediumbigsmallmediumbigsmallmediumbig
Vehicle mass
[kg]
119916772329106814111639113715031745
Battery capacity
[kWh]
254075------
Battery weight
[kg]
3335331000------
Urban consumption
[l or kWh/100 km]
152025.97.38.710.55.76.78.4
Suburban consumption
[l or kWh/100 km]
141725.24.95.87.23.84.55.8
Highway consumption
[l or kWh/100 km]
242837.86.37.59.24.55.36.7
Table 2. Share of Vehicle Classes.
Vehicle ClassesBase Case
Small27%
(93% gasoline- and 8% diesel-fueled)
Medium40%
(65% gasoline- and 35% diesel-fueled)
Large33%
(49% gasoline- and 51% diesel-fueled)
Publisher’s Note: MDPI stays neutral with regard to jurisdictional claims in published maps and institutional affiliations.

