Abstract
Soil salinization poses a significant challenge for achieving sustainable utilization of land resources, especially in coastal, arid, and semi-arid areas. Timely monitoring of soil salt content and its spatial distribution is conducive to secure efficient agricultural development in these regions. In this study, to address the persistent problem of soil salinization in the Yellow River Delta in China, the feature space method was used to construct multiple feature spaces of surface albedo (Albedo)–modified soil-adjusted vegetation index (MSAVI), salinity index (SI)–Albedo, and SI–normalized difference vegetation index (NDVI), and an optimal inversion model of soil salinity was developed. Based on Landsat 8 Operational Land Imager (OLI) image data and simultaneous field-measured sampling data, an optimal model from 2015 to 2019 was used to obtain the soil salt content in the region at a 30 m resolution. The results show that the proportion of soil salinization in 2015 and 2019 was approximately 76% and 70%, respectively, and overall soil salinization showed a downward trend. The salinization-mitigated areas are primarily distributed in the southwest of the Yellow River Delta, and the aggravated areas are distributed in the northeast and southeast. In general, the spatial variation characteristics show an increasing trend from the southwest to the eastern coastal areas, corresponding to the formation mechanism of salt accumulation in the region. Further, corresponding sustainable development countermeasures and suggestions were proposed for different salinity levels. Meanwhile, this study revealed that the SI–Albedo feature space model is the most suitable for inversion of salinization in coastal areas.
1. Introduction
Land degradation is a global ecological and environmental issue [1]. The United Nations Summit of 2015 adopted the 2030 Agenda for Sustainable Development, which includes 17 Sustainable Development Goals (SDGs) and 169 specific indicators, covering the three major areas of society, economy, and environment to form a comprehensive target system [2]. Goal 15 emphasizes the protection, restoration, and promotion of the sustainable use of terrestrial ecosystems, sustainable management of forests, prevention of desertification, suppression and reversal of land degradation, and prevention of biodiversity loss. Soil salinization, a type of land degradation, has become a global environmental problem [3,4], which produces disturbances in the natural environment and affects human activities. When capillary action or evapotranspiration causes groundwater to rise, the soluble salts in the soil accumulate on the surface. An excessively high salt content contributes to various degrees of salinization [5,6]. With time, soil salinization deteriorates the land environment and intensifies the contradiction between social and economic development and environmental protection [7].
Globally, 1 billion ha of land are currently threatened by salinization, accounting for approximately 7% of the terrestrial land area [8,9]. China contains nearly 97 million ha of saline–alkaline land, of which modern saline–alkali land, residual saline–alkali soil, and potential saline–alkali soil account for 36, 45, and 17 million ha, respectively. These areas are primarily distributed in the North China Plain [10], the Yellow River Hetao Plain, and the northwest inland area [11]. The Yellow River Delta is a typical coastal soil salinization area in northern China [12]. The groundwater depth is shallow in the region, the spatial distribution of salinity is uneven, and the dynamic processes of regional water and salt are complex. The phenomenon of returning salt makes the use of medium and heavily saline–alkali land difficult and severely restricts the development and utilization of land resources. In 2019, Chinese President Xi Jinping emphasized the need to strengthen the protection of the wetland ecosystem in the lower Yellow River delta, to improve biodiversity, and integrate ecological protection and high-quality development of the Yellow River Basin. Therefore, timely monitoring of soil salinization is of great significance for the protection of the ecosystem and promotion of sustainable development of the Yellow River Delta.
Since the 1970s, the interpretation of soil salinization based on multiple remote sensing data has gradually been used. In 2007, to verify the linear and nonlinear relationship between soil reflectivity and soil salinity, Fariftech et al. [13] used Partial Least Squares Regression (PLSR) and Artificial Neural Network (ANN) to compare the performance of these two adaptive methods. In 2015, Yang et al. [14] proposed a method based on similarity to predict soil salinity in the Yellow River Delta with limited observation data. In 2016, Azabdaftari et al. [15] extracted the Normalized Difference Vegetation Index (NDVI), Ratio Vegetation Index (RVI), Soil-Adjusted Vegetation Index (SAVI), Normalized Difference Snow Index (NDSI), and other indexes using Landsat data for Adana, Turkey. Field-measured conductivity data were used to analyze the relationship between the original image band values and the image band values of different indexes to create a soil salinity map of the area. Morgan et al. [16] used the Sentinel-2 multispectral and ANN methods to predict soil salinity in Cairo, Egypt, and determined that this method exhibits higher potential in predicting soil salinity than the traditional techniques. In 2019, Hoa et al. [17] selected the Gaussian process (GP) through a multimachine learning model comparison using Sentinel-1A data to map the soil salinity distribution in the Mekong Delta. Ding et al. [18,19,20,21,22] used Landsat TM data to analyze the relationship between salinized soil, the Modified Soil-Adjusted Vegetation Index (MSAVI), and the Wetness Index (WI). Based on the analysis, the concept of MSAVI-WI feature space was used to construct a remote sensing monitoring index model of soil salinization. Ma [23,24] used a hyperspectral data (HJ-1A) source for mathematical transformation of the surface reflectance and performed a regression analysis with the measured soil salinity to monitor and determine land salinization in the Songliao Plain.
In summary, based on multispectral remote sensing data combined with supervised classification, unsupervised classification, neural network automatic extraction, and other methods, most scholars have studied the mechanism of soil salinization inversion and achieved a series of results. However, this type of semi-automatic classification method is time-consuming and labor-intensive. The model indicators for the feature space method are simple, feasible, and easy to extract. They are being gradually applied in the fields of soil moisture inversion, drought monitoring, and soil salinization detection in arid and semi-arid areas [25,26]. This study selected Kenli County, a typical soil salinization area in the Yellow River Delta, as the study area, fully utilized the multispectral information of image data, and developed quantitative models that couple the soil spectral characteristics, vegetation biophysical characteristics, and soil salinity. The specific objectives of the study are as follows: (1) to obtain a universal model suitable for inversion of the soil salt content in the saline area of the Yellow River Delta to realize quantitative inversion and dynamic monitoring of the soil salt content and (2) to invert the spatial distribution of soil salinization in 2015 and 2019 using the optimal model, analyze the spatiotemporal patterns and changes and the driving forces of salinization, and propose recommendations for its prevention and control.
2. Materials and Methods
2.1. Overview of the Study Area
The Yellow River Delta, located in northern Shandong Province, is an alluvial plain formed by sediments carried by the Yellow River Estuary in the coastal zone. Kenli County, located in the estuary of the Yellow River, is the research area of this study. This area lies between 37°24′ N–38°10′ N latitude and 118°15′ E–119°19′ E longitude (Figure 1). The research area includes five towns: Shengtuo, Haojia, Yong’an, Huanghekou, and Dongji; the Kenli and Xinglong subdistricts; and one provincial economic development zone—the Shandong Kenli Economic Development Zone. Because of the influence of the continental monsoon, the distribution of precipitation in this area is not uniform and is mostly concentrated in the summer. The average annual precipitation is 530–630 mm, and the average annual evaporation is 1750–2430 mm. The evaporation is much higher than the rainfall, with the ratio of evaporation to rainfall being approximately 3.5:1. Most of the soil types are fragile saline and tidal soils. The primary types of woody vegetation are salt-tolerant rose willow and reed, while the primary crops are rice, wheat, and cotton.
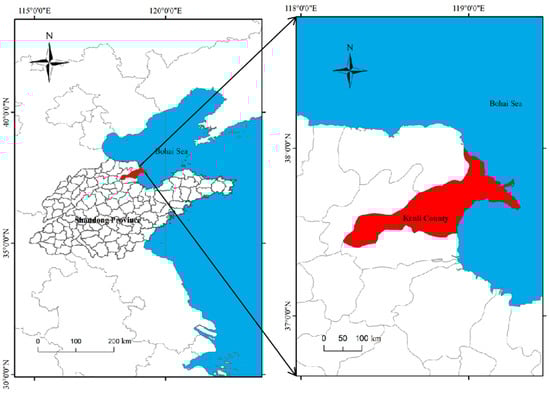
Figure 1.
Geographical location of the study area.
2.2. Data Sources
(1) Remote sensing data: The Landsat 8 satellite Operational Land Imager (OLI), whose images are released by the National Aeronautics and Space Administration (NASA), was selected as the data source. The used images have nine bands, cover an area of 185 × 185 km2, and have a spatial resolution of 30 m. In spring, as the Yellow River Delta region experiences abundant evaporation and low soil moisture, farmland has not yet been cultivated during this season and the soil mostly has sparse ground vegetation; hence, this is a suitable time for salinization inversion. Thus, images acquired on 30 April 2015 and 29 April 2019 were selected and synchronized with the ground observation time.
(2) Field sampling data: This study required two periods of field survey data, in 2015 and 2019. The data of the measured sample points included soil salinity, soil organic matter, soil pH value, and soil conductivity. The sampling data, evenly distributed throughout the Kenli County area (as shown in Figure 2), were acquired on-site by the research team from April 2019. The coordinates of the sample points were measured by GPS in the field with centimeter-level accuracy. Three soil samples were randomly selected within 25 m2 of each sampling point, mixed, and placed into a single sampling bag for subsequent physical and chemical analyses. The soil sampling depth was 0–20 cm, and approximately 1000 g of soil samples were obtained from each sampling point. The salinity content was averaged from multiple measurements collected at the same site using a highly sensitive soil salinity meter. The May 2015 sampling data were acquired on-site by another research team. The samples were also designed according to the principle of uniform distribution; this followed the same sampling methods and rules used in 2019.
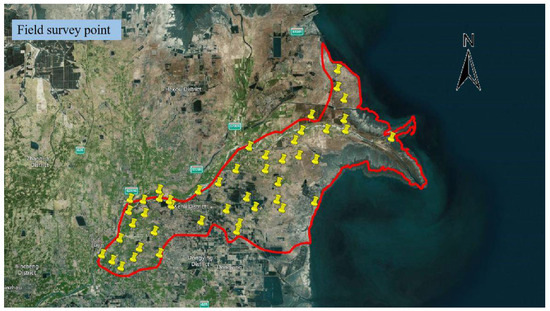
Figure 2.
Distribution of actual soil salinization sampling points in 2019 in the Yellow River Delta.
2.3. Methods
2.3.1. Feature Parameters
Albedo
Surface albedo refers to the ratio of the quantity of surface-reflected radiation to the incident radiation; it indicates the ability of the ground to absorb and reflect solar radiation [27]. A higher reflectivity implies a smaller absorption capacity of the ground to solar radiation and vice versa; it is suitable to reveal information about salinized soil. In this study, we use the inversion formula of albedo established by Liang [28], as shown in Formula (1):
where B, R, NIR, SR1, and SR2 correspond to the reflectivity values of the blue, red, and near-infrared bands, short-wave infrared band 1, and short-wave infrared band 2, respectively, in the OLI image.
Modified Soil-Adjusted Vegetation Index (MSAVI)
In salinization inversion, areas with low vegetation density are affected by the soil background. The MSAVI considers the influence of soil lines on bare land during the inversion, which can better highlight the soil information with less vegetation. The MSAVI extracts vegetation information, as shown in Formula (2) [29]:
where NIR and R represent the reflectivity values of the near-infrared and red bands in the OLI image, respectively.
Normalized Difference Vegetation Index (NDVI)
Vegetation health is affected by salinity; thus, remote sensing indicators related to vegetation health are often used to estimate soil salinity [30]. The NDVI is more sensitive to the performance of green vegetation, and it can eliminate most of the changes in irradiance related to instrument calibration, solar angle, terrain, cloud shadow, and atmospheric conditions. Higher NDVI values indicate more green vegetation. The NDVI is used as an indicator to monitor soil salinization, as shown in Formula (3) [31]:
where NIR and R represent the reflectivity values of the near-infrared and red bands in the OLI image, respectively.
Salinity Index (SI)
SI is an important factor for describing soil salinization. It is used to extract salt information, as shown in Formula (4) [32]:
where B and R represent the reflectivity values of the blue and red bands in the OLI image, respectively.
The maximum and minimum values of MSAVI, Albedo, SI, and NDVI were calculated using the ENVI software statistical tools. Because the values and dimensions of the various indexes are not uniform, each index is normalized to ensure the comparability of the feature space construction. Data normalization was performed using the statistical value of ENVI. Finally, the normalization values were calculated, including the normalized values: M of MSAVI, A of albedo, N of NDVI, and S of SI.
2.3.2. Feature Space Principle
The feature space is a spatial system composed of two or more bands or spectral indicators used to measure the spectral characteristics of ground parameters in remote sensing images. The pixel points are distributed in a certain geometric shape, and the ground parameters with the same attributes form a relatively clustered point group, whereas the ground objects with different attributes are separated from each other and distributed in different positions in the feature space because of their different spectral characteristics. Thus, different land surface parameters can be effectively separated using this system. The feature space system has been applied in the research of surface evapotranspiration, soil moisture monitoring, crop water content, drought monitoring, desertification monitoring, soil salinity, and other fields [33].
Surface Albedo–MSAVI Feature Space
There is a significant relationship between the occurrence of saline soil and the characteristic parameters of the soil spectrum. The Albedo–MSAVI feature space [22] is shown in Figure 3a. There is a nonlinear relationship between albedo and MSAVI. The degree of soil salinization increases and the MSAVI decreases as the albedo increases. The surface evapotranspiration resistance, soil salt content, and albedo decrease with an increase in surface vegetation coverage. Point A in Figure 3a represents heavily salinized land with low vegetation coverage and high surface albedo (low MSAVI and high albedo), point B represents bare land, and point C represents high vegetation coverage area with relatively low albedo and sufficient soil moisture content (high MSAVI and low albedo).
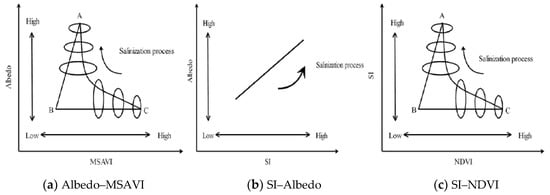
Figure 3.
Principle of feature space.
Salinity Index–Surface Albedo (SI–Albedo) Feature Space
The SI–Albedo feature space is shown in Figure 3b. The SI and surface albedo have significant linear characteristics. The surface albedo increases with the increase in the SI, and the salinization process becomes increasingly severe. In contrast to the models using the vegetation index (e.g., MSAVI and NDVI), SI–Albedo is not sensitive to vegetation change. This model does not need to use the vegetation index as an indirect transfer tool for inversion of the SI.
SI–NDVI Feature Space
The SI–NDVI feature space is shown in Figure 3c. There is a nonlinear relationship between SI and NDVI. The salinity content continues to increase, the vegetation coverage continues to decline, and the degree of salinity gradually increases. Point A in Figure 3c represents heavily salinized land with high soil salinity and low vegetation coverage, point B represents bare land, and point C represents a high vegetation coverage area.
Space Inversion Model
The Albedo–MSAVI feature space inversion model takes the normalized MSAVI as the horizontal axis and normalizes albedo as the vertical axis to establish a two-dimensional scatter plot. There is a nonlinear relationship between surface albedo and MSAVI (Figure 4a), similar to that shown in Figure 3a. Taking the MSAVI and Albedo coordinates (0, 1) as reference points in Figure 4a, the distance from any point in the scatter diagram to the reference point reflects the degree of salinization. Closer distances signify more severe salinization, and vice versa. A remote sensing monitoring model is constructed on this basis, as shown in Formula (5):
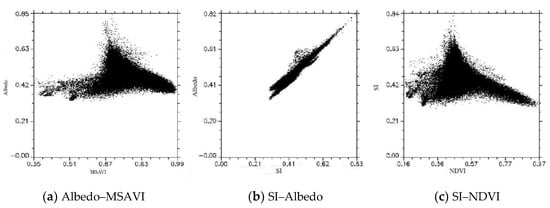
Figure 4.
Scatter diagram of the feature space.
The SI−Albedo feature space inversion model takes the normalized SI as the horizontal axis and the normalized albedo as the vertical axis to establish a two-dimensional scatter plot. As shown in Figure 4b, the scatter diagram shows a band-like distribution (similar to that in Figure 3b). With the increase in the SI, the degree of salinization is increasingly severe. The reference point is the point with an SI of 0 and a surface albedo of 0. The closer any point is to this point in the scatter diagram, the less the degree of soil salinization and vice versa. A remote sensing monitoring model is built on this basis, as shown in Formula (6):
The SI−NDVI feature space inversion model considers the NDVI as the horizontal axis and the normalized SI as the vertical axis to establish a two-dimensional scatter plot, as shown in Figure 4c. Considering the NDVI and SI coordinates (1, 0) as the reference point, greater distances from this point in the scatter diagram indicate a more severe degree of soil salinization (similar to that in Figure 3c). A remote sensing monitoring model is constructed on this basis, as shown in Formula (7):
3. Results
3.1. Inversion Results and Classification
The Jenks natural breakpoint classification method is based on the statistical Jenks optimization method. This method is a self-similar clustering method for a one-dimensional data series. According to the intrinsic statistical characteristics of data samples, this method calculates the relatively large jumps between arrays under the condition of a specified number of categories. On this basis, the data with the greatest similarity is divided into a group (a category), and the data samples with the greatest difference are divided into different categories. Compared with other classification methods, such as goodness of fit, the Jenks natural breakpoint classification method has the advantages of the smallest difference within a class and the largest difference between classes [34]. Using this method, the Albedo–MSAVI, SI–Albedo, and SI–NDVI values of the monitoring models were divided into five levels, and five ranges were obtained (Table 1).

Table 1.
Salinization monitoring indicators of Kenli County in 2015.
Different countries have their own classification standards for local soil salinization assessment and measurement control. According to the classification standard of soil salinization in China and following Lu Rukun’s Analytical methods of soil agricultural chemistry [35], the degree of soil salinization in coastal, semi-humid, semi-arid, and arid areas is divided into the following five categories: nonsalinization soil (soil salinity < 1.0 g·kg−1), mild salinization soil (soil salinity 1.0–2.0 g·kg−1), moderate salinization soil (soil salinity 2.0–4.0 g·kg−1), severe salinization soil (soil salinity 4.0–6.0 g·kg−1), and saline soil (soil salinity > 6.0 g·kg−1). According to this standard, the salinization classification is performed for the field measurement sample points. We compare the salinization degree of the measured value with the predicted value of each model and determine the inversion accuracy of the Albedo–MSAVI, SI–Albedo, and SI–NDVI feature space monitoring models in 2015 and 2019. The model accuracy verification results are presented in Table 2.
Table 2.
Accuracy verification of the models.
According to Table 2, the classification accuracies of the remote sensing monitoring models constructed for 2015 and 2019 based on the SI–Albedo feature space are the highest, at 86.8% and 87.2%, followed by the remote sensing monitoring model constructed by the Albedo–MSAVI feature space with classification accuracies of 81.6% and 82.9%, respectively. The classification accuracies of the remote sensing monitoring models for 2015 and 2019 based on the SI–NDVI feature space are the lowest, at 73.7% and 80.9%, respectively. Among them, the SI–NDVI model shows the largest difference in overall accuracy between 2015 and 2019.
3.2. Spatial and Temporal Distributions and Changes
Based on the optimal SI–Albedo inversion model, ArcGIS was used to extract the SI information, and a salinization grade distribution map was obtained. The overall phenomenon of high degree of salinization was revealed by the inversion distribution map of the SI–Albedo monitoring model in 2015 (Figure 5a). Approximately 76% of the area is eroded by soil salinization. The areas of moderate salinization, mild salinization, severe salinization, and saline soil cover 56,205, 43,112, 30,147, and 9134 ha, which in turn account for 30.5%, 23.4%, 16.4%, and 5% of the total area of Kenli County, respectively. Moderate salinization and severe salinization are distributed in the central and some coastal areas. Mild salinization is distributed in the northeast region and near water, such as rivers and lakes. Nonsalinization regions are distributed on both sides of the Yellow River as the adjacent land is irrigated by water from the Yellow River, causing a decline in soil salt content. The distribution of salinization in Kenli County generally shows certain regularity; thus, the degree of salinization in the coastal and northwestern marginal regions is more severe. The degree of salinization in the north-central regions is lighter.
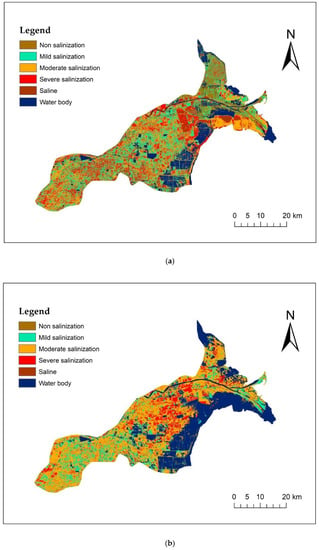
Figure 5.
Distribution of soil salt content of SI–Albedo in Kenli County in 2015 (a) and 2019 (b).
Figure 5b shows the distribution map of the SI–Albedo feature space salinization inversion constructed in 2019. According to statistical calculations, approximately 70% of the land in the study area is threatened by soil salinization. Moderate salinization, mild salinization, severe salinization, and saline areas cover 83,779.47, 26,390.34, 18,053.46, and 450.63 ha, accounting for 45.5%, 12.0%, 9.8%, and 1.0% of the total area, respectively. The areas of mild salinization are primarily scattered in the southwest with high terrain and the northeast near both sides of the Yellow River. Moderate salinization is widely distributed in the southwest, central, and northeastern areas. Severe salinization areas are primarily distributed in the eastern coastal areas because the southwestern region has higher terrain, better drainage, and lighter soil salinity. However, the eastern coastal region is closer to the sea and experiences more severe degrees of salinization. The degree of salinization of the soil indicates that salt content increases with proximity to the ocean.
To further analyze the changes in soil salinization in Kenli County, the SI–Albedo feature space inversion distribution maps for 2015 and 2019 were superimposed. The change in soil salinization in Kenli County was divided into four categories: unchanged, less salinized, more salinized, and flooded or water body. The dynamic changes in salinity in Kenli County over the past five years were analyzed. The spatial distribution of soil salinization is shown in Figure 6. According to the statistical results, areas with unchanged soil salinization, reduced soil salinization, and aggravated degree of salinization cover approximately 16,790, 80,153, and 36,187 ha, respectively. The overall salinization situation in Kenli County has generally improved, and the areas with reduced soil salt content are primarily concentrated in the western region (Dongji Town and Shengtuo Town) and central region (Kenli Town and Xisong Town). The areas of increased soil salt content are primarily concentrated in the eastern coastal areas (parts of Huanghekou Town and Yong’an Town).
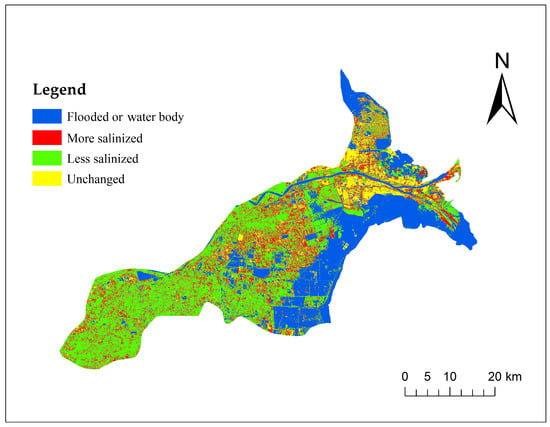
Figure 6.
Spatial changes in soil salt content grades in Kenli County from 2015 to 2019.
4. Discussion
This study shows that the feature space model method has certain advantages for the inversion of soil salinity in the Yellow River Delta of China. Four spectral feature parameters (Albedo, MSAVI, NDVI, and SI) were extracted using multispectral data from the Landsat 8 OLI combined with field-measured sampling data. Three groups of two-dimensional feature spaces, Albedo–MSAVI, SI–NDVI, and SI–Albedo, were constructed, and a monitoring model for soil salinization using remote sensing images was established. These feature spaces are constructed using feature parameters with clear biophysical significance and the quantitative relationship between the salinization process and the surface feature parameters. Compared with supervised classification, unsupervised classification, neural network automatic extraction, and other methods, the model index of the feature space method is simple, feasible, and easy to extract. The application of the two-dimensional feature space theory to develop quantitative methods and indicators of salinization based on remote sensing monitoring has great potential. In general, the remote sensing monitoring model can effectively distinguish salinized land to different degrees and address the partially insufficient monitoring ability of soil spectral characteristics. Moreover, the feature space model index is relatively simple and easy to obtain compared with the methods having model complexity and parameter uncertainty problems.
The comparison shows that the inversion accuracy of the SI–Albedo feature space monitoring model is higher than that of the Albedo–MSAVI and SI–NDVI models. The former can rapidly extract salinization information in Kenli County and is more suitable for dynamic monitoring of salinization in the Yellow River Delta. A possible reason is that the study area is located in a special geographical environment of the coastal area. As two important biophysical parameters, the SI and surface albedo directly reflect the degree of salinization. Albedo–MSAVI and SI–NDVI reflect the salinization level through an indirect parameter, the vegetation index (e.g., MSAVI or NDVI). Thus, they are sensitive to vegetation distribution and changes. The selected images are from the spring season, not from the summer, which has the highest vegetation cover. However, because of the ocean climate, there was still some vegetation growing in April. This may decrease the evaluation accuracy of Albedo–MSAVI and SI–NDVI. Regarding the differences in evaluation accuracy, the SI–NDVI model has the largest relative errors. SI–NDVI reflects the interaction between salinity and vegetation, and high vegetation coverage will affect the accuracy of soil salinity inversion in this region. Although the minimum vegetation coverage season, spring, is selected in this study, there is still vegetation or crop growing in this coastal region. However, vegetation coverage is different in different years owing to the influence of climate. Comparing the two periods of images, the ground vegetation growth in 2015 was denser and the vegetation coverage was larger, resulting in a relatively lower accuracy in 2015. This also indicates that the SI–NDVI model is not suitable for coastal areas with large vegetation growth regions.
However, for inland arid areas, where vegetation coverage is low and annual precipitation is small, vegetation and water information are more sensitive to salinization. The Albedo–MSAVI and the SI–NDVI feature spaces can more significantly highlight vegetation information and spectral parameters related to vegetation. Feng et al. [20] and Wang et al. [21] used the Albedo–MSAVI and SI–NDVI feature spaces to analyze soil salinization in the Tarim region, Xinjiang, China. The results show that both sets of feature spaces have a specific positive significance for salinization extraction in arid areas. Therefore, different users should select a suitable salinization inversion model according to their specific geographical features.
The soil salinization status of Kenli County in the Yellow River Delta was analyzed using a spatial variation diagram. The aggravation of salinization in the eastern area is primarily affected by the infiltration of seawater because Kenli County is located in the estuary area with low land terrain close to the Bohai Sea to the east. In the middle part of Kenli County, the population is dense, human activities are frequent, and the change in land use type is fast, thus reducing the degree of salinization. The southwestern region has higher terrain, steep slopes, and good drainage facilities, and a relatively reduced salinization degree. The degree of change in soil salinization is generally characterized by spatial variation from the southwest to the eastern coastal area, which is consistent with the results of Wang and Hu [36,37].
From the spatial change analysis, we can see that the control of soil salinization in Kenli County improved from 2015 to 2019. This is in general agreement with the results of Guo et al. [25] using the MSAVI–SI feature space method in the Yellow River Basin. The saline land area statistics published by the local government are consistent with our findings. The principal reason for this trend may be linked to the sustainable development policies and actions in China. After 2015, China adopted the construction of an ecological civilization as the fundamental plan for sustainable development [38]. The local governments in Kenli County and Dongying City thoroughly support the construction of an ecological civilization and promote forestry ecological construction projects [39]. Among them, the Dongying City Forestry Ecological Construction Project implemented a new management model, “project management, engineering reforestation.” Combined with the existing experience of afforestation and greening project construction, this project uses mature reforestation techniques in saline land and engineering reforestation techniques in plain areas for soil improvement. The ecological project realizes the afforestation and comprehensive development of saline lands, thus partially improving the saline lands in Kenli County.
The Yellow River Delta has a large potential for agriculture. In April 2013, the Ministry of Science and Technology of China launched a major scientific and technological support project in Shandong, Hebei, and Liaoning provinces and the city of Tianjin around the Bohai Sea region, called the “Bohai Granary” science and technology demonstration project. By the comprehensive implementation of soil, fertilizer, water, and other key technologies, the project aims to solve the shortage of fresh water resources, barren soil, and saline agriculture production problems. The objective of the project is to increase grain consumption by 3 billion kg by 2017 and increase by 5 billion kg by 2020, so as to enhance grain production capacity and benefit in the middle- and low-production areas around Bohai Sea [40]. Since Dongying City has undertaken the Bohai Granary project, focusing closely on the target of changing salt and increasing grain yield, it has established and improved the technical system for the development of saline land and the transformation of low- and medium-yielding fields. Dongying City has transformed a total of 8000 ha of saline wasteland and 20,000 ha low-yielding fields to medium- and high-yielding fields, mainly on rice [41]. Rice is commonly used as a medium salt-sensitive crop to improve saline land and increase land use efficiency. Not only can rice planting on saline land gradually sink the salt in the surface layer of the soil through irrigation, but also paddy and dry crop rotation can be carried out to further improve the soil structure after three years of continuous planting [42].
Multidisciplinary methods such as soil science and agronomy should be combined closely for long-term resolution of soil salinization problems in Kenli County. Faced with the causes of salt division in different regions, the local government should consider the four aspects of improvement measures for water conservancy and agricultural, biological, and chemical conditions, and select suitable saline soil improvement measures according to local characteristics. Soil salinization in the southwest and central areas is relatively light; thus, attention should be paid to field preparation, including rapid deepening and leveling of the soil. Soil salinization in the eastern region is more severe, the terrain is low-lying, and agricultural development conditions are backward. This region can fully utilize the advantages of proximity to the sea and the development of aquaculture. On the basis of building a complete irrigation and drainage system, the central region should improve the saline–alkali soil by leveling the land, setting up drainage ditches to reduce the groundwater level, and implementing tree pit cushions and other technologies.
5. Conclusions
In this study, we combined remote sensing and field sampling data to address the persistent soil salinization problem in the Yellow River Delta region of China and used feature space methods to construct salt inversion models. Based on the optimal model, SI–Albedo, 30 m resolution data for the Yellow River Delta soil salinization in 2015 and 2019 were obtained for the first time, and the pattern and changes in salt distribution were analyzed. It was found that the proportion of soil salinization in Kenli County in 2015 and 2019 was approximately 76% and 70%, respectively, and the overall soil salinization in Kenli County showed a downward trend. From a spatial distribution perspective, the degree of salinization increased with increased proximity to the ocean. The degree of salinization in the northeast and southeast coastal areas of Kenli County showed an increasing trend, and the degree of salinity in the southwest showed a decreasing trend. The overall situation of salinization control in Kenli County has improved. Based on the above knowledge and experience, corresponding sustainable development countermeasures for different salinity areas were proposed with the aim of addressing the problems of different types of soil salinization in Kenli County.
The results also show that the SI–Albedo feature space model is the most suitable model for long-term salinization inversion in coastal areas. For the next step, more historical images (e.g., from the Landsat and Sentinel satellites) will be collected and used for long-term salinization monitoring. This study can also serve as reference for users in different regions of the world regarding soil salinization. However, different regions should select the optimal model according to their local geographic conditions and generate salinization maps using a local salinization classification system.
Author Contributions
J.W. was responsible for the research design, analysis, and manuscript design and review. J.L. and L.B. drafted the manuscript and was responsible for data preparation, experiments, and analyses. B.H. was responsible for the research design field survey and manuscript review. All authors contributed to the editing and reviewing of the manuscript. All authors have read and agreed to the published version of the manuscript.
Funding
This research was funded by the Strategic Priority Research Program (Class A) of the Chinese Academy of Sciences grant number XDA19040501, the Construction Project of the China Knowledge Center for Engineering Sciences and Technology grant number CKCEST-2020-2-4, and the 13th Five-Year Informatization Plan of the Chinese Academy of Sciences grant number XXH13505-07. The APC was funded by the Strategic Priority Research Program (Class A) of the Chinese Academy of Sciences grant number XDA19040501.
Institutional Review Board Statement
Not applicable.
Informed Consent Statement
Not applicable.
Data Availability Statement
Data sharing not applicable.
Acknowledgments
A special acknowledgment should be expressed at the China–Pakistan Joint Research Center on Earth Sciences that supported the implementation of this study. Thank you to Mengmeng Hong in Shandong University of Technology for comment and discussion.
Conflicts of Interest
The authors declare no conflict of interest.
References
- Perri, S.; Suweis, S.; Holmes, A.; Marpu, P.R.; Entekhabi, D.; Molini, A. River basin salinization as a form of aridity. Proc. Natl. Acad. Sci. USA 2020, 117, 17635–17642. [Google Scholar] [CrossRef]
- Guo, H.D. A Project on big Earth data science engineering. Bull. Chin. Acad. Sci. 2018, 33, 818–824. [Google Scholar] [CrossRef]
- Wang, X.M.; Zhou, X.H. Estimation and inversion modeling of salinity of cotton field soil using remote sensing in the delta oasis of Weigan and Kuqa rivers. Agric. Res. Arid. Areas 2018, 36, 250–254. [Google Scholar] [CrossRef]
- Gong, Y.L. Inversion of bare surface soil salinity based on microwave remote sensing. Jiangsu Agric. Sci. 2015, 43, 442–444. [Google Scholar]
- Feng, J.; Ding, J.L.; Wei, W.Y. Soil salinization monitoring based on Radar data. Remote Sens. Land Resour. 2019, 31, 195–203. [Google Scholar] [CrossRef]
- Wu, C.S.; Huang, C.; Liu, G.H.; Liu, Q.S. Spatial prediction of soil salinity in the yellow river delta based on geographically weighted regression. Resour. Sci. 2016, 38, 704–713. [Google Scholar] [CrossRef][Green Version]
- Allbed, A.; Kumar, L. Soil salinity mapping and monitoring in arid and semi-arid regions using remote sensing technology: A review. Adv. Remote Sens. 2013, 2, 13. [Google Scholar] [CrossRef]
- Ghassemi, A.; Jakeman, A.J.; Nix, H.A. Salinisation of Land and Water Resources: Human Causes, Extent, Management and Case Studies; NSW University Press: Sydney, Australia, 1995; ISBN 0868401986. [Google Scholar]
- Mashimbye, Z.E.; Cho, M.A.; Nell, J.P.; De Clercq, W.P.; Van Niekerk, A.; Turner, D.P. Model-based integrated methods for quantitative estimation of soil salinity from hyperspectral remote sensing data: A case study of selected South African soils. Pedosphere 2012, 22, 640–649. [Google Scholar] [CrossRef]
- Gou, Q.Q.; Han, Z.W.; Wang, G.H. Research progress on soil salinization in arid irrigated area of Northwestern China. Chin. Agric. Sci. Bull. 2011, 27, 246–250. [Google Scholar]
- Zuo, T.; He, L.; Zhang, J.M. Dynamic change in coastal soil salinization based on the CA-Markov model. Resour. Sci. 2014, 36, 1298–1305. [Google Scholar]
- Zhang, X.G.; Lai, H.Y.; Li, X.L.; Li, S.M.; Cui, D.J. Spatial and temporal variation of soil salinity in Kenli county of the yellow river delta area in recent ten years. Yellow River 2019, 41, 64–68. [Google Scholar]
- Farifteh, J.; Van der Meer, F.; Atzberger, C.; Carranza, E.J.M. Quantitative analysis of salt-affected soil reflectance spectra: A comparison of two adaptive methods (PLSR and ANN). Remote Sens. Environ. 2007, 110, 59–78. [Google Scholar] [CrossRef]
- Yang, L.; Huang, C.; Liu, G.H.; Zhu, A.X. Mapping soil salinity using a similarity-based prediction approach: A case study in Huanghe river delta, China. China Geogr. Sci. 2015, 25, 283–294. [Google Scholar] [CrossRef]
- Azabdaftari, A.; Sunar, F. Soil salinity mapping using multitemporal landsat data. The international archives of the photogrammetry. Int. Arch. Photogramm. Remote Sens. Spat. Inf. Sci. 2016, 41, B7. [Google Scholar] [CrossRef]
- Morgan, R.S.; El-Hady, M.A.; Rahim, I.S. Soil salinity mapping utilizing sentinel-2 and neural networks. Indian J. Agric. Res. 2018, 52, 524–529. [Google Scholar] [CrossRef]
- Hoa, P.V.; Giang, N.V.; Binh, N.A.; Hai, L.V.H.; Pham, T.D.; Hasanlou, M.; Bui, D.T. Soil salinity mapping using SAR sentinel-1 data and advanced machine learning algorithms: A case study at ben tre province of the Mekong river delta (Vietnam). Remote Sens. 2019, 11, 128. [Google Scholar] [CrossRef]
- Ding, J.L.; Qu, J.; Sun, Y.M.; Zhang, Y.F. The retrieval model of soil salinization information in arid region based on MSAVI-WI feature space: A case study of the delta oasis in Weigan-Kuqa watershed. Geogr. Res. 2013, 32, 223–232. [Google Scholar]
- Yang, X.; Wu, J.J.; Yan, F.; Zhang, J. Assessment of regional soil moisture status based on characteristics of surface temperature/vegetation index space. Acta Ecol. Sin. 2009, 29, 1205–1216. [Google Scholar] [CrossRef]
- Feng, J.; Jing, J.L.; Wei, W.Y. A Study of soil salinization in Weigan and Kuqa rivers oasis based on Albedo-MSAVI feature space. China Rural Water Hydropower 2018, 2, 147–152. [Google Scholar] [CrossRef]
- Wang, F.; Ding, J.L.; Wu, M.C. Remote sensing monitoring models of soil salinization based on NDVI-SI feature space. Trans. China Soc. Agric. Eng. 2010, 26, 168–173. [Google Scholar] [CrossRef]
- Ha, X.P.; Ding, J.L.; Tiyip, T.; Luo, J.Y.; Zhang, F. SI-Albedo space-based extraction of salinization information in Arid area. Acta Pedol. Sin. 2009, 46, 381–390. [Google Scholar] [CrossRef]
- Ma, C. Quantitative retrieval of soil salt content in the Songnen plain based on HJ1A-HSI images. Arid. Zone Res. 2014, 31, 226–230. [Google Scholar] [CrossRef]
- Ma, C. Quantitative retrieval of soil salt content based on Sentinel-1 dual polarization radar image. Trans. China Soc. Agric. Eng. 2018, 34, 153–158. [Google Scholar] [CrossRef]
- Guo, B.; Yang, F.; Fan, Y.W.; Han, B.M.; Chen, S.T.; Yang, W.N. Dynamic monitoring of soil salinization in yellow river delta utilizing MSAVI–SI feature space models with Landsat images. Environ. Earth Sci. 2019, 78, 1–10. [Google Scholar]
- Li, Y.H.; Ding, J.L.; Sun, Y.M.; Wang, G.; Wang, L. Remote sensing monitoring models of soil salinization based on the three dimensional feature space of MSAVI-WI-SI. Res. Soil Water Conserv. 2015, 22, 113–117. [Google Scholar] [CrossRef]
- Xiao, D.P.; Tao, F.L.; Moiwo, J.P. Research progress on surface Albedo under global change. Adv. Earth Sci. 2011, 26, 1217–1224. [Google Scholar] [CrossRef]
- Liang, S.L. Narrowband to broadband conversions of land surface albedo: Algorithms. Remote Sens. Environ. 2001, 76, 213–238. [Google Scholar] [CrossRef]
- Qi, J.; Chehbouni, A.; Huete, A.R.; Kerr, Y.H.; Sorooshian, S. A modified soil adjusted vegetation index. Remote Sens. Environ. 1994, 48, 119–126. [Google Scholar] [CrossRef]
- Daliakopoulos, I.N.; Tsanis, I.K.; Koutroulis, A.; Kourgialasa, N.N.; Varouchakisa, A.E.; Karatzasa, G.P.; Ritsemac, C.J. The threat of soil salinity: A European scale review. Sci. Total Environ. 2016, 573, 727–739. [Google Scholar] [CrossRef]
- Carlson, T.N.; Ripley, D.A. On the relation between NDVI, fractional vegetation cover, and leaf area index. Remote Sens. Environ. 1997, 62, 241–252. [Google Scholar] [CrossRef]
- Khan, N.M.; Sato, Y. Monitoring hydro-salinity status and its impact in irrigated semi-arid areas using IRS-1B LISS-II data. Asian J. Geoinform. 2001, 1, 63–73. [Google Scholar]
- Sandholt, I.; Rasmussen, K.; Andersen, J. A simple interpretation of the surface temperature/vegetation index space for assessment of surface moisture status. Remote Sens. Environ. 2002, 79, 213–224. [Google Scholar] [CrossRef]
- Wu, Z.P.; Wang, M.X.; Zhao, X. A study on desertification based on desertification difference index in Jinghe watershed. Bull. Soil Water Conserv. 2014, 34, 188–192. [Google Scholar] [CrossRef]
- Lu, R.K. Analytical Methods of Soil Agricultural Chemistry; China Agricultural Science Press: Beijing, China, 2000; ISBN 7-80119-925-1. [Google Scholar]
- Hu, Y.Y.; Wang, R.Y.; Chen, H.Y.; Li, Y.P.; Liu, Y.Q. Research on remote sensing retrieval and temporal variation of soil salinity in the spring and autumn of the yellow river delta. Geomat. Spat. Inform. Technol. 2018, 41, 78–81. [Google Scholar] [CrossRef]
- Wang, Z.R.; Zhao, G.X.; Gao, M.X.; Jiang, S.Q.; Chang, C.Y.; Jia, J.C. Characteristics of soil water and salt spatial variations in the spring season in typical yellow river delta areas of Kenli county. China J. Agric. Resour. Environ. 2015, 32, 154–161. [Google Scholar] [CrossRef]
- Zhang, G.L.; Wu, H.Y. From “problems” to “solutions”: Soil functions for realization of sustainable development goals. Bull. Chin. Acad. Sci. 2018, 33, 124–134. [Google Scholar] [CrossRef]
- Wu, C.H.; Zhao, S.P.; Liu, Q.Q.; Ren, J.Y.; Zhang, Q.G. Engineering forestation model of the yellow river delta region—Taking dongying forestry ecological construction project as an example. J. Anhui Agric. Sci. 2018, 46, 84–87. [Google Scholar] [CrossRef]
- Liu, P.; Wang, X.; Wen, F.; Liu, Y.; Sun, Z.; Zhang, C.; Yan, M.; Fan, L. Development and application of big data platform for “Bohai granary”. Wirel. Pers. Commun. 2018, 103, 275–293. [Google Scholar] [CrossRef]
- Ma, X.; Wu, J.; Xie, Y.; Song, M. Implementation of science and technology demonstration project in Dongying, Shandong province. World Trop. Agric. Inform. 2020, 1, 10–11. [Google Scholar]
- Leng, C.; Zheng, F.; Zhao, B.; Liu, H.; Wang, Y. Advances on alkaline tolerance of rice. Biotechnol. Bull. 2020, 36, 103–111. [Google Scholar]


Publisher’s Note: MDPI stays neutral with regard to jurisdictional claims in published maps and institutional affiliations. |
© 2021 by the authors. Licensee MDPI, Basel, Switzerland. This article is an open access article distributed under the terms and conditions of the Creative Commons Attribution (CC BY) license (http://creativecommons.org/licenses/by/4.0/).