1. Introduction
Livestock genetic diversity is a critical factor to ensure productivity and adaptability of livestock breeds and, therefore, long-term food security. It also has cultural and historical values [
1]. It facilitates adaptation of production systems to changes and challenges and, thus, enhances resilience to climate change [
2]. Animal genetic resources are also an integral part of the livelihoods of people around the world, particularly poor people. Not only is livestock diversity vital to food and nutrition security, it also plays a role in the regulation of ecological functions, landscape management, and the provision of habitats. There are important connections between livestock and the provision of ecosystem services, which change as the diverse roles of livestock evolve, particularly for breeds that are no longer valued for their multiple functions.
Various economic, social, cultural, technical and policy factors are driving livestock-sector trends, affecting the management of animal genetic resources (AnGR) and, in some cases, leading to an erosion of these resources [
3]. Globally, nearly 9000 breeds across a wide range of livestock species have been reported to have existed sometime in history. Seven percent of breeds (i.e., approximately 600 breeds) are classified as extinct [
3]. Conversely, only 10% of all breeds are classified as not at risk, while the status of 59% of breeds is unknown [
3]. The world’s livestock diversity is at risk and there is a critical need for improvements in knowledge and data collection to facilitate better understanding of challenges, threat assessment, and future planning [
2].
In 2007, based on the findings of the first country-driven comprehensive global assessment [
4], the Global Plan of Action for Animal Genetic Resources (Global Plan) [
5] was developed, negotiated under the guidance of the Commission on Genetic Resources for Food and Agriculture and adopted by the Member Nations of the Food and Agriculture Organization of the United Nations (FAO). The Global Plan is a framework for improved management of livestock genetic diversity that features four Strategic Priority Areas (SPA) with 23 Strategic Priorities (SP) grouped under them (
Table 1). The four SPAs are characterization, inventory, and monitoring of trends and associated risks (SPA 1): sustainable use and development (SPA 2); conservation (SPA 3); and policies, institutions and capacity building (SPA 4).
The Global Plan is intended as a rolling plan, with a monitoring system keeping track of progress in its implementation at the national, regional, and global levels [
6]. This system considers both (1) process indicators to describe the extent to which the actions set out in the Global Plan have been implemented and (2) resource indicators to describe the state of animal genetic diversity itself and therefore the overall impact of the Global Plan (number and risk status of breeds reported to the Domestic Animal Diversity Information System (DAD-IS,
http://www.fao.org/dad-is).
Process indicators are based on country report questionnaires sent to FAO by Member Nations that have been developed under the guidance of government-nominated National Coordinators. Since the adoption of the Global Plan, three rounds of reporting have been made in 2012, 2014, and 2019. Previous rounds of reporting have shown a wide variation in terms of AnGR management activities across countries and strategic priorities, from countries where no actions were implemented to countries where some activities have been implemented, either prior to the adoption of the Global Plan or after [
7].
Those indicators contribute to the monitoring of the achievement of the Sustainable Development Goal (SDG) Target 2.5, which aims to, by 2020, maintain the genetic diversity of seeds, cultivated plants, and farmed and domesticated animals and their related wild species, including through soundly managed and diversified seed and plant banks at the national, regional, and international levels; and promote access to fair and equitable sharing of benefits arising from the utilization of genetic resources and associated traditional knowledge, as internationally agreed. Two SDG indicators (2.5.1b and 2.5.2) specifically focus on ex situ and in situ conservation of AnGR. These indicators also contribute to the measurement of progress towards the Aichi Biodiversity Targets 13 (safeguarding genetic diversity of cultivated plants and farmed and domesticated animals) and, to a lesser extent, 4 (sustainable production and consumption with safe ecological limits) and 7 (sustainable management of areas under agriculture, aquaculture and forestry), adopted as part of the Convention on Biological Diversity’s (CBD) Strategic Plan for Biodiversity 2011–2020 [
8].
The aim of this study was to assess the progress in the implementation of the Global Plan since its adoption, focusing on process indicators. Country reports from 2012, 2014, and 2019 were quantitatively assessed, and differences across regions and SPA were explored and discussed in relation to external indicators or resource indicators that measure respective levels of implementation.
2. Material and Methods
The progress reports on the implementation of the Global Plan received from 80 countries in 2012, 128 countries in 2014, and 104 countries in 2019 were collected and analyzed. 145 countries answered at least once (see
Figure S1). Those reports were compiled versions of electronic questionnaires sent in English, French, and Spanish to National Coordinators (see Document S1). The questionnaires comprised multiple-choice and free-response questions that addressed recommended actions for specific SP and were grouped by SPA (see Document S1). Explanations and definitions of terms were included to improve the consistency of responses. Answers to multiple-choice questions were transformed to indicator scores (FAO, 2012) that correspond to three levels of implementation: low (no action undertaken yet) = 0; medium (some action undertaken, but more required) = 1; and high (action completed, either prior to the adoption of the Global Plan or after) = 2.
For the quantitative analysis, a subset of 54 questions relating to direct national implementation (i.e., not related to international collaboration or to the provision or reception of funding to/from another country) was considered. Three questions had data only for 2012 and two questions had data only for 2014 and 2019 (see
Table S1) across the 54 questions: 12 related to SPA1, 15 to SPA2, 11 to SPA3 and 16 to SPA4. To assess the impact of the variation across countries and questions over the three rounds of reporting, the same statistical analysis was conducted with the data set restricted to the 49 questions in common and 60 countries who responded to the questionnaire in 2012, 2014 and 2019.
Indicator scores were analyzed using a linear mixed-effect model (R lme function). Seven regions (Africa, Asia, Europe and the Caucasus, Latin America and the Caribbean, Near and Middle East, North America, Southwest Pacific) [
9] and 4 SPAs were included as explanatory factors. The interaction Year x SPA was included as covariable. The interaction Region x Year was not considered as its inclusion did not improve the Bayesian Information Criterion. Country was added as a random effect. To explore possible consequences of analyzing the categorical indicator scores with a linear model, the data were also analyzed as qualitative variables by using an ordered logistic regression model (R polr function) with the same explanatory factors.
To assess the links between process indicators with general metrics, as well as with resource indicators, the following relationships were assessed: (i) the 2019 scores averaged over all questions and the 2019 Gross Domestic Product (GDP) per capita by countries [
10], (ii) the 2019 scores averaged over SPA1 (characterization, inventory, and monitoring) questions and the proportion of local breeds with unknown risk status [
3], and (iii) the 2019 score related to question 34 (“Does your country have in situ conservation measures in place for locally adapted breeds at risk of extinction and to prevent breeds from becoming at risk?”) and the proportion of local breeds at risk among breeds with known risk status [
3]. In the two first cases, the relationship was assessed with the Pearson correlation coefficient, while for the latter, because the score was based on a single question (with 0, 1 and 2 as values), the means for each level were compared.
3. Results
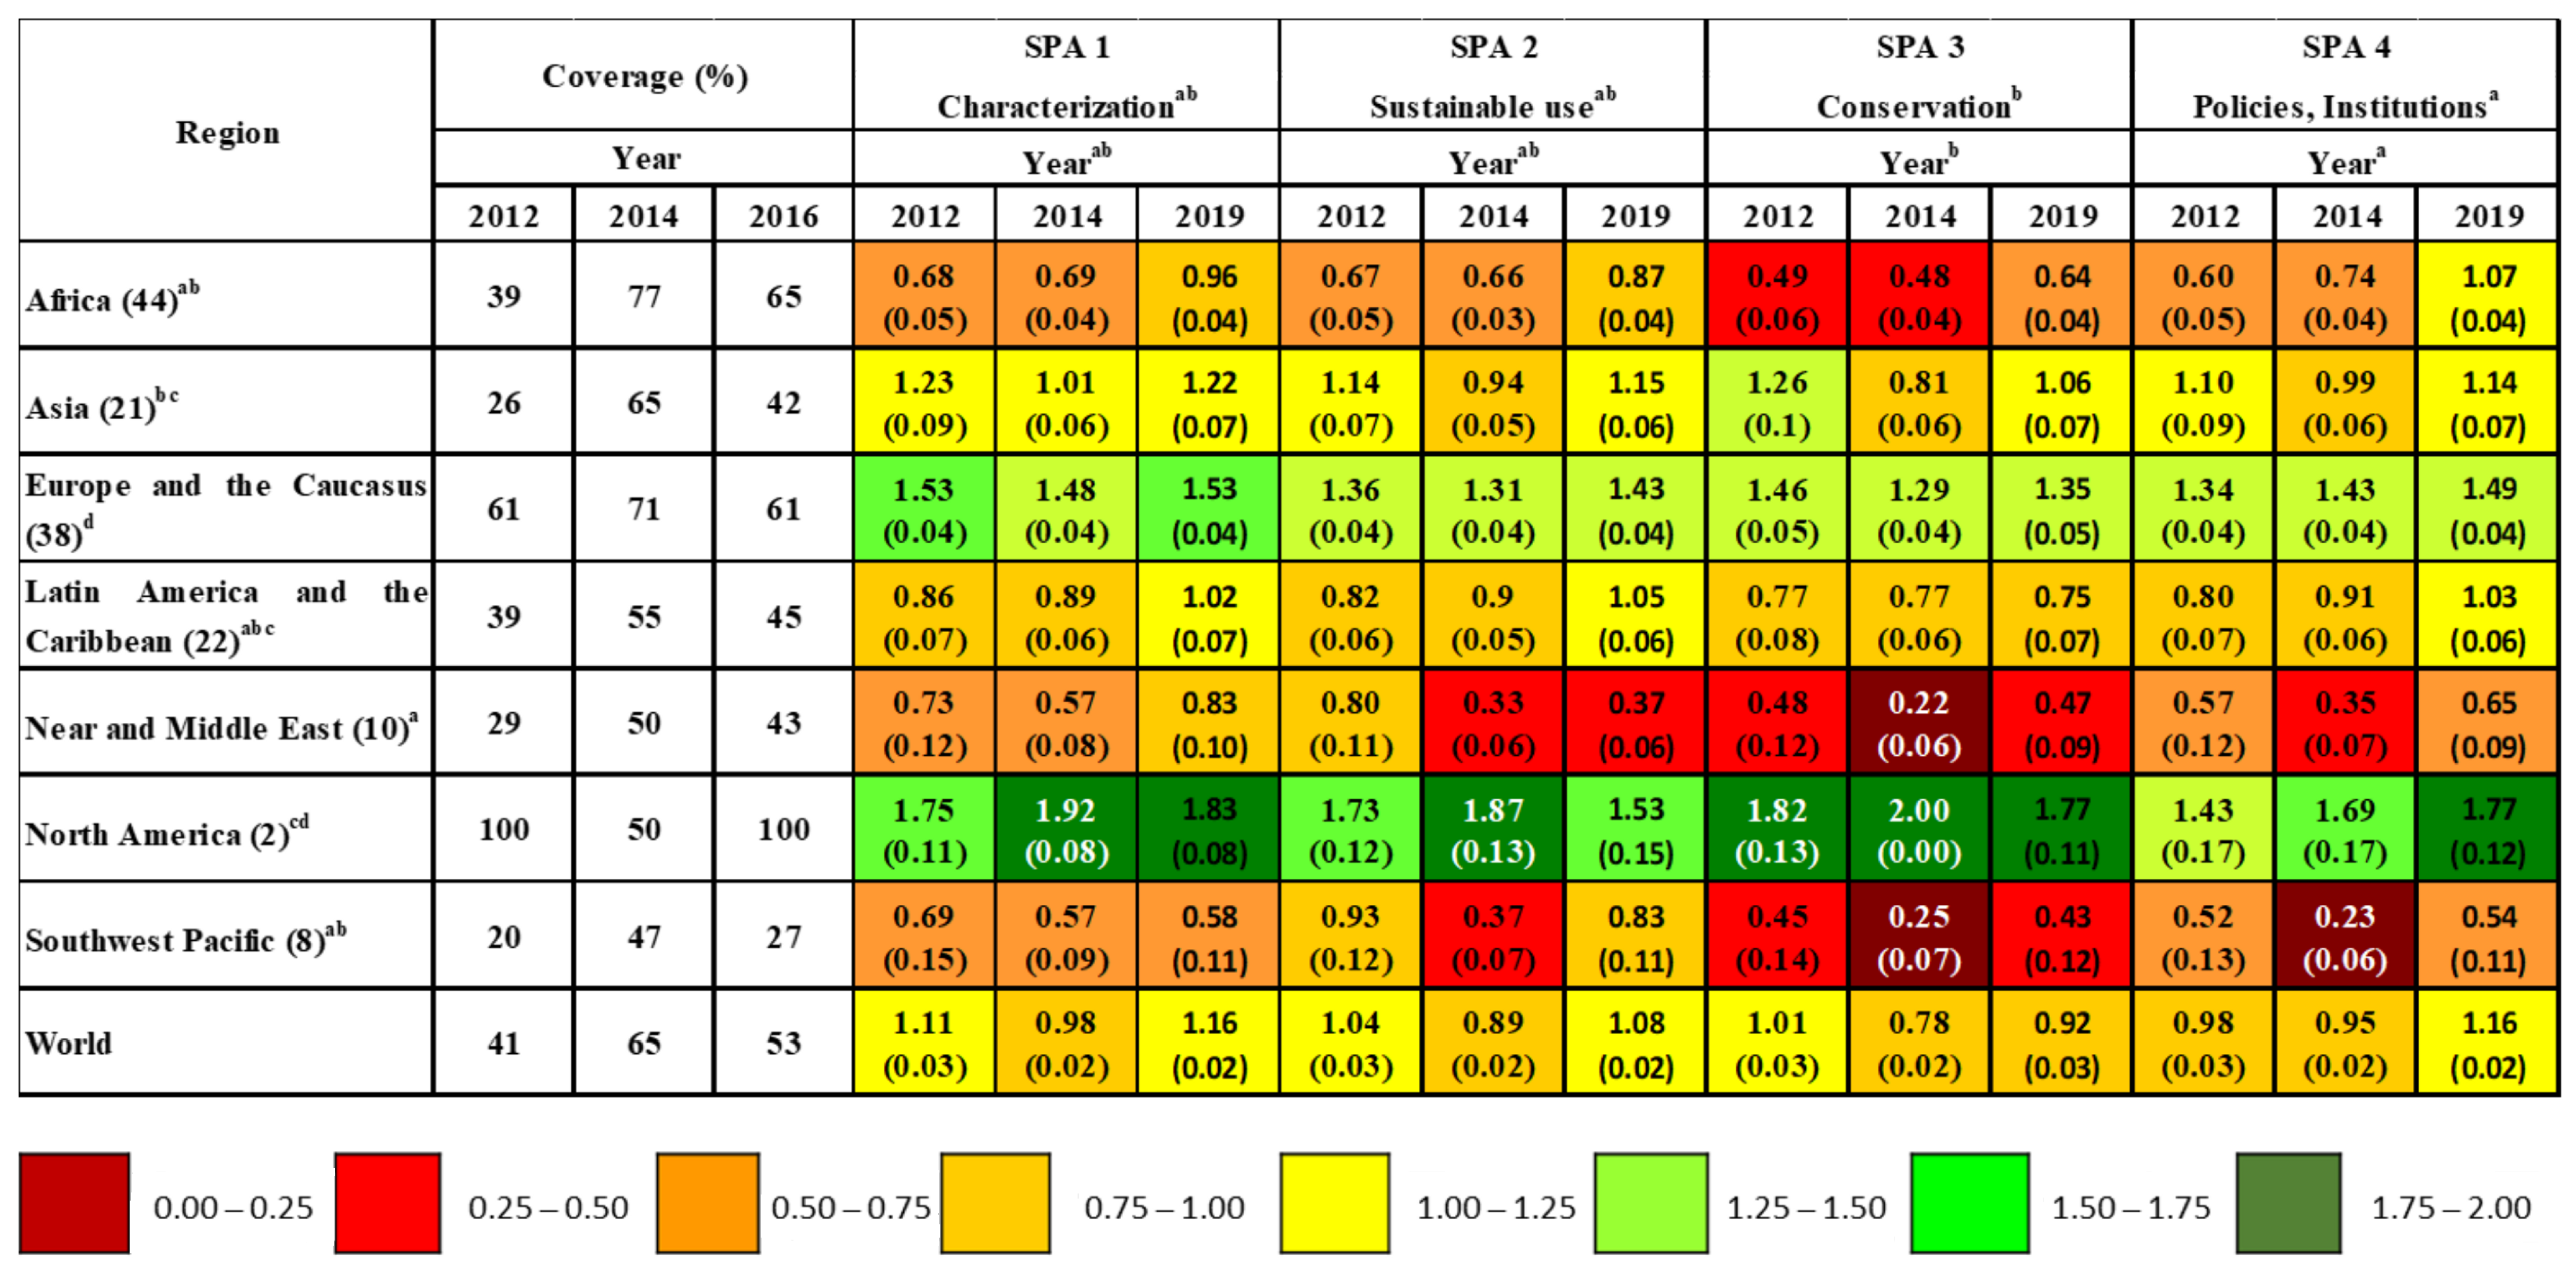
As previously stated, reports were received from 80 countries in 2012 (41% of countries), 128 in 2014 (65%), and 104 in 2019 (53%). Among regions, the country coverage was more complete in Europe and the Caucasus and North America, and less so in Southwest Pacific, Near and Middle East, and Central Asia (see
Figure 1 and
Figure S1). The gap in developing country coverage was greatest in 2012. In 2014 and 2019, the response rate was quite high in the African region (77% and 65% of countries answering respectively) (See
Figure 1).
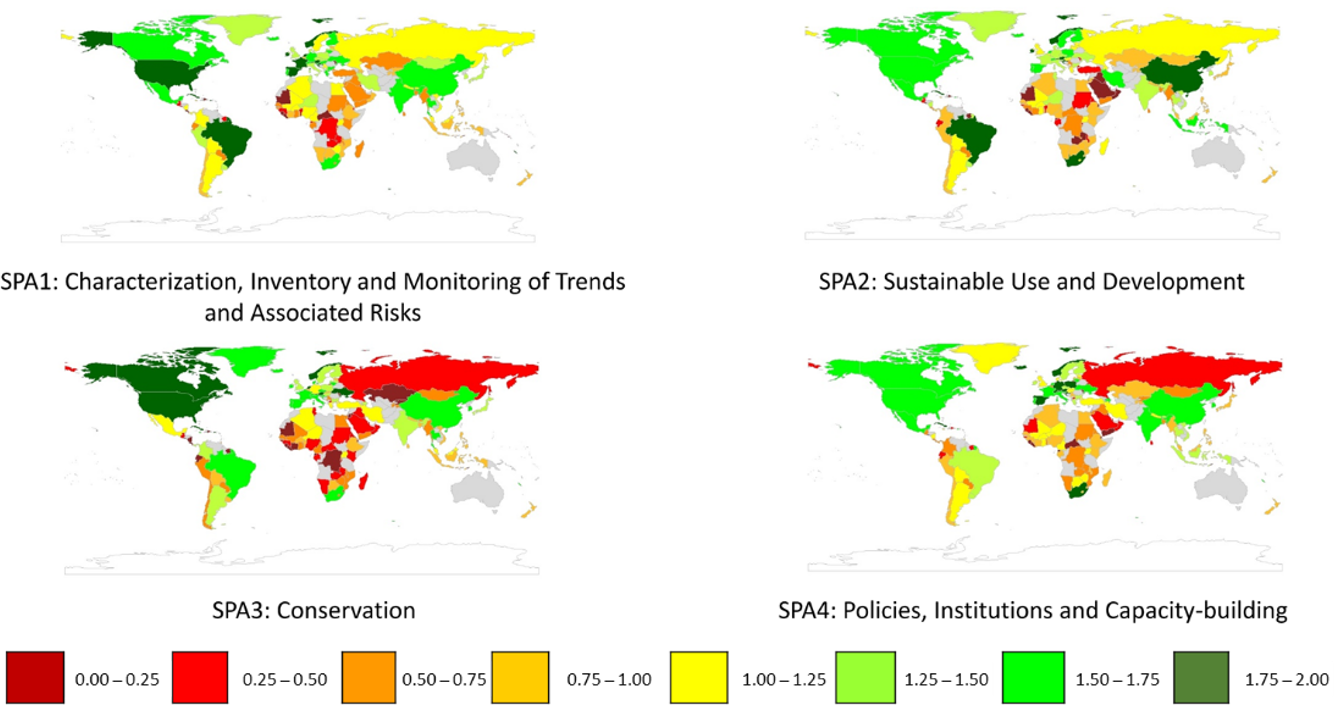
As illustrated by
Figure 1, indicator scores showed a wide variation across SPAs, years, and regions, ranging from a very low level of implementation (≤0.25 for 2014 and SPA3 in Near and Middle East and Southwest Pacific, and for SPA4 for Southwest Pacific) to very high (>1.75 for most SPAs and years for North America). Generally, higher implementation was reported by countries in North America and Europe and the Caucasus, especially when compared to Near and Middle East and Southwest Pacific. Variation in implementation was also observed within regions. For instance, most BRICS countries (Brazil, India, China, and South Africa) and Cuba and Thailand, had implementation scores across years above 1.25 for each SPA (
Figure 2). Countries reporting the lower implementation scores (i.e., <0.4) belonged either to Africa (Djibouti, Gabon, Republic of South Sudan), Latin America (Costa Rica, Suriname), or Near and Middle East (Qatar, Saudi Arabia).
When comparing raw scores across years, lower scores were reported for 2014 for all SPAs, which could be related to some extent to a much higher proportion of reporting countries from developing regions, i.e., with low implementation scores, for this specific round. The 2019 reporting period showed higher average scores for each SPA except SPA3 (conservation), which was lower than in 2012.
According to the model used, regions, SPA, and interaction Year x SPA showed significant impacts on the scores (
Table 2). Each region had a statistically distinct (
p < 0.05 after multiple correction) level of implementation, with the exception of the Near and Middle East and Southwest Pacific regions, which both had low Least square means (LSMean) of around 0.5. Implementation in Africa was slightly greater (LSMean = 0.72) but below the values for Latin America and the Caribbean (0.89) and Asia (1.05). Europe and the Caucasus and North America showed the highest LSMeans, corresponding to medium to high levels of implementation of actions (1.41 and 1.72, respectively).
The overall LSMeans for the four SPAs were close to 1 (medium level of implementation), with SPA3 (conservation) having the lowest value (0.87). Regression coefficients for Year x SPA were positive for all four SPA, indicating increasing implementation over time. However, the coefficient for SPA3 was not significantly different from 0. The largest coefficient was for SPA4 and it was significantly higher than for SPA2 (
p < 0.05) and SPA3 (
p < 0.001). When restricting the data to the 49 questions and 60 countries common to the three reporting periods, the mean indicator score was 1.15 versus about 1.0 for all countries and questions. This result illustrates that countries reporting a higher level of implementation also reported more frequently. When considering a statistical analysis of this restricted dataset (see
Table S2), trends among the model factors were similar to the complete dataset. Similarly, when indicator scores were analyzed as qualitative variables using an ordered logistic regression model (complete data set) similar trends were observed with significant differences (
p < 0.05) among levels for each factor (see
Table S3).
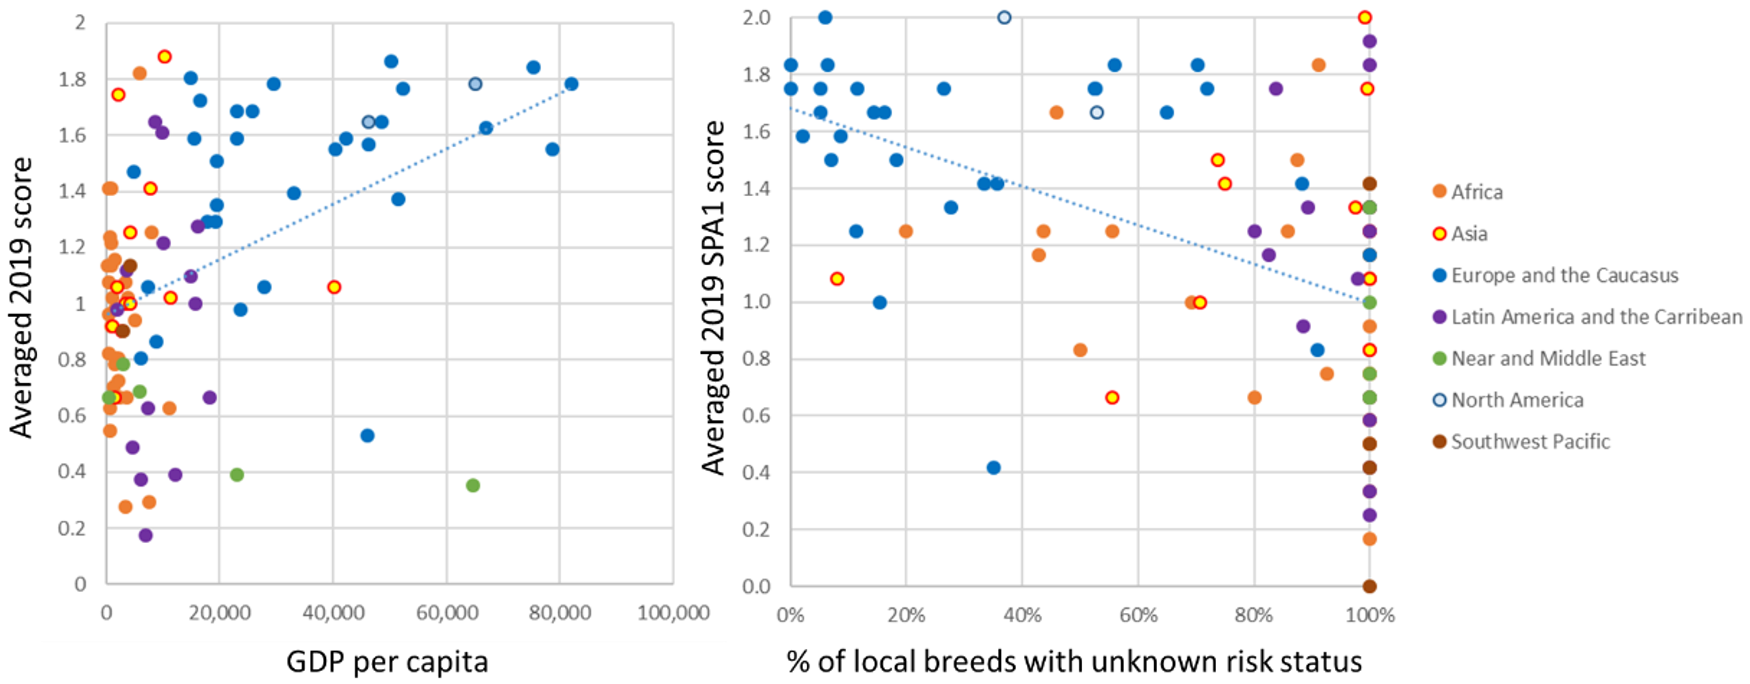
As illustrated by
Figure 3, the overall mean implementation score in 2019 and the GDP per capita were positively correlated (r = 45.6%,
p < 0.001, 97 countries considered). Moreover, the correlation between mean implementation score for SPA1 (characterization) and the proportion of local breeds with unknown population status reported by countries (r = −49.6%,
p < 0.001, 100 countries considered) was significant, but in the negative direction. Differences across regions reveal strong intercorrelations with variables, with for instance countries from Europe and the Caucasus as well as North America generally characterized by high GDP and high implementation score. Nevertheless, countries from Near and Middle East were found below the regression line, indicating low level of implementation independent from high GDP per capita. Forty-four out of 100 countries had unknown risk status for 100 percent of their local breeds, meaning that they have not provided any population updates to DAD-IS during the last 10 years. This included the five countries from Near and Middle East and four countries from Southwest Pacific.
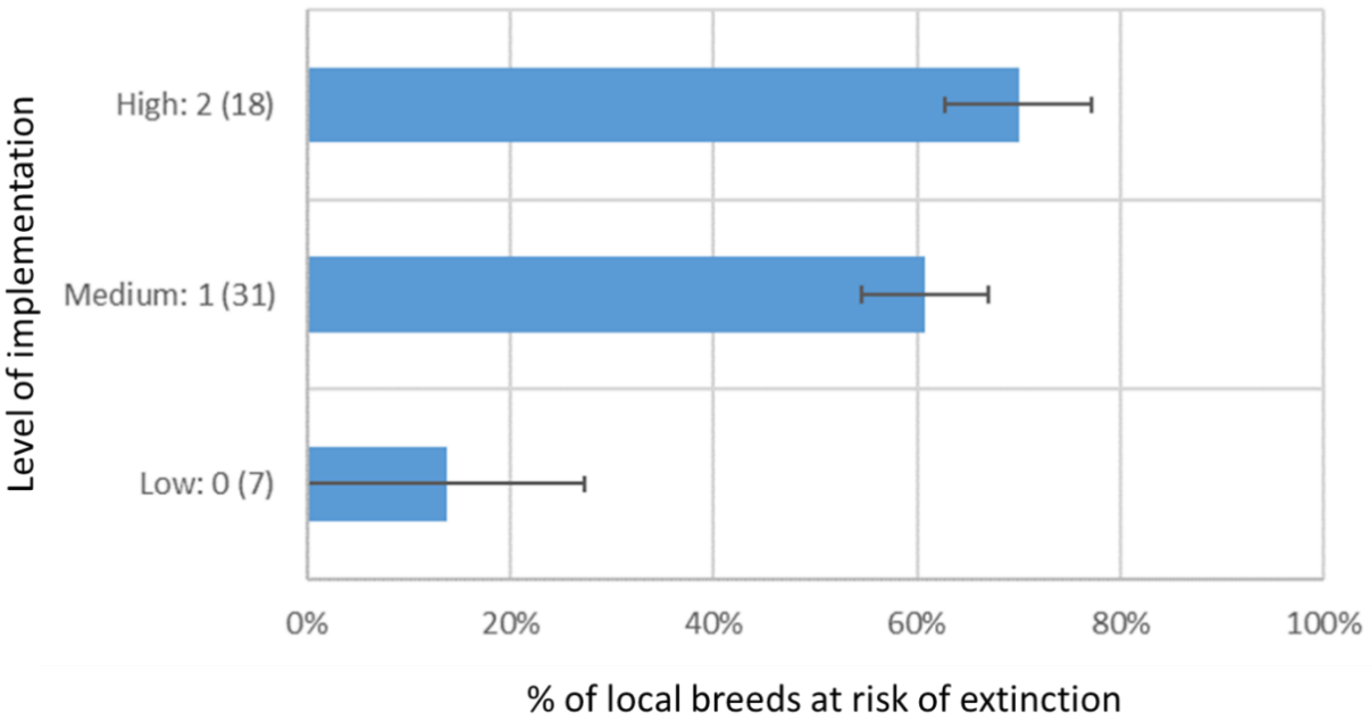
Figure 4 shows the relationship between the implementation of Global Plan SP related to in situ conservation and the proportion of local breeds at risk. These data included only the 56 countries that have at least one local breed with known status. In general, countries reporting medium or high levels of implementation for in situ conservation measures also reported higher proportions of breeds at risk.
4. Discussion
The Global Plan is intended to be an effective framework to guide countries in the sustainable management of AnGR, with a monitoring system to track progress in its implementation at multiple levels. This study offers an appraisal of the progress made since its adoption, according to the three rounds of reporting having occurred since 2012. To assess the progress in an objective manner, it was important to consider the changes in questions and the countries involved in the different rounds of reporting. For instance, in the 2014 round, the country reporting process for
The Second Report on the State of the World’s Animal Genetic Resources for Food and Agriculture [
2] resulted in a much higher response rate from regions such as Africa (where three preparatory regional workshops were organized) when compared to the previous round. This increase in participation from developing countries may also explain the lower mean scores found for the 2014 round.
As underlined by Scherf and Baumung [
7], reports and process indicators reflect the judgment of National Coordinators and their advisory committees. Those judgements may be impacted by changes in national policies or the subjective opinions of those involved in the reporting. This needs to be taken into account when comparing results between countries or even within countries over time, as changes in personnel may affect the consistency of the results. However, this does not mean process indicators may not be useful in comparing countries or underlining specific areas of AnGR management that require interventions from policy makers. Moreover, in a previous analysis [
11] of the 2014 survey (which included questions related to
The Second Report on the State of the World’s Animal Genetic Resources for Food and Agriculture), it was underlined that the extent of activities reported by National Coordinators were largely correlated with external indicators of economic and agricultural development, such as the number of researchers in agricultural sciences per inhabitant or national GDP.
Our results illustrate clear differences in the implementation of the Global Plan across countries and regions. In agreement with Leroy et al. [
11], results from the 2019 round show that in general, countries with higher GDP per capita report higher scores regarding Global Plan implementation. Countries reporting high scores but relatively low GDP per capita were almost systematically BRICS countries (specifically Brazil, China, India and South Africa) having made significant investment in livestock production in recent years to meet rising consumer demand [
12]. By contrast, some Near and Middle East countries with relatively high GDP per capita (Qatar and Saudi Arabia) reported very low scores in Global Plan implementation, which is possibly in relation to their relatively small livestock sectors and thus lack of emphasis on livestock production in country policies.
In terms of trends across the three reporting years, statistically significant progress was achieved in three of the four SPAs of the Global Plan, except the increase in SPA3 (conservation), which was not significantly different from 0. The greatest progress was found in relation to SPA4 (policies, institutions, and capacity-building). This result is logical, considering that proper implementation of characterization and monitoring and sustainable use and conservation programmes can only occur when supporting institutions and technical capacity have been established and are guided by sound policies. Particularly high progress was reported for SPA4 by countries in the region of Africa (see
Figure 1), which could be related to the implementation of projects dedicated to the management of AnGR at regional level [
13], or to the development of national strategies considering AnGR issues, such as the Livestock Master Plans developed by countries including Ethiopia [
14], Rwanda [
15], and Tanzania [
16]. The lack of progress regarding SPA3 was observed in all regions except Africa. Examining the details of questions for individual Strategic Priorities, a decrease of mean implementation score was only observed for the question related to SP8 (establish or strengthen in situ conservation programmes) (data not shown), underlining the challenge of implementing efficient strategies for the maintenance of breeds at risk.
The analysis of the relation between process and resource indicators provide interesting insights about how the situation of AnGR is related to capacities and priorities within countries. As illustrated by
Figure 3, the negative relationship between reporting in DAD-IS and implementation score for strategic priorities related to characterization (SPA1) shows that countries which put a lot of emphasis on activities related to inventory, characterization (phenotypic and molecular) and monitoring are logically the ones with a better knowledge of the demographic risk status of their breeds. On the contrary, it appears that countries reporting higher implementation of in situ conservation measures were also the ones indicating higher proportions of breeds at risk. This contrast may be a question of possible causes and effects. Several plausible explanations can be proposed, such as, (i) countries that have few breeds at risk have little need for conservation programmes; (ii) countries that report few at-risk breeds may do so because of poor capacity for breed monitoring—such countries are also likely to have little capacity for operation of conservation programmes; (iii) developed countries, which have the greater capacities to implement conservation measures, are also the ones with the most intensified livestock production systems, which have led over the last decades to a replacement of local breeds by exotic breeds; and (iv) conservation measures have limited efficiency in increasing population size against driving factors such as the lack of competitiveness and profitability of local breeds. This does not mean that conservation measures are useless, as some measures such as financial incentives for sustaining breeds at risk have been proven to effectively contribute to maintaining breed population sizes [
17]. Moreover, conservation measures are not only about the management of demographic parameters, they must also consider factors such as the evolution of genetic variability, maintenance of commercial and non-commercial uses [
18], and the continuity of a cohesive and collective dynamics of breeders [
19].
Despite the general progress reported in terms of activities related to the Global Plan, much remains to be done. In theory, full implementation of the GPA in all countries would yield an average indicator of 2.0, whereas the current global mean is only around 1.1, suggesting that GPA implementation is only about half completed. Moreover, this result pertains only to the countries that have reported on GPA implementation. Considering the positive relationship observed between implementation and reporting, the true level of implementation globally is probably even less. The progress towards the two SDG indicators related to target 2.5 also remains minimal. Out of 7708 local breeds (including extinct breeds), 639 are reported to have genetic material stored, out of which 193 are reported with sufficient material stored to allow them to be reconstituted (indicator 2.5.1b) [
20]. Moreover, 61% of local breeds (excluding extinct breeds) remain of unknown risk status, and among those of known status, 74% are considered to be at risk of extinction (indicator 2.5.2).
The Global Plan constitutes a valuable framework for planning and monitoring interventions at different levels of the management of AnGR [
21]. Local AnGR contribute in many ways to the livelihoods of their keepers and to the communities to which those keepers belong, and the diversity of these AnGR helps ensure their long-term sustainability. In that context, the recognition of the contribution of AnGR and their production systems to ecosystem services has been increasing in recent years and in some cases supported through financial incentives, especially in Europe [
22]. Development initiatives targeting the economic viability of breeds can support their conservation, even if some aspects of development actions may induce tensions with conservation [
23]. Therefore, continual efforts need to be emphasized, especially through the development of approaches to conservation through sustainable use and development that support the economic viability of local AnGR. Examples include the assessment of the water footprint of animal productions [
24] and new or enhanced marketing opportunities (e.g., quality labels) that offer products of local breeds raised in specific agroecosystems or recognition of the environmental services offered by those agroecosystems.


