Examining the Dynamics and Determinants of Energy Consumption in China’s Megacity Based on Industrial and Residential Perspectives
Abstract
:1. Introduction
2. Methodology and Data Collection
2.1. City-Level Total Energy Consumption Accounting
2.2. Extended LMDI Method Based on the Kaya Identity
2.3. Data Sources
3. Empirical Analysis in Suzhou
3.1. Analysis of the Economic Growth Process in Suzhou
3.2. Total Energy Consumption and the Trends of Structural Changes in Energy Consumption in Suzhou
3.3. Analysis of the Driving Factors of Change in Total Energy Consumption in Suzhou
3.3.1. Population–Economy–Technology Decomposition of total Energy Consumption in Suzhou
3.3.2. Population–Economy–Technology–Structure Decomposition of Total Energy Consumption in Suzhou
4. Discussion and Conclusions
4.1. Discussion
4.2. Conclusions
- (1)
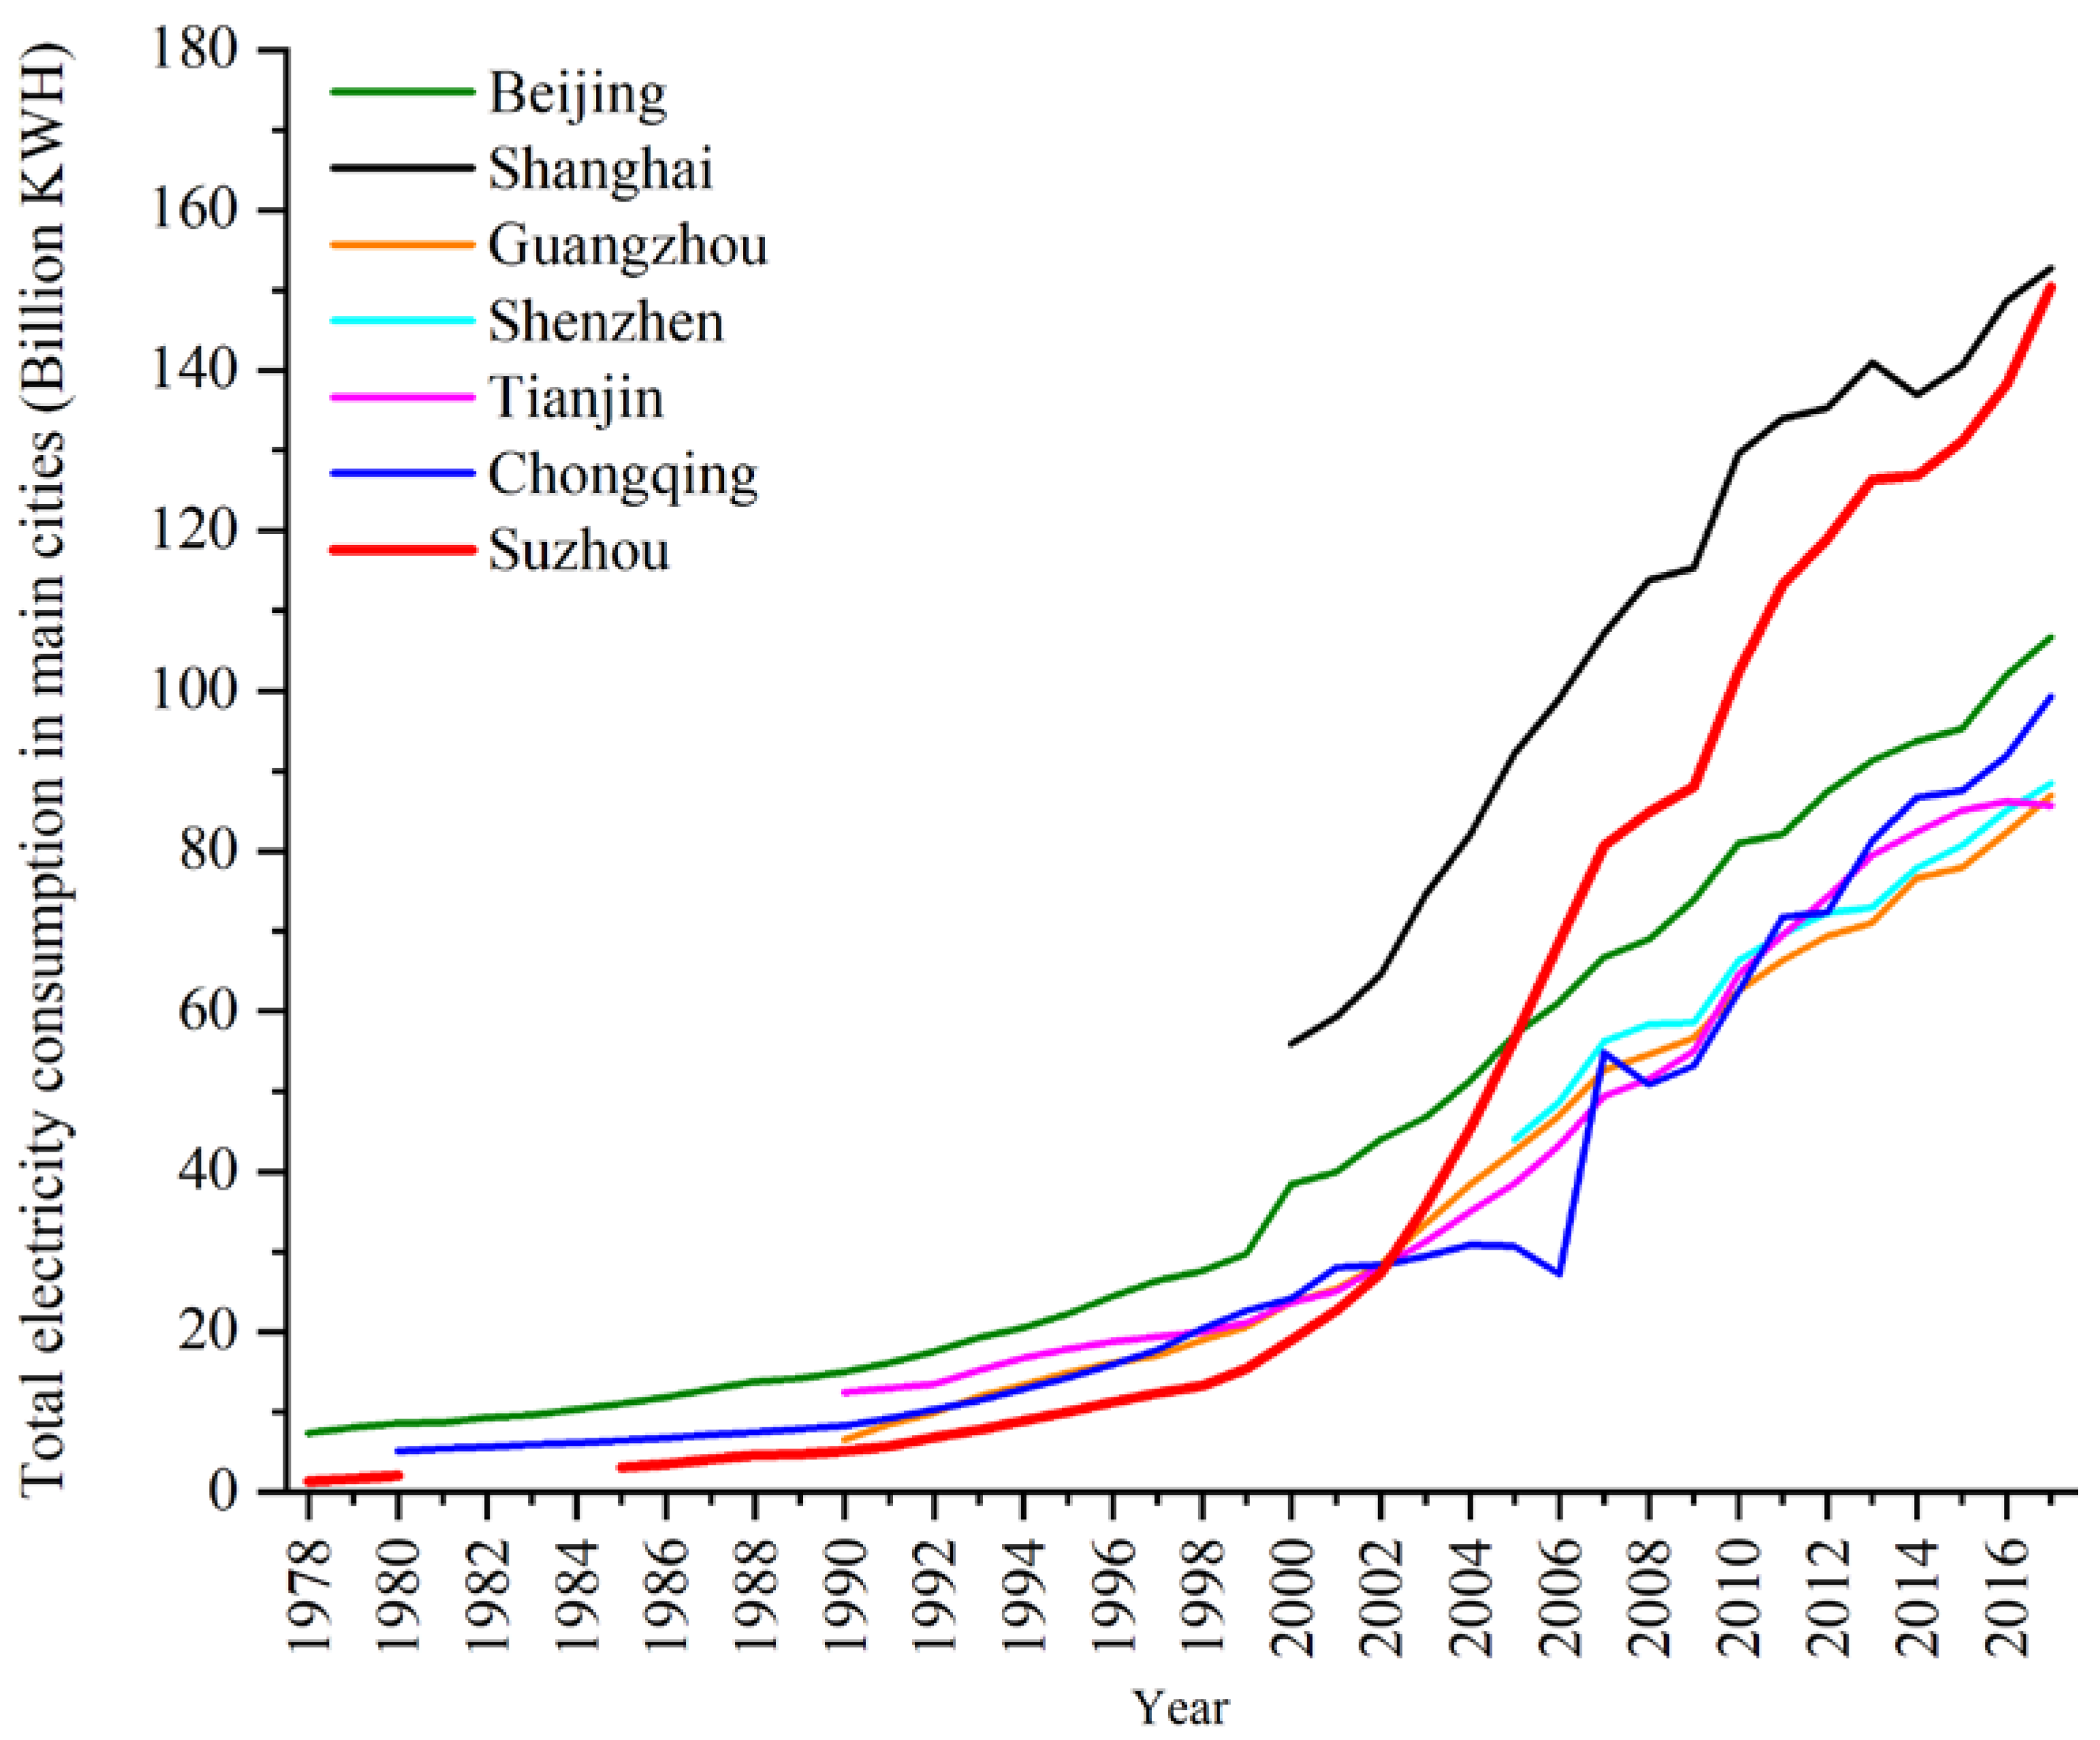
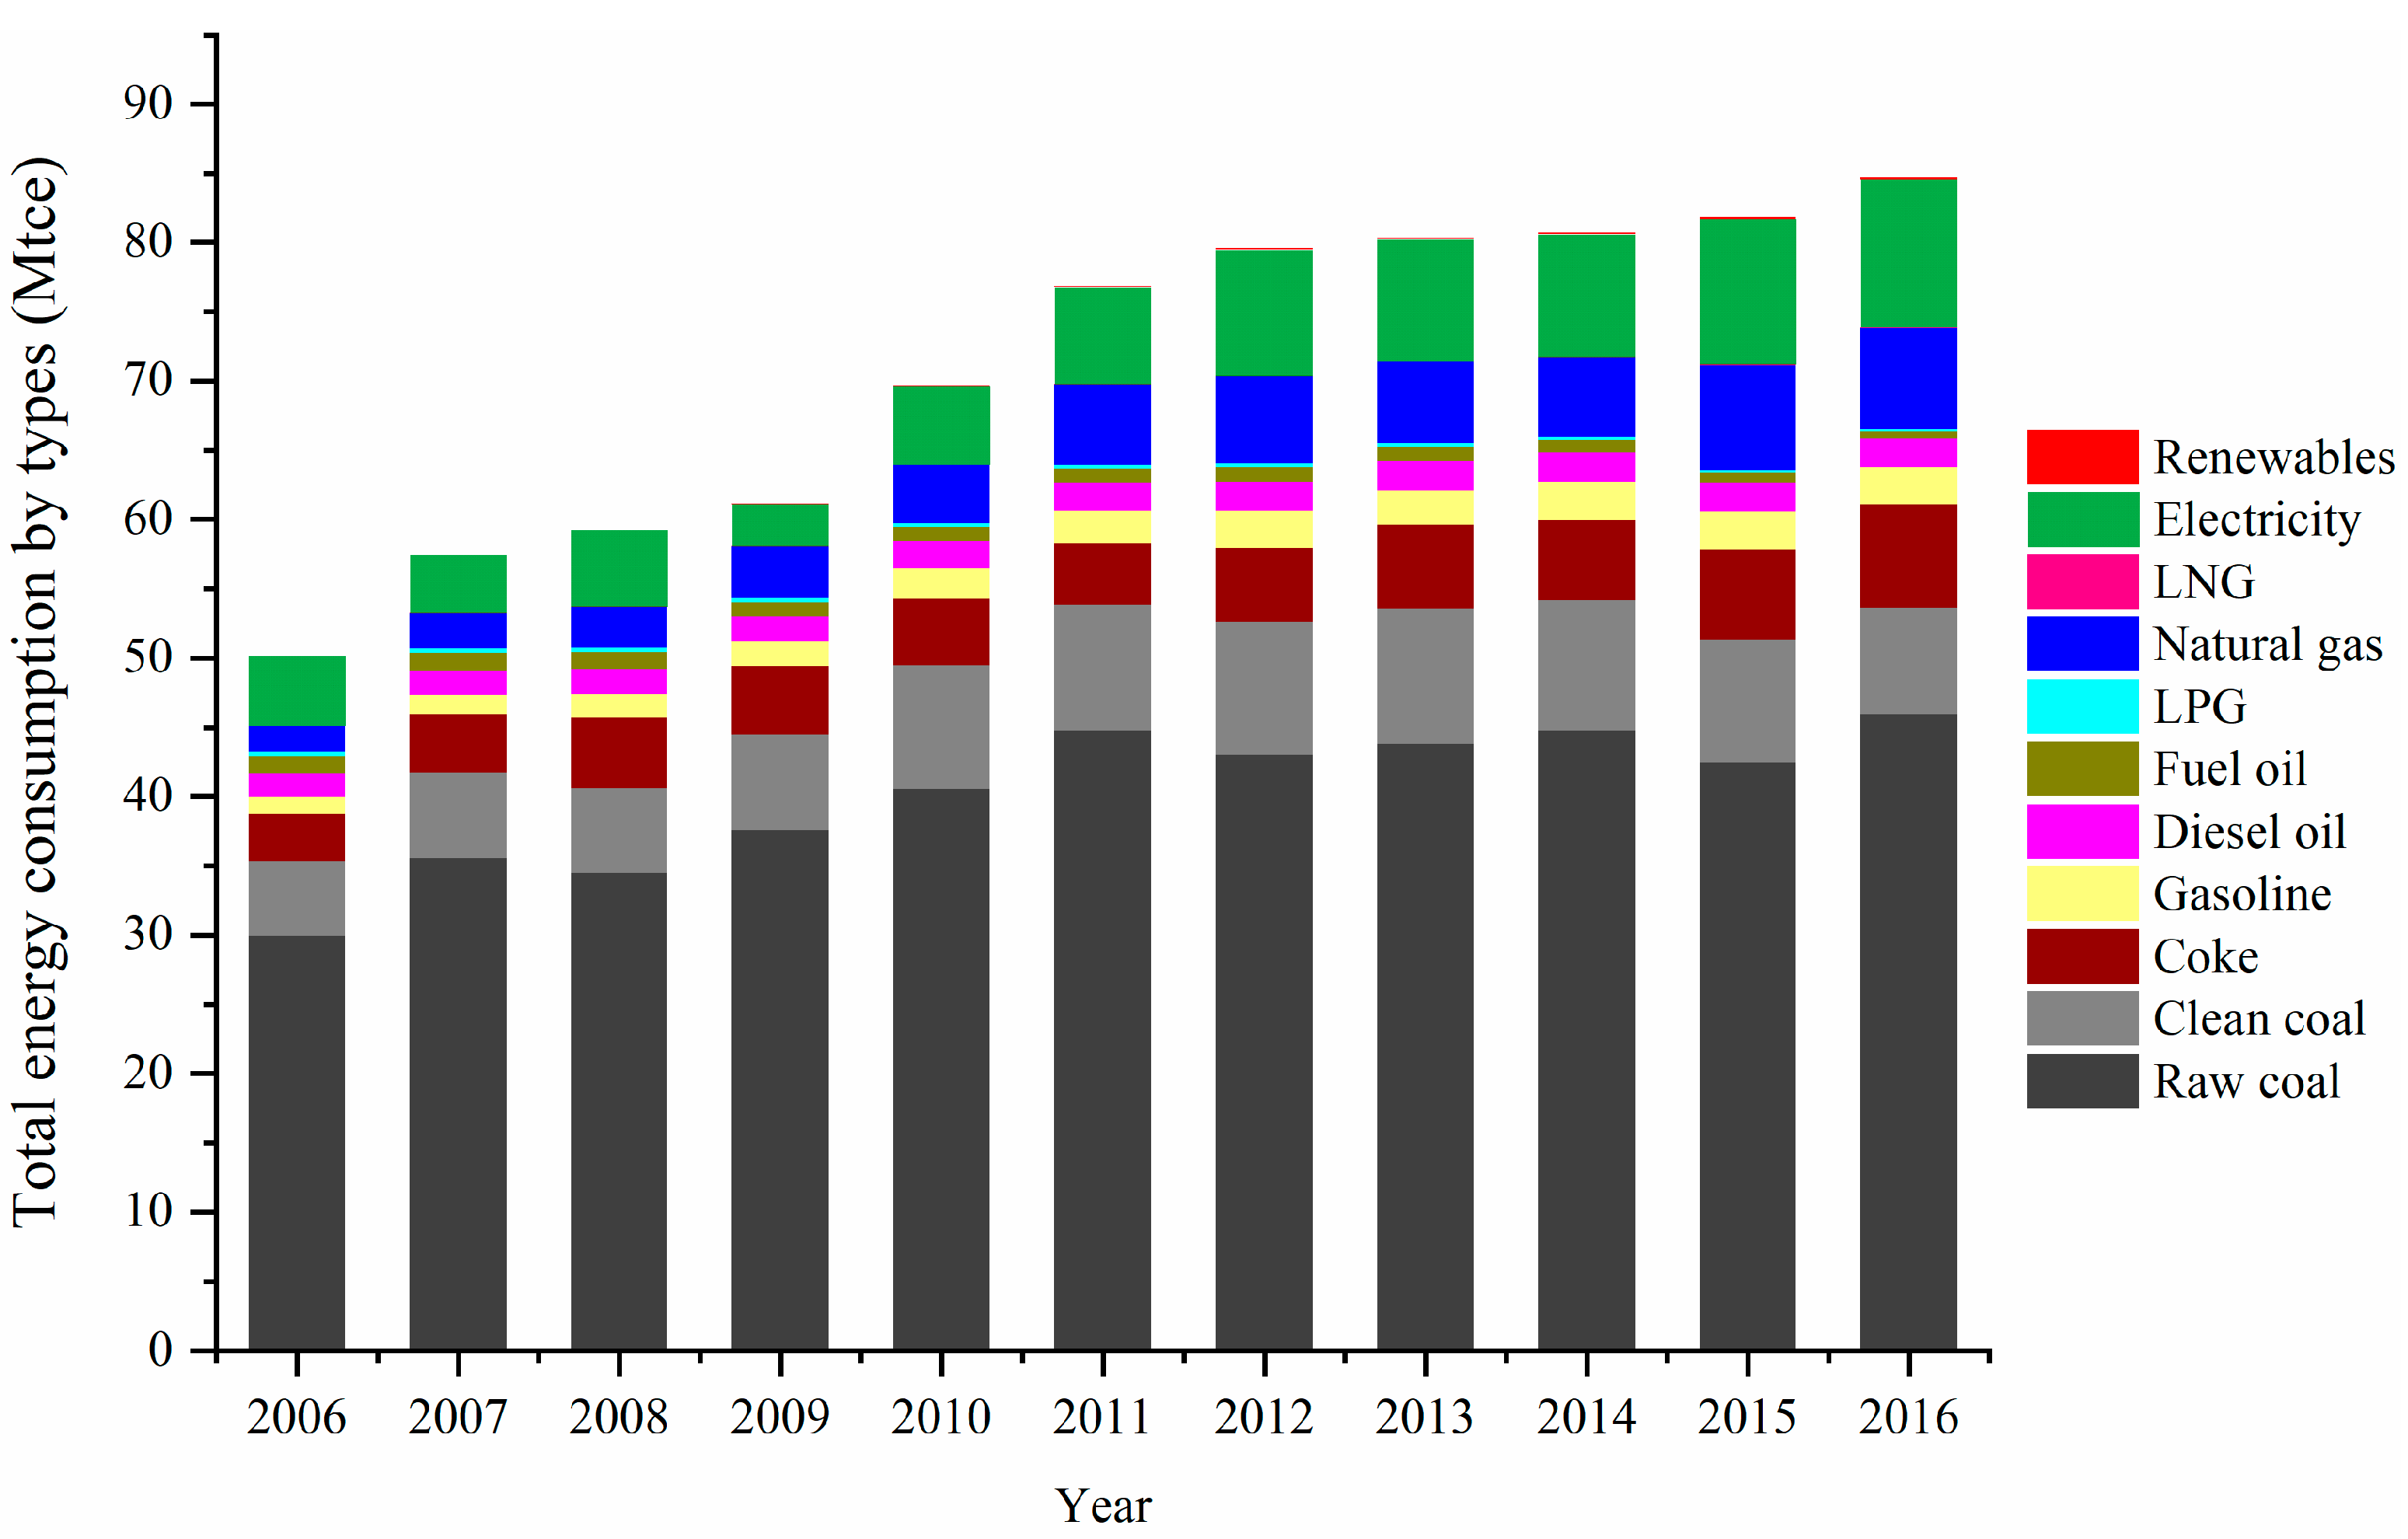
- The total energy consumption of Suzhou presented an overall increasing trend, with 2006–2012 as a rapid growth stage and 2013–2016 as a moderate growth stage. The energy structure of Suzhou consistently had mainly coal-based properties, with diversification and mutual supplementation by natural gas, petroleum, electricity, and others. Moreover, the effect of outsourced electricity on the optimization of the energy consumption structure in Suzhou was significant.
- (2)
- The energy consumption in Suzhou was mainly focused on the industry, but the proportion of energy consumption by the industry decreased to 80.57% in 2016. The proportion of energy consumption by the industry in Suzhou was comparatively high mainly because its industrial structure has been upgraded relatively slowly. Energy consumption by residents accounted for a comparatively small proportion in the study period but presented a comparatively rapid increasing trend with the increase of urbanization.
- (3)
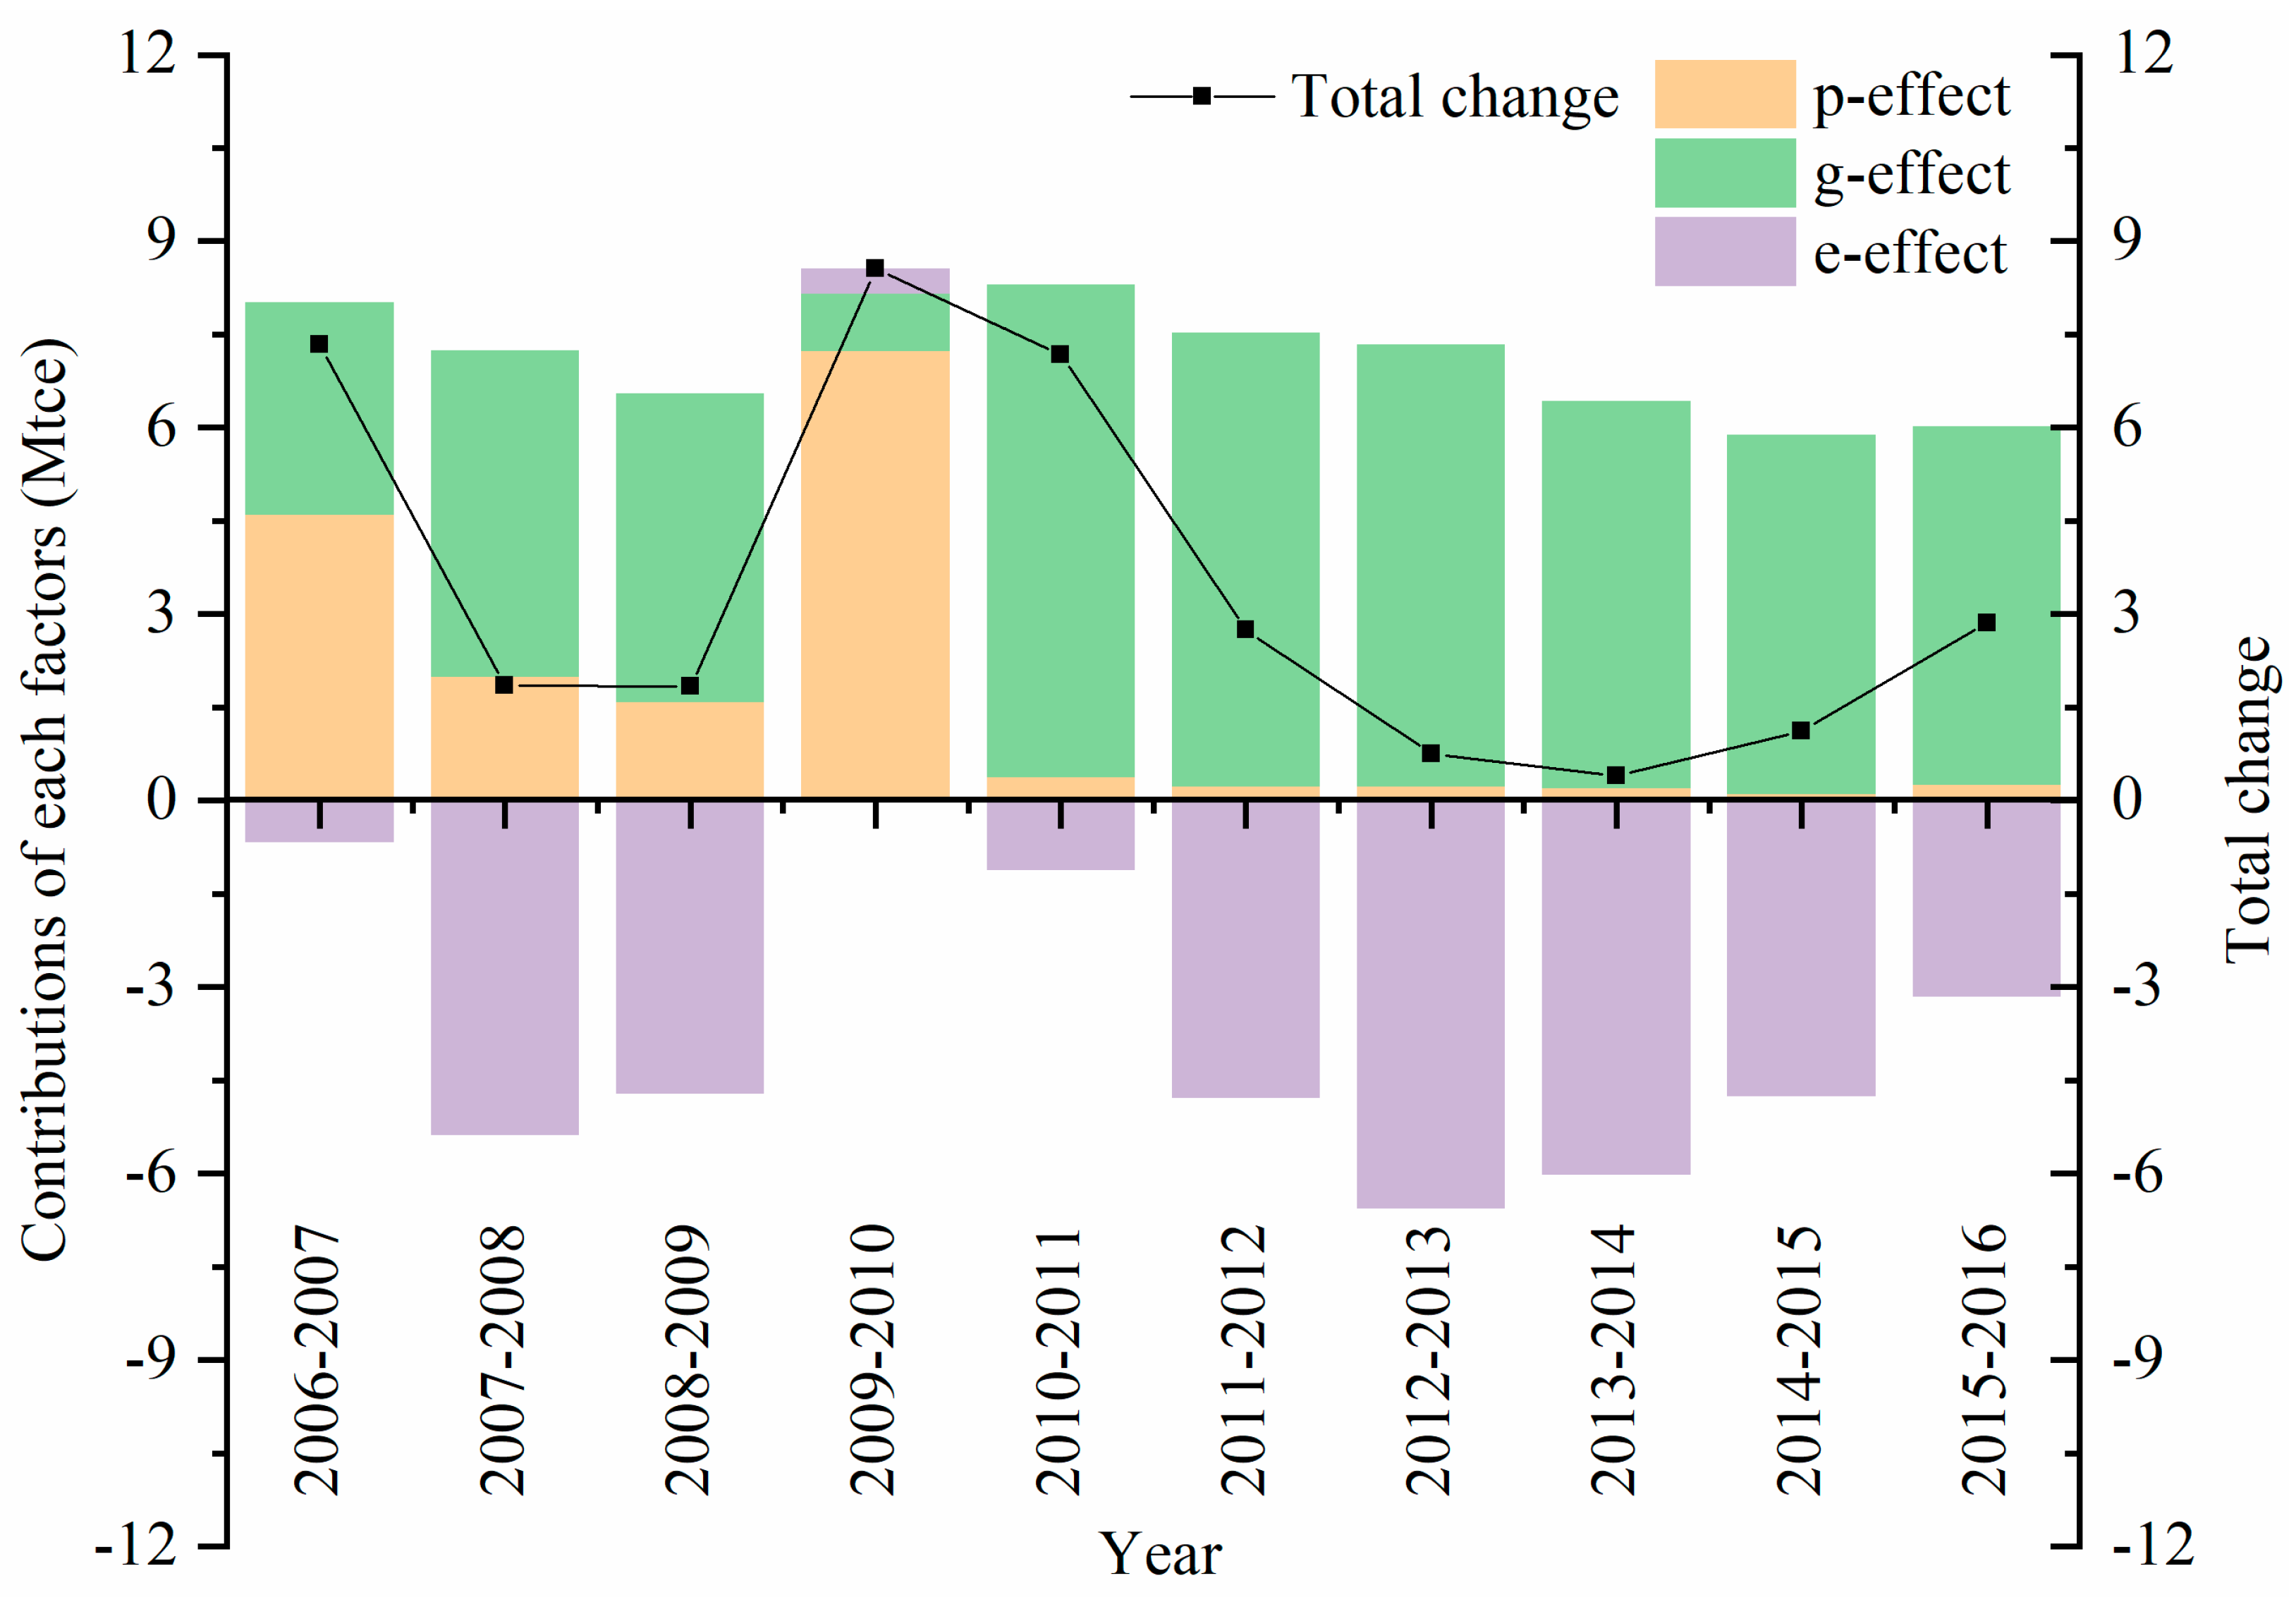
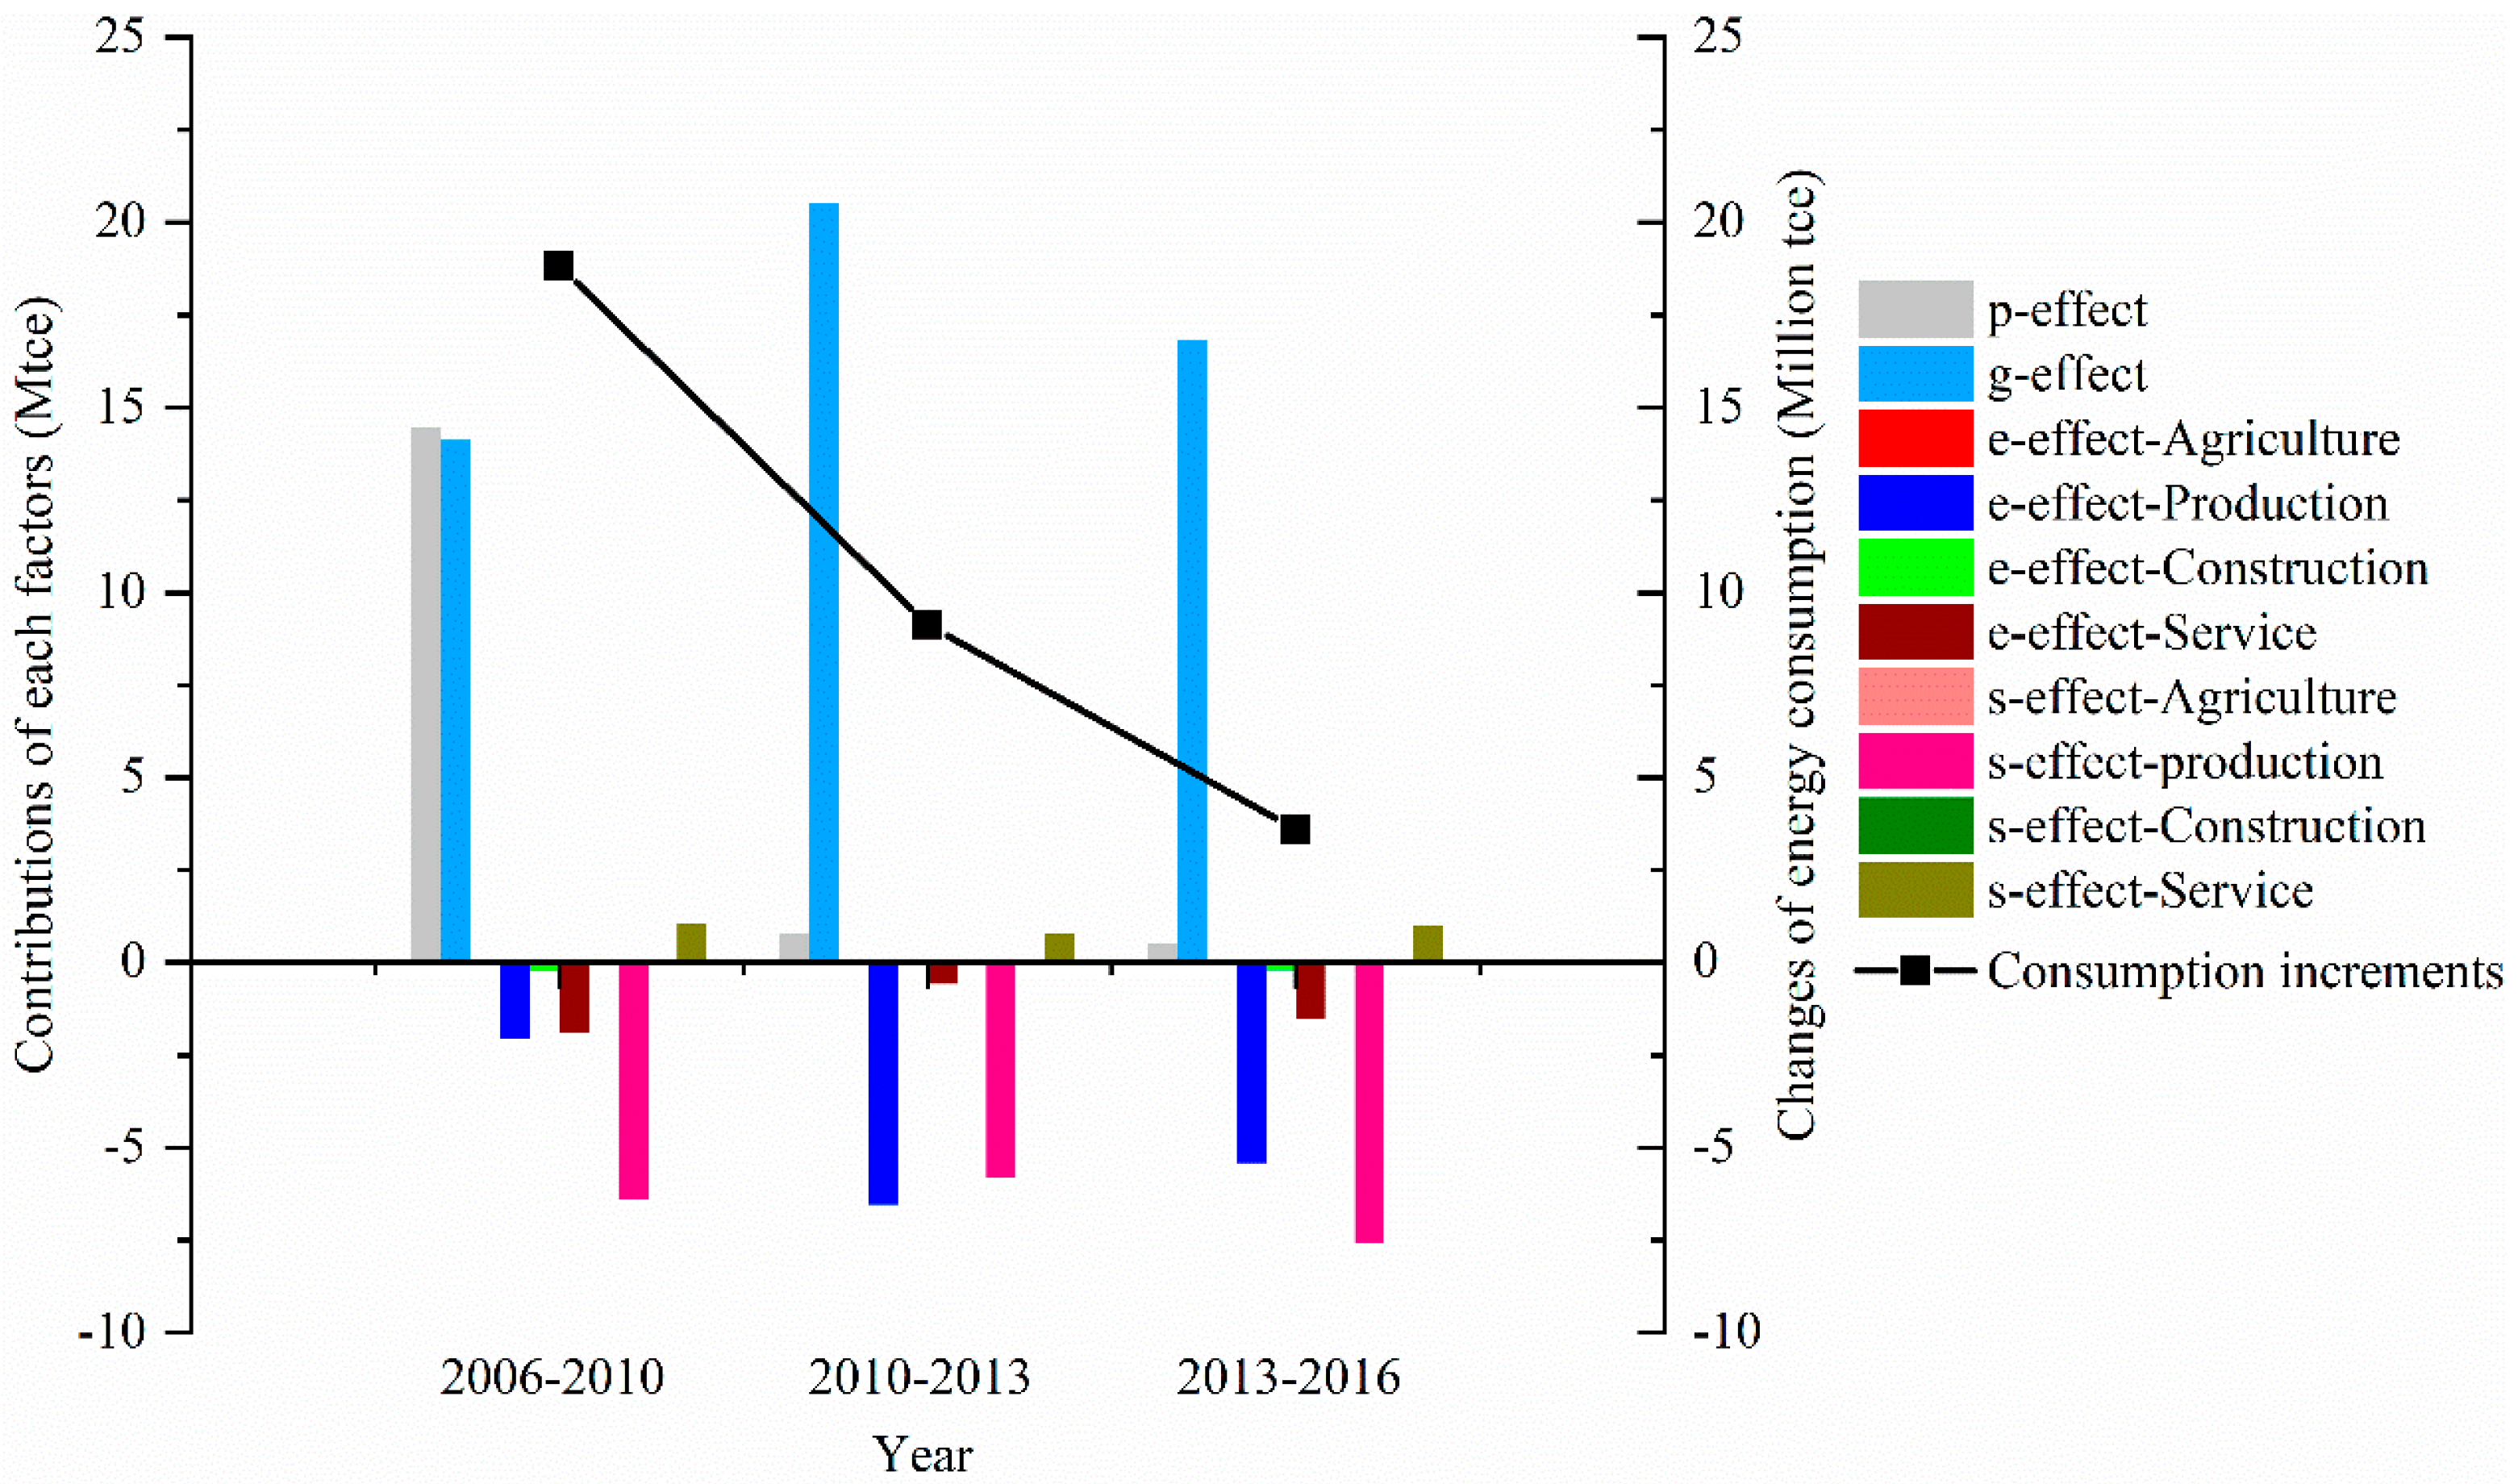
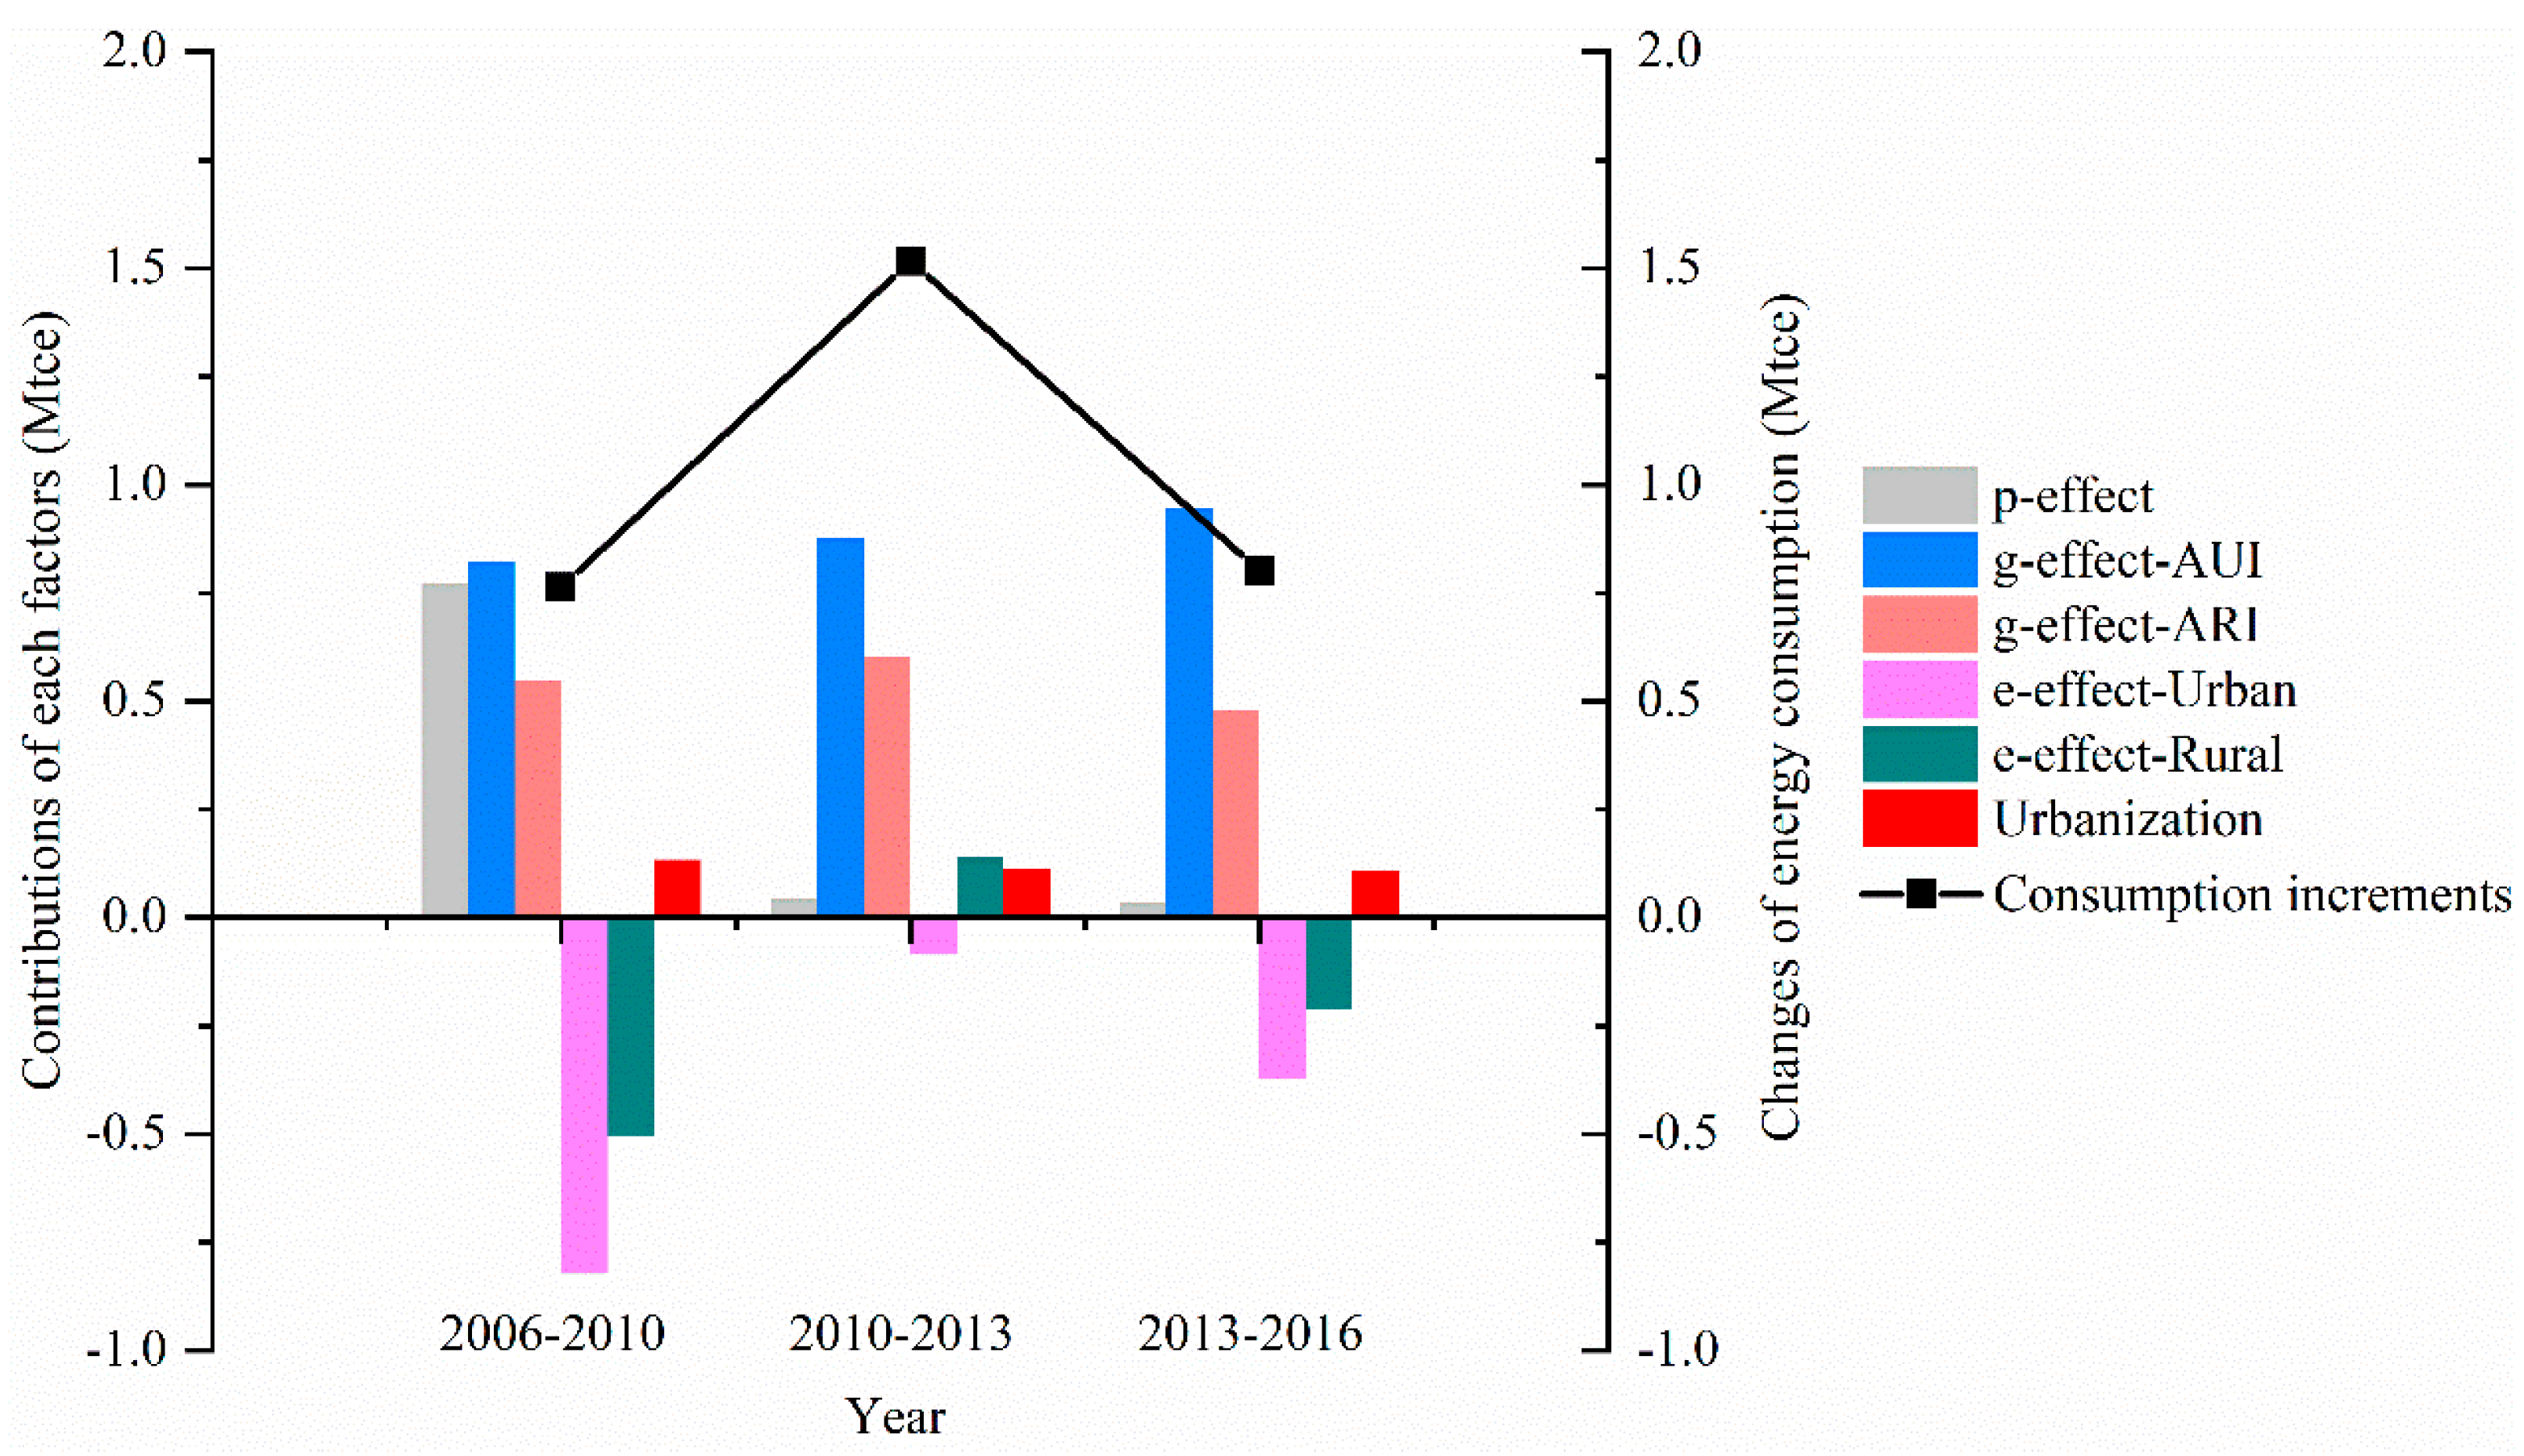
- The study finds significant differences in the effects of different influencing factors on energy consumption under certain developmental measures and policy environments in different stages of development. Scale-related factors have dominated changes in energy consumption, and structural and technological factors have had profound effects on energy consumption in different development periods. Population size and economic output were the main drivers for increments in industrial energy consumption, whereas energy intensity and economic structure performed the important curbing effects. The income effect of urban residents was the biggest driver behind the increase in residential energy consumption, whereas energy intensity was the main limiter.
Author Contributions
Funding
Institutional Review Board Statement
Informed Consent Statement
Data Availability Statement
Conflicts of Interest
References
- Nerini, F.F.; Tomei, J.; To, L.S.; Bisaga, I.; Parikh, P.; Black, M.; Borrion, A.; Spataru, C.; Broto, V.C.; Anandarajah, G.; et al. Mapping synergies and trade-offs between energy and the Sustainable Development Goals. Nat. Energy 2018, 3, 10–15. [Google Scholar] [CrossRef] [Green Version]
- Wang, C.; Wang, F.; Du, H.; Zhang, X. Is China really ready for shale gas revolution—Re-evaluating shale gas challenges. Environ. Sci. Policy 2014, 39, 49–55. [Google Scholar] [CrossRef]
- Chu, S.; Majumdar, A. Opportunities and challenges for a sustainable energy future. Nat. Cell Biol. 2012, 488, 294–303. [Google Scholar] [CrossRef] [PubMed]
- Wang, C.; Wang, F.; Li, L.; Zhang, X. Wake-up Call for China to Re-Evaluate Its Shale-Gas Ambition. Environ. Sci. Technol. 2013, 47, 11920–11921. [Google Scholar] [CrossRef]
- Zeng, N.; Ding, Y.; Pan, J.; Wang, H.; Gregg, J. Climate change—The Chinese challenge. Science 2008, 319, 730–731. [Google Scholar] [CrossRef]
- BP, Statistical Review of World Energy. 2019. Available online: https://www.bp.com/en/global/corporate/energy-economics/statistical-review-of-world-energy.html (accessed on 14 November 2020).
- Liu, J.; Diamond, J. China’s environment in a globalizing world. Nature 2005, 435, 1179–1186. [Google Scholar] [CrossRef]
- Fu, B.; Zhuang, X.-L.; Jiang, G.-B.; Shi, J.-B.; Lu, A.Y.-H. FEATURE: Environmental Problems and Challenges in China. Environ. Sci. Technol. 2007, 41, 7597–7602. [Google Scholar] [CrossRef] [PubMed] [Green Version]
- Yalew, S.; Van Vliet, M.T.H.; Gernaat, D.E.H.J.; Ludwig, F.; Miara, A.; Park, C.; Byers, E.; De Cian, E.; Piontek, F.; Iyer, G.C.; et al. Impacts of climate change on energy systems in global and regional scenarios. Nat. Energy 2020, 5, 1–9. [Google Scholar] [CrossRef]
- Lee, J.; Yang, J.-S. Global energy transitions and political systems. Renew. Sustain. Energy Rev. 2019, 115, 109370. [Google Scholar] [CrossRef]
- Wei, Y.; Zhang, X.; Shi, Y.; Xia, L.; Pan, S.; Wu, J.; Han, M.; Zhao, X. A review of data-driven approaches for prediction and classification of building energy consumption. Renew. Sustain. Energy Rev. 2018, 82, 1027–1047. [Google Scholar] [CrossRef]
- Zhang, X.; Zhao, X.; Smith, S.; Xu, J.; Yu, X. Review of R&D progress and practical application of the solar photovoltaic/thermal (PV/T) technologies. Renew. Sustain. Energy Rev. 2012, 16, 599–617. [Google Scholar] [CrossRef]
- Wang, C.; Wang, F. China can lead on climate change. Science 2017, 357, 764. [Google Scholar] [CrossRef]
- Wang, C.; Wang, F. Structural Decomposition Analysis of Carbon Emissions and Policy Recommendations for Energy Sustainability in Xinjiang. Sustainability 2015, 7, 7548–7567. [Google Scholar] [CrossRef] [Green Version]
- Wang, C.; Zhang, H.; Wang, F.; Ye, Y.; Wu, Q.; Huang, G. Slash local emissions to protect Tibetan plateau. Nat. Cell Biol. 2019, 566, 455. [Google Scholar] [CrossRef] [Green Version]
- Keeler, B.; Hamel, P.; McPhearson, T.; Hamann, M.H.; Donahue, M.L.; Prado, K.A.M.; Arkema, K.K.; Bratman, G.N.; Brauman, K.A.; Finlay, J.C.; et al. Social-ecological and technological factors moderate the value of urban nature. Nat. Sustain. 2019, 2, 29–38. [Google Scholar] [CrossRef]
- Kennedy, C.; Steinberger, J.; Gasson, B.; Hansen, Y.; Hillman, T.; Havranek, M.; Pataki, D.; Phdungsilp, A.; Ramaswami, A.; Villalba Mendez, G. Greenhouse Gas Emissions from Global Cities. Environ. Sci. Technol. 2009, 43, 7297–7302. [Google Scholar] [CrossRef]
- Wang, S.; Shi, C.; Fang, C.; Feng, K. Examining the spatial variations of determinants of energy-related CO2 emissions in China at the city level using Geographically Weighted Regression Model. Appl. Energy 2019, 235, 95–105. [Google Scholar] [CrossRef]
- Wang, S.; Liu, X.; Zhou, C.; Hu, J.; Ou, J. Examining the impacts of socioeconomic factors, urban form, and transportation networks on CO2 emissions in China’s megacities. Appl. Energy 2017, 185, 189–200. [Google Scholar] [CrossRef]
- Xu, Q.; Dong, Y.; Yang, R.; Zhang, H.; Wang, C.-J.; Du, Z.-W. Temporal and spatial differences in carbon emissions in the Pearl River Delta based on multi-resolution emission inventory modeling. J. Clean. Prod. 2019, 214, 615–622. [Google Scholar] [CrossRef]
- Shan, Y.; Guan, D.; Hubacek, K.; Zheng, B.; Davis, S.J.; Jia, L.; Liu, J.; Liu, Z.; Fromer, N.; Mi, Z.; et al. City-level climate change mitigation in China. Sci. Adv. 2018, 4, eaaq0390. [Google Scholar] [CrossRef] [Green Version]
- Liu, Z.; Feng, K.; Hubacek, K.; Liang, S.; Anadon, L.D.; Zhang, C.; Guan, D. Four system boundaries for carbon accounts. Ecol. Model. 2015, 318, 118–125. [Google Scholar] [CrossRef] [Green Version]
- Wang, C.; Wu, K.; Zhang, X.; Wang, F.; Zhang, H.; Ye, Y.; Wu, Q.; Huang, G.; Wang, Y.; Wen, B. Features and drivers for energy-related carbon emissions in mega city: The case of Guangzhou, China based on an extended LMDI model. PLoS ONE 2019, 14, e0210430. [Google Scholar] [CrossRef] [Green Version]
- Shan, Y.; Liu, J.; Liu, Z.; Shao, S.; Guan, D. An emissions-socioeconomic inventory of Chinese cities. Sci. Data 2019, 6, 190027. [Google Scholar] [CrossRef] [Green Version]
- Liang, S.; Wang, C.; Zhang, T. An improved input–output model for energy analysis: A case study of Suzhou. Ecol. Econ. 2010, 69, 1805–1813. [Google Scholar] [CrossRef]
- Lin, J.; Liu, Y.; Meng, F.; Cui, S.; Xu, L. Using hybrid method to evaluate carbon footprint of Xiamen City, China. Energy Policy 2013, 58, 220–227. [Google Scholar] [CrossRef]
- Kayaçetin, N.; Tanyer, A.M. Embodied carbon assessment of residential housing at urban scale. Renew. Sustain. Energy Rev. 2020, 117, 109470. [Google Scholar] [CrossRef]
- Su, Y.; Chen, X.; Li, Y.; Liao, J.; Ye, Y.; Zhang, H.; Huang, N.; Kuang, Y. China’s 19-year city-level carbon emissions of energy consumptions, driving forces and regionalized mitigation guidelines. Renew. Sustain. Energy Rev. 2014, 35, 231–243. [Google Scholar] [CrossRef]
- Wang, C.; Wang, F.; Zhang, H.; Ye, Y.; Wu, Q.; Su, Y. Carbon Emissions Decomposition and Environmental Mitigation Policy Recommendations for Sustainable Development in Shandong Province. Sustainability 2014, 6, 8164–8179. [Google Scholar] [CrossRef] [Green Version]
- Wang, F.; Wang, C.; Su, Y.; Jin, L.; Wang, Y.; Zhang, X. Decomposition Analysis of Carbon Emission Factors from Energy Consumption in Guangdong Province from 1990 to 2014. Sustainability 2017, 9, 274. [Google Scholar] [CrossRef] [Green Version]
- Zhang, X.; Zhao, Y.; Sun, Q.; Wang, C. Decomposition and Attribution Analysis of Industrial Carbon Intensity Changes in Xinjiang, China. Sustainability 2017, 9, 459. [Google Scholar] [CrossRef] [Green Version]
- Jin, T.; Choi, B. Sectoral Decomposition of Korea’s Energy Consumption by Global Value Chain Dimensions. Sustainability 2020, 12, 8483. [Google Scholar] [CrossRef]
- Taka, G.N.; Huong, T.T.; Shah, I.H.; Park, H.S. Determinants of Energy-Based CO2 Emissions in Ethiopia: A Decomposition Analysis from 1990 to 2017. Sustainability 2020, 12, 4175. [Google Scholar] [CrossRef]
- González, P.F. Exploring energy efficiency in several European countries. An attribution analysis of the Divisia structural change index. Appl. Energy 2015, 137, 364–374. [Google Scholar] [CrossRef]
- Jung, S.; An, K.-J.; Dodbiba, G.; Fujita, T. Regional energy-related carbon emission characteristics and potential mitigation in eco-industrial parks in South Korea: Logarithmic mean Divisia index analysis based on the Kaya identity. Energy 2012, 46, 231–241. [Google Scholar] [CrossRef]
- Cansino, J.M.; Sánchez-Braza, A.; Rodríguez-Arévalo, M.L. How can Chile move away from a high carbon economy? Energy Econ. 2018, 69, 350–366. [Google Scholar] [CrossRef]
- Wang, W.; Liu, X.; Zhang, M.; Song, X. Using a new generalized LMDI (logarithmic mean Divisia index) method to analyze China’s energy consumption. Energy 2014, 67, 617–622. [Google Scholar] [CrossRef]
- Ma, M.; Cai, W.; Cai, W.; Dong, L. Whether carbon intensity in the commercial building sector decouples from economic development in the service industry? Empirical evidence from the top five urban agglomerations in China. J. Clean. Prod. 2019, 222, 193–205. [Google Scholar] [CrossRef]
- Chen, B.; Li, J.S.; Zhou, S.L.; Yang, Q.; Chen, G.Q. GHG emissions embodied in Macao’s internal energy consumption and external trade: Driving forces via decomposition analysis. Renew. Sustain. Energy Rev. 2018, 82, 4100–4106. [Google Scholar] [CrossRef]
- Chong, C.; Liu, P.; Ma, L.; Li, Z.; Ni, W.; Li, X.; Song, S. LMDI decomposition of energy consumption in Guangdong Province, China, based on an energy allocation diagram. Energy 2017, 133, 525–544. [Google Scholar] [CrossRef]
- Gu, S.; Fu, B.; Thriveni, T.; Fujita, T.; Ahn, J.-W. Coupled LMDI and system dynamics model for estimating urban CO2 emission mitigation potential in Shanghai, China. J. Clean. Prod. 2019, 240, 118034. [Google Scholar] [CrossRef]
- Shao, S.; Yang, L.; Gan, C.; Cao, J.; Geng, Y.; Guan, D. Using an extended LMDI model to explore techno-economic drivers of energy-related industrial CO2 emission changes: A case study for Shanghai (China). Renew. Sustain. Energy Rev. 2016, 55, 516–536. [Google Scholar] [CrossRef] [Green Version]
- Ang, B.W.; Lee, S.Y. Decomposition of industrial energy consumption: Some methodological and application issues. Energy Econ. 1994, 16, 83–92. [Google Scholar] [CrossRef]
- Ang, B. The LMDI approach to decomposition analysis: A practical guide. Energy Policy 2005, 33, 867–871. [Google Scholar] [CrossRef]
- Ang, B.; Liu, N. Energy decomposition analysis: IEA model versus other methods. Energy Policy 2007, 35, 1426–1432. [Google Scholar] [CrossRef]
- Choi, K.-H.; Ang, B. Attribution of changes in Divisia real energy intensity index—An extension to index decomposition analysis. Energy Econ. 2012, 34, 171–176. [Google Scholar] [CrossRef]
- Xu, X.; Ang, B. Analysing residential energy consumption using index decomposition analysis. Appl. Energy 2014, 113, 342–351. [Google Scholar] [CrossRef]
- Chung, W.; Kam, M.; Ip, C. A study of residential energy use in Hong Kong by decomposition analysis, 1990–2007. Appl. Energy 2011, 88, 5180–5187. [Google Scholar] [CrossRef]
- Achão, C.; Schaeffer, R. Decomposition analysis of the variations in residential electricity consumption in Brazil for the 1980–2007 period: Measuring the activity, intensity and structure effects. Energy Policy 2009, 37, 5208–5220. [Google Scholar] [CrossRef]
- Hasanbeigi, A.; Can, S.D.L.R.D.; Sathaye, J. Analysis and decomposition of the energy intensity of California industries. Energy Policy 2012, 46, 234–245. [Google Scholar] [CrossRef]
- Baležentis, A.; Baležentis, T.; Streimikiene, D. The energy intensity in Lithuania during 1995–2009: A LMDI approach. Energy Policy 2011, 39, 7322–7334. [Google Scholar] [CrossRef]
- Chontanawat, J.; Wiboonchutikula, P.; Buddhivanich, A. Decomposition analysis of the change of energy intensity of manufacturing industries in Thailand. Energy 2014, 77, 171–182. [Google Scholar] [CrossRef]
- Wang, Z.; Yang, Y. Features and influencing factors of carbon emissions indicators in the perspective of residential consumption: Evidence from Beijing, China. Ecol. Indic. 2016, 61, 634–645. [Google Scholar] [CrossRef]
- Zhao, M.; Tan, L.; Zhang, W.; Ji, M.; Liu, Y.; Yu, L. Decomposing the influencing factors of industrial carbon emissions in Shanghai using the LMDI method. Energy 2010, 35, 2505–2510. [Google Scholar] [CrossRef]
- Kang, J.; Zhao, T.; Liu, N.; Zhang, X.; Xu, X.; Lin, T. A multi-sectoral decomposition analysis of city-level greenhouse gas emissions: Case study of Tianjin, China. Energy 2014, 68, 562–571. [Google Scholar] [CrossRef]
- Tan, X.; Dong, L.; Chen, D.; Gu, B.; Zeng, Y. China’s regional CO2 emissions reduction potential: A study of Chongqing city. Appl. Energy 2016, 162, 1345–1354. [Google Scholar] [CrossRef]
- Liu, Z.; Liang, S.; Geng, Y.; Xue, B.; Xi, F.; Pan, Y.; Zhang, T.; Fujita, T. Features, trajectories and driving forces for energy-related GHG emissions from Chinese mega cites: The case of Beijing, Tianjin, Shanghai and Chongqing. Energy 2012, 37, 245–254. [Google Scholar] [CrossRef]
- Shao, L.; Guan, D.; Zhang, N.; Shan, Y.; Chen, G.Q. Carbon emissions from fossil fuel consumption of Beijing in 2012. Environ. Res. Lett. 2016, 11, 114028. [Google Scholar] [CrossRef] [Green Version]
- Ru, M.; Tao, S.; Smith, K.; Shen, G.; Shen, H.; Huang, Y.; Chen, H.; Chen, Y.; Chen, X.; Liu, J.; et al. Direct Energy Consumption Associated Emissions by Rural-to-Urban Migrants in Beijing. Environ. Sci. Technol. 2015, 49, 13708–13715. [Google Scholar] [CrossRef]
- Li, J.; Chen, G.; Hayat, T.; Alsaedi, A. Mercury emissions by Beijing#x2019;s fossil energy consumption: Based on environmentally extended input–output analysis. Renew. Sustain. Energy Rev. 2015, 41, 1167–1175. [Google Scholar] [CrossRef]
- Shan, Y.; Huang, Q.; Guan, D.; Hubacek, K. China CO2 emission accounts 2016–2017. Sci. Data 2020, 7, 54. [Google Scholar] [CrossRef] [Green Version]
- Guan, D.; Liu, Z.; Geng, Y.; Lindner, S.; Hubacek, K. The gigatonne gap in China’s carbon dioxide inventories. Nat. Clim. Chang. 2012, 2, 672–675. [Google Scholar] [CrossRef]
- Siegel, I.H. The Generalized “Ideal” Index-Number Formula. J. Am. Stat. Assoc. 2006, 40, 520. [Google Scholar] [CrossRef]
- Wang, H.; Ang, B.; Su, B. Assessing drivers of economy-wide energy use and emissions: IDA versus SDA. Energy Policy 2017, 107, 585–599. [Google Scholar] [CrossRef]
- Ang, B.W. Decomposition analysis for policymaking in energy: Which is the preferred method? Energy Policy 2004, 32, 1131–1139. [Google Scholar] [CrossRef]
- Ang, B. LMDI decomposition approach: A guide for implementation. Energy Policy 2015, 86, 233–238. [Google Scholar] [CrossRef]
- Ang, B.; Zhang, F. A survey of index decomposition analysis in energy and environmental studies. Energy 2000, 25, 1149–1176. [Google Scholar] [CrossRef]
- Peters, G.P.; Andrew, R.M.; Canadell, J.G.; Fuss, S.; Jackson, R.B.; Korsbakken, J.I.; Le Quéré, C.; Nakicenovic, N. Key indicators to track current progress and future ambition of the Paris Agreement. Nat. Clim. Chang. 2017, 7, 118–122. [Google Scholar] [CrossRef]
- Wang, F.; Wang, C.; Chen, J.; Li, Z.; Li, L. Examining the determinants of energy-related carbon emissions in Central Asia: Country-level LMDI and EKC analysis during different phases. Environ. Dev. Sustain. 2020, 22, 7743–7769. [Google Scholar] [CrossRef]
- Su, Y.; Wang, Y.; Zheng, B.; Ciais, P.; Wu, J.; Chen, X.; Wang, Y.; Wang, C.; Ye, Y.; Li, Q.; et al. Retrospect driving forces and forecasting reduction potentials of energy-related industrial carbon emissions from China’s manufacturing at city level. Environ. Res. Lett. 2020, 15, 074020. [Google Scholar] [CrossRef] [Green Version]
- Bi, J.; Zhang, R.; Wang, H.; Liu, M.; Wu, Y. The benchmarks of carbon emissions and policy implications for China’s cities: Case of Nanjing. Energy Policy 2011, 39, 4785–4794. [Google Scholar] [CrossRef]
- Li, J.; Chen, G. Energy and greenhouse gas emissions review for Macao. Renew. Sustain. Energy Rev. 2013, 22, 23–32. [Google Scholar] [CrossRef]


| Authors | Time Period | Indicator | Cities or Countries |
|---|---|---|---|
| Ang et al. [43] | 1974–1990 | Industrial energy consumption | Singapore |
| Ang et al. [44] | 1990–2000 | Industrial energy consumption | Canada |
| Ang et al. [45] | 1985–2000 | Industrial energy consumption | United States |
| Choi et al. [46] | 1987–2004 | Energy intensity | United States |
| Xu et al. [47] | 2000–2010 | Residential energy consumption | Singapore |
| Chung et al. [48] | 1990–2007 | Residential energy consumption | Hong Kong |
| Achão et al. [49] | 1980–2007 | Residential energy consumption | Brazil |
| Ali et al. [50] | 1997–2008 | Industrial energy intensity | California |
| Balezˇentis et al. [51] | 1995–2009 | Energy intensity | Lithuania |
| Chontanawat et al. [52] | 1991–2011 | Industrial energy intensity | Thailand |
| Fernández González et al. [34] | 1995–2010 | Energy intensity | European countries |
| Jung et al. [35] | 2002–2009 | Energy-related carbon emission | South Korea |
| Cansino et al. [36] | 1991–2013 | Energy-related carbon emission | Chile |
| Chen et al. [39] | 2000–2011 | Energy-related carbon emission | Macao |
| Wang et al. [53] | 2000–2010 | Residential carbon emissions | Beijing |
| Zhao et al. [54] | 1996–2007 | Energy-related carbon emission | Shanghai |
| Shao et al. [42] | 1994–2011 | Energy-related carbon emission | Shanghai |
| Kang et al. [55] | 2001–2009 | Energy-related carbon emission | Tianjin |
| Tan et al. [56] | 2000–2012 | Energy-related carbon emission | Chongqing |
| Liu et al. [57] | 1995–2009 | Energy-related carbon emission | Beijing, Shanghai, Tianjin, and Chongqing |
| ΔE (Mtce) | p-Effect | g-Effect | e-Effect | |
|---|---|---|---|---|
| 2006–2007 | 7.3367 | 4.5886 | 3.4257 | −0.6776 |
| 2007–2008 | 1.8510 | 1.9853 | 5.2503 | −5.3846 |
| 2008–2009 | 1.8318 | 1.5819 | 4.9711 | −4.7212 |
| 2009–2010 | 8.5551 | 7.2274 | 0.9271 | 0.4006 |
| 2010–2011 | 7.1657 | 0.3677 | 7.9280 | −1.1299 |
| 2011–2012 | 2.7417 | 0.2257 | 7.2990 | −4.7830 |
| 2012–2013 | 0.7563 | 0.2240 | 7.1057 | −6.5735 |
| 2013–2014 | 0.4037 | 0.1924 | 6.2295 | −6.0182 |
| 2014–2015 | 1.1199 | 0.0920 | 5.7878 | −4.7599 |
| 2015–2016 | 2.8599 | 0.2460 | 5.7772 | −3.1633 |
| 2006–2007 | 2007–2008 | 2008–2009 | 2009–2010 | 2010–2011 | 2011–2012 | 2012–2013 | 2013–2014 | 2014–2015 | 2015–2016 | 2006–2016 | ||
|---|---|---|---|---|---|---|---|---|---|---|---|---|
| Economic activities | p-effect | 4.3719 | 1.8907 | 1.5128 | 6.9282 | 0.3478 | 0.2119 | 0.2102 | 0.1809 | 0.0862 | 0.2294 | 16.9164 |
| g-effect | 3.2639 | 5.0002 | 4.7540 | 0.8887 | 7.5005 | 6.8526 | 6.6658 | 5.8561 | 5.4230 | 5.3873 | 46.9213 | |
| e-effect-Agriculture | −0.0590 | 0.0094 | −0.0875 | 0.0398 | 0.0248 | 0.0067 | −0.0774 | −0.0134 | 0.0207 | −0.0121 | −0.1677 | |
| e-effect-Production | 2.3221 | −4.8615 | 0.2564 | 0.0414 | 0.0814 | −4.4646 | −2.4262 | −2.3636 | −3.3580 | 0.4059 | −12.2806 | |
| e-effect-Construction | −0.1069 | 0.0506 | −0.2199 | 0.0849 | 0.1126 | −0.0093 | −0.0509 | 0.0039 | −0.0986 | −0.1331 | −0.3602 | |
| e-effect-Service | −0.9643 | 0.3908 | −1.8958 | 0.8064 | −0.5710 | 1.1781 | −1.2623 | −0.5526 | −0.0002 | −1.0069 | −4.1845 | |
| s-effect-Agriculture | −0.0207 | −0.0141 | −0.0075 | −0.0222 | −0.0049 | −0.0078 | 0.0045 | −0.0017 | 0.0009 | −0.0139 | −0.1039 | |
| s-effect-Production | −1.4518 | −1.6514 | −1.5455 | −1.8655 | −1.6286 | −1.7354 | −2.6293 | −2.8910 | −2.0085 | −2.5707 | −18.0533 | |
| s-effect-Construction | −0.0291 | 0.0039 | 0.0298 | 0.0011 | 0.0112 | −0.0050 | 0.0101 | 0.0127 | −0.0080 | −0.0211 | 0.0117 | |
| s-effect-Service | 0.2864 | 0.2601 | 0.1757 | 0.2451 | 0.1948 | 0.2465 | 0.3598 | 0.3719 | 0.2796 | 0.3768 | 2.8411 | |
| △E-Economy | 7.6125 | 1.0786 | 2.9724 | 7.1481 | 6.0689 | 2.2736 | 0.8042 | 0.6032 | 0.3372 | 2.6418 | 31.5405 | |
| Residential consumption | p-effect | 0.1260 | 0.0555 | 0.0411 | 0.1858 | 0.0122 | 0.0084 | 0.0086 | 0.0073 | 0.0037 | 0.0108 | 0.6775 |
| g-effect-AUI | 0.2024 | 0.1887 | 0.1530 | 0.1754 | 0.3123 | 0.3543 | 0.2831 | 0.3849 | 0.2519 | 0.2757 | 2.6636 | |
| g-effect-ARI | 0.1250 | 0.1303 | 0.0921 | 0.1178 | 0.2439 | 0.2153 | 0.1992 | 0.1559 | 0.1493 | 0.1558 | 1.6456 | |
| e-effect-U | −0.4451 | 0.1854 | −0.7618 | 0.3707 | 0.2489 | −0.0399 | −0.3776 | −0.4368 | 0.2108 | −0.1139 | −1.4818 | |
| e-effect-R | −0.3685 | 0.1775 | −0.6889 | 0.4719 | 0.2940 | −0.0511 | −0.1450 | −0.2944 | 0.1903 | −0.0977 | −0.6696 | |
| Urbanization-effect | 0.0117 | 0.0087 | 0.0071 | 0.0932 | 0.0438 | 0.0414 | 0.0348 | 0.0332 | 0.0420 | 0.0291 | 0.3677 | |
| △E-Resident | −0.2758 | 0.7724 | −1.1406 | 1.4070 | 1.0968 | 0.4681 | −0.0480 | −0.1994 | 0.7827 | 0.2181 | 3.0814 |
Publisher’s Note: MDPI stays neutral with regard to jurisdictional claims in published maps and institutional affiliations. |
© 2021 by the authors. Licensee MDPI, Basel, Switzerland. This article is an open access article distributed under the terms and conditions of the Creative Commons Attribution (CC BY) license (http://creativecommons.org/licenses/by/4.0/).
Share and Cite
Wang, C.; Wang, F.; Huang, G.; Wang, Y.; Zhang, X.; Ye, Y.; Lin, X.; Zhang, Z. Examining the Dynamics and Determinants of Energy Consumption in China’s Megacity Based on Industrial and Residential Perspectives. Sustainability 2021, 13, 764. https://doi.org/10.3390/su13020764
Wang C, Wang F, Huang G, Wang Y, Zhang X, Ye Y, Lin X, Zhang Z. Examining the Dynamics and Determinants of Energy Consumption in China’s Megacity Based on Industrial and Residential Perspectives. Sustainability. 2021; 13(2):764. https://doi.org/10.3390/su13020764
Chicago/Turabian StyleWang, Changjian, Fei Wang, Gengzhi Huang, Yang Wang, Xinlin Zhang, Yuyao Ye, Xiaojie Lin, and Zhongwu Zhang. 2021. "Examining the Dynamics and Determinants of Energy Consumption in China’s Megacity Based on Industrial and Residential Perspectives" Sustainability 13, no. 2: 764. https://doi.org/10.3390/su13020764
APA StyleWang, C., Wang, F., Huang, G., Wang, Y., Zhang, X., Ye, Y., Lin, X., & Zhang, Z. (2021). Examining the Dynamics and Determinants of Energy Consumption in China’s Megacity Based on Industrial and Residential Perspectives. Sustainability, 13(2), 764. https://doi.org/10.3390/su13020764


