Article

Evaluating Sustainable Development by Composite Index: Evidence from French Departments

by
Jean Bonnet
1,
Eva Coll-Martínez
2,* and
Patricia Renou-Maissant
3
1
SEGGAT-CREM, Normandy University, 14032 Caen CEDEX, France
2
LEREPS, Sciences Po Toulouse, 31042 Toulouse CEDEX, France
3
EconomiX, Paris Nanterre University, 92001 Nanterre, France
*
Author to whom correspondence should be addressed.
Sustainability 2021, 13(2), 761; https://doi.org/10.3390/su13020761
Submission received: 11 December 2020 / Revised: 5 January 2021 / Accepted: 9 January 2021 / Published: 14 January 2021
(This article belongs to the Collection Circular Economy and Sustainable Strategies)

Abstract

:
Since the adoption of the Sustainable Development Goals by the United Nations, sustainability has been a key priority for European governments. While previous studies have investigated the associations between indicators of sustainable development, few have directly considered a multidimensional approach to assess and compare the performance of regions in terms of sustainable development. As such, a comprehensive assessment of regional sustainable performance is thus still needed. In this paper, the concept of sustainability relies on the construction of six composite indices (environment and natural resources, energy transition, sustainable mobility, economic dynamism, social cohesion and solidarity, and governance and citizenship) with the aim to provide an evaluation framework for empirically comparing the performance of the 96 metropolitan French Departments. Each dimension is explored by spatial autocorrelation analysis and Hierarchical Ascending Classification (HAC) to classify French Departments providing five different regional profiles of sustainable development. The findings make it possible to identify the strengths and weaknesses of the departments in the implementation of sustainable development. This approach provides the bases for a systematic monitoring of sustainable development policies at the regional scale.

1. Introduction

Since the Brundtland et al. [1] report and the adoption of Agenda 21 at the United Nations Conference on Environment and Development held in Rio de Janeiro in 1992, sustainability has been a key priority for European governments who consequently adjusted their policies. The new 2030 Agenda with its Sustainable Development Goals (SDGs) was then adopted by all member states of the United Nations at the Paris Weather summit in September 2015 [2,3]. Five years later, global efforts are still required to satisfy all these commitments.
In Europe, within the framework of new legislation on the transformation of the linear economy into a circular economy, local public and private agents are encouraged to achieve these objectives. One example of this commitment is the integration of the SDGs in Research and Innovation Strategies for Smart Specialization (RIS3) that have been used to implement European Union Cohesion Policy in recent years, aiming to achieve economic, social, and territorial development by reducing disparities between regions [4].
In France, the Roadmap Circular Economy (FREC) of the French government details at the national level the following objectives: to reduce by 30% the consumption of resources compared to the Gross Domestic Product (GDP) by 2030 compared to 2010, to reduce by 50% the quantities of non-hazardous waste landfilled in 2025 compared to 2010, to reach 100% recycled plastics in 2025, to avoid the emission of 8 million tonnes of additional CO2 each year thanks to the recycling of plastic, and to create up to 300,000 additional jobs.
In accordance with the law for the New Territorial Organization of the French Republic (law NOTRe), regions have become the administrative unit leader in the design and implementation of sustainable development actions [5], through the development of the Schéma Régional d’Aménagement, de Développement Durable et d’Egalité des Territoires (SRADDET). The Regional Planning Scheme merges several existing schemes: The Regional Land Use Planning and Sustainable Development Scheme (SRADDT) (Adaptation of the Regional Climate, Air and Energy Plan (PRCAE), created by the law number 2010-788 of 12 July 2010, entitled “Grenelle Act II”. The PRCAE must define, from an inventory, objectives and orientations for the horizons 2020 and 2050 [6]), the Regional Waste Prevention and Management Plan (PRPGD), the Regional Inter-modality Scheme (SRI), the Regional Climate Air Energy Scheme (SRCAE), and the Regional Ecological Coherence Scheme (SRCE).
In light of this global interest, many scholars have attempted to develop empirical tools and indicators to evaluate the sustainable development performances [7] but few of them have considered a multidimensional approach to assess this issue. The complexity of the definition of sustainable development underlines the need to consider its multiple dimensions. Consequently, the development of sustainable development indicators considering its associated dimensions has become a crucial issue for the evaluation of public policies and the assessment of the performance of territories in this domain. Firstly, many researchers have tried to measure sustainable development, but few of them have simultaneously considered the multiple dimensions associated with it by combining different empirical tools [8,9,10,11]. Secondly, little has been said in the literature about the regional disparities that may exist when applying the SDGs and how these practices may be associated with good performances in neighboring regions. Thirdly, the diversity of empirical approaches to measuring sustainable development makes it difficult to generalize results as they need to be adapted to the specificities of each country or region [12]. All these shortcomings hamper the evaluation and setting-up of clear policies to ensure the total reconversion into sustainable regions.
In this paper, we aim to provide an evaluation framework for empirically comparing the performance of the 96 metropolitan French Departments belonging to Nomenclature of Territorial Units for Statistics 3 (NUTS3). Specifically, the goals of this paper are the following: (1) to propose a set of composite indices considering a multidimensional approach of sustainable development, and (2) to provide an applied example of its simultaneous use for regional assessment.
Hypotheses of the paper rely on the fact that sustainable development is consubstantially multidimensional and should be looked at on a spatial level, because it is at this level that solutions can arise. Accordingly, preserving or containing the degradation of the natural biosphere requires considering the multiple dimensions of sustainable development as well as considering local specificities. According to Theys [13], France is relatively well-placed in terms of environmental performance, however the situation is very uneven from one territory to another. With the aim of reducing local disparities and helping the less performing territories in matters relating to sustainable development, it seems necessary to have indicators making it possible to compare the performance of the departments. Having identified six dimensions for territorial sustainable development, we construct an indicator for each of these dimensions. Our goal is not to propose a global index—composite indicator—to establish a ranking of departments, instead, we propose to build an index for each of the dimensions of sustainable development to identify the strengths and weaknesses of the territories relative to these dimensions. In this context, territorial benchmarking can help local actors in making strategic decisions and implementing appropriate policies considering the position of a territory relative to others in order to improve its performances.
Concretely, in this paper, the concept of sustainability is apprehended from six dimensions: environment and natural resources, energy transition, sustainable mobility, economic dynamism, social cohesion and solidarity, and governance and citizenship. The six dimensions were selected based on the work of Raworth [14]. However, we have expanded the social floor proposed by Raworth to a societal floor, which encompasses not only an equity dimension but also an economic dimension and a political dimension, as most of the hindering points on the implementation of sustainable development strategies are connected to these aspects.
Considering a wide range of indicators, we compute aggregate composite indices for each dimension of sustainable development. The departments’ performances in each of the six dimensions are compared by using spatial exploratory tools and spatial autocorrelation techniques. Then, a cluster analysis is applied to classify French departments in terms of sustainable development. The use of composite indices allows us to identify strengths and weaknesses of French departments as well as the levers and obstacles to sustainable development, providing a useful tool for the application and coordination of sustainable development-based policies at the different administrative levels.
A theoretical framework for the construction of the sustainable development index is presented in Section 2. The materials and methods of the paper are next presented in Section 3, followed by Section 4, which presents the results obtained and discussed in Section 5. Finally, the conclusions are provided in Section 6.

2. Literature Review

2.1. A Definition of Sustainable Development

Sustainability refers to the capacity to maintain a certain activity or process indefinitely. Several definitions of sustainable development have been proposed by researchers and policy makers. The most commonly used is Brundtland’sdefinition, which defines sustainable development as “development that meets the needs of the present without compromising the ability of future generations to meet their own needs” [15] p. 43. The concept of sustainability is based on three interdependent pillars: environmental, social, and economic, which are interconnected [16]. This approach assumes that sustainable development can only be achieved if the three pillars are considered together, which makes economic development, social improvements, and environmental protection compatible. Only then can sustainable development become the dominant paradigm of public policy. Any long-term orientation of public policies towards growth must be beneficial for the environment, socially acceptable, and economically feasible to be accepted by citizens. The interaction between the three pillars implies that sustainability presupposes the implementation of measures aimed at balancing the importance and the effects of these three pillars [17].
Environmental sustainability refers to the capacity of biological systems to maintain their functions and processes indefinitely. It focuses on natural capital and highlights the irreplaceability of some natural resources. The benefits for the environment concern the preservation of fossil resources and the good functioning of ecosystems. As an ecosystem we understand a “dynamic complex of plants, animals, micro-organisms and the surrounding still-life acting as a functional unit” [18])). At the condition of not exceeding its overexploitation thresholds, a natural ecosystem is part of the so-called renewable resources [19].
Social sustainability must ensure a quality of life and services, as well as security for all citizens. Stren and Polese [20] define the social pillar as “development (and/or growth) compatible with the harmonious development of civil society, creating an environment conducive to the cohabitation of culturally and socially diverse groups, while encouraging social integration, with improvements in the quality of life for all segments of the population”. Bramley and Power [21], who discuss social sustainability with regard to urban form and housing in the United Kingdom, consider that questions on social equity (access to services, facilities, and opportunities) and on community sustainability raise concerns about social capital and cohesion. According to Baehler [22], social sustainability is concerned with the fundamental tensions of democracy.
Economic sustainability increases development concerns to include environmental and social issues. According to the UN, “societies must create the conditions for people to have quality jobs that stimulate the economy without harming the environment. Decent employment opportunities and decent working conditions are also necessary for the entire working age population”. From this point of view, the depletion of natural capital can be limited by the implementation of policies and measures aimed at both saving non-renewable resources and replacing them with renewable resources. To achieve these objectives, a new development model must be implemented. The circular economy and innovation are the main drivers of this new model. The circular economy aims to change the paradigm compared to the so-called linear economy by limiting the waste of resources and the environmental impact [23,24]. There is no doubt that research and development, technology, and eco-innovation play a vital role in accelerating the transition to sustainable development.
Although these three pillars of sustainable development are commonly used, they are not universally recognized, and alternative approaches have been proposed. Additional pillars such as institutional, cultural, and technical factors are included [16]. Recently, Raworth [14] offered an interesting circular graphic representation in which there is a “social floor”, the minimum threshold to be reached to satisfy basic human needs, and an “ecological ceiling”, which corresponds to the upper limit not to be exceeded in order to respect essential ecological balances. Between these two borders, there is “the just and safe space for humanity”. For the ecological ceiling, scientists identify nine boundaries, called “planetary boundaries”, that have been defined based on the risks of irreversibility. These are the accumulation of greenhouse gases, the emissions of chlorinated compounds, the degree of acidity of surface water, the atmospheric concentration of aerosols, the maintenance of biodiversity, and the conservation of soil fertility. For the social floor, the author retains income, gender equality, resilience, access to employment, food, energy, water, education, social equity, health, and democracy. According to this, it is necessary to reason in terms of the distribution of wealth and not of income, that is, to get out of the linear logic and promote a circular and regenerative economy.

2.2. The Dimensions of Sustainable Development

To measure sustainable development and compare it across French territories, the French National Institute for Statistics and Economic Studies (INSEE) proposes 20 regional and departmental indicators. In addition to indicators of economic context (GDP, unemployment), they cover social, economic, environmental, and governance dimensions. We expand the scope of analysis by increasing both the number of dimensions and indicators selected.
Inspired by the work of Raworth [14], we selected three dimensions concerning the ecological ceiling—these are environment and natural resources, energy transition, and sustainable mobility—and three dimensions associated to what we call the societal floor—economic dynamism, social cohesion and solidarity, and governance and citizenship (Scheme 1). We thus expanded the social floor proposed by Raworth [14] to a societal floor, which encompasses not only an equity dimension but also an economic dimension and a political dimension.

2.2.1. Ecological Ceiling Dimensions

The dimension environment and natural resources accounts for greenhouse gas emissions per inhabitant and assesses the territory’s capacity to regenerate its resources thanks to the share of the non-artificial area, the aquatic and forest surface, and the length of the coastline, as well as the engagement in organic farming [25].
The second dimension is sustainable mobility. Transport is an important cause of pollution: densely populated areas usually lead to higher commuting times. Clean and efficient transport infrastructures are then important [26,27]. Sustainable mobility is one of the major challenges facing territories and requires a radical change. Indeed, territorial policies must develop different modes of public transport, such as cycle and pedestrian routes, electric vehicles, and car sharing, and create new solutions that respect the environment ensuring the circulation of people, goods, and services.
The energy transition dimension is at the heart of sustainable development as SDGs highlight the importance of affordable and clean energy. Therefore, a radical technological transformation of the global energy system is essential to reduce energy consumption, limit the use of fossil fuels, and promote the development of low-carbon energy. In France, the two Grenelle de l’Environnement laws have given local authorities a major role in setting up the energy transition by widening their field of competence in the field of energy policy, by developing actions to energy management, and intervening in the field of energy and the production of renewable energy resources.

2.2.2. Societal Floor Dimensions

The importance of the economic dynamism dimension is explained by the possibility of implementing resources to develop a sustainable economy. Although economic growth is usually negatively associated to the preservation of the environment, Grossman and Krueger [28] show that pollutant emissions increase with growth and then decrease, forming an inverted U-shaped relationship. Indeed, access to a certain level of development may constitute a virtuous growth [29]. Several arguments support this optimistic vision of growth: (i) economic development and its corollary, the tertiarization of the economy with the reduction of the environmental impact, (ii) the increase in the level of education that can induce a strong sensitivity to environmental concerns and change the behavior of consumers, and (iii) innovation and technical progress which actively contribute to the development of depollution techniques and the installation of clean technologies. We therefore assume that regional disparities in terms of economic dynamism [30,31] can improve the environmental performance of regions.
The dimension social cohesion and solidarity is essential for the success of environmental regulations as well as for a certain equity [32], “Social cohesion implies the construction of shared values and communities of interpretation, the reduction of disparities in terms of wealth and income and in general to give the population the feeling of participating in a common enterprise, of coping with common challenges and being part of the same community” [33]. According to the European Council, social cohesion is the capacity of a society to ensure the well-being of all of its members, by reducing disparities and avoiding exclusion. Decision-makers must be particularly careful when defining a financial burden of new environmental distributed standards without penalizing the most vulnerable populations.
The relevance of the governance and citizenship dimension is explained by the need to ensure public policies requiring cooperation, coordination, and management of negative externalities [34]. Many sociologists defend the thesis that a socio-environmental problem must be constructed, defined, and negotiated according to the actors involved [35]. Citizens are directly responsible for preserving the environment [36]. Citizen participation and direct democracy are the cornerstones of building sustainable communities [37]. Therefore, the involvement of young citizens is crucial because they will be both the future leaders of society and the first victims of global warming [38].

2.3. Sustainable Development Indices

When it comes to measuring sustainable development, numerous indicators and indices exist, but just a few gained some notoriety. By the early 1990s, there was a consensus that GDP is insufficient to reflect improvement in human well-being. The HDI (Human Development Index) developed by the United Nations Development Program (UNDP) in 1990, with the support of future Nobel Prize winner Amartya Sen, is one of the most used and well-known indicators among scholars, but this index does not explicitly consider environmental concerns. Years later, some scholars have tried to complete the HDI by considering environmental and ecological indicators such as the Human Sustainable Development Index (HSDI) [39], the Human Green Development Index (HGDI) [40], and recently, a new National Sustainable Development Index (NSDI) [11].
The Genuine Progress Indicator (GPI) is an extension of the Index of Sustainable Economic Welfare (ISEW) developed by Daly and Cobb in 1989 [41]. It aims to measure genuine and real progress of the society and especially seeks to monitor welfare and the ecological sustainability of the economy. The GPI takes into account the fact that when businesses produce, negative consequences such as resource depletion, pollution, and long-term environmental damage appear according to the maximum of Max-Neef [42]: “When macroeconomic systems expand beyond a certain size, the additional benefits of growth are exceeded by the attendant costs”. Daly is also an economist who adheres to the steady-state economy based on the premises that the economy is an open subsystem of a finite and non-growing ecosystem (earth’s natural environment). This view inherited from Georgescu-Roegen, who thinks that economic scarcity is rooted in physical reality and relies on the physical concept of entropy. Recent works uses this index, as in [43,44].
Adjusted Net Savings, developed by the World Bank in the 1990s, is an adequate indicator for capturing the level of sustainable development according to [45,46,47,48]. “After reducing Gross National Income (GNI) by consumption and depreciation—of physical capital—the World Bank adds current education expenditures to indicate investment in human capital” [48]. Then, the World Bank subtracts the rents of natural resources and in its last versions, damages by air pollution, as depletion of natural capital (i.e., minus energy depletion, mineral depletion, net forest depletion, and carbon dioxide and particulate emissions damage). The index is expressed in percentage of GNI.
The 2030 Agenda for Sustainable Development, adopted by all United Nations Member States in 2015, defines 17 Sustainable Development Goals (SDG) and no less than 169 targets setting practical assessments of human well-being. They include areas such as economic inequality, environmental sustainability, innovation, peace and justice, and sustainable consumption, among other priorities. Guijarro and Poyatos [8] use an aggregated index of Sustainable Development Goals to rank the 28 European Countries.
Shaker and Sirodoev [49] have developed a Local Sustainable Development Index (LSDI) for the Moldova Republic thanks to utilization of Millennium Goals. Pravitasari [12] developed a Regional Sustainability Index (RSI) in Indonesia based on 30 regional sustainable development indicators, which were divided into three major dimensions: economy, social, and environment. According to the authors, “RSI is a very effective method to indicate the locations of the hotspot issues of sustainable development…[ ]… and to determine the appropriate policy for solving the problems in each region”. Nogués et al. [50] adds a territorial dimension in the definition of an index of SD for municipalities in Cantabria because “It is worth to mention that the spatial dimension of sustainability has been traditionally omitted by ecological and environmental economics”. Local and regional sustainability indexes have been implemented to take into account territorial cohesion policy goals of spatial planning.

3. Materials and Methods

The present study is based on the 96 French metropolitan departments. We have chosen to work at the departmental level for two main reasons. First, the departmental scale represents a historical administrative unit defined based on the provision of equal access to public services since the French Revolution. Second, it allows for a more detailed analysis leading to a better understanding of local characteristics and initiatives, such as Agenda 21. Still, to consider the regional dimension of sustainable territorial development, we test for any potential regional effect on sustainable development by applying a Cramer’s V association measure [51].

3.1. Construction of Composite Indices

A composite index is a tool to assess the performance of countries or territories as it provides a simple representation of complex and multidimensional phenomena. The use of a composite index is three-fold: policy monitoring, public communication, and generation of rankings [10,52,53]. They are increasingly used in the comparative analysis of territorial benchmarking [54] because they provide simple comparisons between spatial units (for example, countries, regions, departments, etc.).
However, if an index is simple to understand and analyze, it is difficult to formulate. Its construction requires several choices, namely the selection of variables, methods of aggregation, normalization, and weighting, to apply [55,56,57].
The construction of the six specific indices of sustainable development is carried out in three steps. First, it requires the selection of variables representative of the six dimensions identified. This choice stems, on the one hand, from the relevance of the variables regarding the dimension concerned and, on the other hand, from the availability of data at the departmental level. Second, normalization of data is necessary prior to any aggregation of the data since different indicators usually have different units and are defined on different scales.
In this regard, the indicators were divided by departments population whenever the correlation between an indicator and population size was greater than 0.3 (Pearson correlation) to ensure the inter-departments comparability. Then, to adjust for differences in units of measure and ranges of variation, all indicators were normalized within the range [0, 100], using the min–max method, where higher scores represent better results for a variable that is desirable (See Mazziotta and Pareto [58,59] and OECD [53] for a detailed discussion about the methods and approaches to the elaboration of composite indices).
The min–max method involves taking the minimum and maximum values observed to form a scale so that they have an identical range from 0 to 100 by subtracting from the indicator its minimum value and dividing it by the range of indicator values. A value of 100 is given to the highest desired value and 0 to the lowest. For example, for the variable Share of Natura 2000 (Natural Areas of Ecological Interest Fauna and Flora) classified areas, the department that shows the highest share is Bouches du Rhône (50.7), and the one with the lowest share of is the department Côtes d’Armor (2.1). As this is a desirable variable, the department with the highest share is assigned a score of 100 and the one with the lowest share is assigned a score of 0.
The main advantage of this method is its ability to gauge performance based on the best and the worst performance, while the main drawback is the need to recalibrate when additional data are added. Alternative methods are distance to reference and standardization. The main drawback of the former is that the results obtained may be very sensitive to the benchmark chosen, while in the standardization, the main problem is that the sample size should be sufficiently large, and recalibration is needed when new data are added. Still, the min–max is the most used method [60] and the best approach to the nature of our data.
The final step is the weighting and aggregation of the normalized indicators. We have chosen to conform to common practice, and we have proceeded to an additive aggregation (arithmetic average) by assigning equal weighting to the set of indicators, but with some exceptions [53,60]. The weighting used for the construction of each of the six indices is one for almost all the standardized variables. In some cases, when several variables represent the same aspect of a characteristic, the weighting is smaller to avoid an overweighting of the characteristic. If this is the case, we construct a sub-index from the variables representative of the considered characteristic and we give it a total weight of 1. The robustness of the results is assessed by using alternative weights. Still, results do not significantly vary either in terms of values or in the positions of the departments when these are classified according to the value of the index.
All the indicators used as well as their definitions, their sources, and the weights applied are summarized in Table 1. The reference year differs according to the variables due to data availability, always using the most recent available data. In the weight column, green color means that the indicator is positively associated to the index, while red color is used for those indicators that, according to the literature, are negatively associated to the index.

3.2. Local and Global Spatial Autocorrelation

To measure and describe the spatial disparity and spatial spillovers in terms of sustainable development performance, we calculate both the global and local spatial autocorrelation indicators: Moran’s I [61] and the Local Indicator of Spatial Association (LISA), respectively.
First, the Global Moran’s I is calculated to reject the null hypothesis and determine whether the spatial pattern is likely or unlikely to present random results. Small p-values and very high or very low z-scores should be obtained for the null hypothesis to be rejected. The values of Moran’s I range from −1 (dispersion) to 1 (autocorrelation), while values close to 0 indicate a random distribution. Secondly, to identify the existing correlations in the territory, the Local Moran’s I was used.
The calculation of these indicators requires the definition of (row standardized) spatial-neighbor matrix (W). W can be approached in different ways (distance-based neighbors, k-nearest neighbors, contiguous neighbors, and inverse-distance-based neighbors, among others). Nevertheless, considering previous research on the same geographical area, we decided to build the W matrix as a queen contiguity matrix.

3.3. Multivariate Analysis

A multidimensional approach is applied to establish a typology of French Departments relative to the six composite indicators of sustainable development. The approach adopted is based on a complementarity of multidimensional data analysis methods [62,63,64]. Concretely, an Ascending Hierarchical Ascending Classification (HAC) according to Ward’s method, that consists in gathering classes in which the loss of inertia between classes is the lowest, was applied on the main significant factors of the Principal Component Analysis (PCA) for the 96 French Departments. This methodological linking of factorial and clustering methods constitutes an instrument for statistical observation and structural analysis data. According to the similarity of the six composite indicators, we established a typology of the 96 French Departments, grouping them into homogeneous classes relative to the six dimensions considered.

4. Results

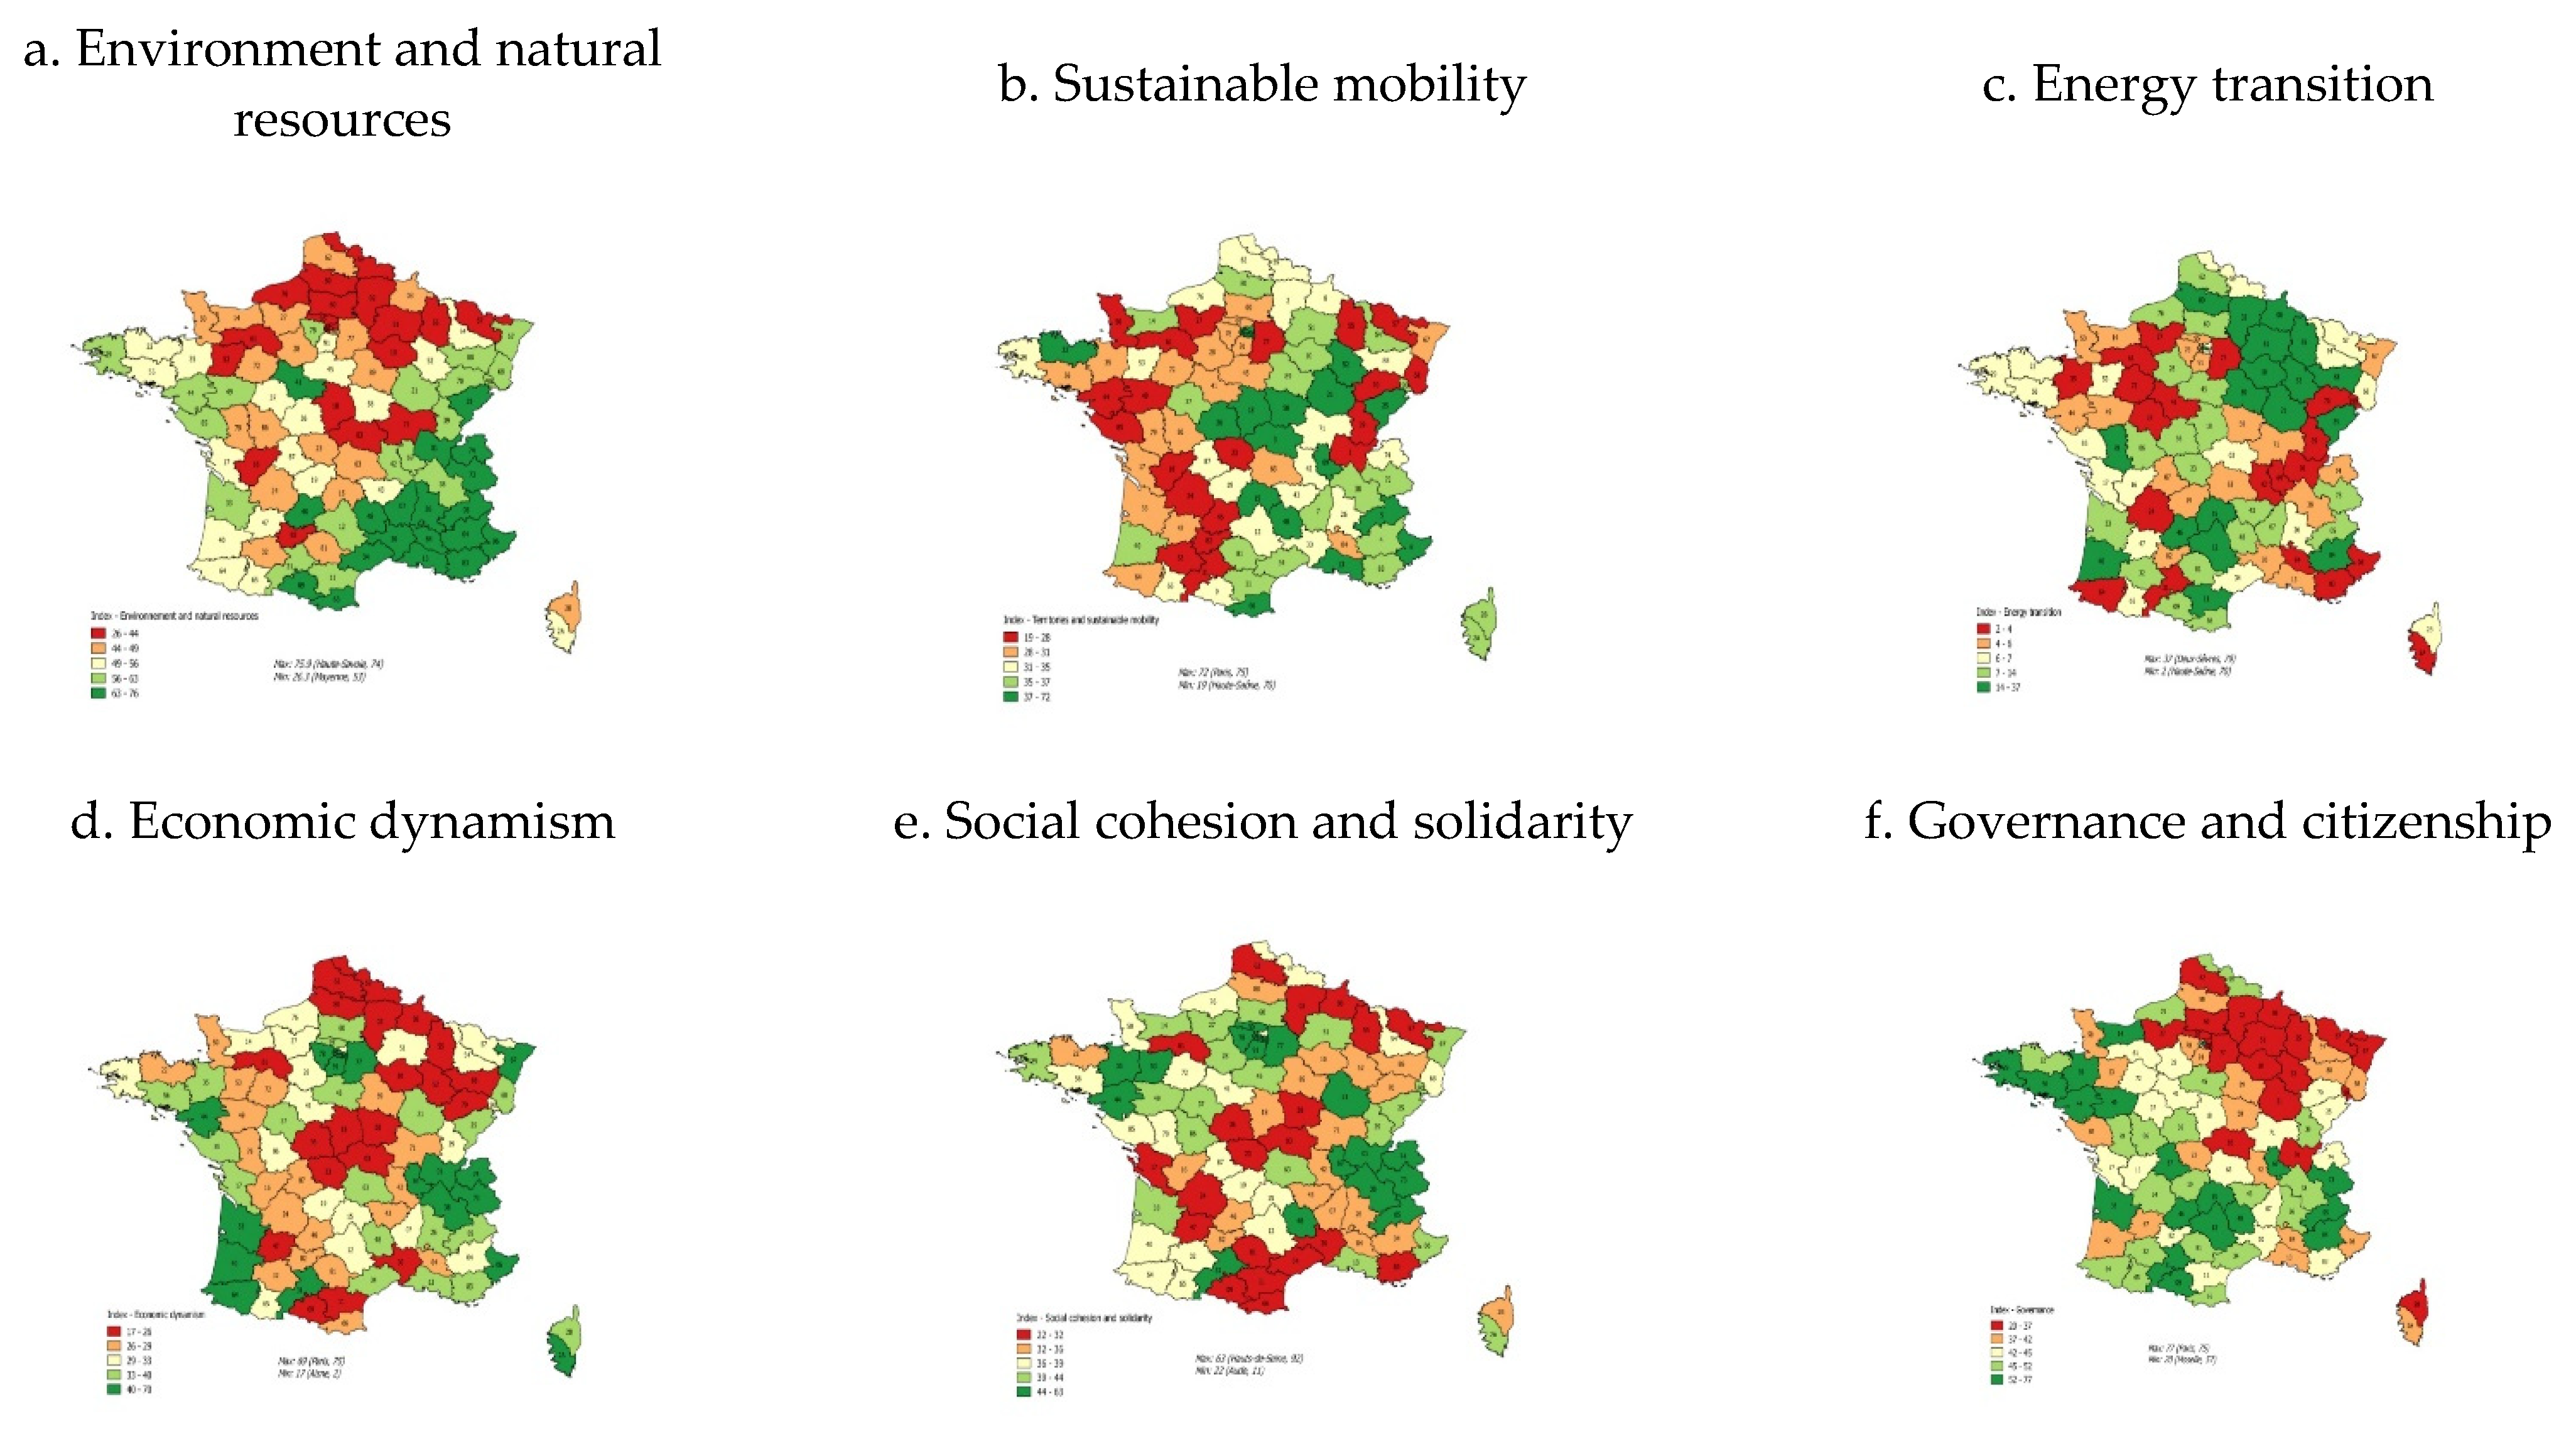
4.1. Spatial Exploratory Analysis of the Sustainable Development Indices of French Departments

The results for each of the six indices were analyzed by cartographical support to compare the performance of each department. Figure 1 below depicts indices results in five quintiles, so that higher index performances are shown in dark green whereas lower index performances are shown in dark red.

4.1.1. Results for the Environment and Natural Resources Sub-Index

Generally speaking, there is a clear spatial distribution of the index throughout the country (see Figure 1a). On the one hand, departments of south and especially south-eastern France show the highest values of the index with a maximum value of 75.9 for the department of Haute-Savoie (74). On the other hand, the lowest values of the index are for departments located between the center and the north of France, but especially in the northern part of the country. The minimum value of the index is reached by the Mayenne department (53) with a value of 26.3.
These spatial patterns suggest the existence of a trade-off between higher levels of population and industrial concentration and the share of artificialized surfaces. On the one hand, we observe that the departments with higher index values are those that have higher rates of non-artificialized areas and, at the same time, they present a better performance in terms of emissions of greenhouse gases. This is the case of departments such as Hérault (34), Alpes-de-Haute-Provence (4), Alpes-Maritimes (6), Pyrénées-Orientales (66), or Haute-Savoie (74), while the departments where industrial activity is more important, apart from having a lower rate of non-artificial areas, obtain worse results in terms of GHG emissions. However, there are some exceptions in which the availability of non-artificialized areas is quite high, but they generally have a low performance in terms of GHG and low shares of agricultural areas engaged in organic farming, such as case of the departments of Mayenne (53), Meuse (55), or Moselle (23). Another exception to this pattern is the case of territories having the highest urban densities but at the same time, showing the best results in terms of GHG. These surprising results can be explained by the fact that urban residents emit on average half as much CO2 as the rest of the population who need to commute for work and study reasons [65]. Paris (75) records the highest values in terms of emissions per capita (100), followed by Hauts de Seine (92) with a score of 98.37 and Seine Saint Denis (93) with 98.13. Nevertheless, it should be noticed that since these territories are highly urbanized, they are prone to record several pollution peaks.

4.1.2. Results for the Sustainable Mobility Sub-Index

From Figure 1b, we can draw an imaginary line that crosses the center of France from north to south, so that the lowest values (those in orange and red) are mostly located in the western departments of the country, while departments with a better performance are concentrated in the eastern part. This pattern may be explained in terms of agglomeration economies and demographics. On the one hand, the concentration of population and economic activities in core areas where productivity levels are higher stimulates the provision of efficient public transports to avoid congestion and commuting effects to get into large metropolitan areas, sometimes at the expense of worst public connections to the bordering departments. On the other hand, rural areas get lower performances in this domain due to the lack of critical mass of economic activities and young population. In this regard, areas characterized by an older population are more dependent on the use of private transports. Still, there are some exceptions such as Haute-Saône (70), which stands out for being the department with the minimum value of the index, 18.9. On the other hand, we find Paris region departments that have the best results in terms of territory management and sustainable mobility. In this case, the department of Paris obtains the maximum value of 71.6, as expected. It is in the largest metropolitan areas where higher levels of workers and business productivity are expected thanks to agglomeration economies. These agglomeration economies are usually capitalized in higher wages and explain the provision of better public transports connections [66,67]. Yet, in France, it is true only for the Metropole of the Great Paris that gathers Paris, Seine-Saint-Denis, Hauts-de-Seine and Seine-et-Marne, and Lyon (69). Some big cities like Nantes, Toulouse, and Lille are in departments which record bad results. It may depend on the extension of the peri-urban area. In fact, peri-urban areas are generally less well-served by public transport (i.e., bus, tramway) than urban areas, with between 16% and 33% of their inhabitants having a public transport line less than one kilometer away compared to 73% to 99% in urban areas [68]. The peri-urban areas are much more captive of the car with longer weekly trips than urban workers to workplaces or shopping centers [69,70].

4.1.3. Results for the Energy Transition Sub-Index

From the Figure 1c, we can say that, on the one hand, results included in the first deciles are concentrated along the west and in the most eastern Mediterranean departments. In this regard, we could say that some of the most touristic departments have a worse performance in terms of transition towards the consumption and production of renewable energies. This is not the case of the department getting the minimum value of 1.8, that is, Haute-Saône (70). It is worth noting that most indicators used in this dimension of the index are capturing more the potential than the production or consumption of renewable energies. On the other hand, the departments with higher results are concentrated in some departments of the north-eastern part of the country. Even so, the department that presents the maximum value of the index is located in the other extreme of the country, that is to say, in the west, being the department of Deux-Sèvres (79) with a value of 37.2. Therefore, this index seems to be a clear indicator of local efforts towards the energy transition driven by local policy. Therefore, it seems that French departments must continue to devote all their efforts to achieve energy transition in all areas of the economy.

4.1.4. Results for the Economic Dynamism Sub-Index

From Figure 1d, two main facts stand out. First, we find a clear concentration of lower scores in the north-eastern departments of France. The minimum value is given by the department of Aisne (2) with a score of 17. However, we find very low values in some central departments (Lot-et-Garonne (47), Indre (36), or Creuse (23)) or in the south of France (Ariège (9) and Aude (11)). On the other hand, the spatial distribution of the departments with the best results is quite homogeneous. In fact, we can say that the departments with a greater economic dynamism are those located in the Parisian region and its environments. They are followed by departments around major capitals such as Toulouse, Bordeaux, Lyon, and Nantes. We can notice the very good performance of Haute-Savoie and Savoie that combine industrial dynamism and tourism. It ranks them in the third and fifth ranks among Parisian departments. Thus, it seems clear that agglomeration economies arising in densely populated areas provide a set of advantages (e.g., specialized labor markets, availability of suppliers, or knowledge spillovers) that foster their economic attractiveness. However, there are some exceptions, such as in the case of Corse-du-Sud (2A) or Alpes-Maritime (06), and to a lesser extent, Var (83) and Vendée (85). Their good performance may be explained by a successful diversification strategy, mostly based on tourism but also in other industrial activities as well as the entrepreneurial spirit characterizing these areas [71]. In any case, the French capital is clearly much above the rest with the maximum value of 69.9.

4.1.5. Results for the Social Cohesion and Solidarity Sub-Index

The information stemming from Figure 1e can be summarized in two main facts. First, we find a clear concentration of higher scores in terms of social cohesion and solidarity in densely populated departments and with a greater concentration of economic activity, such as the departments of Rhône (69), Haute-Garonne (31), or Loire-Atlantique (44). It is also worth highlighting the concentration of high values in the departments located around the departments of Haute Savoie (74), Rhône (69), Savoie (73), Isère (38), Ain (1), and Hautes-Alpes (06). These departments, characterized by a peaceful living environment and cheaper real estate, are attracting the neo-rurals and commuters who come to settle green while working in the city (i.e., Lyon), and also contribute to maintain shops and jobs [71]. The highest scores are also found in Paris and its surroundings with a maximum value of 62.9 for the Hauts-de-Seine department (92). These areas concentrate a young population with higher education and income levels since there they find a larger supply of amenities, services, and job opportunities. Second, there is a greater spatial dispersion of the departments with the lowest values of the index. However, we find a certain concentration of the lowest values in the Eastern Pyrenees and the Mediterranean coast. The minimum value of 21.8 is given by the department of Aude (11). Still, we also find results below the average for some departments of northern France (Aisne (2), Ardennes (8), or Pas-de-Calais (62)) and the center-west (Allier (3), Creuse (23), Dordogne (24), or Lot-et-Garonne (47)). In this case, these are departments with lower income levels as well as low shares of young and skilled populations. Moreover, they have lower performances in terms of gender inequalities and the share of the area covered on 4G.

4.1.6. Results for the Governance and Citizenship Sub-Index

Broadly speaking, from Figure 1f, we could draw a diagonal axis (the inverse of the diagonal du vide) that crosses France from the department of La Manche (50) to Gard (30), leaving below the diagonal the departments with the highest results of the index. Indeed, there is traditionally a stronger abstention rate at the east of Le Havre, Paris, Marseille line [72]. The territories above the east of this line (including the former Haute-Normandie) are notably characterized by less dynamism in terms of job creation [73] and by an accumulation of unfavorable social indicators [74], which partially explain these high rates of abstention. However, it should be noted that we find some exceptions in the departments of Haute-Provence (4), Hautes-Alpes (5), Calvados (14), and North (59). All these departments are characterized by higher scores in terms of the participation rate in the last presidential elections and the share of the ecologist vote as well as the associationism phenomena which seems to be an important cultural factor in the area. In addition, in this dimension, Paris also gets the maximum value with an index of 76.8. On the other hand, the lowest values in terms of Governance and citizenship occur for the departments of north-eastern France, especially in departments bordering Germany and Luxembourg. In this case, the department that shows the lowest score is that of Moselle (57) with 19.8.
All in all, main results can be summarized as follows:
  • Paris and its neighboring departments get the highest values for all the indices apart from for the environment and natural resources.
  • Besides the case of Paris, this fact also holds for the departments holding some of the most important capitals of France such as Lyon (Rhône (69)), that is placed among the first positions in each of the dimensions with the main exception of the energy transition index, which leads to the worst scores for these departments.
  • The empty diagonal (diagonal du vide) can only be confirmed for the following dimensions: environment and natural resources, economic dynamism, and social cohesion and solidarity, confirming the lack of economic dynamism and depopulation in these areas [75].
  • Broadly speaking, the lowest scores or, in other words, values associated to the first deciles of the distribution of the index, can be mainly found in the departments of the north of France, except for the energy transition dimension, for which its departments are better off in the rest of the French departments.

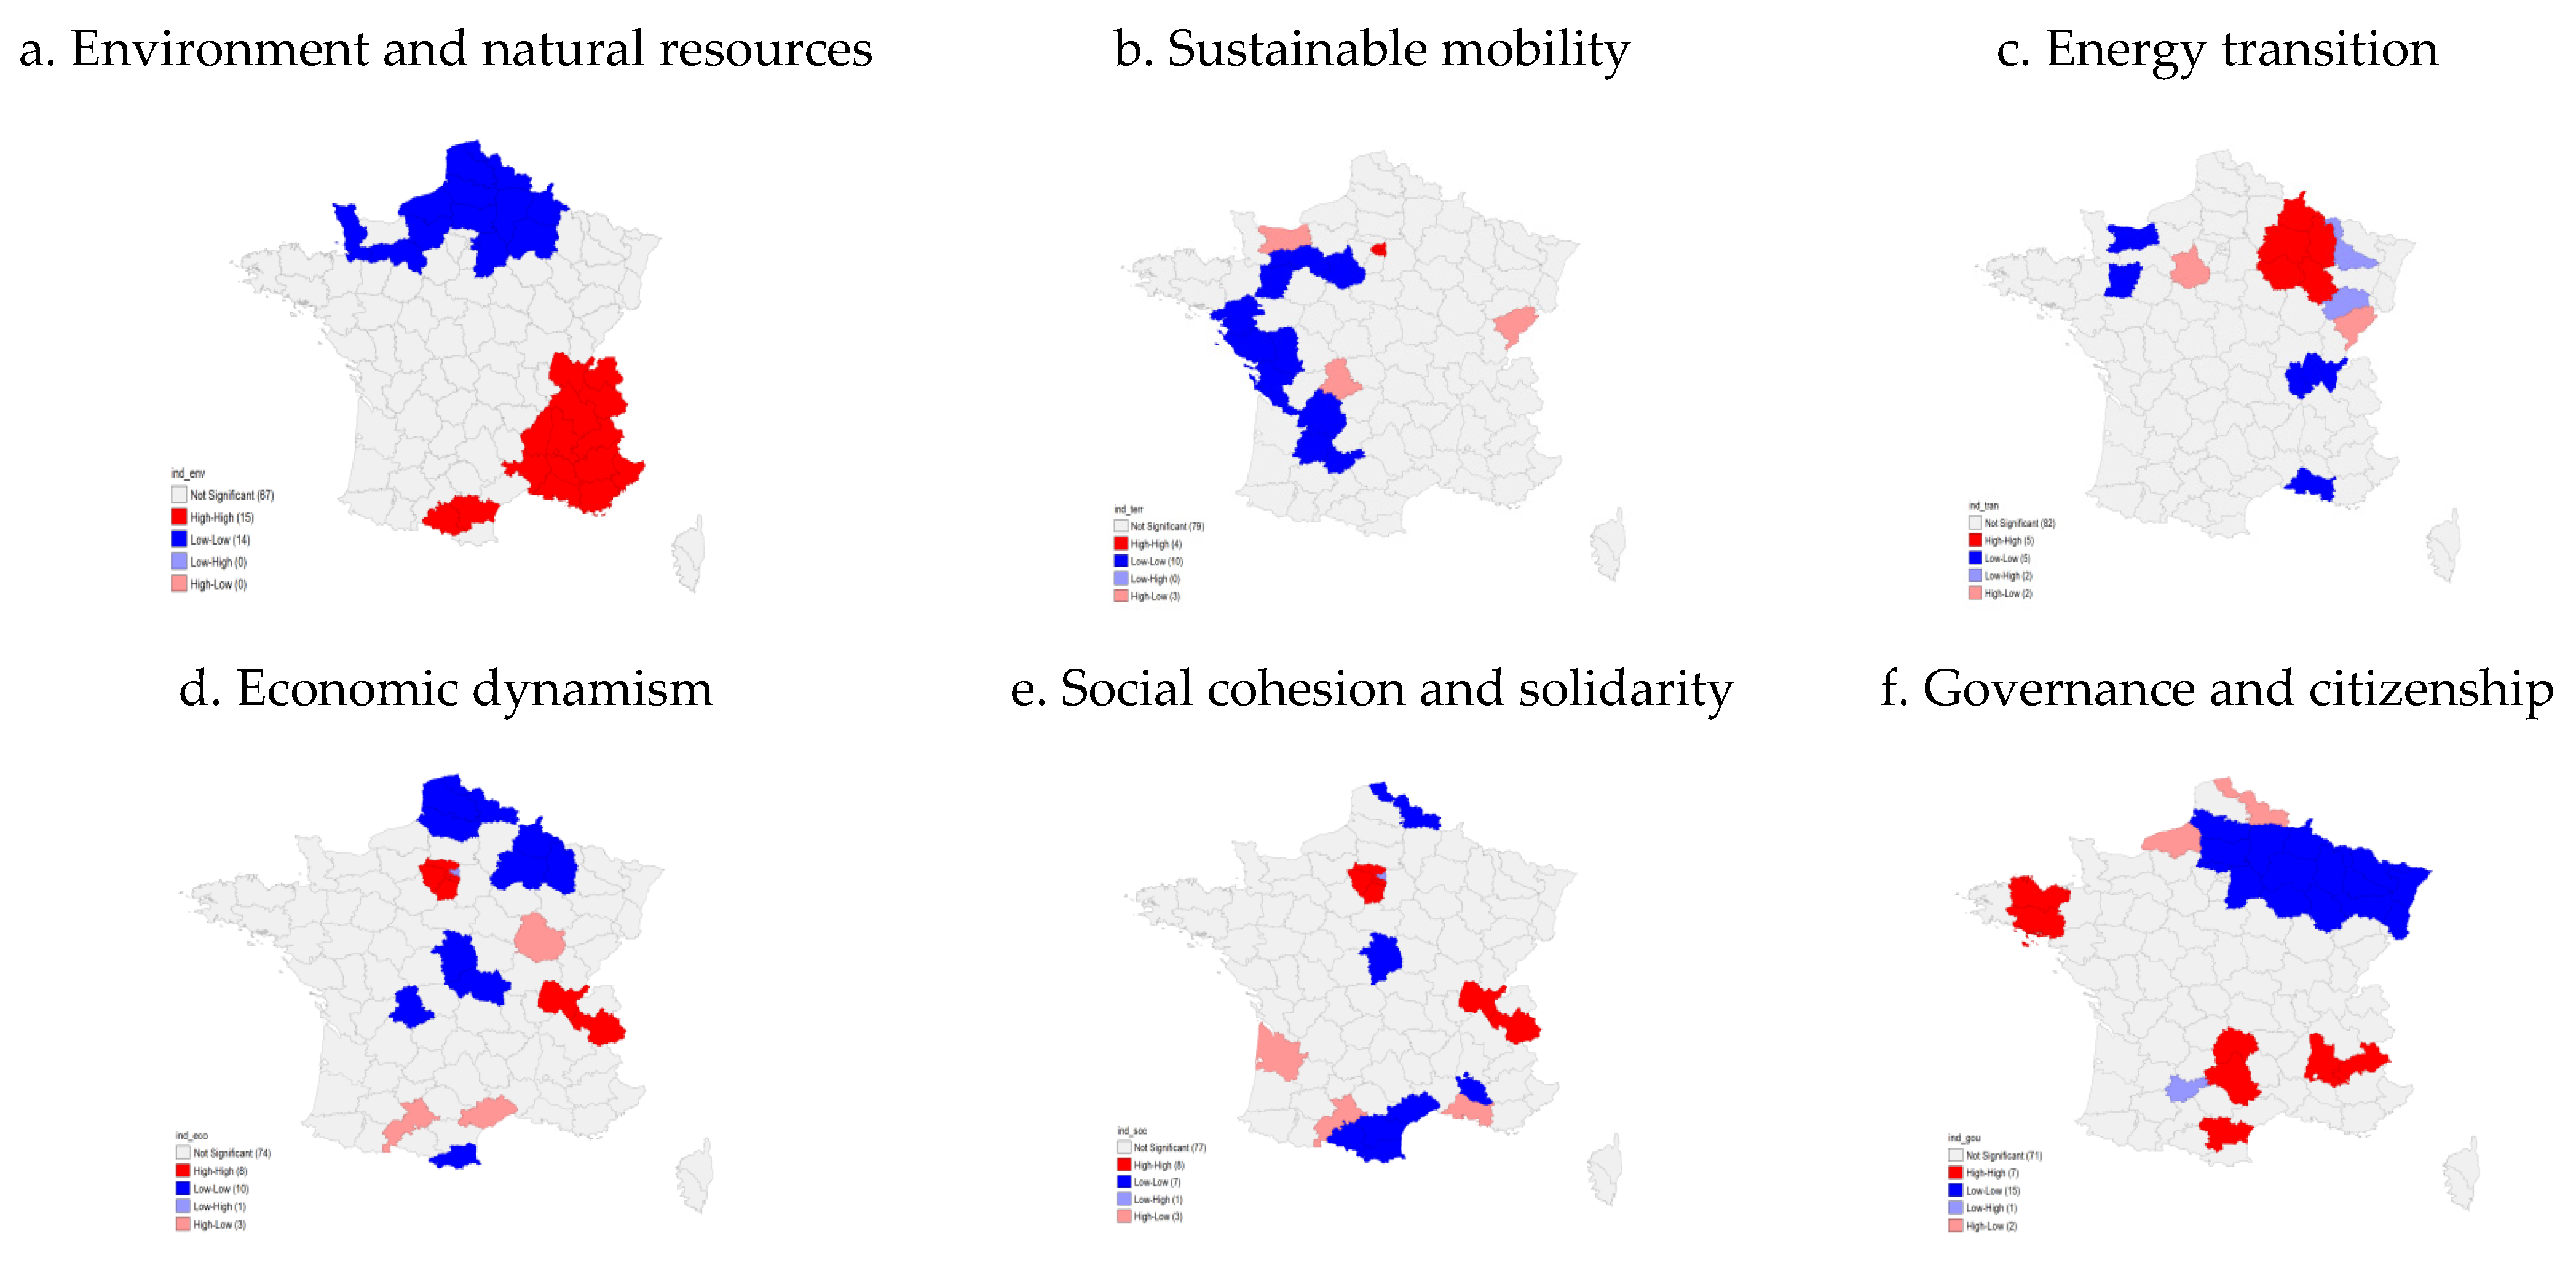
4.2. Spatial Explanatory Analysis

All the evidence gathered in the previous section suggests the existence of spatial dependence in the sustainable development performance in French departments. To test this, we applied the Global Moran’s I statistic.
The Global Moran’s I statistic was used to determine whether there is a spatial correlation of the development index among the French departments, as well as the concentration patterns of homogeneous or opposite values. Results shown in Table 2 reveal a high degree of spatial autocorrelation for most of the composite indices of sustainable development. Among them, the dimension environment and natural resources is the dimension showing the highest value (0.56), while the sustainable mobility dimension is the one getting the lowest value (0.11). These results may be to a large extent explained by the fact that there is a strong positive correlation between departments that have a greater endowment of natural resources that goes beyond the limits of the department, as opposed to sustainable mobility. Infrastructures and public services that allow for sustainable mobility are usually designed at a smaller geographical scale than that of the department, such as agglomerations or Labor Force Areas.
Beyond global spatial autocorrelation measures, it is important to notice that spatial dependence phenomena could be local in nature rather than global, so we must check whether the results are driven by the general characteristics of the data or the territory under analysis or, on the contrary, driven by specific local characteristics that exist only in some areas. Accordingly, we have estimated a Local Moran’s I for the six dimensions (Figure 2), where red areas indicate high–high spatial autocorrelation (cluster of high values surrounded by high values), dark blue areas indicate low–low spatial autocorrelation (a cluster of low values surrounded by low values), light blue areas indicate low–high spatial autocorrelation (an outlier where a low value is mainly surrounded by high values), light red areas indicate high–low spatial autocorrelation (an outlier where a high value is predominantly surrounded by low values), and white areas indicate that spatial autocorrelation is not significant.
The maps in Figure 2 show that spatial autocorrelation differs by geographical area and each of the six dimensions of sustainable development. Specifically, for the environment and natural resources dimension (a), there is a clear association of low–low values in the North, whereas in the South-eastern areas, there is high–high spatial autocorrelation. The same pattern holds for the governance and citizenship dimension (f). The opposite occurs for the energy transition dimension (c) because the spatial autocorrelation tends to be positive in North-eastern departments. The three remaining dimensions show differentiated patterns. First, there is a clear association of low–low values throughout the Western departments for the Sustainable mobility dimension (b). For the economic dynamism dimension (d), low–low values are found in the North and center of France, while there is a high–high positive association of values between the departments of the Paris region and around Lyon-Rhône (69). Finally, for the social cohesion and solidarity (e), whereas there is an association of low–low values in some departments of the North, in the center and South departments, there is a high–high positive association of values between the departments of the Paris region and around Lyon-Rhône (69).
These results confirm our expectations about finding that good (bad) performers departments are mostly surrounded by good (bad) performers in almost all the dimensions of sustainable development.

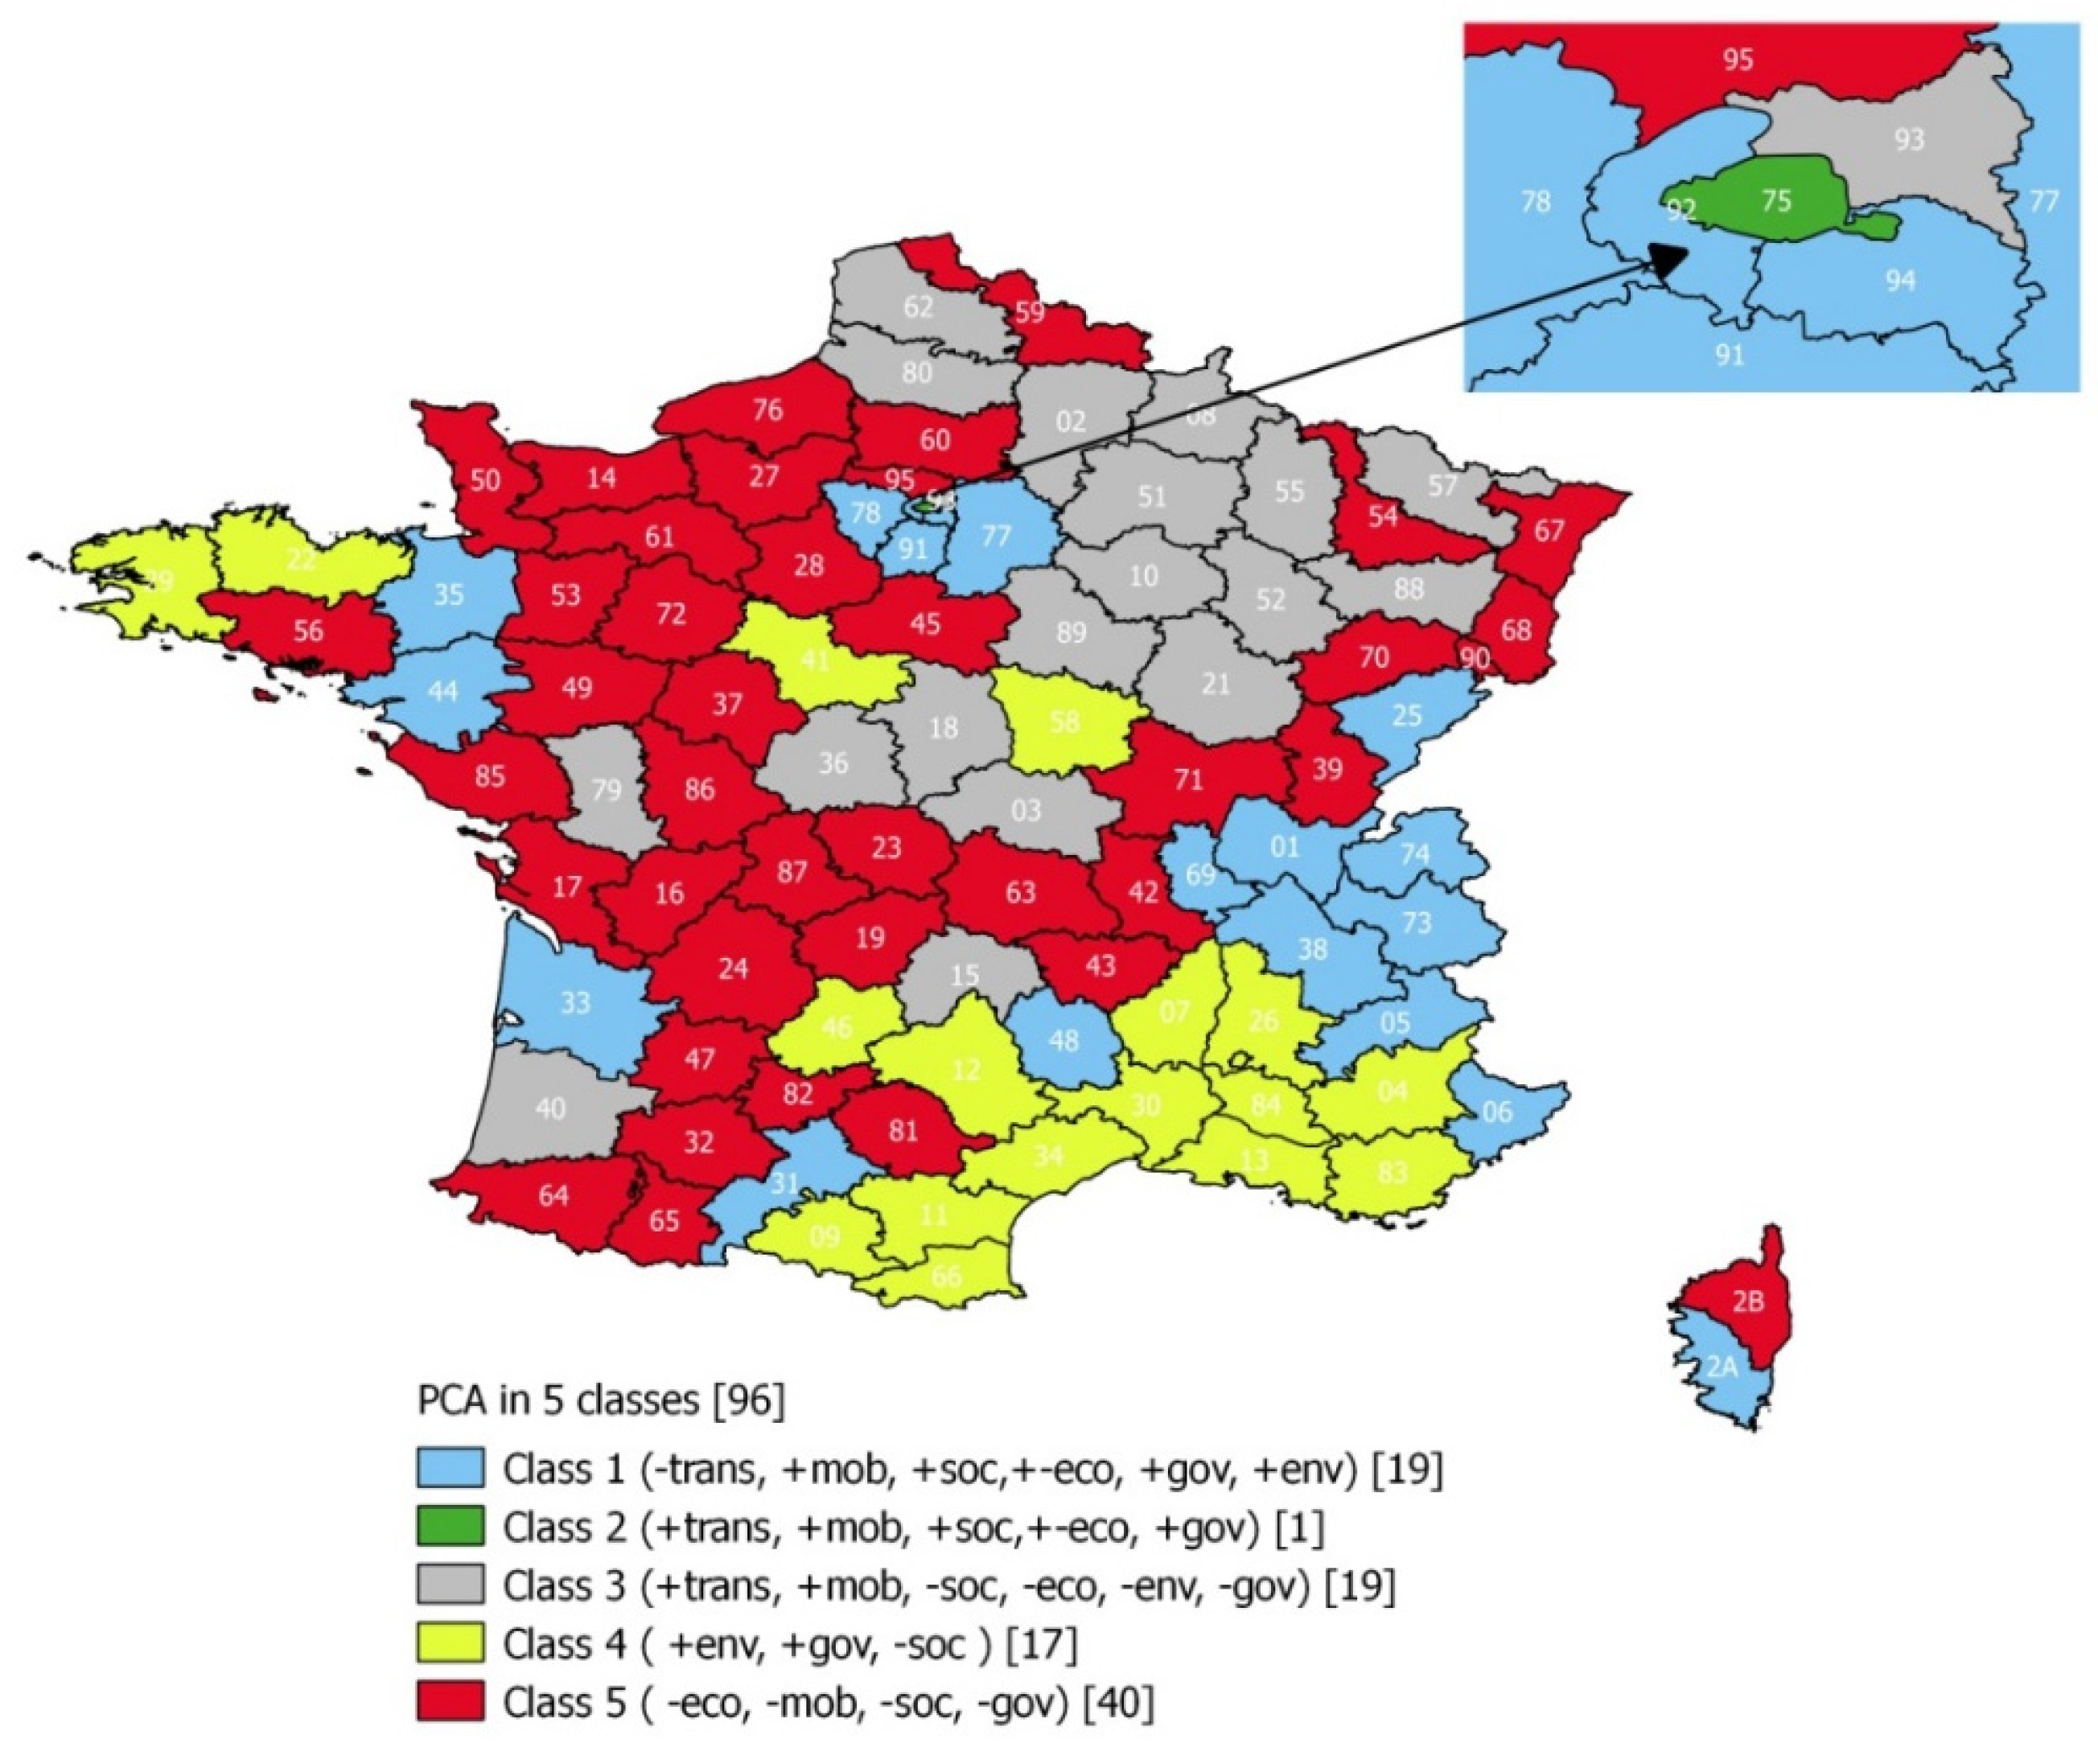
4.3. Typology of Sustainable Development in the French Departments

To classify French deparments in terms of sustainable development, we apply a hierarchical ascendant classification (HAC) to the six composite indices previously calculated, namely ind_env (environmental and natural resources), ind_mob (sustainable mobility), ind_trans (energy transition), ind_eco (economic dynamism), ind_soc (social cohesion and solidarity), and ind_gov (governance and citizenship).
Table 3 illustrates some summary descriptive statistics relative to the six indices. The coefficient of variation is an appropriate statistic to compare the dispersion level of several series: it ranges from 19.85% for the social cohesion and solidarity index to 79.20% for the energy transition index. Most of the indices are around 20%, except for the energy transition index. The latter reveals a higher heterogeneity between the 96 departments with regards to the development of renewable energies. The energy transition index ranges from 1.88 in Haute Saône to 37.19 in Deux-Sèvres. Energy transition is the dimension showing lower values. According to these results, lower levels of disaggregation are associated with a more important production capacity installed in renewable energy. In other words, some sources of renewable energy are totally absent in several departments. Moreover, as already mentioned, this index suffers from a lack of information due to data availability constraints. The first three axes of dispersion of factors, as revealed by the PCA, summarize more than 78.2% of the information regarding the six components of sustainable development.
In addition, we have implemented tests of equality of means between French regions (Table 4). Results show that the means between the French departments are significantly different at the 0.05 significance level for five of the six dimensions of sustainable development. Only the energy transition dimension does not differ by region. Two explanations can be advanced to explain this result. The first one is related to the lack of information available to build the energy transition index. The second is associated with the French regional energy policy, the SRCAE, that sets out quantitative objectives in terms of development of renewable and energy recovery, especially in heating network installations. However, differences exist in the choice of renewable energy sources, in particular due to regional specificities related to geography or climate [76]. Besides the energy transition dimension, another interesting result is the higher significant performance of the Île de France department for the index of social cohesion and solidarity in comparison to the rest of the departments. This result may be explained by the larger supply of amenities, services, and job opportunities emerging in the most populated areas.
Using an HAC according to the six dimensions of sustainable development with the Ward criterion (Generalized Ward’s Criteria, i.e., aggregation based on the criterion of the loss of minimal inertia) allows us to identify five distinct sustainable development classes in France. To assess the stability of obtained classes of HCA, we have consolidated all the classes, using a non-hierarchical cluster analysis, which is more robust, with mobile centers (kmeans). Table 5 summarizes the main results and profiles of the five classes of the French departments, obtained after cutting the hierarchical tree according to a judicious choice of the aggregation index. Figure 3 depicts French departments’ performance in terms of sustainable development classes.
The first class includes around 20% of the departments that present good performances in five dimensions of sustainable development, namely, ind_soc, ind_eco, ind_env, ind_mob, and ind_gov. By contrast, the performance in the energy transition dimension, ind_trans, is significantly below the average of the 96 French departments. Two poles emerge, departments around Paris (Seine-et-Marne, Yvelines, Essonne, Val-de-Marne, and Hauts-de-Seine) and departments of the east south-east part of France—the ancient Rhône-Alpes region with Hautes-Alpes (Ain, Hautes-Alpes, Isère, Rhône, Savoie and Haute-Savoie). Several other departments are rather isolated except for two contiguous ones, Loire-Atlantique and Île-et-Vilaine.
The second class only includes one department, Paris, which is characterized by five performance indices significantly higher than the average of the 96 French departments. This class has strong similarities with the previous class: it performs better than the average for the six dimensions, including the same dimensions in class 1. However, it has no weaknesses since its performance in terms of environment and natural resources is not significantly different from that of the French average. The department of Paris is an urban department, where population and jobs are highly concentrated. As a metropolis, Paris has developed an efficient public transport system with the metropolitan underground shuttle, railway stations, and bus lines reducing the number of daily trips to work and studies done by private car. Moreover, economic dynamism is important, households’ services are diverse, numerous, and of high quality, and energy networks are also well developed.
The third class includes 19 departments—as for the first class—and shows good performances in terms of energy transition and sustainable mobility. But this class is lagging behind for the other four dimensions of sustainable development. The departments belonging to this class are mainly grouped in the East North-Eastern part of France.
The fourth class encompasses 17 departments mainly located in the south of France, with the exceptions of two departments of Brittany: Côtes-d’Armor and Finistère. This class is characterized by good performances in terms of environment and natural resources and governance and citizenship but suffers from poor results concerning social cohesion and solidarity.
The last class is the most important since it includes 40 departments. It is characterized by not showing any performance higher than the French average. Indeed, it presents many weaknesses in terms of sustainable development since it is lagging behind in four of the six dimensions considered, namely economic dynamism, environment and natural resources, sustainable mobility, and social cohesion and solidarity.
Finally, we test whether there is a potential regional effect explaining the classification of departments in these five classes. To do so, we applied the Cramer’s V association measure [51] to measure the link between two discontinuous variables, namely the sustainable development profile highlighted by the classification, on the one hand, and the region of belonging, on the other hand. This measure is a variant of the Pearson chi square statistic adjusted to the sample size and scaled as to vary between 0 (complete independence of the variables) and 1 (complete dependence). It is usually accepted that if the Cramer’s V is less than 0.1, the relationship between the two considered variables is weak. With our data, the Cramer’s V measure is equal to 0.5. Thus, we cannot exclude a regional effect on the different sustainable development profiles established. An alternative statistic to evaluate the independence between nominal variables is the Pearson chi-square statistic. Built from a contingency table, it is based on the distance between the actual frequency values from the joint distribution of the two variables and the expected (theoretical) frequency values under independence. An underlying assumption in the implementation of this test is that there should be no expected frequency values less than 1 and that the proportion of expected frequency values below 5 should not exceed 20%. Both requirements are not fulfilled with our data.

5. Discussion

In this paper, we showed that there are relevant regional differences in terms of sustainable development that need to be considered when implementing the SDGs-based policies.
First, given that almost 50% out of the 96 French departments present a low performance in all the six considered dimensions of sustainable development, policy makers should put forth all their efforts to gradually adopt a new productive system based on new modes of production and consumption. This should lead to the use of more renewable energy resources, to the adoption of new behaviors, and new means of transportation to preserve fossil resources and limit GHG emissions.
Yet, some problems arise with the lack of completeness and consistency in the system of policy aims [77]. Very often, targets are declined in sub-objectives that are not ranked and may evolve in time [78].), because priorities are not well designed, social consequences not well evaluated, and natural resources are limited, changes in policies for sustainable development increase uncertainty for green entrepreneurs.
For example, the development of European bioenergy policy, favoring the biofuel, was first a means to increase the share of renewable energy but also a means to decrease GHG emissions, to insure the security in resources, and to develop rural areas. Yet, “The contribution of energy crops grown on agricultural land is viewed critically, because food and feed production may be displaced to former natural areas such as forests and grasslands” [77].
Another example comes from the protestation movement of the “yellow vests” initiated in France in November 2018. It results from an increase in car fuel prices thanks to an increase in carbon taxes. It has shown the need to design a fair ecological taxation to support the most vulnerable households, ensuring that all sectors contribute, such as air, road transport, and industry, and by preserving the budget of the most modest households. “Policy makers have only limited control over the consequences of their action, causing their failure in anticipating some possible policy side effects [79].
It should be mentioned that social acceptance is crucial for achieving climate targets. Public opposition at the community level can delay or obstruct the implementation of local policies aiming to a more sustainable development, for example renewable energy investments. Indeed, electricity generating technologies from renewable energy have local externalities on the landscape, noise, and the local ecosystem, and thus, the establishment of wind farms in the French countryside arouses protest movements and conflicts at the local level, stopping some planned development projects. More recently, the earthquakes in eastern France have led to the shutdown of deep geothermal energy projects. Thus, consultation and collaboration among the various local and national actors seem to be necessary to bring about a consensus aiming at the acceptance of sustainable development policies.
In short, relevant policies are difficult to implement. It is always a trade-off between flexibility and stability. Flexibility because technological, social, or even geopolitical uncertainties need to frequently adapt environmental policies, and stability because green entrepreneurship and venture capital must have at least a medium-term visibility about the rules that are applied, especially in terms of tariffs, which must also be relevant (for example, as the State’s supports for the purchase of electricity or gas is significant in the methanization process, this can lead to a major change in the orientation of what should be a circular economy. If prices are too high, the goal changes: it is no longer a question of recovering waste but of producing waste to feed the methanizer).
Finally, agglomeration economies may explain better performances in each of the dimensions of sustainable development. In the most populated departments (i.e., the regions of Paris and Lyon), the lack of natural resources in urban areas and the possibility to develop renewable energies is clearly cancelled out by a more efficient use of public infrastructures and systems. However, this is not the case for all the most important departments in economic and population terms. Therefore, regional policies such as the DATAR (Délégation interministérielle à l’aménagement du territoire et à l’attractivité régionale) with an economic competitiveness aim associated to secondary centers in more rural areas may not always be successful in promoting sustainable development [80,81].

6. Conclusions

This paper provided an evaluation framework for comparing sustainable territorial development in French NUTS3 regions (departments). The departments’ performance in terms of sustainable development was analyzed though different approaches. First, we proposed a set of six composite indices considering six dimensions associated to sustainable development (i.e., environment and natural resources, energy transition, sustainable mobility, economic dynamism, social cohesion and solidarity, and governance and citizenship). Second, we analyzed whether there is any spatial autocorrelation explaining the performance of the indices. Third, by applying a hierarchical ascendant classification (HAC), we can classify French departments into five classes.
Specifically, our results suggest that: (i) better performances in the different indices capturing regional sustainable development are generally associated to most densely populated departments, except for the environment and natural resources and energy transition dimensions; however, (ii) this result does not hold for some of the most important capital departments (i.e., Marseille (13), Gironde (33), Nantes (44), or Lille (59)). (iii) There is a significant spatial dependence on the performance of French departments, and (iv) from the HAC analysis, we identified five types of sustainable development profiles: Paris, itself, constitutes the Sustainable Metropolitan class thanks to its advance in five of the six indices except for the environment and natural resources dimension. Energy transition laggards and advances in energy transition and mobility classes present different and opposite characteristics according to the sustainable development and the least virtuous class, concentrating 42% of the departments with the worst performance in all the considered dimensions. These findings allow for the diagnosis of strengths and weaknesses of the departments on each of the considered dimensions by identifying areas that should be addressed by policy makers.
However, the present study has some limitations. The complexity behind the design and the implementation of composite indices implies that our results should be carefully interpreted. Even though our indices satisfy the main requirements of a well-defined composite index, the intrinsic choices in terms of the selection of variables, methods of aggregation, and normalization have a significant effect on the results. In the same way, any future research should focus on the use of alternative indicators for capturing the energy transition dimension. Although the index on energy transition pretends to capture the technological transformation of the global energy system, the set of selected indicators are capturing more the potential than the production or consumption of renewable energies. Unfortunately, detailed data on the production and consumption of renewable energies are not available at the department level. The empirical analysis could be extended by considering the temporal dimension to better understand departmental efforts in terms of promoting the sustainable transition of the economy as long as data for each of the suitable indicators are available.

Author Contributions

Conceptualization, the writing, review and editing, project administration funding acquisition, J.B.; data preparation and cleaning, methodology, cartography, writing and original draft preparation, E.C.-M.; methodology, validation, formal analysis, review and editing and project administration, P.R.-M. All authors have read and agreed to the published version of the manuscript.

Funding

This project was funded by the Region of Normandy in the frame of RIN’s (Recherche d’Intéret(s) Normand(s)) project: SETTEEC (Système Entrepreneurial et Territorial pour la Transition Energétique et l’Economie Circulaire).

Institutional Review Board Statement

Not applicable.

Informed Consent Statement

Not applicable.

Data Availability Statement

Not applicable.

Conflicts of Interest

The authors declare no conflict of interest.

References

  1. Brundtland, G.H.; Khalid, M.; Agnelli, S.; Al-Athel, S.; Chidzero, B. Our Common Future; Oxford University Press: New York, NY, USA, 1987. [Google Scholar]
  2. Sachs, J.; Schmidt-Traub, G.; Kroll, C.; Lafortune, G.; Fuller, G. Sustainable Development Report 2019; Bertelsmann Stiftung and Sustainable Development Solutions Network (SDSN): New York, NY, USA, 2019; Volume 2. [Google Scholar]
  3. Secundo, G.; Ndou, V.; Del Vecchio, P.; De Pascale, G. Sustainable development, intellectual capital and technology policies: A structured literature review and future research agenda. Technol. Forecast. Soc. Chang. 2020, 153, 119917. [Google Scholar] [CrossRef]
  4. Polido, A.; Pires, S.M.; Rodrigues, C.; Teles, F. Sustainable development discourse in Smart Specialization Strategies. J. Clean. Prod. 2019, 240, 118224. [Google Scholar] [CrossRef]
  5. Davidescu, A.A.; Apostu, S.A.; Pantilie, A.M.; Amzuica, B.F. Romania’s South-Muntenia Region, towards Sustainable Regional Development. Implications for Regional Development Strategies. Sustainability 2020, 12, 5799. [Google Scholar] [CrossRef]
  6. De Charentenay, J.; Leseur, A.; Bordier, C. Regional Climate-Air-Energy Plans: A tool for guiding the energy and climate transition in French regions. CDC Clim. Rep. 2012, 36. [Google Scholar]
  7. Kwatra, S.; Kumar, A.; Sharma, P. A critical review of studies related to construction and computation of Sustainable Development Indices. Ecol. Indic. 2020, 112, 106061. [Google Scholar] [CrossRef]
  8. Guijarro, F.; Poyatos, J.A. Designing a Sustainable Development Goal Index through a Goal Programming Model: The Case of EU-28 Countries. Sustainability 2018, 10, 3167. [Google Scholar] [CrossRef] [Green Version]
  9. Cîrstea, S.D.; Moldovan-Teselios, C.; Cîrstea, A.; Turcu, A.C.; Darab, C.P. Evaluating renewable energy sustainability by composite index. Sustainability 2018, 10, 811. [Google Scholar] [CrossRef] [Green Version]
  10. Megyesiova, S.; Lieskovska, V. Analysis of the Sustainable Development Indicators in the OECD Countries. Sustainability 2018, 10, 4554. [Google Scholar] [CrossRef] [Green Version]
  11. Jin, H.; Qian, X.; Chin, T.; Zhang, H. A Global Assessment of Sustainable Development Based on Modification of the Human Development Index via the Entropy Method. Sustainability 2020, 12, 3251. [Google Scholar] [CrossRef] [Green Version]
  12. Pravitasari, A.E.; Rustiadi, E.; Mulya, S.P.; Fuadina, L.N. Developing regional sustainability index as a new approach for evaluating sustainability performance in Indonesia. Environ. Ecol. Res. 2018, 6, 157–168. [Google Scholar] [CrossRef]
  13. Theys, J. Cinquante ans de Politique Française de l’environnement: Evaluation et Perspectives L’encyclopédie du Développement Durable. 2018. Available online: http://encyclopedie-dd.org/encyclopedie/neige-neige-economie-neige-neige/4-1-les-conditions-de-vie/cinquante-ans-de-politique.html#seconde_vague_pollution_industrielle_risques_et_conservation_de_la_nature_%20extraordinaire (accessed on 24 December 2020).
  14. Raworth, K. A doughnut for the Anthropocene: Humanity’s compass in the 21st century. Lancet Planet. Health 2017, 1, e48–e49. [Google Scholar] [CrossRef]
  15. United Nations. Achieving Sustainable Development and Promoting Development Cooperation; Department of Economic and Social Affairs: New York, NY, USA, 2008; p. 295. ISBN 978-92-1-104587-1. [Google Scholar]
  16. Purvis, B.; Mao, Y.; Robinson, D. Three pillars of sustainability: In search of conceptual origins. Sustain. Sci. 2019, 14, 681–695. [Google Scholar] [CrossRef] [Green Version]
  17. Jovovic, R.; Draskovic, M.; Delibasic, M.; Jovovic, M. The concept of sustainable regional development—Institutional aspects, policies and prospects. J. Int. Stud. 2017, 10, 255–266. [Google Scholar] [CrossRef] [PubMed] [Green Version]
  18. De Perthuis, C.; Jouvet, P.A. Le Capital Vert. Une Nouvelle Perspective de Croissance. 2013. Available online: https://ideas.repec.org/p/hal/journl/hal-01411452.html (accessed on 7 January 2020).
  19. De Perthuis, C.; Solier, B. La Transition Energétique, un Enjeu Majeur Pour la Planète. Encyclopédie de l’énergie. 7 June 2018. Available online: https://www.encyclopedie-energie.org/la-transition-energetique-un-enjeu-majeur-pour-la-planete/ (accessed on 7 January 2020).
  20. Stren, R.; Polese, M. Understanding the new sociocultural dynamics of cities: Comparative urban policy in a global context. In The Social Sustainability of Cities: Diversity and the Management of Change; Polese, M., Stren, R., Eds.; University of Toronto Press: Toronto, ON, Canada, 2000; pp. 3–38. [Google Scholar]
  21. Bramley, G.; Power, S. Urban form and social sustainability: The role of density and housing type. Environ. Plan. B Plan. Des. 2009, 36, 30–48. [Google Scholar] [CrossRef]
  22. Baehler, K. Social sustainability: New Zealand solutions for Tocqueville’s problem. Soc. Policy J. N. Z. 2007, 31, 22–40. [Google Scholar]
  23. Braungart, M.; Mcdonough, W. Cradle to Cradle: Remaking the Way We Make Things; North Point Press: New York, NY, USA, 2002. [Google Scholar]
  24. Blomsma, F.; Brennan, G. The emergence of circular economy: A new framing around prolonging resource productivity. J. Ind. Ecol. 2017, 21, 603–614. [Google Scholar] [CrossRef]
  25. Boyd, J. Nonmarket benefits of nature: What should be counted in green GDP? Ecol. Econ. 2007, 61, 716–723. [Google Scholar] [CrossRef]
  26. Marsden, T. Mobilities, vulnerabilities and sustainabilities: Exploring pathways from denial to sustainable rural development. Sociol. Rural. 2009, 49, 113–131. [Google Scholar] [CrossRef]
  27. Arvin, M.B.; Pradhan, R.P.; Norman, N.R. Transportation intensity, urbanization, economic growth, and CO2 emissions in the G-20 countries. Util. Policy 2015, 35, 50–66. [Google Scholar] [CrossRef]
  28. Grossman, G.M.; Krueger, A.B. Environmental Impacts of a North American Free Trade Agreement (No. w3914); National Bureau of Economic Research, 1991. Available online: https://www.nber.org/papers/w3914 (accessed on 3 April 2020).
  29. Zuindeau, B. Analyse économique des disparités écologiques spatiales: Une étude à partir des départements français. Rev. D’économie Rég. Urbaine 2005, 3, 331–354. [Google Scholar] [CrossRef]
  30. Sterlacchini, A. Innovation, Knowledge and Regional Economic Performances: Regularities and Differences in the EU; Working Papers 260 Universita’ Politecnica delle Marche (I); Dipartimento di Scienze Economiche e Sociali: Ancona, Italy, 2006. [Google Scholar]
  31. Beugelsdijk, S.; Klasting, M.J.; Milionis, P. Regional economic development in Europe: The role of total factor productivity. Reg. Stud. 2018, 52, 461–476. [Google Scholar] [CrossRef]
  32. Renou-Maissant, P.; Abdesselam, R.; Bonnet, J. Trajectories for Energy Transition in the Countries of the European Union over the Period 2000–2015: A Multidimensional Approach; Economics Working Paper; CREM: Rennes, France, 2018. [Google Scholar]
  33. Maxwell, J. Social Dimensions of Economic Growth; University of Alabama, Department of Economics: Tuscaloosa, AL, USA, 1996. [Google Scholar]
  34. Rosenow, J.; Kern, F.; Rogge, K. The need for comprehensive and well targeted instrument mixes to stimulate energy transitions: The case of energy efficiency policy. Energy Res. Soc. Sci. 2017, 33, 95–104. [Google Scholar] [CrossRef]
  35. Hannigan, J.A. Environmental Sociology—A Social Constructionist Perspective; Routledge: London, UK, 1995. [Google Scholar]
  36. Agger, A. Involving citizens in sustainable development: Evidence of new forms of participation in the Danish Agenda 21 schemes. Local Environ. 2010, 15, 541–552. [Google Scholar] [CrossRef]
  37. Powell, F. Think globally, act locally: Sustainable communities, modernity and development. Geo J. 2012, 77, 141–152. [Google Scholar] [CrossRef]
  38. Ojala, M.; Lakew, Y. Young People and Climate Change Communication; Online Publication in Oxford Research Encyclopedia of Climate Science: Oxford, UK, 2018. [Google Scholar]
  39. Bravo, G. The Human Sustainable Development Index: New calculations and a first critical analysis. Ecol. Indic. 2014, 37, 145–150. [Google Scholar] [CrossRef]
  40. Li, X.X.; Liu, Y.M.; Song, T. Calculation of the Green Development Index. Soc. Sci. China 2014, 6, 69–95. [Google Scholar]
  41. Daly, H.E.; Cobb, J.B. For the Common Good: Redirecting the Economy toward Community, the Environment, and a Sustainable Future, 2nd ed.; Beacon Press: Boston, MA, USA, 1994. [Google Scholar]
  42. Available online: https://en.wikipedia.org/wiki/Genuine_progress_indicator (accessed on 14 January 2021).
  43. Long, X.; Ji, X. Economic growth quality, environmental sustainability, and social welfare in China-provincial assessment based on genuine progress indicator (GPI). Ecol. Econ. 2019, 159, 157–176. [Google Scholar] [CrossRef]
  44. Huang, L. Exploring the Strengths and Limits of Strong and Weak Sustainability Indicators: A Case Study of the Assessment of China’s Megacities with EF and GPI. Sustainability 2018, 10, 349. [Google Scholar] [CrossRef] [Green Version]
  45. Boos, A. Genuine savings as an indicator for “weak” sustainability: Critical survey and possible ways forward in practical measuring. Sustainability 2015, 7, 4146–4182. [Google Scholar] [CrossRef] [Green Version]
  46. Jha, S.; Sandhu, S.C.; Wachirapunyanont, R. Inclusive Green Growth Index: A New Benchmark for Quality of Growth; Asian Development Bank: Manila, Philippines, 2018. [Google Scholar]
  47. Managi, S.; Kumar, P. Inclusive Wealth Report 2018: Measuring Progress towards Sustainability; Routledge: Oxon, UK, 2018. [Google Scholar]
  48. Larissa, B.; Maran, R.M.; Ioan, B.; Anca, N.; Mircea-Iosif, R.; Horia, T.; Dan, M.I. Adjusted net savings of CEE and Baltic nations in the context of sustainable economic growth: A panel data analysis. J. Risk Financ. Manag. 2020, 13, 234. [Google Scholar] [CrossRef]
  49. Shaker, R.R.; Sirodoev, I.G. Assessing sustainable development across Moldova using household and property composition indicators. Habitat Int. 2016, 55, 192–204. [Google Scholar] [CrossRef]
  50. Nogués, S.; Gonzalez-Gonzalez, E.; Cordera, R. Planning regional sustainability: An index-based framework to assess spatial plans. Application to the region of Cantabria (Spain). J. Clean. Prod. 2019, 225, 510–523. [Google Scholar]
  51. Siegel, S.; Castellan, J.J. Nonparametric Statistics for the Behavioral Sciences, 2nd ed.; McGraw-Hill: New York, NY, USA, 1988. [Google Scholar]
  52. OECD. Measuring Sustainable Development; Candice Stevens, Statistics Brief; OECD: Paris, France, 2005. [Google Scholar]
  53. OECD. Handbook on Constructing Composite Indicators, Methodology and User Guide; OECD: Paris, France, 2008. [Google Scholar]
  54. Saltelli, A. Composite indicators between analysis and advocacy. Soc. Indic. Res. 2007, 81, 65–77. [Google Scholar] [CrossRef]
  55. Bovar, O.; Demotes-Mainard, M.; Dormoy, C. Les indicateurs de développement durable. L’économie Fr. Comptes Do. 2008, 1, 51–71. [Google Scholar]
  56. Becker, W.; Saisana, M.; Paruolol, P.; Vandecasteele, I. Weights and importance in composite indicators: Closing the gap. Ecol. Indic. 2017, 80, 12–22. [Google Scholar] [CrossRef]
  57. Miola, A.; Schiltz, F. Measuring sustainable development goals performance: How to monitor policy action in the 2030 Agenda implementation? Ecol. Econ. 2019, 164, 106373. [Google Scholar] [CrossRef]
  58. Mazziotta, M.; Pareto, A. Synthesis of indicators: The composite indicators approach. In Complexity in Society: From Indicators Construction to Their Synthesis; Springer: Cham, Switzerland, 2017; pp. 159–191. [Google Scholar]
  59. Mazziotta, M.; Pareto, A. Methods for constructing composite indices: One for all or all for one. Riv. Ital. Econ. Demogr. Stat. 2013, 67, 67–80. [Google Scholar]
  60. Ang, B.W.; Choong, W.L.; Ng, T.S. Energy security: Definitions, dimensions and indices. Renew. Sustain. Energy Rev. 2015, 42, 1077–1093. [Google Scholar] [CrossRef]
  61. Moran, P. The interpretation of statistical maps. J. R. Stat. Soc. 1948, 59, 185–193. [Google Scholar] [CrossRef]
  62. Lebart, L.; Morineau, A.; Piron, M. Statistique Exploratoire Multidimensionnelle, 3th ed.; Dunod: Paris, France, 2000. [Google Scholar]
  63. Saporta, G. Probabilités, Analyse des Données et Statistique, 2nd ed.; Technip: London, UK, 2006. [Google Scholar]
  64. Tufféry, S. Data mining et statistique décisionnelle—L’intelligence des données; Editions Technip: Pairs, France, 2012. [Google Scholar]
  65. Levy, D.; Le Jeannic, T.H.H. Un habitant de pôle urbain émet deux fois moins de CO2 que la moyenne pour se rendre à son lieu de travail ou d’études. In INSEE Première; Commissariat Général au Plan Durable: La Défense, France, 2011. [Google Scholar]
  66. Camagni, R.; Capello, R.; Nijkamp, P. Towards sustainable city policy: An economy-environment technology nexus. Ecol. Econ. 1998, 24, 103–118. [Google Scholar] [CrossRef]
  67. McCann, P.; Shefer, D. Location, agglomeration and infrastructure. In Fifty Years of Regional Science; Springer: Berlin/Heidelberg, Germany, 2004; pp. 177–196. [Google Scholar]
  68. Paul-Dubois-Taine, O.; Raynard, C.; Vielliard, F.; Auverlot, D. Les Nouvelles Mobilités Dans les Territoires Périurbains et Ruraux. Centre d’Analyse Strategique (CAS). 2012. Available online: http://archives.strategie.gouv.fr/cas/content/rapport-les-nouvelles-mobilites-dans-les-territoires-periurbains-et-ruraux.html (accessed on 7 February 2020).
  69. Coutard, O.; Dupuy, G.; Fol, S. La pauvreté périurbaine: Dépendance locale ou dépendance automobile. Espaces Soc. 2002, 108, 155–176. [Google Scholar] [CrossRef]
  70. Rougé, L. Accession à la Propriété et Modes de vie en Maison Individuelle des Familles Modestes Installées en Périurbain Lointain Toulousain. Les “captifs” du Périurbain? Ph.D. Thesis, Université de Toulouse II, Toulouse, France, 2005. [Google Scholar]
  71. Le Monde. La Prosperité à la Campagne. 10 Septembre 2019, pp. 16–17. Available online: http://lirelactu.fr/source/le-monde/bbd316c2-408c-430e-8b8c-40eb3fbb45c0 (accessed on 3 January 2020).
  72. Colange, C.; Bussi, M.; Gosset, J.P. Les élections européennes de 2009 en France. Existe-t-il un vote des grandes régions? Cybergéo Eur. J. Geogr. 2009. Available online: https://journals.openedition.org/cybergeo/22543 (accessed on 4 April 2020).
  73. Chalard, L.; Dumond, G.F. L’armature urbaine de l’emploi en France. Un basculement géographique. Popul. Avenir 2011, 704, 4–7. [Google Scholar] [CrossRef]
  74. Le Bras, H.; Todd, E. Le Mystère Français; Le Seuil: Paris, France, 2013. [Google Scholar]
  75. Oliveau, S.; Doignon, Y. La diagonale se vide? Analyse spatiale exploratoire des décroissances démographiques en France métropolitaine depuis 50 ans. Cybergeo Eur. J. Geogr. 2016. [Google Scholar] [CrossRef]
  76. Abdesselam, R.; Renou-Maissant, P.; Roussafi, F. Performances contrastées du développement des énergies renouvelables dans les régions françaises. Rev. d’Econ. Rég. Urbaine 2019, 27–54. [Google Scholar] [CrossRef]
  77. Purkus, A.; Gawel, E.; Thraen, D. Addressing uncertainty in decarbonisation policy mixes–Lessons learned from German and European bioenergy policy. Energy Res. Soc. Sci. 2017, 33, 82–94. [Google Scholar] [CrossRef]
  78. Turnheim, B.; Berkhout, F.; Geels, F.; Hof, A.; McMeeekin, A.; Nykvist, B.; Van Vuuren, D. Evaluating sustainability transitions pathways: Bridging analytical approaches to address governance challenges. Glob. Environ. Chang. 2015, 35, 239–253. [Google Scholar] [CrossRef] [Green Version]
  79. Stiglitz, J.E.; Rosengard, J.K. Economics of the Public Sector: Fourth International Student Edition; WW Norton & Company: New York, NY, USA, 2015. [Google Scholar]
  80. Berger, G. Reflections on governance: Power relations and policy making in regional sustainable development. J. Environ. Policy Plan. 2003, 5, 219–234. [Google Scholar] [CrossRef]
  81. Krueger, R.; Gibbs, D. The Sustainable Development Paradox: Urban Political Economy in the United States and Europe; Guilford Press: New York, NY, USA, 2007. [Google Scholar]
Scheme 1. Six dimensions of sustainable development.
Sustainability 13 00761 sch001
Figure 1. Sustainable development performance of French departments.
Sustainability 13 00761 g001
Figure 2. Local Index of Spatial Association (LISA).
Sustainability 13 00761 g002
Figure 3. French departments performance in terms of sustainable development.
Sustainability 13 00761 g003
Table 1. Dimensions of the composite sustainable development index: indicators and sources.
DimensionIndicatorUnitsWeightSource (Year)
Environment and natural resourcesOff-site Greenhouse Gas (GHG) emissions per capitaMillions of tonnes of CO2 per inhabitant1INERIS (2012)
Share of non-artificialized area%1Corine Land Cover (2012)
Share of Natura 2000 or ZNIEFF classified areas (Natural Areas of Ecological Interest Fauna and Flora (ZNIEFF)%1CGDD (2013)
Number of waste sorting centers per capitaCenters per inhabitant1ADEME (2012)
Share of sorted, incinerated, and recoverable household waste %1ADEME (2015)
Share of forest surface%1/3Corine Land Cover (2012)
Length of coastlineKm1/3Own elaboration by using GIS (2018)
Share of the aquatic surface%1/3Corine Land Cover (2012)
Share of agricultural areas engaged in organic farming%1Agence Bio (2017)
Sustainable developmentShare of home-to-work commuting on foot%1/2INSEE (2015)
Share of home-to-work commuting by public transport%1/2INSEE (2015)
Median home-to-work commuting distanceKm1INSEE (2014)
Share of households with two cars or more%1INSEE (2015)
Median home-to-study commuting distanceKm1INSEE (2014)
Charging stations for electric cars per 10,000 inhabitantsIndex1Association Française du Gaz Naturel pour Véhicules (2018)
Ratio of NGV stations per 10,000 inhabitantsIndex1Charge Map (2018)
Energy transitionInstalled electrical capacity installed in heating networks for 1000 inhabitantsMw per thousand inhabitants1ADEME (2017)
Growth rate of electric capacity installed in heat networks per 1000 inhabitants %1ADEME (2009–2017)
Installed electrical capacity installed in renewables for 1000 inhabitantsMw per thousand inhabitants1ADEME (2017)
Growth rate of electric capacity installed in renewables per 1000 inhabitants %1ADEME (2009–2017)
Economic dynamismEconomic dependenceIndex1INSEE (2014)
Ratio of firm creation per active population%1INSEE—SIRENE (2017)
Per capita fiscal potentialEuros per inhabitant1DGCL (2017)
Median of disposable income by consumption unitsEuros1INSEE—FiLoSoFi (2015)
Share of taxed households%1INSEE—FiLoSoFi (2014)
Unemployment rate%1INSEE (RP) (2015)
Number of overnight stays in tourist accommodationThousands of nights1/2INSEE (2017)
Number of secondary residences per 1000 inhabitantsSecondary residences per 1000 inhabitants1/2INSEE (2017)
Productivity in agriculture%1/3INSEE (CLAP) (2015)
Productivity in the industry%1/3INSEE (CLAP) (2015)
Productivity in services%1/3 INSEE (CLAP) (205)
Annual change rate of population due to net migration%1INSEE (2014)
Social cohesion and solidarityShare of women in executive and higher intellectual jobs%1INSEE—RP (2015)
Health equipments and services per capitaRatio per thousand inhabitants1INSEE (2017)
Poverty rate%1INSEE—FiLoSoFi (2014)
Inter-deciles ratio between the 9th and 1st decilesIndex1INSEE—FiLoSoFi (2014)
Share of activity revenues among reported revenues%1INSEE—FiLoSoFi (2014)
Share of the area covered on 4G%1ARCEP (2016)
Share of 15–64-year-old population in part-time employment%1INSEE—RP (2013)
Share of tertiary graduates with 15 years old or over out of school%1INSEE—RP (2015)
Share of young people neither in employment nor education%1INSEE—RP (2015)
Youth indexIndex1INSEE—RP (2015)
Cultural amenities per capitaAmenities per capita1INSEE—RP (2015)
Intermediate range of sports equipments per capitaAmenities per capita1INSEE—RP (2015)
Governance and citizenshipNumber of municipalities by department awarded by the Cit’Ergie Award 1/2ADEME (2018)
Number of municipalities by department awarded by the distinction «Territoires zéro déchet zéro gaspillage» 1/2ADEME (2015)
Share of the population covered by a Local Agenda 21 at department level%1CGDD (2014)
Number of associations promoting sustainable development per capitaNumber per inhabitant1Répertoire Nationale des Associations—OSIRIS (2018)
Number of associations per capitaNumber per inhabitant1Répertoire Nationale des Associations—(2018)
Share of the ecologist vote in the results of the first round of presidential elections in 2012%1Ministère de l’intérieur (2012)
Participation rate in the first round of presidential elections 2017%1Ministère de l’intérieur (2017)
In the weight column, green color means that the indicator is positively associated to the index, while red color is used for those indicators that, according to the literature, are negatively associated to the index.
Table 2. Spatial autocorrelation of sustainable development indices.
DimensionMoran’s Ip-Value
Environment and natural resources (env)0.56270.001
Energy transition (tran)0.21630.005
Sustainable mobility (mob)0.10830.05
Economic dynamism (eco)0.42920.001
Social cohesion and solidarity (soc)0.44590.001
Governance and citizenship (gov)0.36990.001
Table 3. Summary statistics of the six dimensions of sustainable development.
VariablesNumber of ObservationsMeanMinimumMaximumStandard
Deviation
Coefficient of
Variation (%)
ind_env9652.9826.3075.9210.6520.10
ind_mob9633.8418.9271.608.0023.64
ind_trans969.471.8837.197.5079.20
ind_eco9633.1016.9969.949.4828.64
ind_soc9638.3321.8062.937.6119.85
ind_gov9643.9819.8076.8410.0522.85
Table 4. Tests of equality of means between French regions (analysis of variance (ANOVA)).
ind_envind_mobind_tranind_ecoind_socind_gov
Bretagne52.5431.925.8133.6339.2956.29
Pays de Loire48.9528.465.4132.1741.8348.06
Normandie42.3028.485.0528.0637.3743.10
Hauts de France40.4533.2712.6723.5934.5635.49
Ile-de-France46.4341.429.0250.3353.2441.36
Grand Est48.7132.5516.6228.8735.0231.04
Centre Val de Loire51.8034.728.9329.4537.8343.91
Bourgogne-Franche-Comté55.3335.979.3829.8338.1939.80
Auvergne-Rhône-Alpes58.6336.157.1937.2140.2845.49
Provence-Alpes-Côte-d’Azur69.9240.357.7635.9037.3147.70
Occitanie60.9432.1910.1929.6733.9851.97
Nouvelle Aquitaine49.6029.2710.6331.7035.0546.66
Corse47.5435.744.9444.4337.9036.34
F-stat6.182.091.465.945.475.00
Pr > F0.000.04 a0.150.000.000.00
Notes: The maximums are written in bold and the minimums in bold italics. a We used Levene’s test to check the hypothesis of equality of the variances. This hypothesis is rejected for the sustainable mobility index (ind_mob) at the 0.05 significance level. For this index, we used Kruskal–Wallis non-parametric test instead of ANOVA.
Table 5. Synthesis of the five classes of the 96 French metropolitan departments.
Class 1Class 2Class 3Class 4Class 5
Frequency (%)19 (19.79%)1 (1.04%)19 (19.79%)17 (17.71%)40 (41.67%)
DepartmentsAinParisAisneAlpes-de-Haute-ProvenceCalvadosMorbihan
Hautes-AlpesAllierArdècheCharenteNord
Alpes-MaritimesArdennesAriègeCharente-MaritimeOise
DoubsAubeAudeCorrèzeOrne
Corse-du-SudCantalAveyronCreusePuy-de-Dôme
Haute-GaronneCherBouches-du-RhôneDordognePyrénées-Atlantiques
GirondeCôte-d’OrCôtes-d’ArmorEureHautes-Pyrénées
Ille-et-VilaineIndreDrômeEure-et-LoirBas-Rhin
IsèreLandesFinistèreHaute-CorseHaut-Rhin
Loire-AtlantiqueMarneGardGersHaute-Saône
LozèreHaute-MarneHéraultIndre-et-LoireSaône-et-Loire
RhôneMeuseLoir-et-CherJuraSarthe
SavoieMoselleLotLoireSeine-Maritime
Haute-SavoiePas-de-CalaisNièvreHaute-LoireTarn
Seine-et-MarneDeux-SèvresPyrénées-OrientalesLoiretTarn-et-Garonne
YvelinesSommeVarLot-et-GaronneVendée
EssonneVosgesVaucluseMaine-et-LoireVienne
Hauts-de-SeineYonne MancheHaute-Vienne
Val-de-MarneSeine-Saint-Denis MayenneTerritoire de Belfort
Meurthe-et-MoselleVal-d’Oise
Profile (+)+ ind_soc+ ind_mob+ ind_trans+ ind_env
+ ind_eco+ ind_eco+ ind_mob+ ind_ gov
+ ind_env+ ind_trans
+ ind_mob+ ind_gov
+ ind_gov+ ind_soc
Anti-Profile (−) − ind_trans − ind_soc− ind_soc− ind_eco
− ind_eco− ind_env
− ind_ env− ind_mob
− ind_gov− ind_soc
Publisher’s Note: MDPI stays neutral with regard to jurisdictional claims in published maps and institutional affiliations.

