Article

Multi-Temporal Built-Up Grids of Brazilian Cities: How Trends and Dynamic Modelling Could Help on Resilience Challenges?

by
Iana Rufino
1,*,
Slobodan Djordjević
2,
Higor Costa de Brito
1 and
Priscila Barros Ramalho Alves
2
1
PPGECA, Center for Natural Resources and Technology, Federal University of Campina Grande, Campina Grande, PB 58428-830, Brazil
2
Centre for Water Systems, University of Exeter, Exeter EX4 4QF, UK
*
Author to whom correspondence should be addressed.
Sustainability 2021, 13(2), 748; https://doi.org/10.3390/su13020748
Submission received: 25 November 2020 / Revised: 9 January 2021 / Accepted: 11 January 2021 / Published: 14 January 2021
(This article belongs to the Special Issue Urban Resilience in a Context of Climate Change)

Abstract

:
The northeastern Brazilian region has been vulnerable to hydrometeorological extremes, especially droughts, for centuries. A combination of natural climate variability (most of the area is semi-arid) and water governance problems increases extreme events’ impacts, especially in urban areas. Spatial analysis and visualisation of possible land-use change (LUC) zones and trends (urban growth vectors) can be useful for planning actions or decision-making policies for sustainable development. The Global Human Settlement Layer (GHSL) produces global spatial information, evidence-based analytics, and knowledge describing Earth’s human presence. In this work, the GHSL built-up grids for selected Brazilian cities were used to generate urban models using GIS (geographic information system) technologies and cellular automata for spatial pattern simulations of urban growth. In this work, six Brazilian cities were selected to generate urban models using GIS technologies and cellular automata for spatial pattern simulations of urban sprawl. The main goal was to provide predictive scenarios for water management (including simulations) and urban planning in a region highly susceptible to extreme hazards, such as floods and droughts. The northeastern Brazilian cities’ analysis raises more significant challenges because of the lack of land-use change field data. Findings and conclusions show the potential of dynamic modelling to predict scenarios and support water sensitive urban planning, increasing cities’ coping capacity for extreme hazards.

1. Introduction

Globally, more than 5.87 million km2 of land has a positive probability of being converted to urban areas by 2030, and 20% of this land (1.2 million km2) has a high probability (>75%) of urban expansion [1]. Intensive urban sprawl has been a significant challenge for regional and global sustainability [1,2]. This growth trend in urban areas causes pressure on natural and energy resources. It might result in an overload of existing urban equipment and services if they are not adequately planned to absorb the increased demands in terms of water consumption, collection and treatment of wastewater, appropriate disposal of garbage, and road support [3]. Urban growth also crucially affects flood risk [4]. Predictive models and methods that simulate these sprawl phenomena can support decision makers towards a better and more sustainable urban design. In particular, urban land-use change models are extensively applied by researchers and planners to control urban sprawl and the protection of natural space [5]. In cities, land-use changes can be speedy. Field data are essential for a good quality presentation of scenarios, to better explain land-use transitions from past to present, and to simulate future scenarios. One type of field data for urban growth trend analysis is built-up maps. The coupling of recent remote sensing technologies and spatial modelling offers the opportunity to deliver worldwide geo-datasets depicting built-up surfaces and population distribution that can be consistently used for global risk modelling, impact analysis, and policymaking in the field of disaster risk reduction [6]. In this sense, the Global Human Settlement Layer (GHSL) datasets [7] represent an unprecedented source of information for understanding global changes and trends in exposure to natural disasters. The GHSL produces continuous global-scale mapping of human settlements, servicing internationally agreed upon calls for a massive volume of multisource, multitemporal, and multiscale earth observation data [7,8]. Moreover, it operates in a fully open and free data and methods access policy. Their built-up grids represent the first multitemporal explicit description of the evolution of built-up presence since 1975 [8].
In this work, vulnerable cities from the northeastern region of Brazil were selected to test the approach based on the idea of spatial analysis and visualisation of possible land-use changes (LUC) zones and trends (urban growth vectors) can be a useful tool for planning actions or decision-making policies for sustainable development. The main goal was to calibrate a model that allows for an excellent spatial representation of the urban sprawl for future scenarios and use of those simulations for both flood preparedness and water demand planning and permits. Predictive models of urban growth can add the spatial component to those applications once it is possible to visualise the built-up growth or imperviousness increase and make cross-related analysis with population density standards.
In climate change studies, traditionally, a baseline is established, that is, a current moment or scenario, on which the impacts of the possible changes on the natural or artificial systems must be studied. However, the dynamism of urban areas is enormous. How to consider future scenarios of climatic conditions on urban systems that change so dynamically? Indeed, any study in this sense will need to consider the probabilities of changes in land use and occupation and, therefore, climate change impacts in these new (and probable) conditions. In this context, spatial predictive models simulate environmental attributes’ alteration, thus helping users to understand the causal mechanisms and the dynamics of environmental systems [9]. These models and methods can diagnose and anticipate human environments’ development by supporting decision makers, researchers, and planners to protect natural ecosystems [10,11].
One of these methods for predictions is dynamic modelling based on cellular automata (CA) [12,13,14]. The approach of representation of the space–time dynamics by cellular automata was introduced by Von Neumann and Burks [15], characterising a simple model of temporal evolution capable of exhibiting complex behaviours. Some years after, Conway [16] presented the Game of Life, where he demonstrated that elementary rules, when applied repeatedly in random states, produce similar results to the real world. The techniques and products of geographic information systems (GIS), remote sensing (RS), and dynamic spatial modelling using cellular automata (CA), have been great allies to the challenge of planning and ordering urban space and its surroundings, providing technical subsidies for the decision-making of planners and managers [17]. In this sense, [13] stated that the use of cellular automata is motivated by the ability to model the city’s evolution concomitantly with the impacts of space interventions and reproduce the distribution of growth in a spatially explicit way, allowing users to understand and improve urban land-use policies. The paper is organised as it follows. First, the concept of “natural resilience” is introduced with an application for the northeastern Brazilian region. The methodology is then presented, including the aspects related to the choice of six Brazilian cities for modelling, influencing factors, calibration, and future applications. Results express the methodology’s application, including the estimation of water demands and flood simulations (for one of the cities). Findings and conclusions express the need to combine dynamic modelling and urban planning tools in water studies.

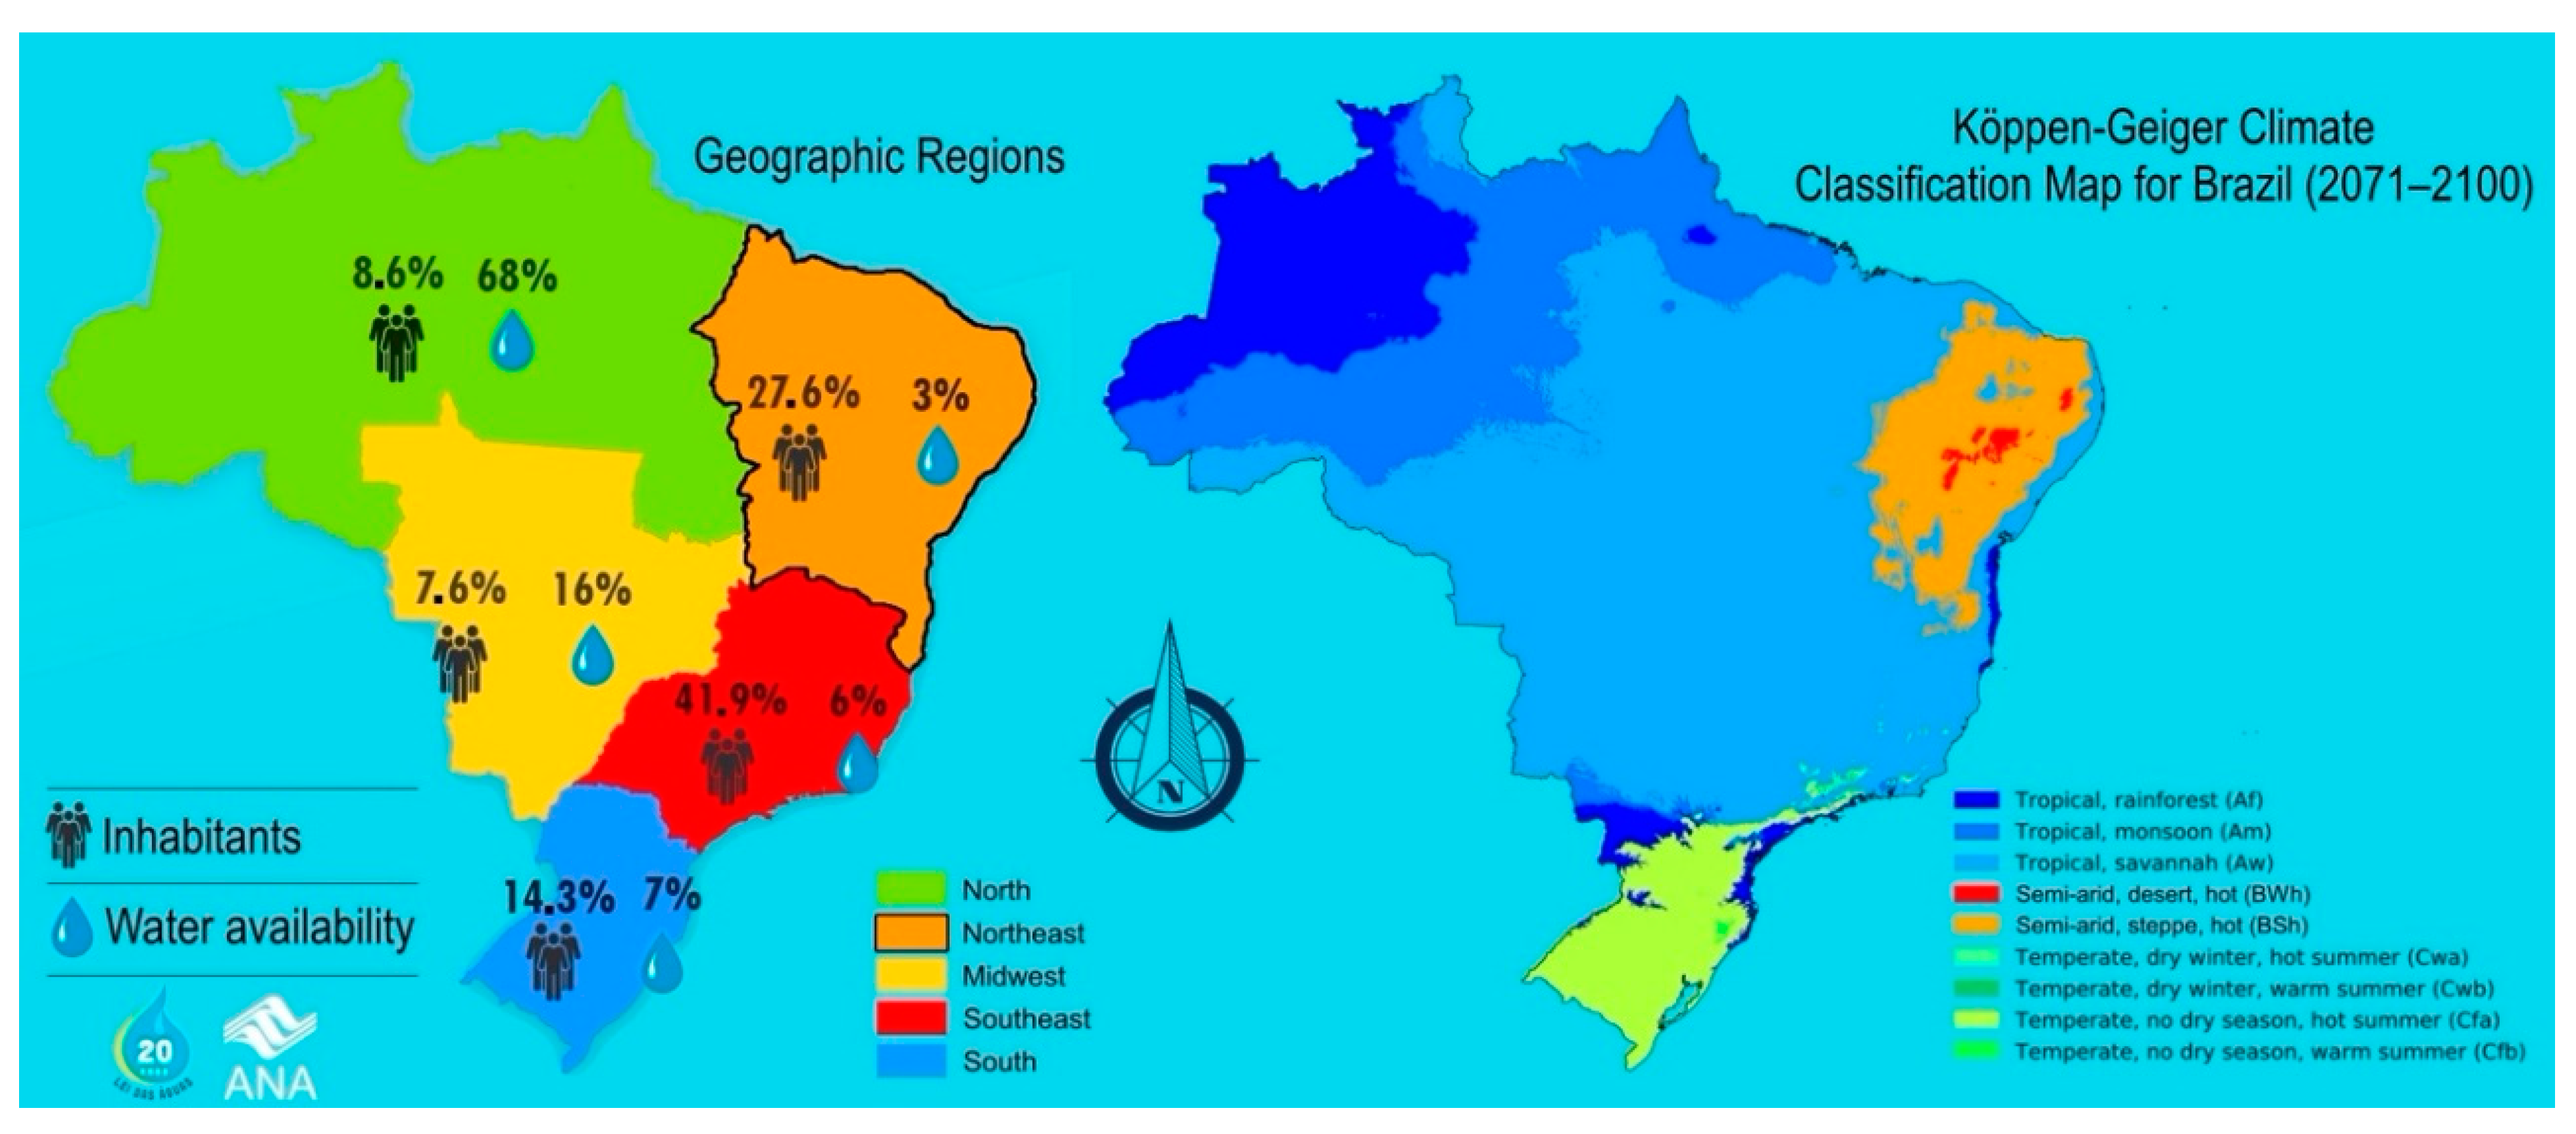
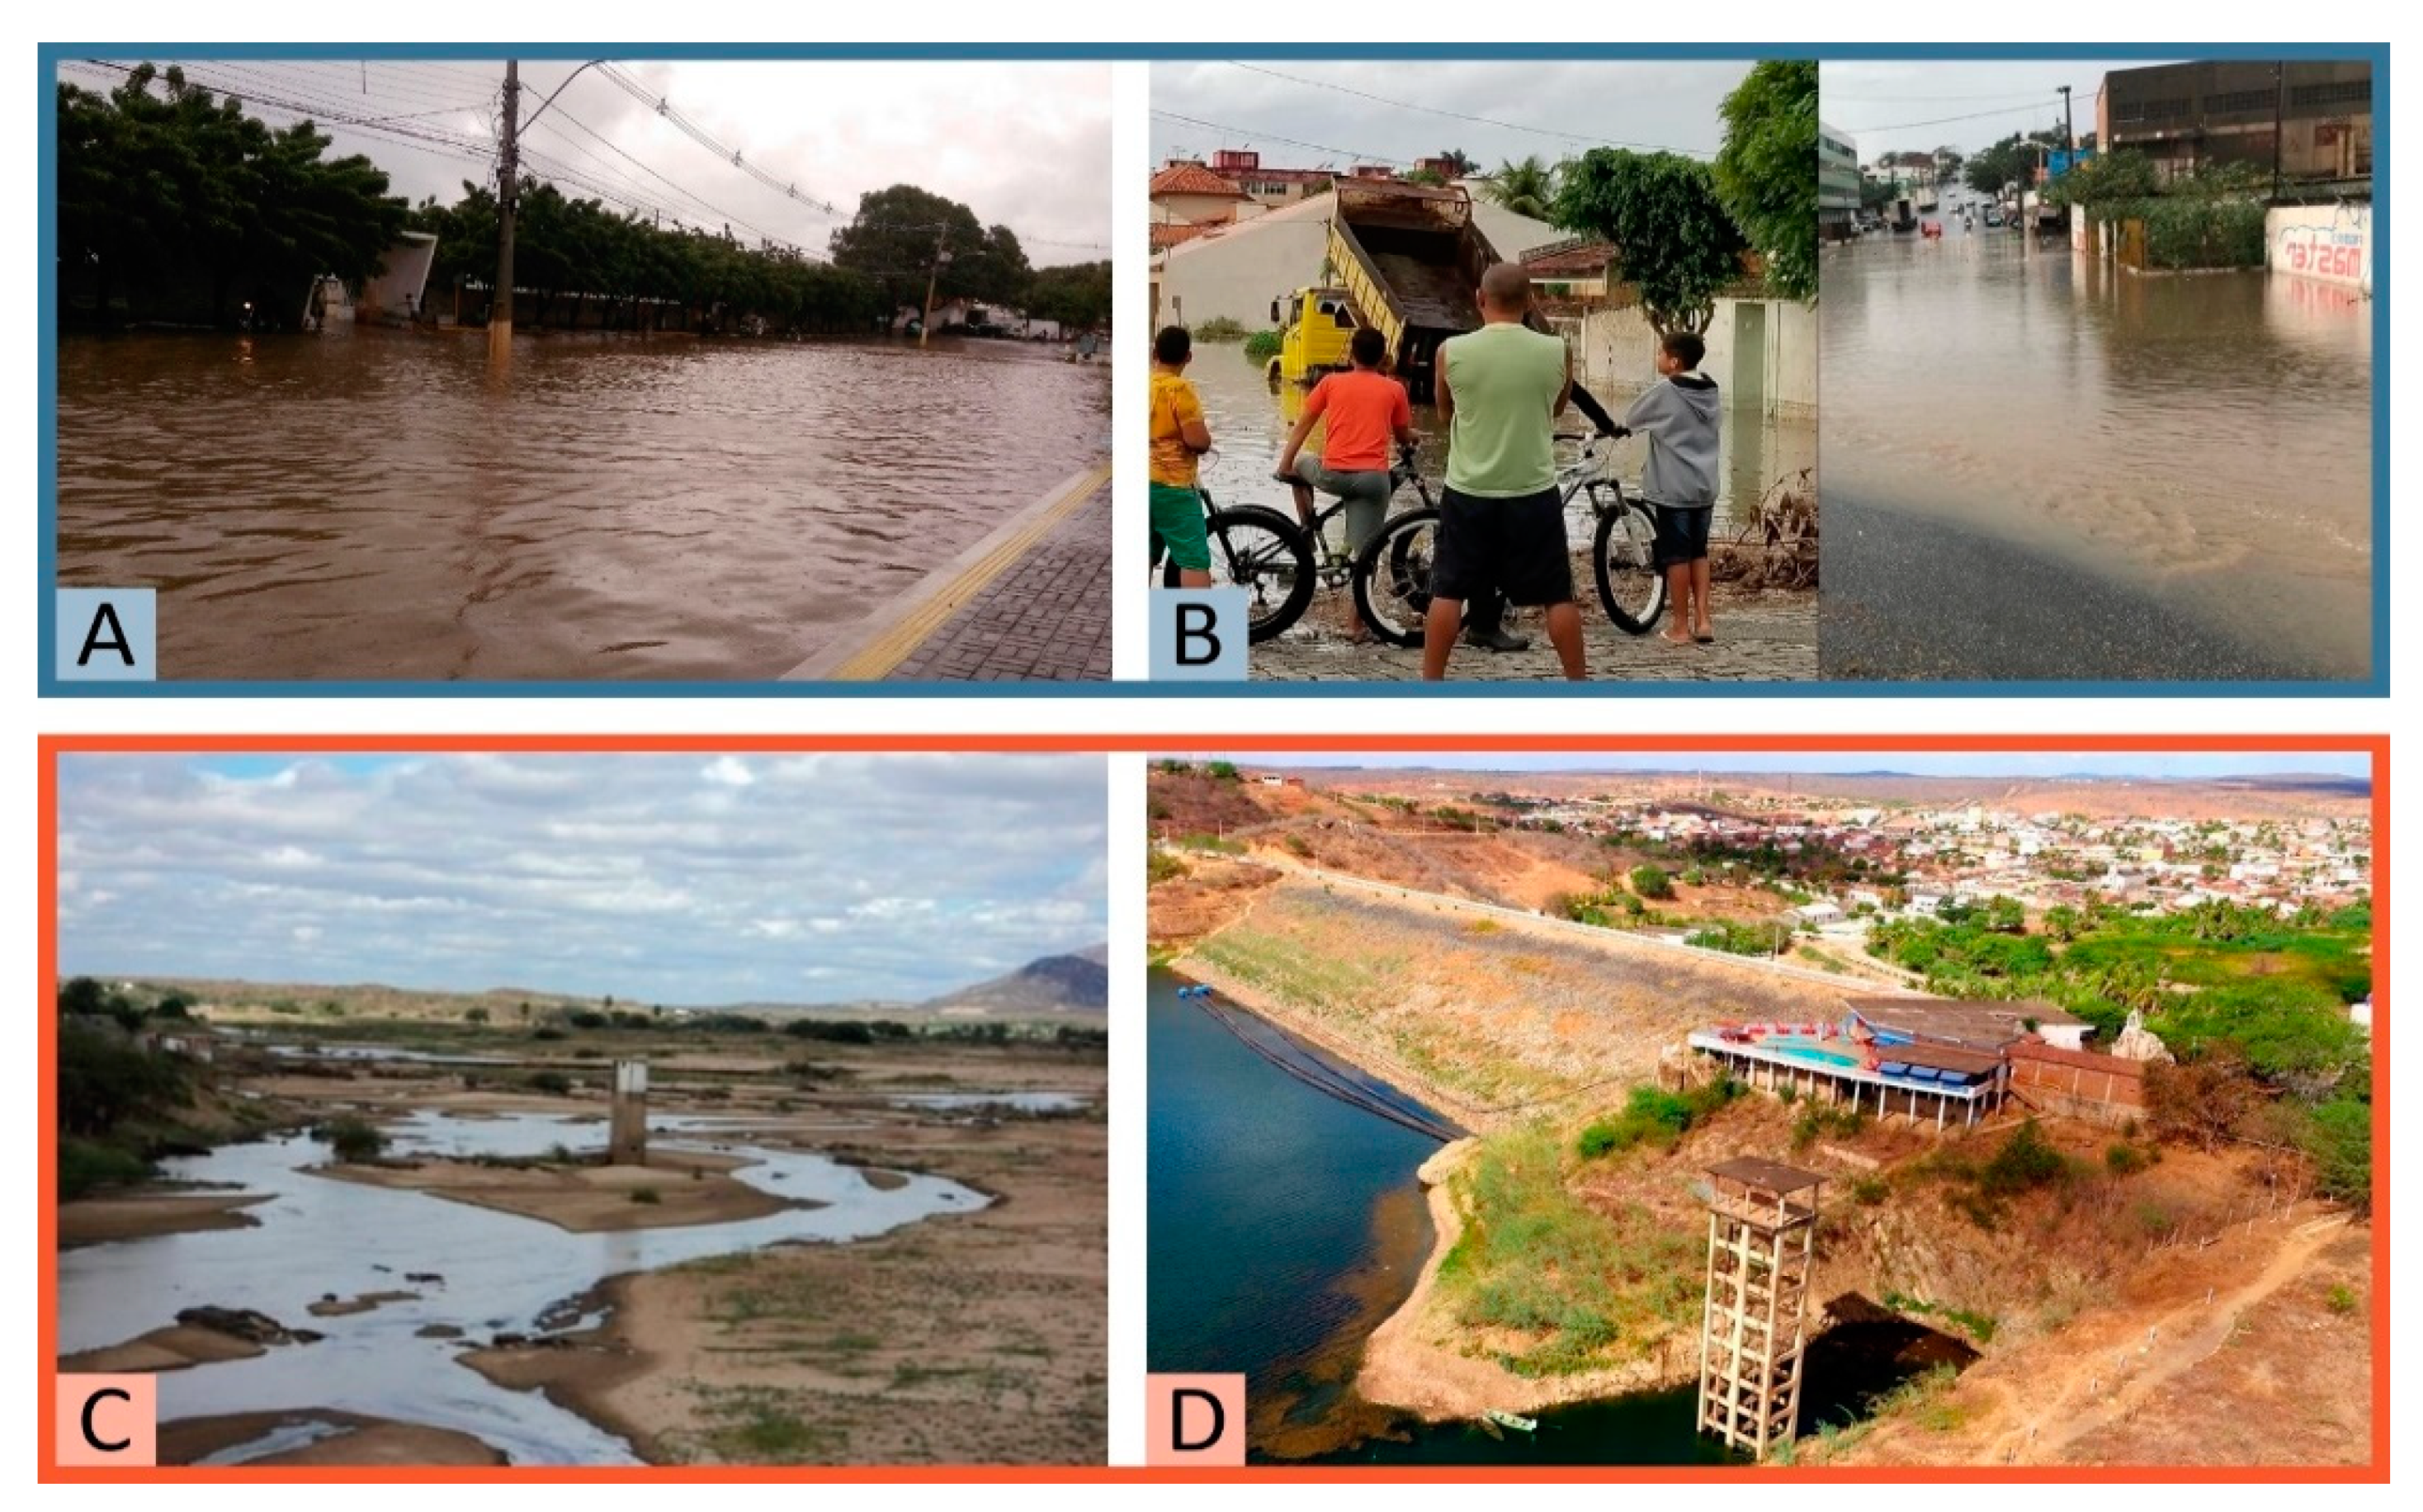
2. The “Natural Resilience” of the Northeastern Brazilian Cities

The northeastern Brazilian region (NEB) has been vulnerable to hydrometeorological extremes, especially droughts, for centuries [18,19]. A combination of natural climate variability (most of the area is a semi-arid) and water governance problems increases extreme events’ impacts, especially in urban areas. Intermittent water supply and long water rationing periods due to the low level in reservoirs create a “naturally resilient environment”. People often have to change their consumption behaviour, converting the crisis to an opportunity to increase resilience [20]. Figure 1 shows side by side the geographic administrative regions of the country and Köppen–Geiger climate classification, and it is possible to observe the semi-arid region covering almost the whole NEB territory.
NEB is the Brazilian region that historically faces more problems caused by or related to droughts. The last multiannual drought event in the semi-arid region extended from 2012 to 2018 [23], causing different impacts, such as the drinking water shortage, the decrease in food production, and losses in the economy [24]. In contrast to this semi-arid scenario (Figure 1), in the rainy season, it is typical that floods occur in cities [25,26]. This exposure to both hazards is the reality of many of NEB’s medium-sized cities (with more than 400 thousand inhabitants), where the population deals with water supply shortages [27], as well as floods [28]. Figure 2 shows some numbers that describe the main infrastructure problems in NEB’s cities.
Therefore, the consequences of insufficient water supply lead to a cycle whereby increasing urbanisation increases pressures for the water (water demands), which is aggravated by a poorly urban planned environment. Built-up legislation in NEB cities usually does not consider water resources issues or environmental issues. So, the land-use and occupation planning and permits do not take into account the pressure it imposes on water resources [30]. Other drivers such as climate change and urban growth make a very well-known drought scenario for many “naturally resilient cities” even more difficult. However, this context can make cities more resilient to external shocks and crises for a long time, allowing the development of flexibility to adapt and turn new circumstances into their advantage. That may help turn crises into opportunities for development (Figure 3).
The definition of a “natural resilience” is based on the systematic exposition to hazards, leading the population to adaptation initiatives and increasing its coping adaptivity. Even in “normal seasons” with not so severe droughts, water reservoirs with low levels of storage and the water supply services have a high rate of intermittence. In this context, people “get used to” saving water in tanks or buying water from private water tank sellers, and for this reason (limited access to water) they reduce their consumption. That is a direct example of the development of natural resilience. In a regular water supply condition (with no intermittence), this “rational consumption” could not be developed or stimulated. The same idea can be observed regarding frequent floods, in which people with more exposure to the hazard, may have protection measures in place to deal with the next flood. For example, a participatory approach in one of the NEB cities (Campina Grande-Paraíba state) showed that many residents have flood barriers in their households to reduce damage in future flooding events [31].

3. Materials and Methods

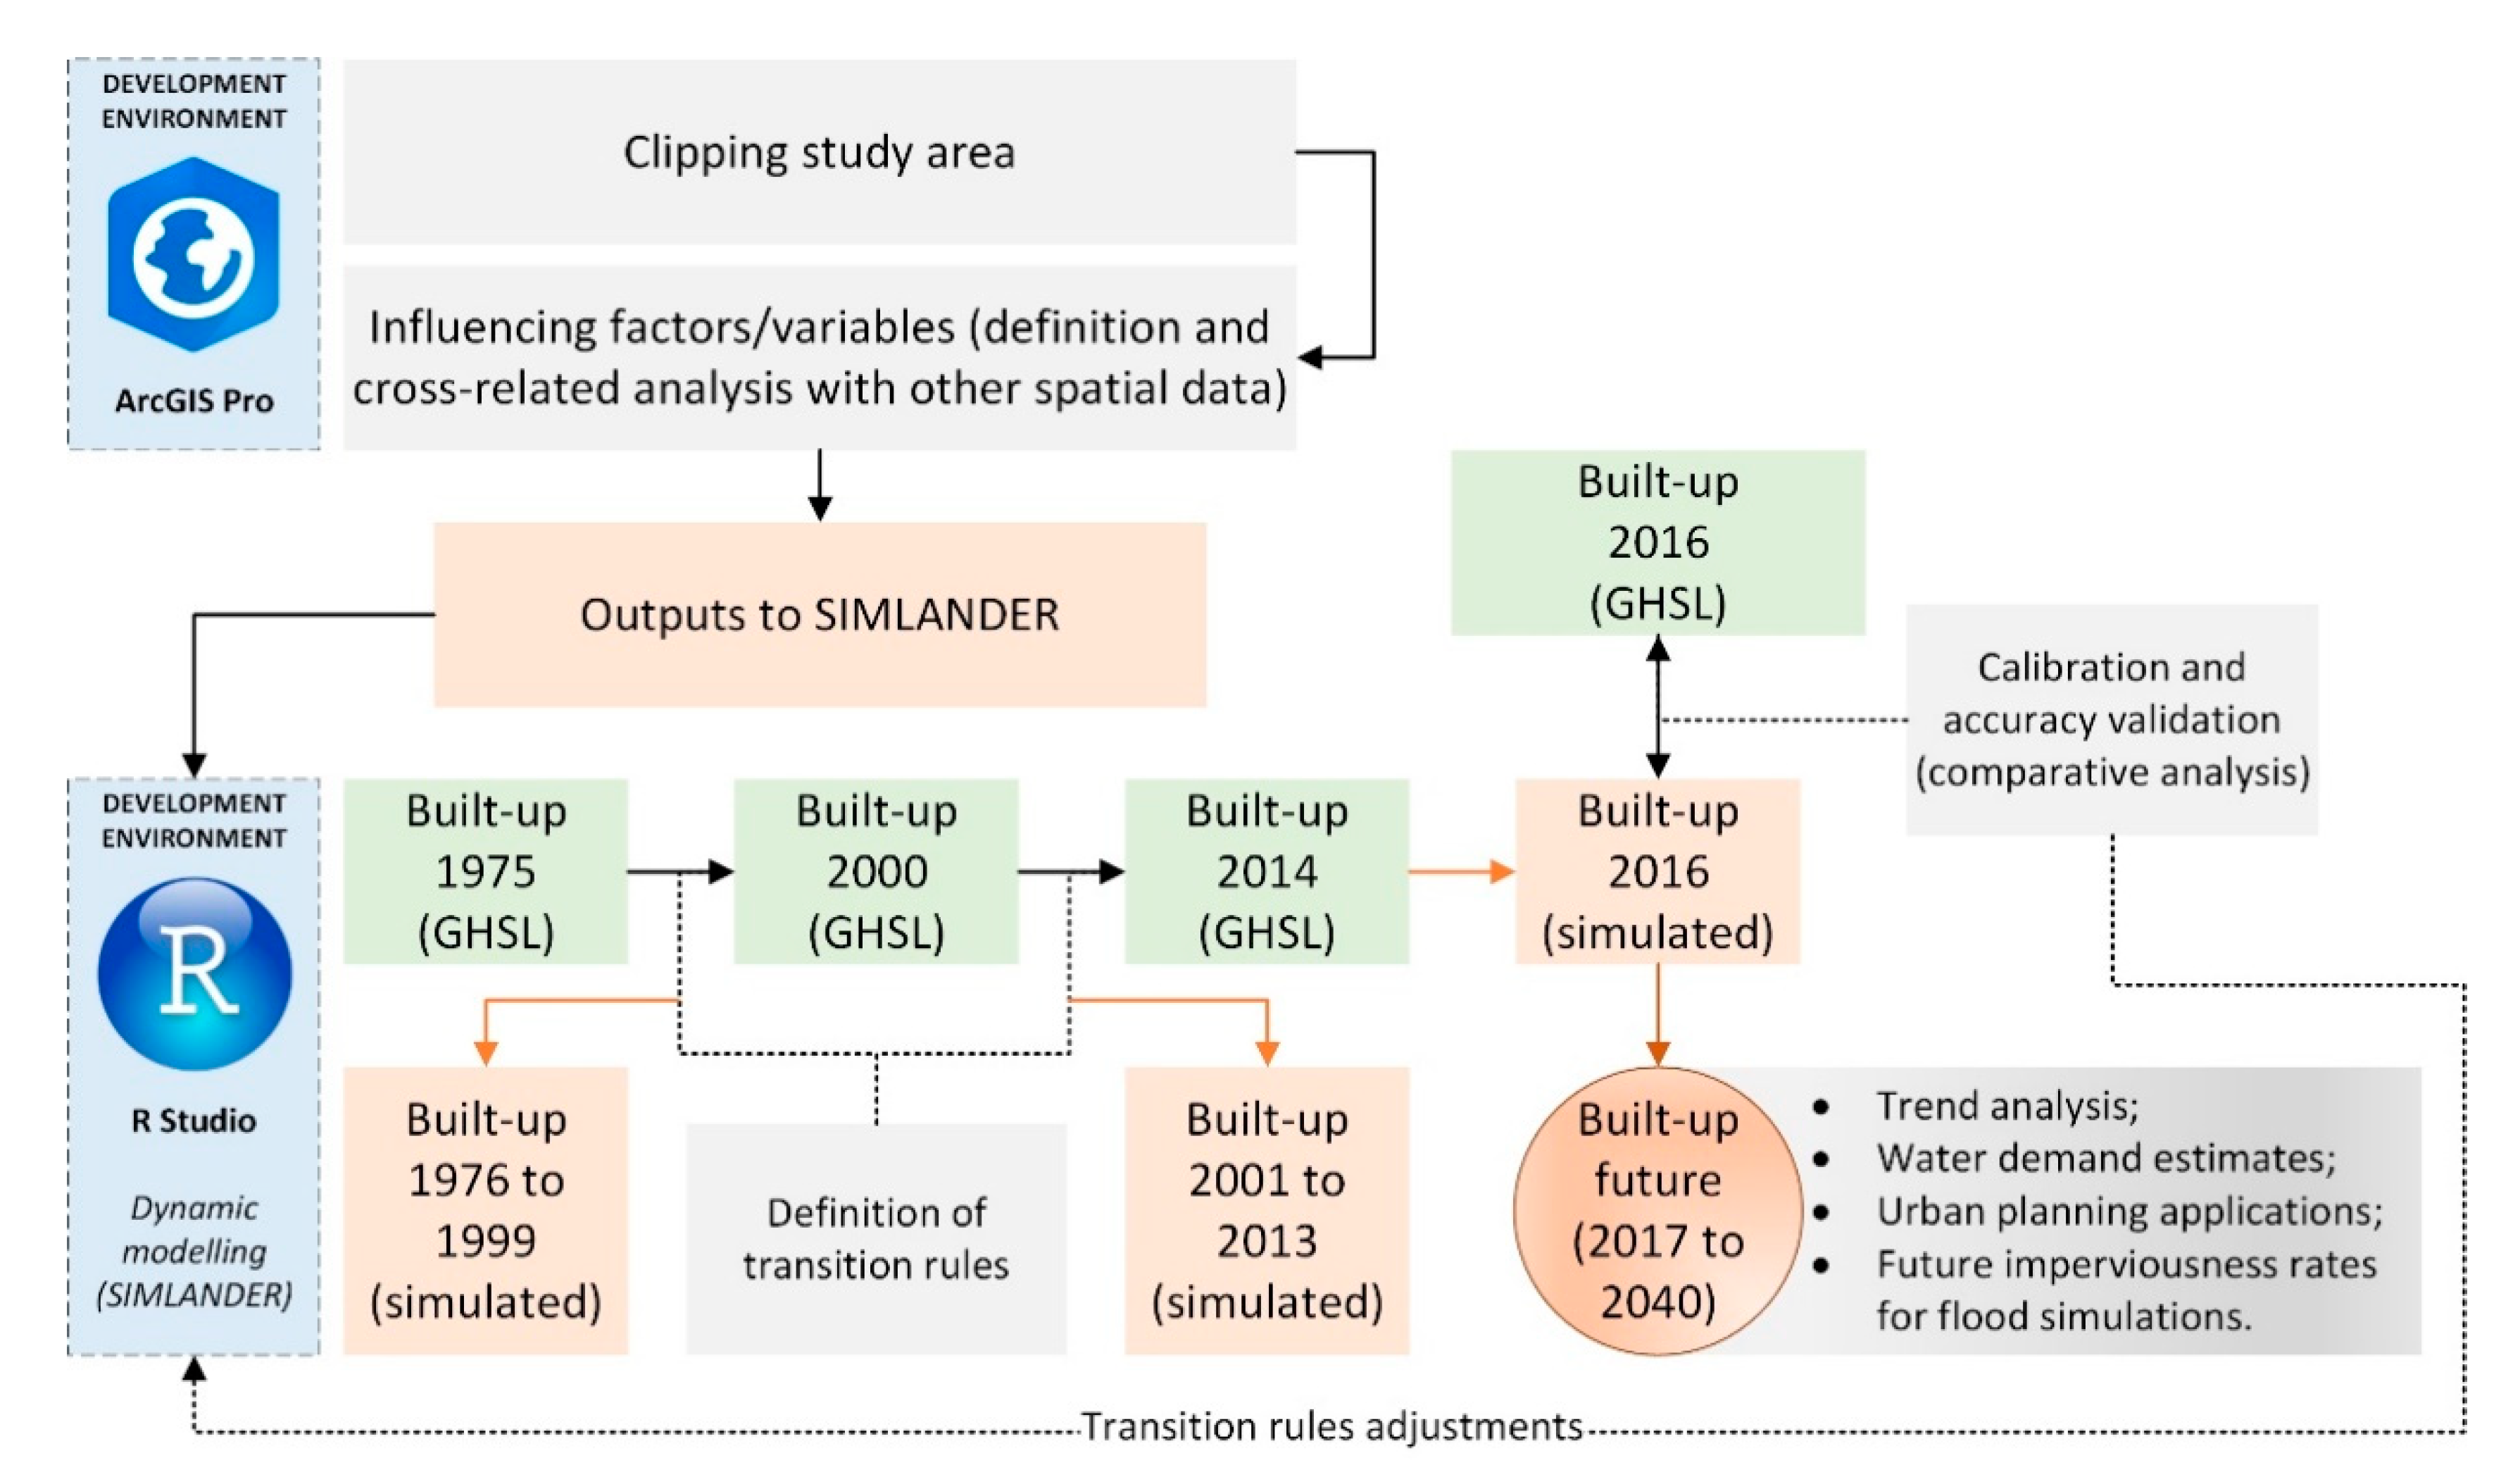
3.1. Cellular Automata Model: SIMLANDER

In recent decades, urban growth simulation models based on remote sensing products and geographic information systems (GIS) have been created. The practices of urban growth simulation started to incorporate different algorithms or techniques in the GIS platform, such as artificial neural networks [32], LiDAR [33], machine learning [34], geographically weighted regression [35], decision trees [36], cellular automata [37], and so on. Among several techniques, cellular automata have been widely used in urban simulations and analyses, as they represent the driving force of urban development through transition rules capable of expressing the spatial externalities of urban expansion through neighbourhood rules [38].
SIMLANDER stands for “simulation of land-use change using R” and is a prototype cellular automata land-use model built for the R software environment, with one open-source script available for customisations and general use [39]. This study used SIMLANDER version 1.0.6 (the most recent available at the data processing time) [40]. One of the advantages of this CA script is the easy incorporation of appropriate statistical techniques to evaluate and adjust the model in the R environment. The model’s basis is the demand for land use, also called “land claim” [41]. For the development of predictive scenarios, the model uses two land-use maps on different dates, which are subjected to cartographic algebra (subtraction) and are divided by the time interval. Subsequently, a simple linear interpolation is made between the two historical dates to allocate the pixels altered and enable the simulation considering stable growth.

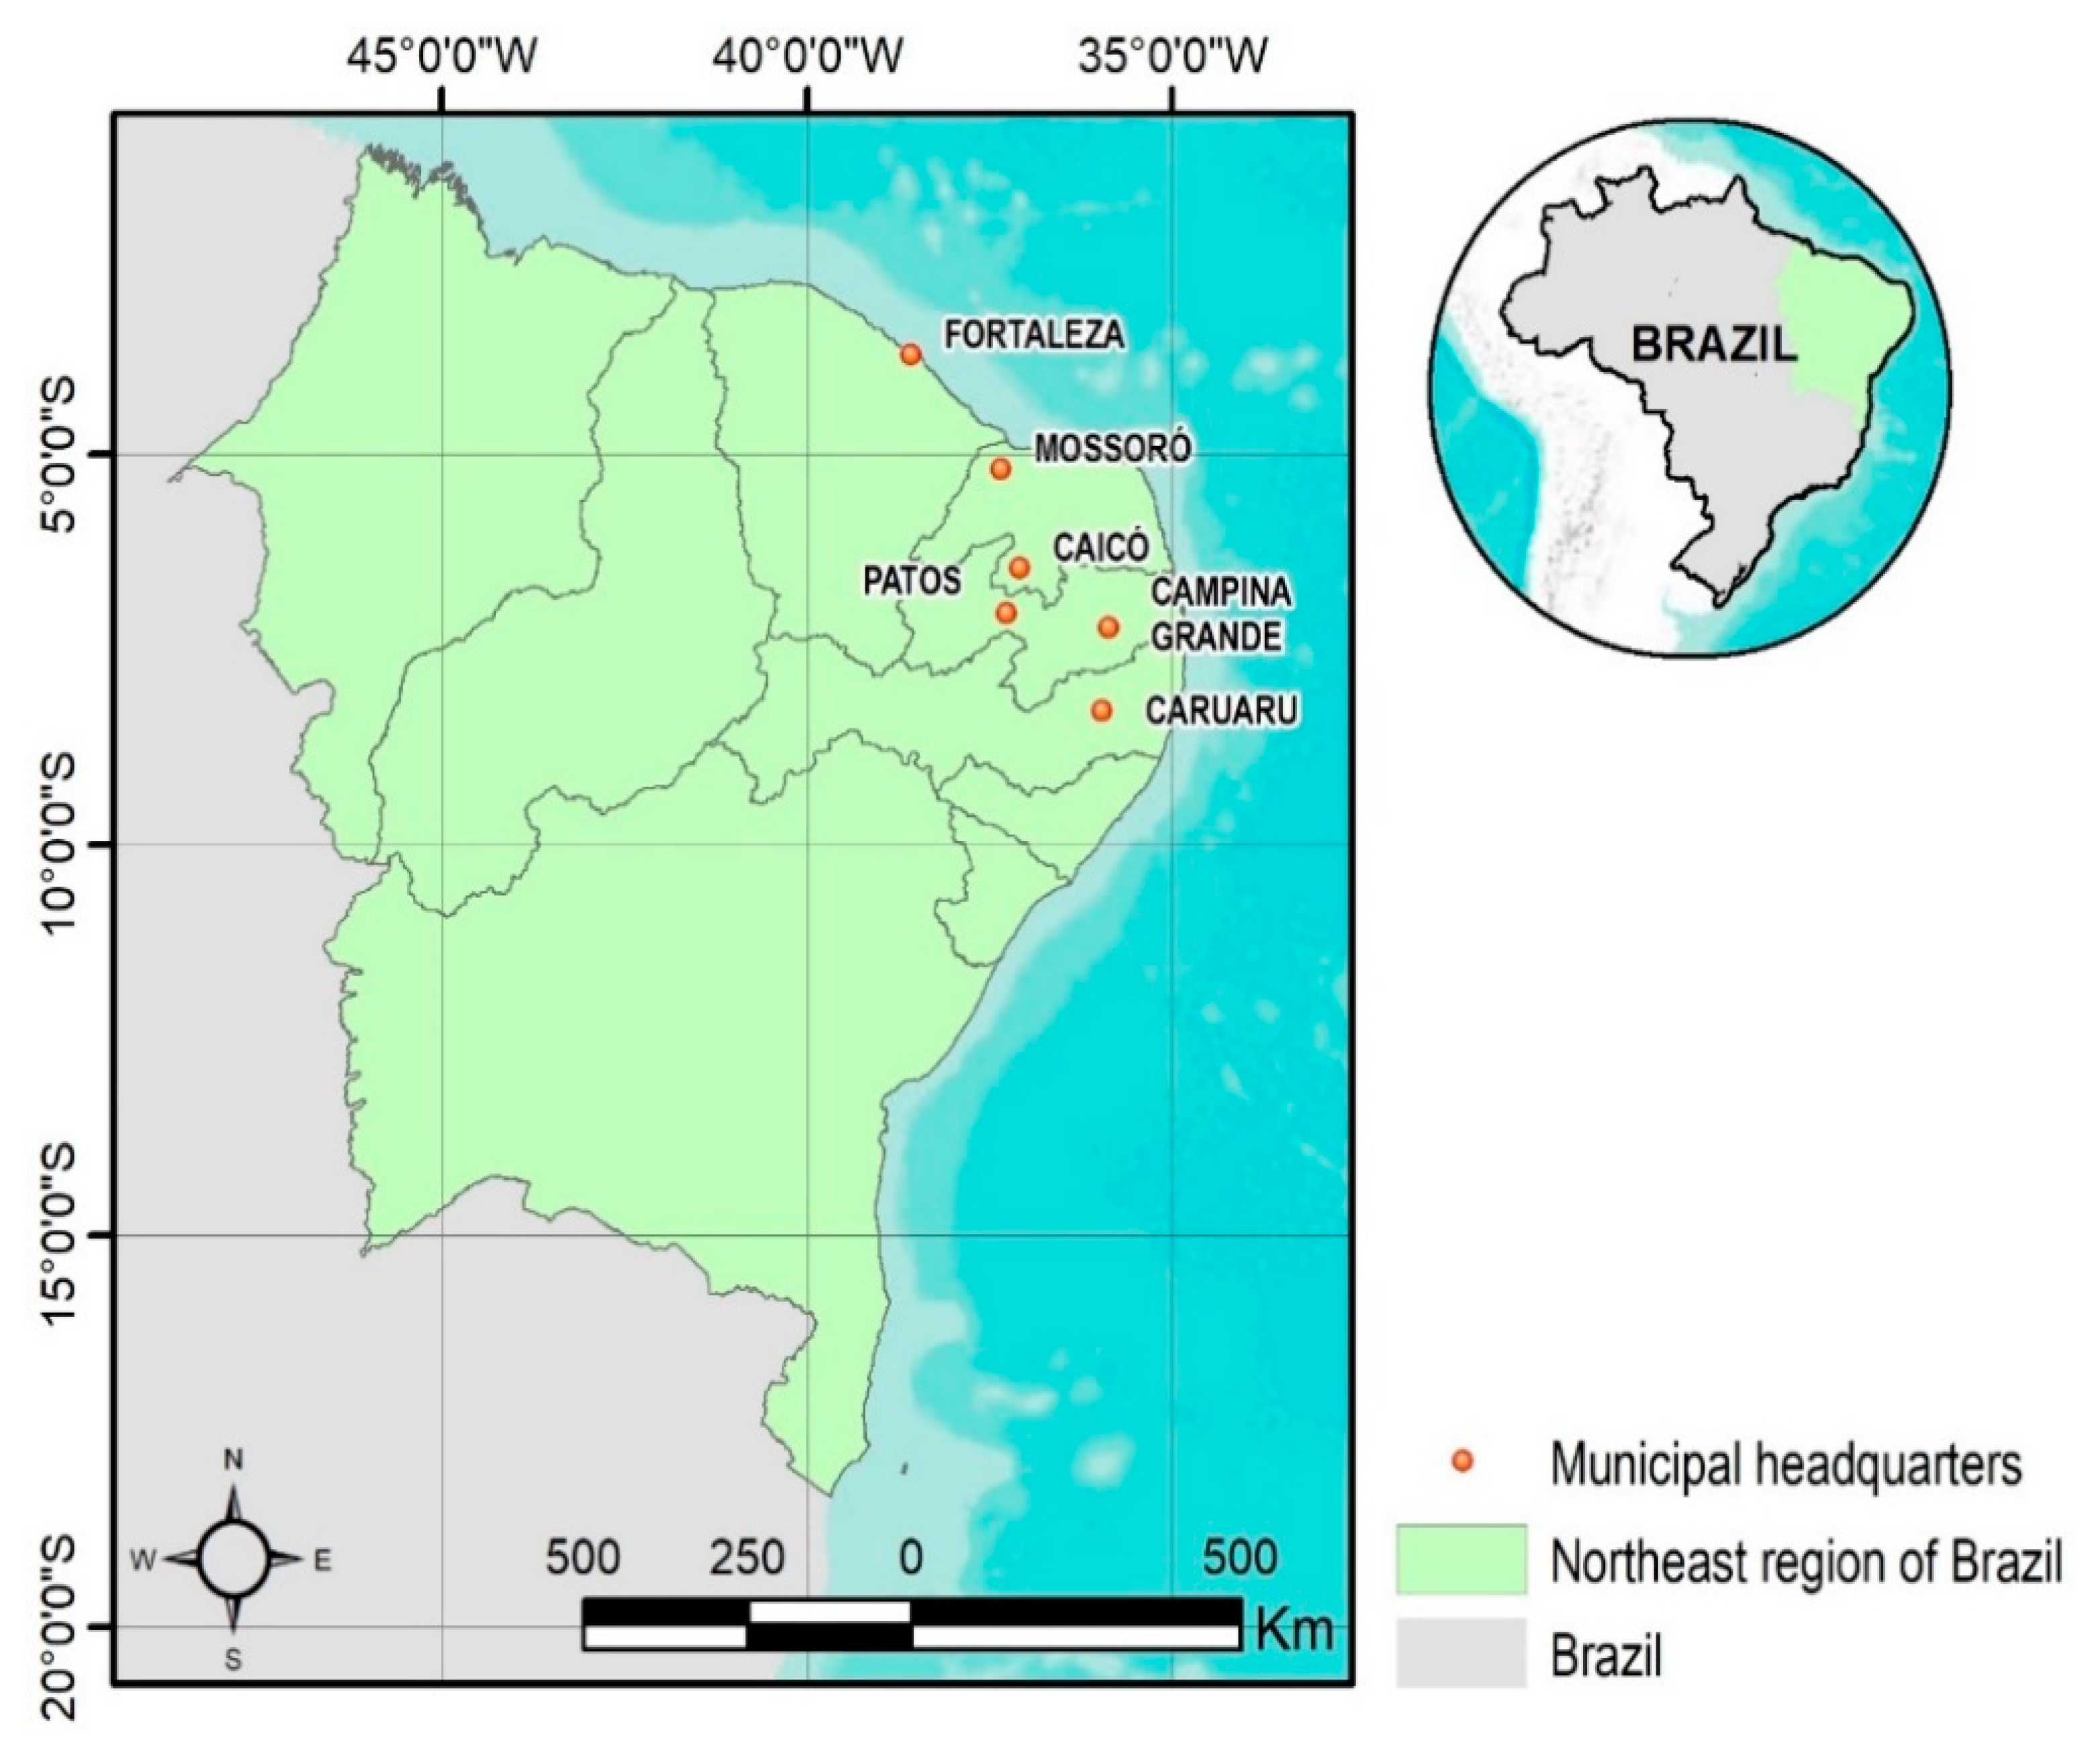
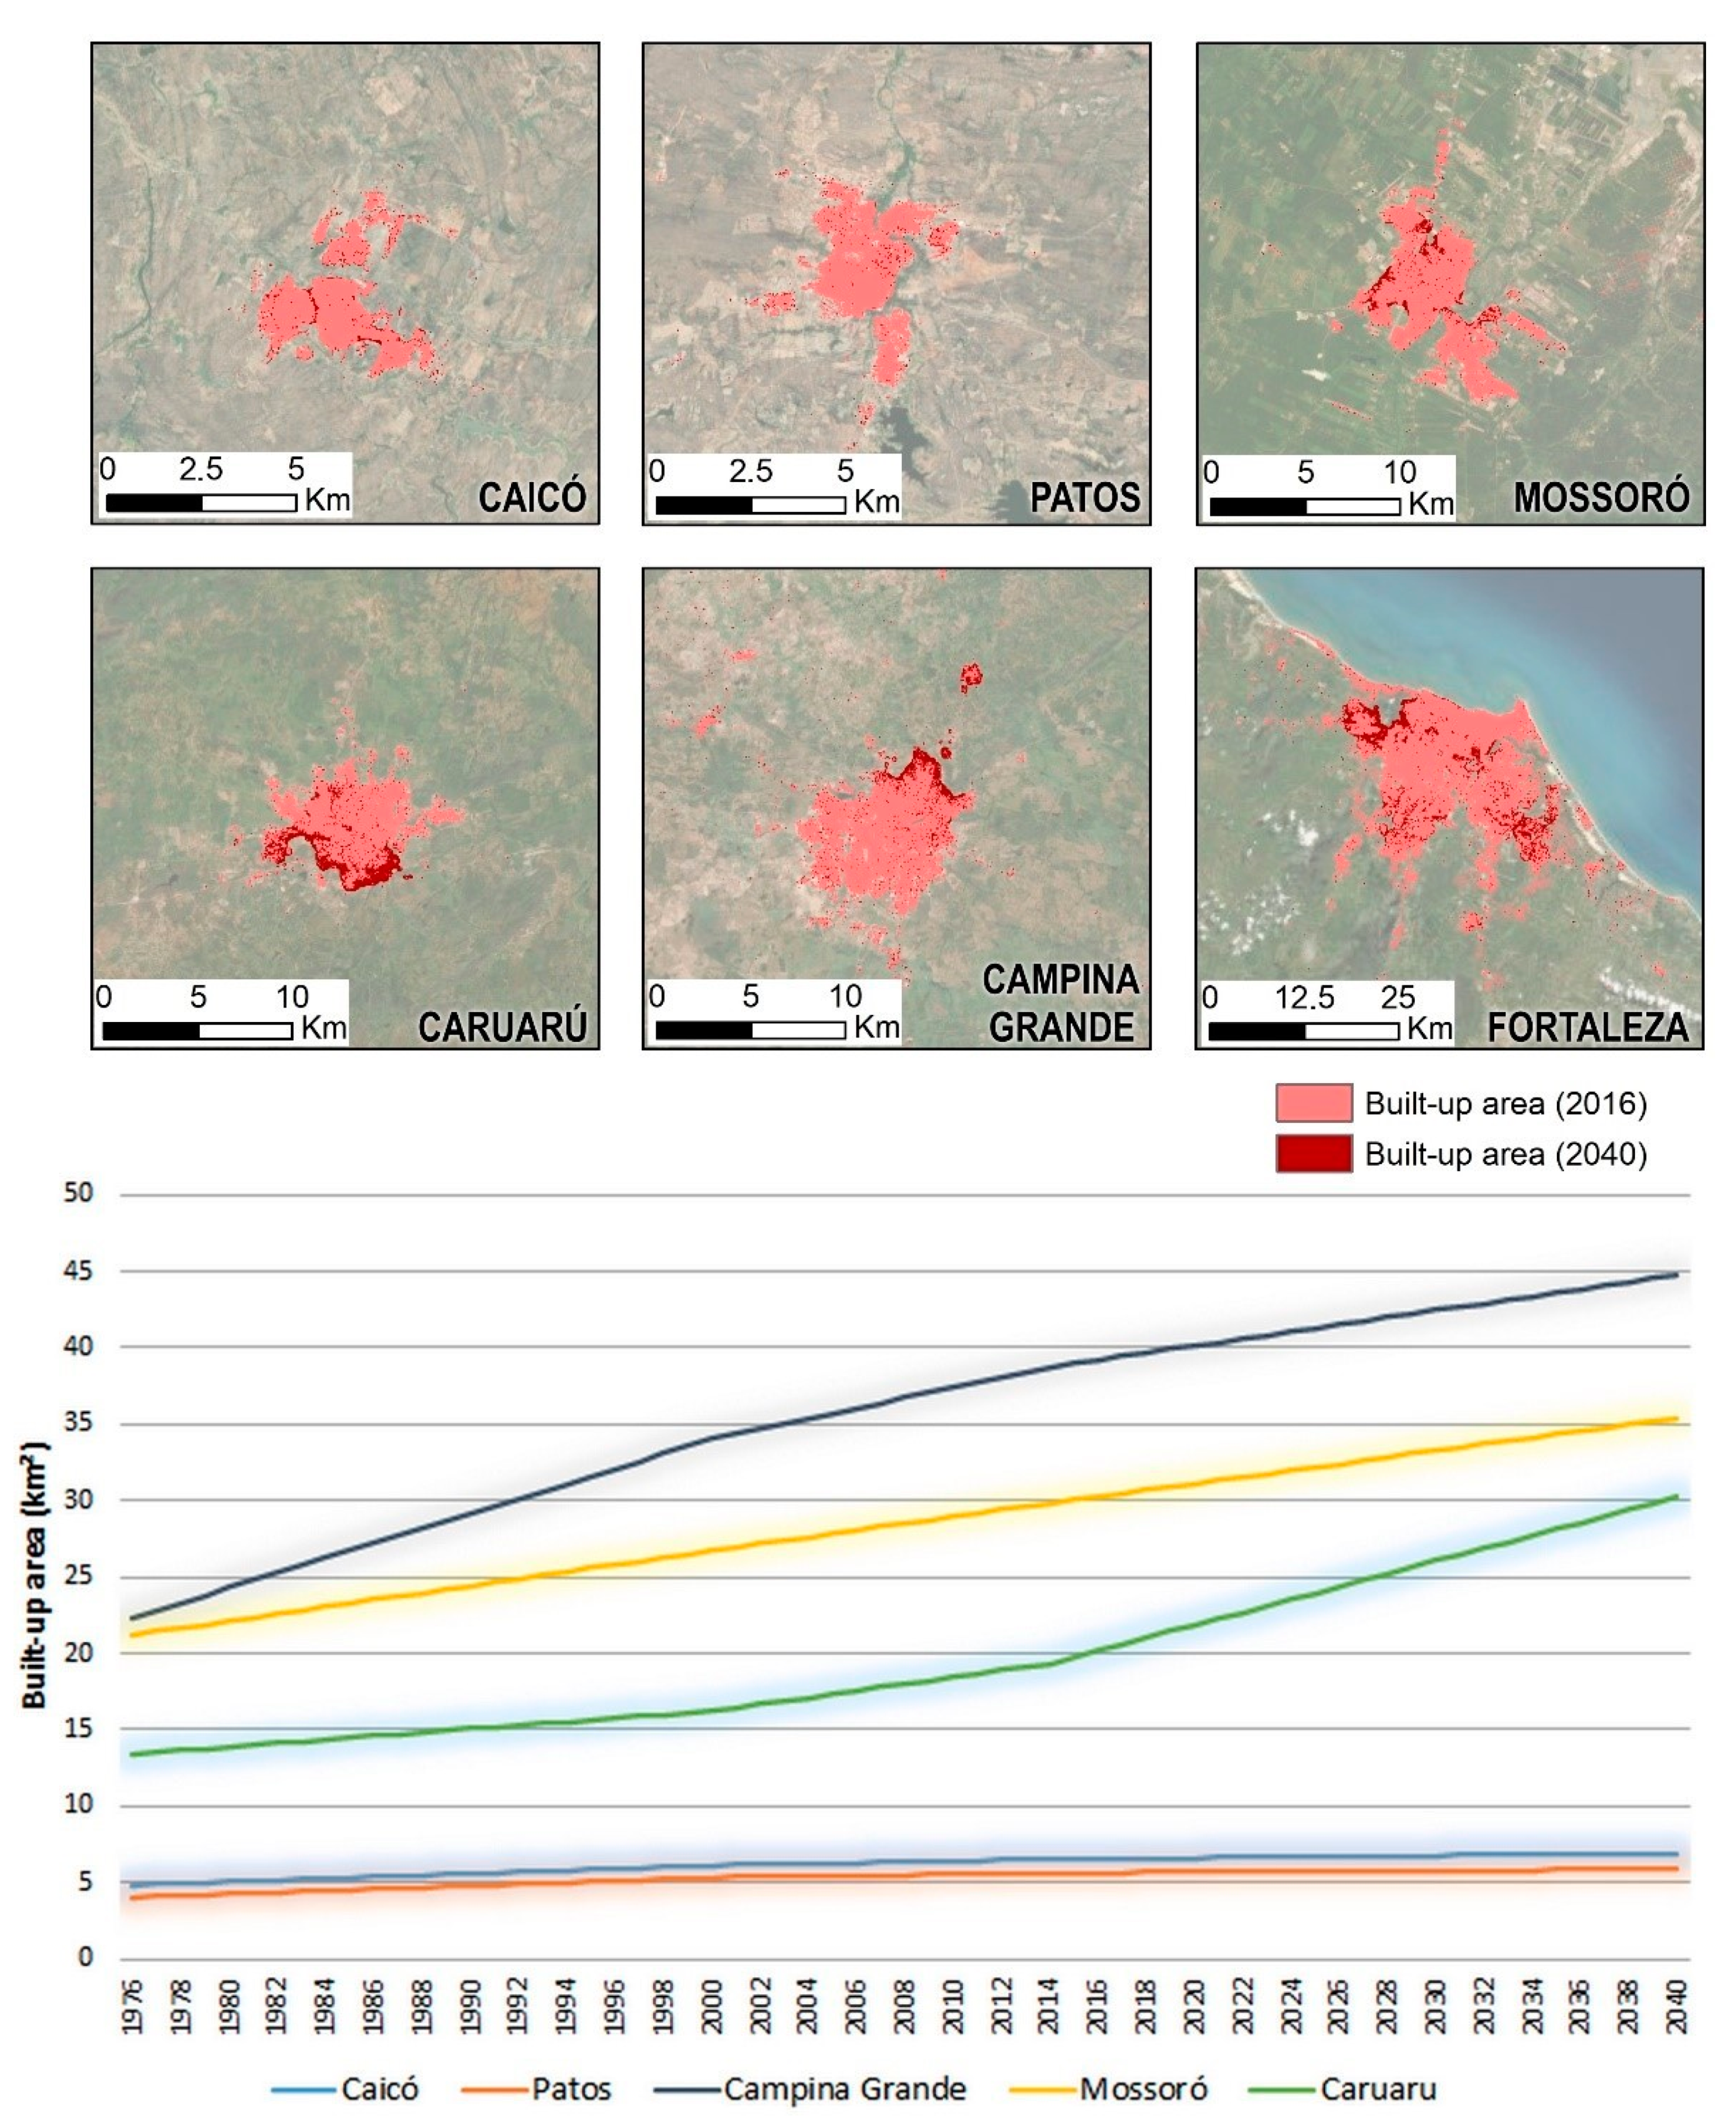
3.2. Cities Selection

The impacts of droughts in the NEB over the years are, in particular: the migration of people from the interior to the coast or the closest urban area, a drop in agricultural production, hunger, and a drop in the volumes of the reservoirs [42] In the last long-term drought from 2012 to 2018, most of the supply reservoirs collapsed, reaching the dead volume [43]. Some municipalities depend on water tankers and trucks, and agriculture registers critical losses [44]. On the other hand, in this region, the occurrence of extreme rainfall events causes severe damage to the population, given that the rampant urbanisation and land-use processes make cities more susceptible to harmful consequences [45]. For this study, a sample of six NEB cities was selected, and Table 1 shows the criterion for the selection.
Table 2 presents some of the characteristics of each selected city. According to the last census survey, 90.8% of the NEB cities are small cities with less than 50 thousand inhabitants. Most of the population are distributed in the capitals (some are megacities with millions of people) or in the medium-sized cities (population between 50 thousand to 500 thousand people). Those populated cities face both extreme hazards: water shortages (caused by long-term droughts) and flash floods. The selection was very representative of those cities. Figure 4 shows the geographic location for all of them.
The study cases are just a sample of many cities with similar conditions. Most of the NEB cities are supported by surface water resources (there is no available groundwater due to natural geological conditions). During long-term droughts with high levels of evaporation, the main water supply reservoirs and rivers decrease their levels, and the cities are subjected to water rationing plans (some of them stay under rationing plans for years, having water supply services for one or two days per week). At the same time, because of heat island phenomenon and semi-arid natural precipitation (very high volumes in a few days), all of those cities also deal with flash floods in some period of the year. The rainy season is not enough to recover the reservoirs and rivers (usually located far from the urban centres), but can cause much damage, as shown in Figure 5. Figure 5C shows the main water supply river (Piranhas-Açu) of Caicó, RN during the last long-term drought. This city (Caicó) used to have up to 7 (seven) days without water supply (water rationing), even out of dry seasons. Another selected city, Campina Grande, PB, also deals with years of water rationing (e.g., from 2012 to 2017), although this city has been facing typical flash floods even during a dry season (Figure 5B).

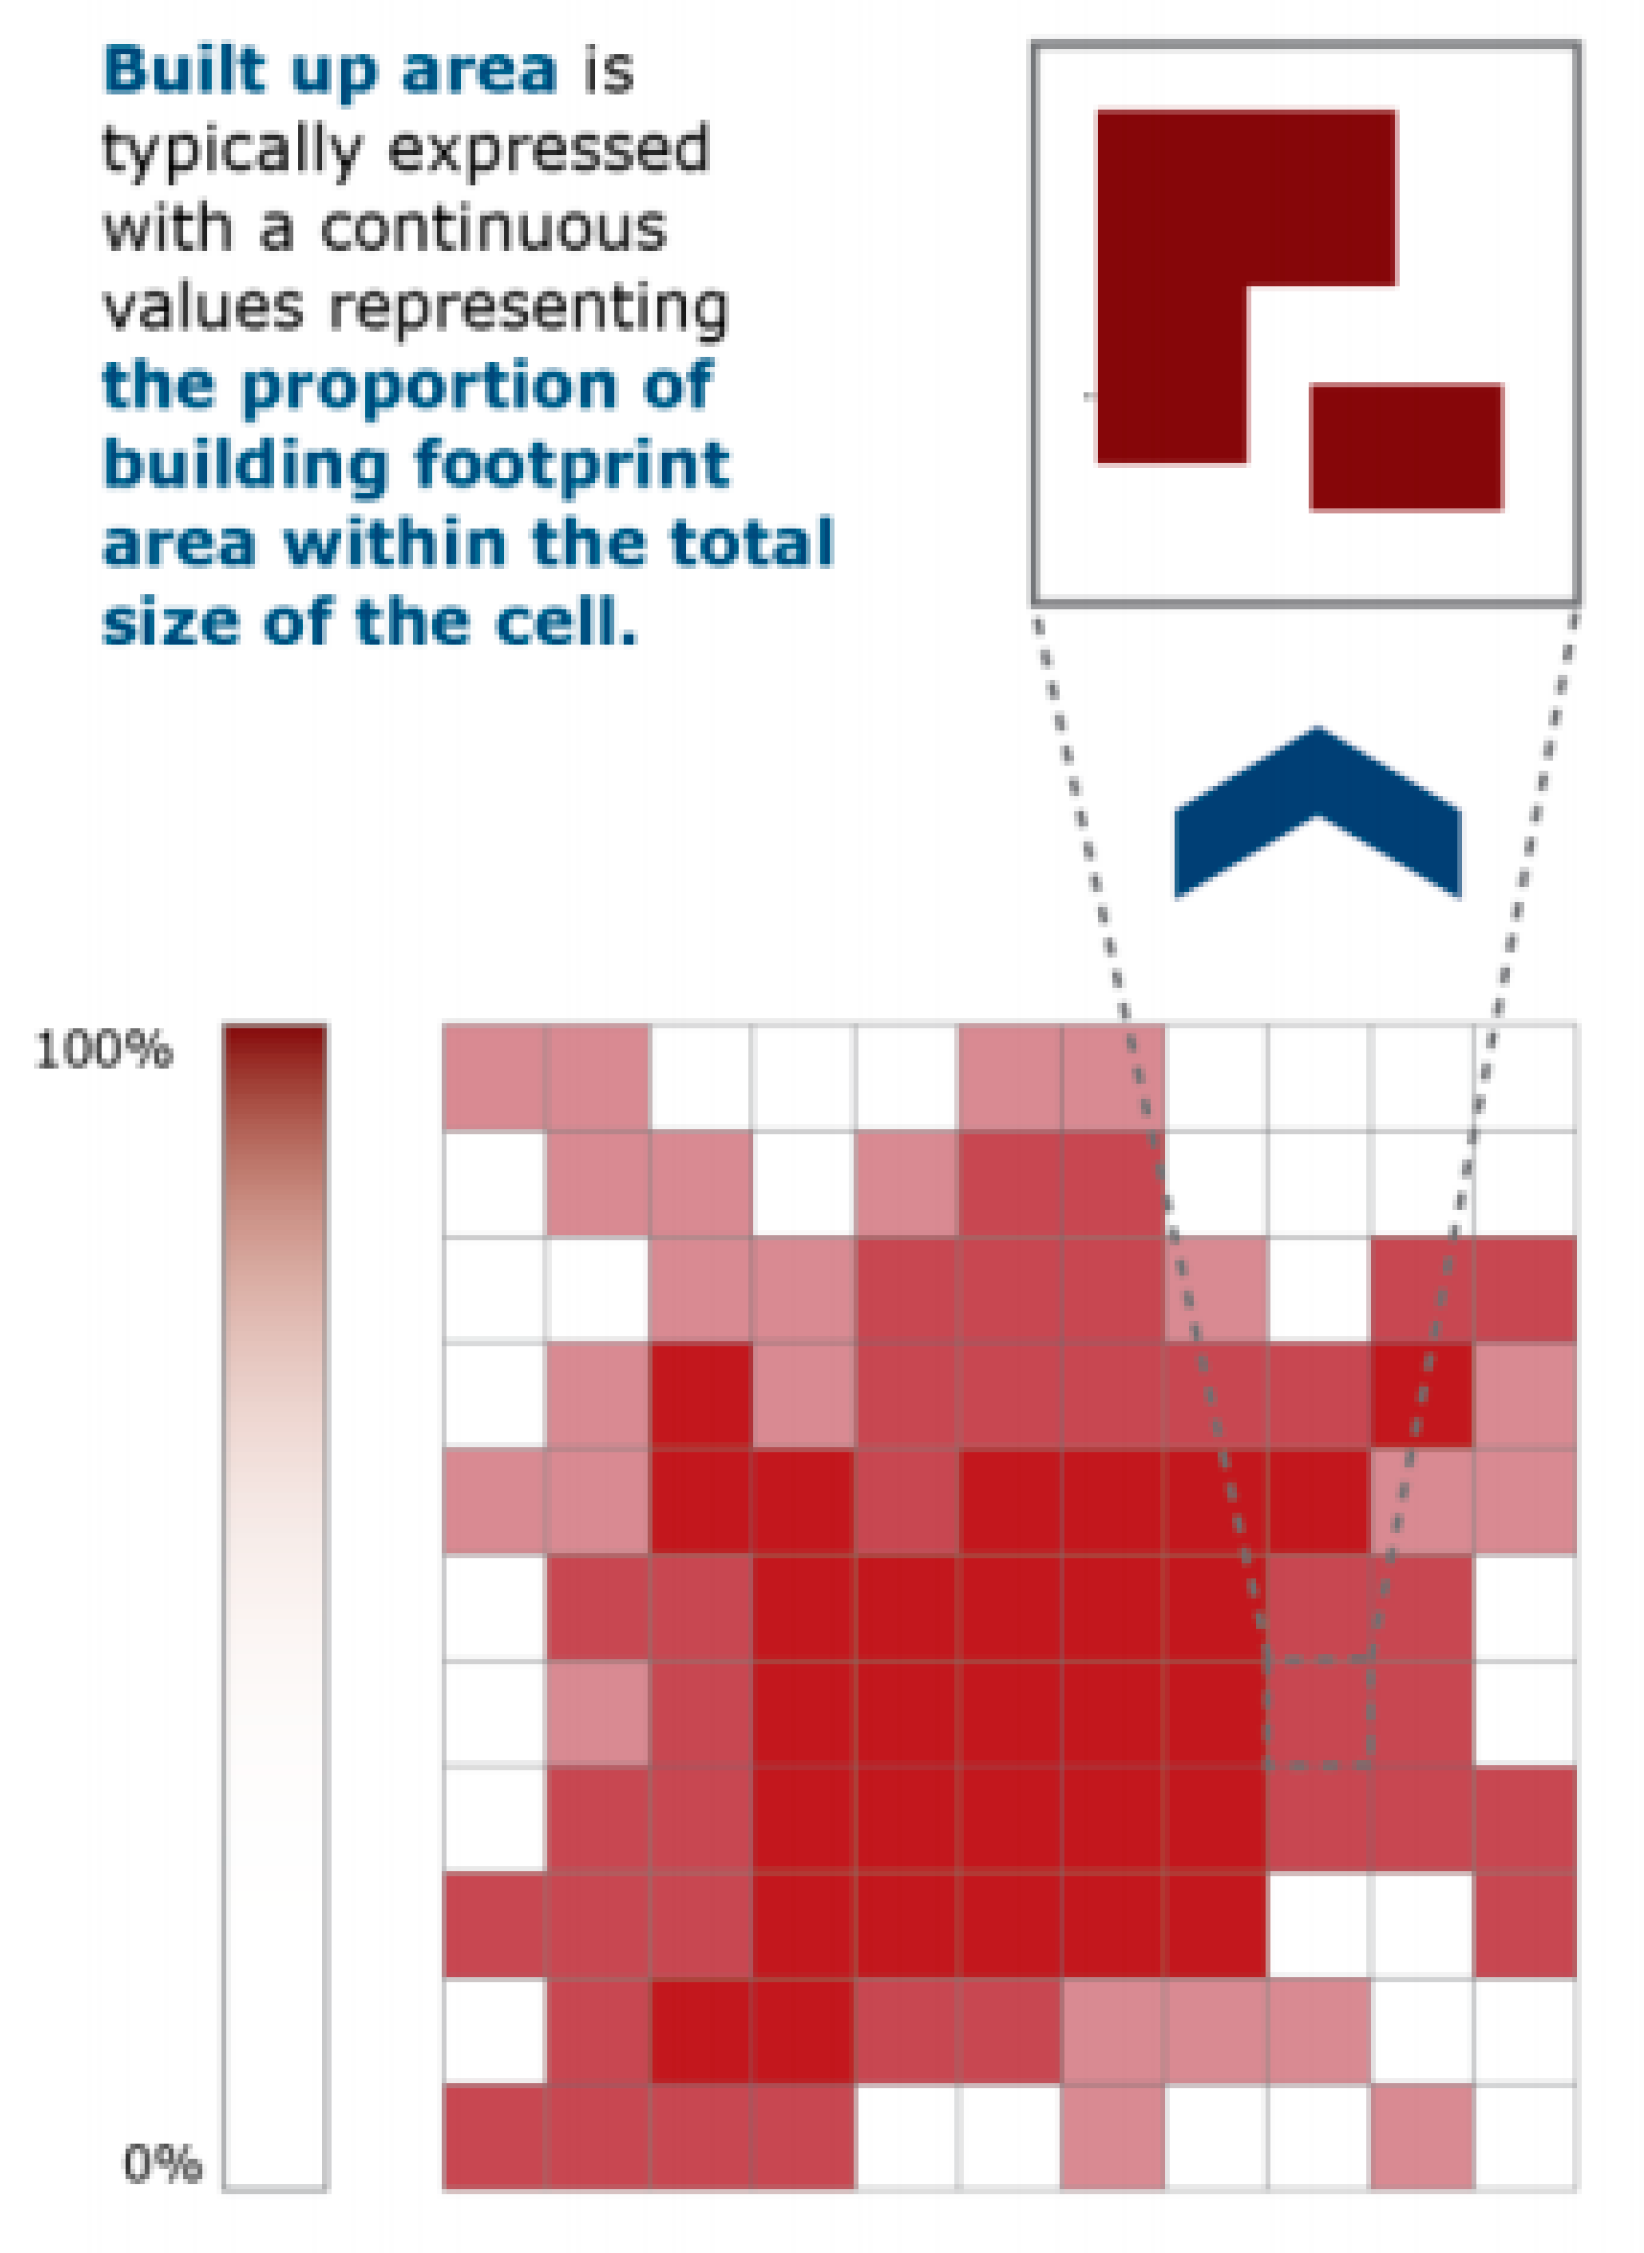
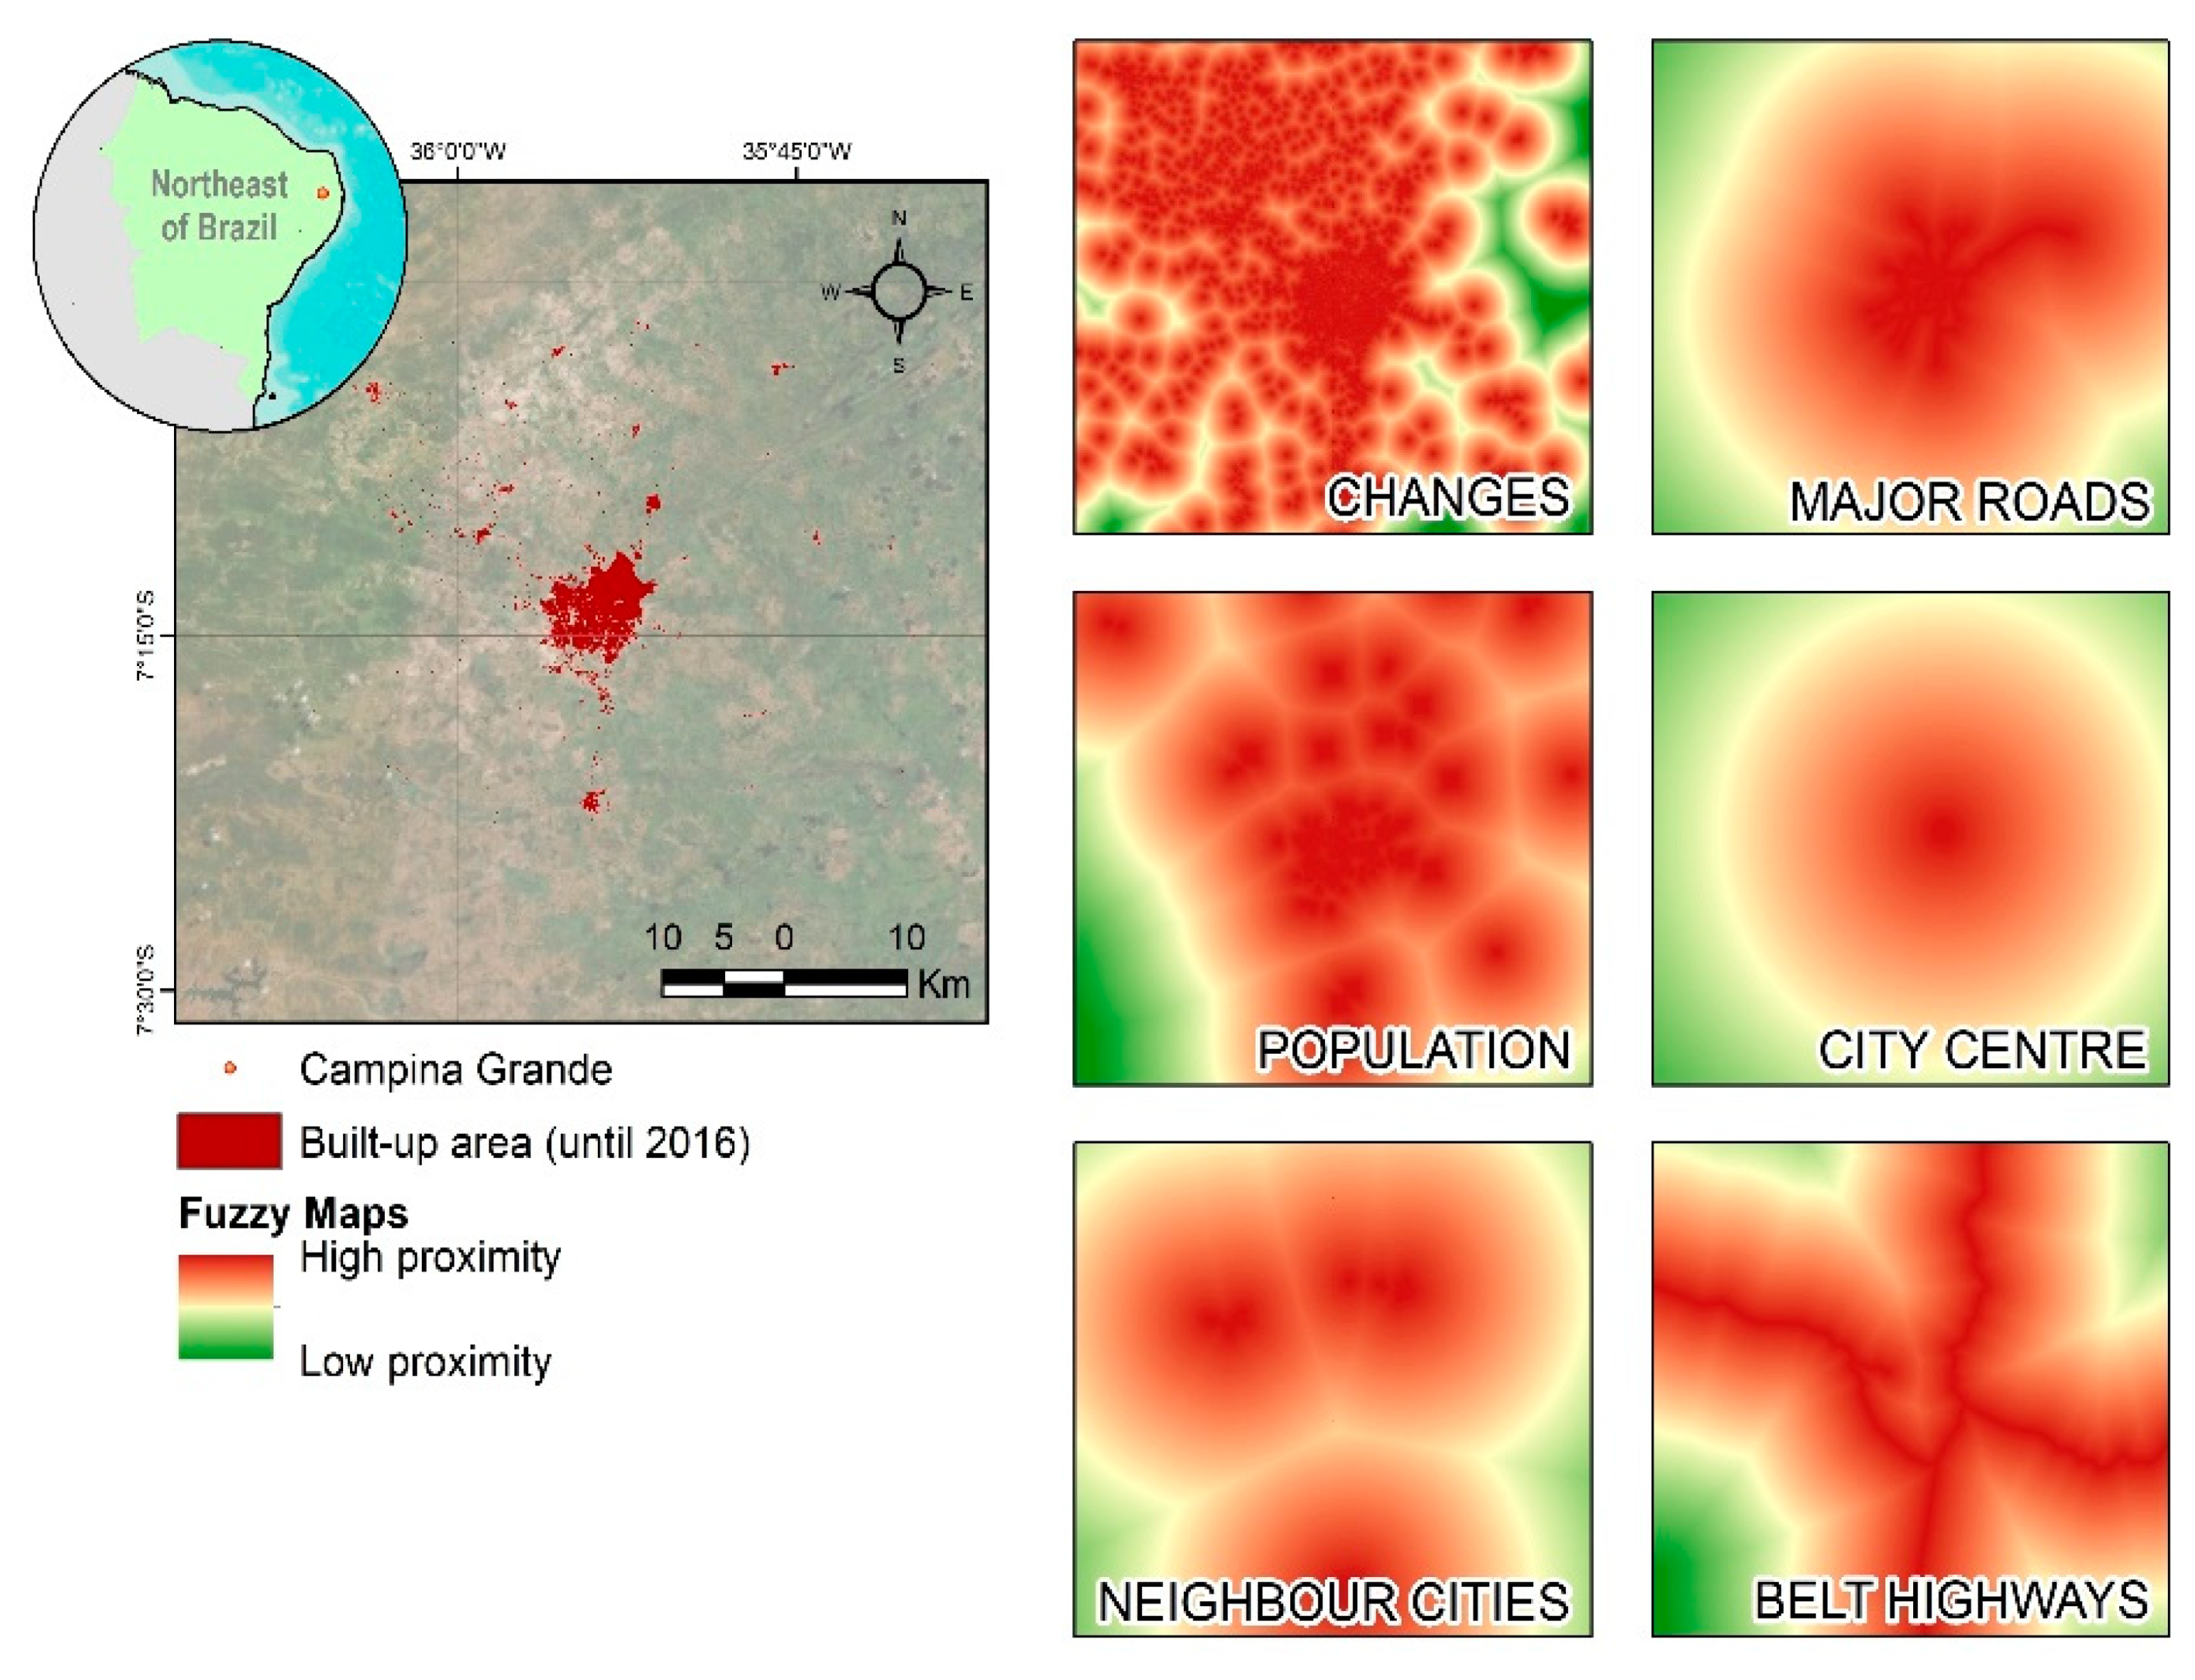
3.3. Datasets and Influencing Factors

The general methodology behind GHSL (available in https://ghsl.jrc.ec.europa.eu/) data consists of multitemporal products that offer an insight into the human presence in the past—1975, 1990, 2000, and 2014—based on Landsat Images. More recently, in 2016 the European Commission’s Joint Research Center (JRC) reduced some errors in automatic detection of built-up areas with the introduction of S1 data in the GHSL information production workflow [7,8]. This study uses two GHSL products generated from Landsat and Sentinel multisensor global data records. The GHSL built-up grids are clipped for the six cities. The description of the primary data is in Table 3. The GHSL basic concept to make the information from Earth’s surface to a pixel with a built-up area is based on the satellite image classification using machine learning techniques. Human settlement areas characterised by constructed human-made objects (buildings and others) are extracted and referred to as the building footprint area and, finally, modelled into built-up areas (Figure 6).
In this study, the built-up area was supplied to the model (SIMLANDER) in the binary form, representing built-up and non-built-up pixels. The main challenge was to explain transition rules (from one date to another) based on some neighbourhood influence. After that, the chosen explanatory (or influencing) variables could be applied in other cities because they often are LULC (Land-Use/Land-Cover) drivers for any changing in urban areas. Table 4 describes the variables and assumptions used in this study. Previous studies have shown the advantages of cost-based distance over Euclidean distance in the estimation of the suitability of occurrence for different land types [52,53,54,55]. Figure 7 shows an example of those variables for one of the studied cities. Each city has different input data and spatial characteristics, and then those maps need to be generated individually in a GIS environment.

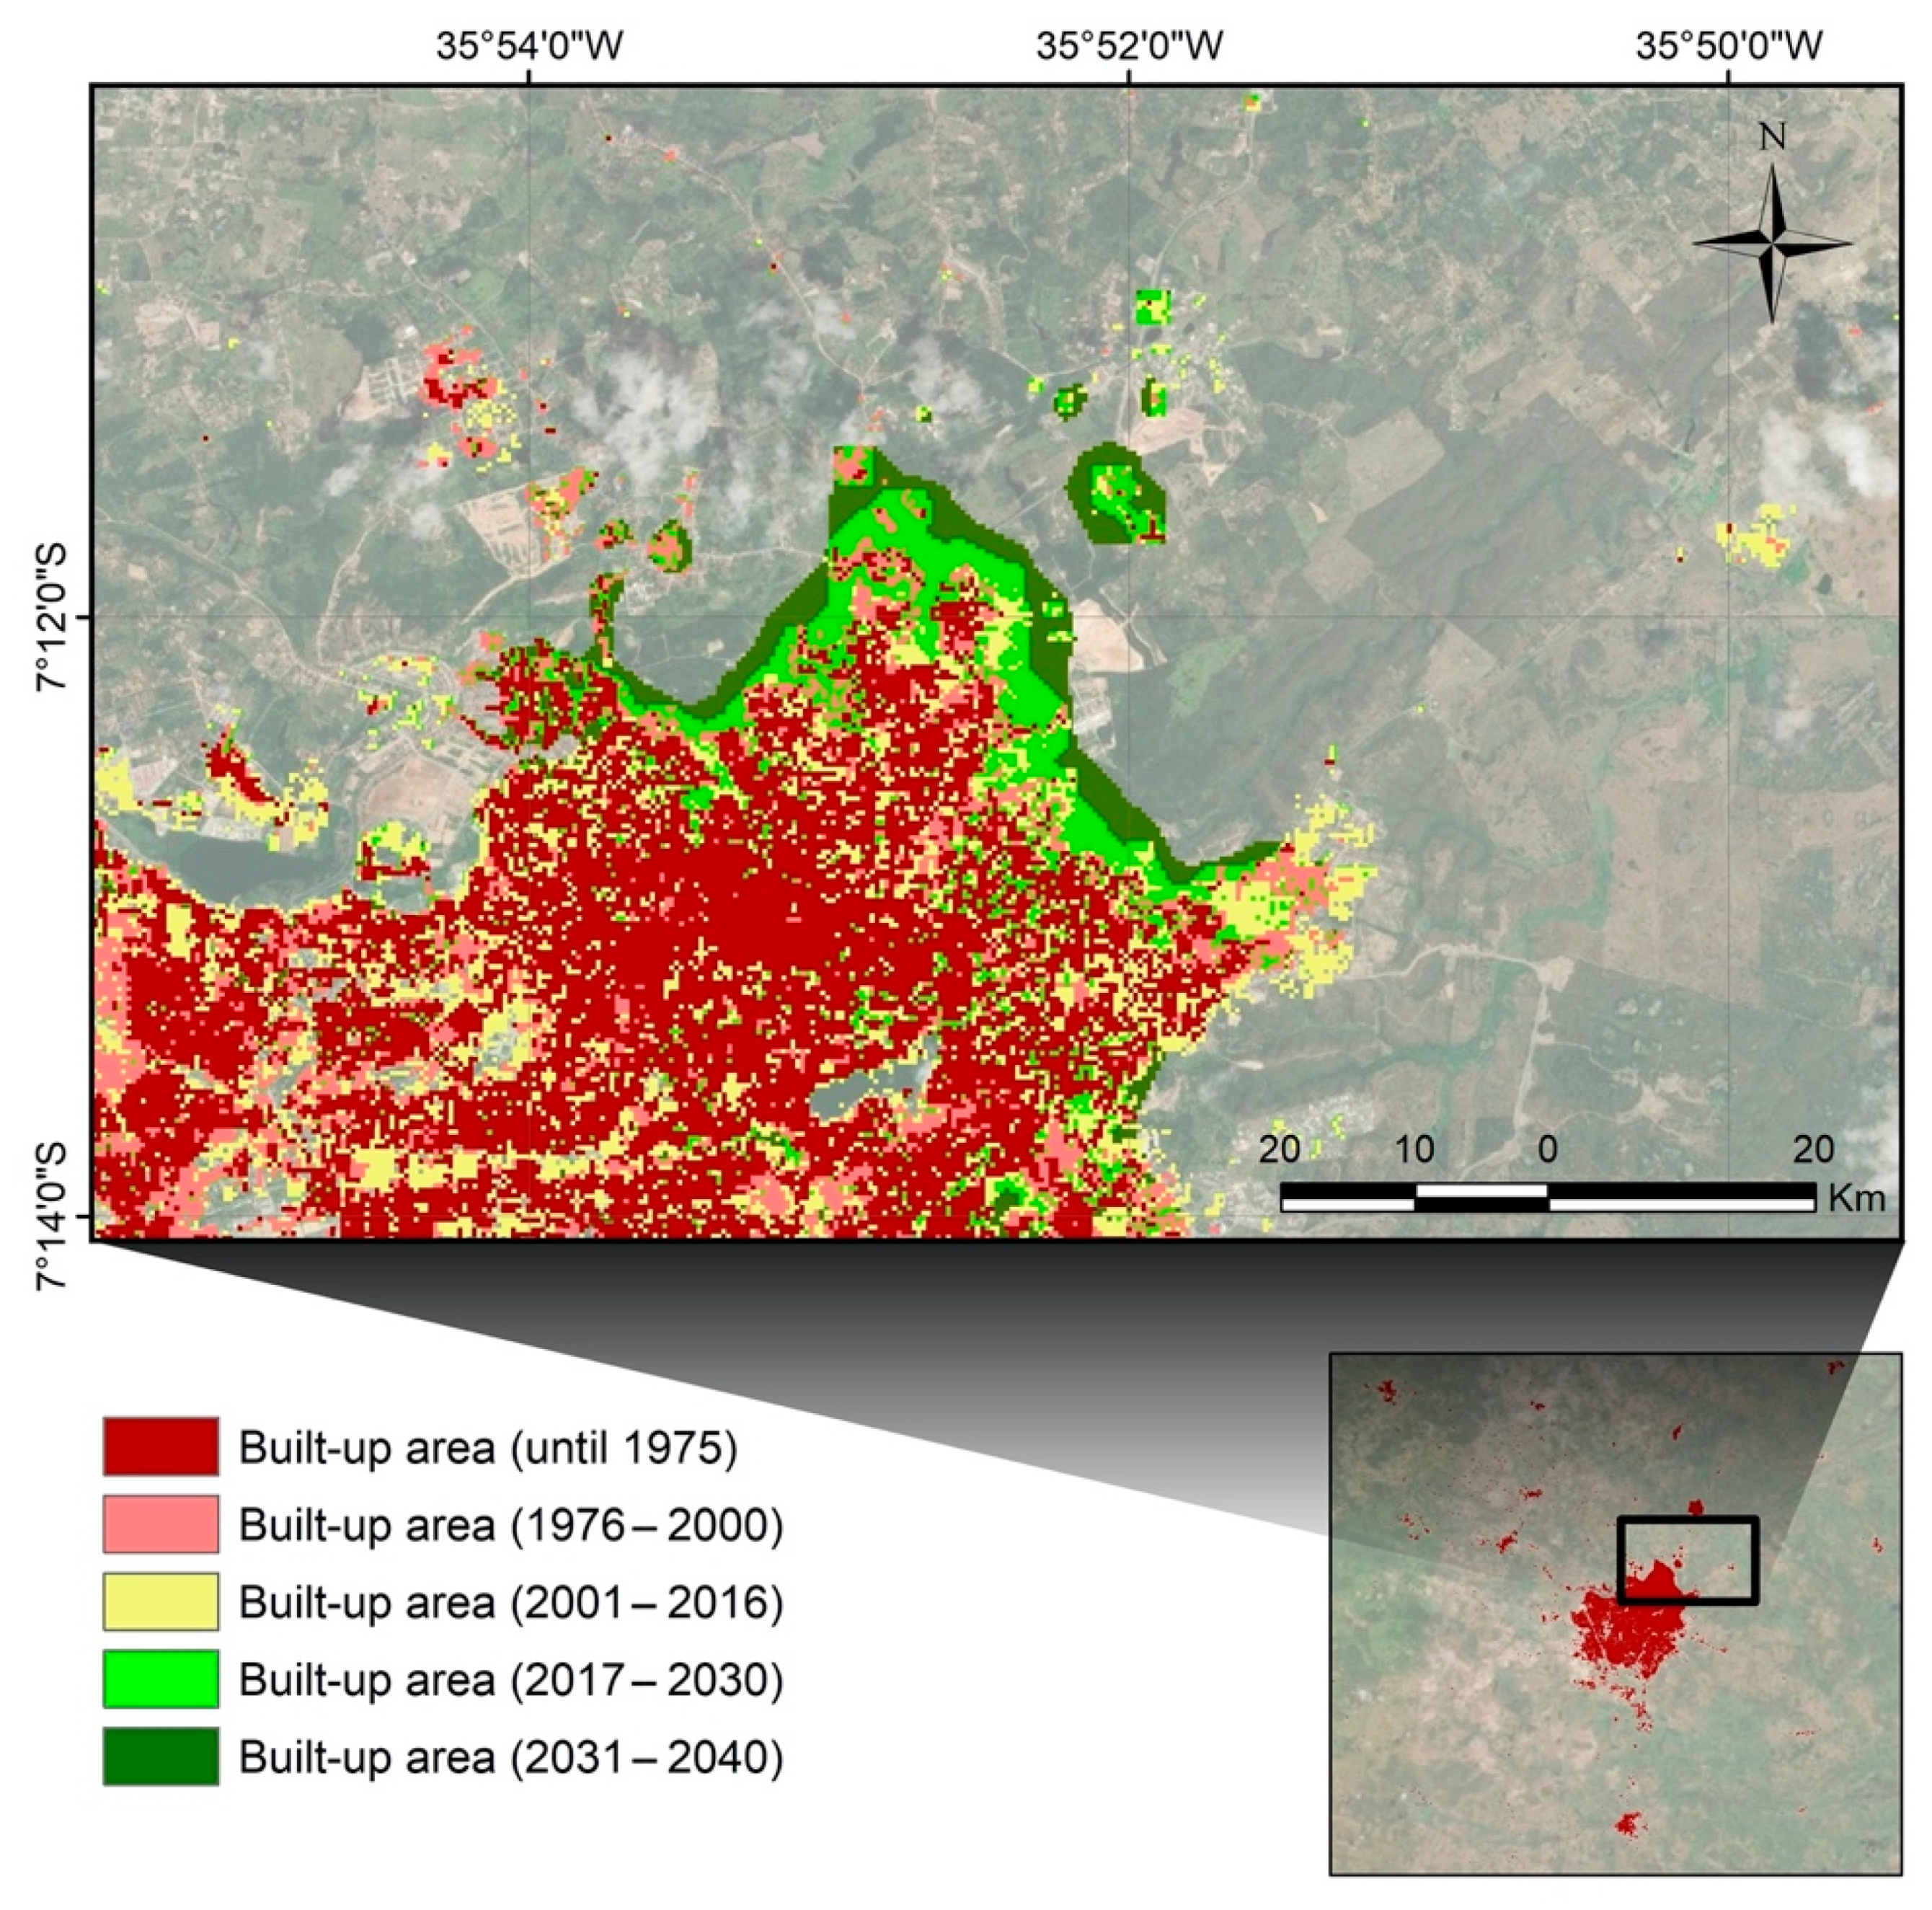
3.4. Methodology Overview

Initially, all the GHSL built-up grids (from different years) were clipped for each selected city. Once the bounding box was defined (the extent of analysis for each city defines the limit of neighbourhood analysis for many variables), the explanatory variables were chosen to generate the influencing factors based on previous assumptions and spatial analysis (Table 4). In this step, the transition rules were defined and tested. Once all variables (influence factors) were processed, the next step corresponded to calibration procedures, which were initiated using a baseline timestamp and a final timestamp to make the model run and achieve the best accuracy (using a comparison between a simulated data and the GHSL 2016 data). Finally, after various runs, the best accuracy defined the general transition rule for the whole model (in an equation) and other timestamps (initial and final) were tested, making possible future simulations. Figure 8 shows the workflow of the methodology.
After the first results, the calibration step kept moving on to increase the overall accuracy. The following running focused on the complexity of the urban growth trying to attend the three criteria proposed by Shi et al. [57]:
(i)
the “infilling” (increasing population density in the existing urban area);
(ii)
the “edge-expansion” or “extension” (urbanisation advancing from the edges of an existing urban area);
(iii)
“outlying” or “leap-frogging” (emergence of new urban patches that are isolated from existing urban areas).
Once the above issues were solved for the six cities, the calibration step ended and the built-up results (from years 2017 to 2040) were considered reliable and validated.

3.5. Trend Analysis and Applications

Due to multiple water-related hazards in the study cities, the built-up information was used with two main applications, the water demand estimation and flooding simulations.

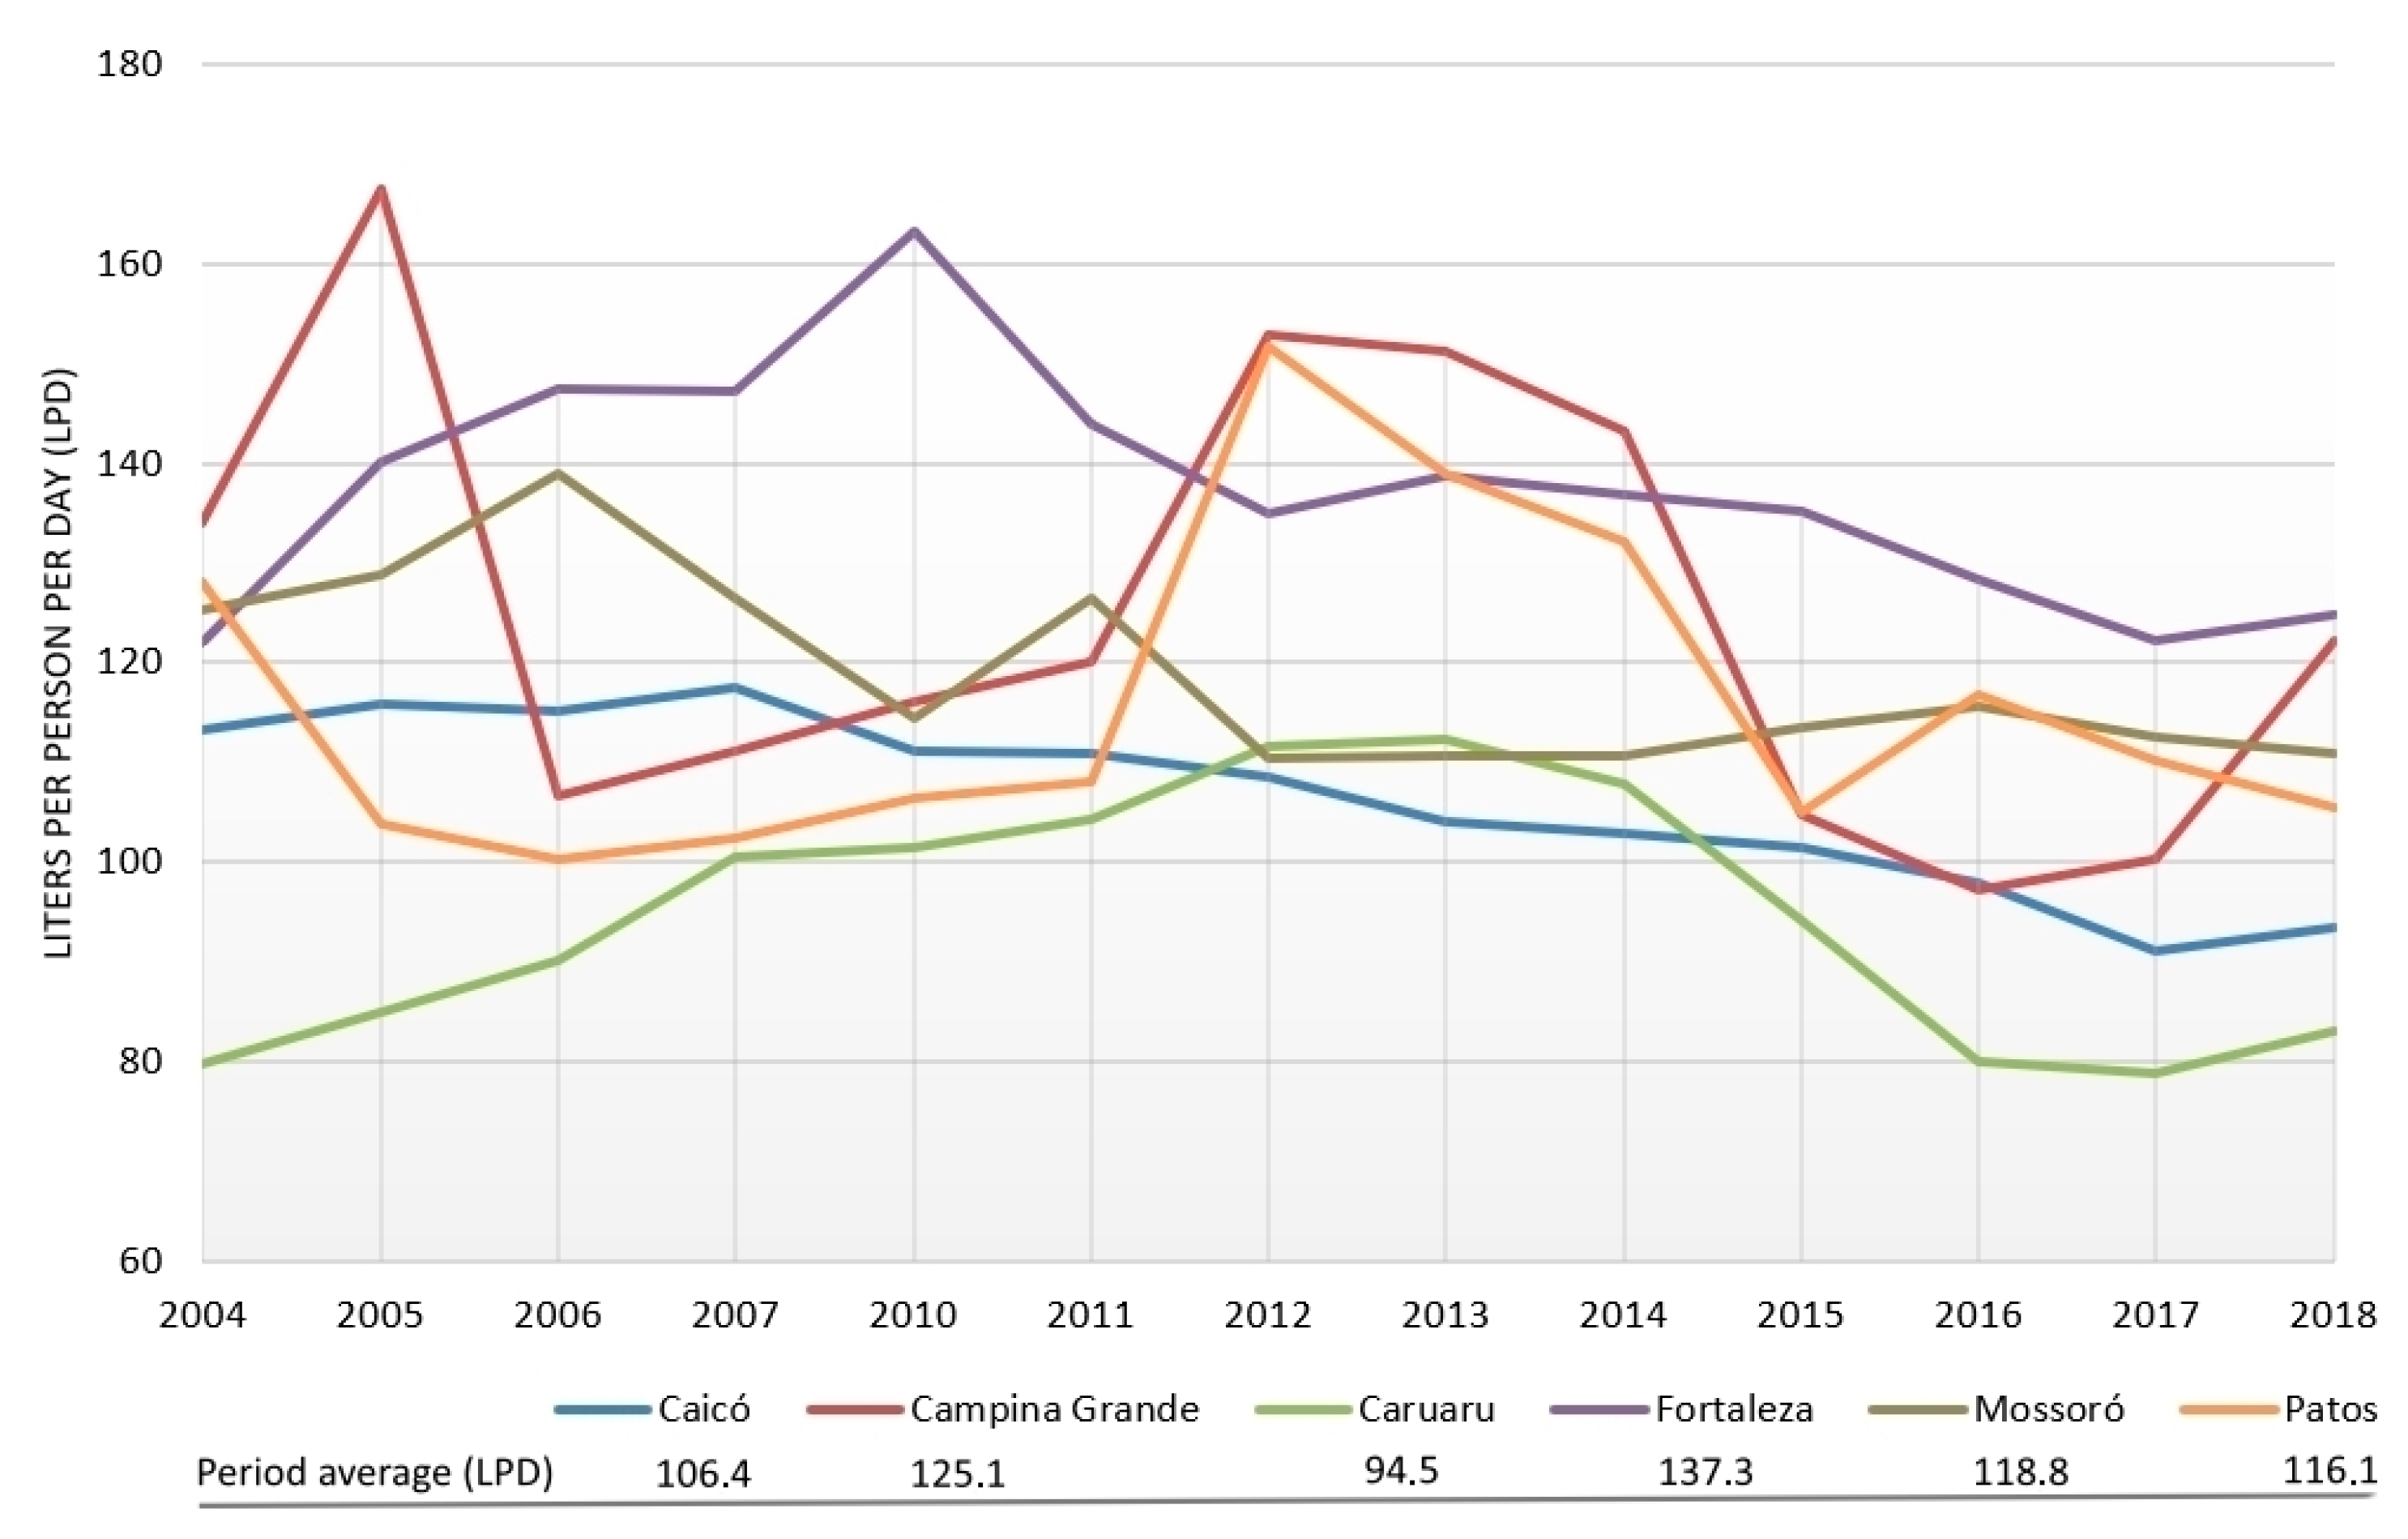
3.5.1. Water Demand Estimates

This stage’s greatest methodological challenge was establishing a relationship between population growth and water demand for past scenarios that can be applied for the future. Micro-measured water consumption data (historical consumption series) can also be used at this stage. In this study, the results were quantified and tabulated in graphs as a start point for future applications. The graphs show the urban sprawl’s behaviour and help identify similarities and differences among the cities and their suitable solutions for resilience issues. A comparison between built-up data and population data (historical and statistical projections) was also made by this study.
Water consumption estimation is essential to help in planning, managing, and operating water supply systems. Water consumption methods can be based on land-use patterns and trends [58]; historical water consumption behaviour (projecting a same future trend) [58]; or, most of the time, projected population data (by statistical studies) to predict future consumptions [59]. In this work, we suggest that, in addition to the quantification of population growth, the spatial analysis of urban spread is also a parameter for future estimates once it can provide better support for pipe network expansion (for newly places).
The water consumption for each city was analysed using historical data from National Sanitation Information System (SNIS) [60], and the data were plotted in line graphs to allow a cross-related analysis with population and built-up data. The lack of data in national repositories did not allow the inclusion of the years 2008 and 2009 in the analysis.

3.5.2. Future Imperviousness Rates for Flood Simulations

The Cellular Automata Dual-Drainage Simulation (CADDIES) model was used for flood simulations). CADDIES is a 2D fast cellular automata-based surface-water model developed at the Centre for Water Systems (CWS), University of Exeter [61,62]. CADDIES increases simulation speed whilst maintaining accuracy through the application of an adaptive time step [63,64]. CADDIES’s input data are land use, infiltration, roughness, elevation (DEM), and rainfall. Land use and DEM were inserted in the model as 10 × 10 m raster files. Each cell of the grid has a value corresponding to infiltration, roughness, and rainfall, in which the infiltration represents the soil infiltration and roughness the drainage capacity [40]. The time step of 0.01 s was undertaken in the simulations.
Due to data availability, the city of Campina Grande (PB) was chosen amongst the other NEB cities for the flooding simulations. Recent studies modelled flooding in the city [19,21], however, the impacts in terms of urban sprawl have not been simulated yet. The city is currently reviewing its Master Plan, which indicates that policymakers can benefit from the prediction of flooding in the future to guide local planning decisions. The city represents an application of the use of built-up information for NEB cities. The model calibration was made with flood/no flood (F/NF) comparisons with two previous flooding events in the city. F/NF comparisons classify the flood depth in each pixel as either a flood or no flood, based on a threshold level [64]. Here, we considered all pixels with more than 10 cm as flooded. Twenty-four scenarios were simulated considering one-hour rainfall events with constant intensities of 81.7 mm h−1 and 41.7 mm h−1 for 2011 and 2020, respectively. Rainfall data were provided by the Executive Water Agency of Paraíba (AESA). The final calibrated values of roughness and infiltration are seen in Table 5. In this table, simulations were verified in 71.43% and 86.60% for the events of 2011 and 2020, respectively [65].

4. Results and Discussions

Figure 9 shows the “edge-expansion” and the “outlying” of new urban fragments in the northeast portion of Campina Grande [57].
The same phenomenon occurred in the other cities studied and it shows how urban dynamics are observed spatially. Thus, the results indicate the new percentage of urbanised areas and where the phenomenon (new urban built-up) will probably occur. Built-up surfaces can be used consistently for global risk modelling, impact analysis, and policy formulation in disaster risk reduction [6]. For instance, the northeast portion of Campina Grande’s city has been going through an accelerated urbanisation process, driven by the construction of private residential condominiums and proximity to the neighbour city of Lagoa Seca (approximately 4 km far from Campina Grande). In this case, the variable “distance to other cities”, generally disregarded in other CA urban models, explains a type of urban growth frequent in NEB cities: a strong economic and social dependence between cities, triggering it as an attractor of changes. It is worth highlighting how precise and accurate an expansion water supply plan could be based on those simulations. In NEB cities, the new allotments usually are sold out before the suitable infrastructure. There is a massive disconnection between urban planning and water supply planning in this city [30]. In this sense, a simulation of where the built-up spreading will possibly happen should support land-use guidelines and permits towards a more sustainable and resilient city. Regarding the six cities, Figure 10 shows the 2016 GHSL data (used for accuracy validation) overlaying the 2040 future scenario (the last year of the simulation).
Due to the size differences between the cities, it is hard to see all the details (Figure 10). The dark red pixels represent a trend of urban sprawl and the graph quantifies the results. The graph shows different behaviours for similar cities. Only Patos and Caicó showed similar built-up trends, with less urban spreading, a fact justified by the verticalization of those cities in the last decades. Patos and Caicó are significant cities in their region and work as “poles of attraction” for education issues (universities and schools), health issues (hospitals and health centres), and business (shopping centres and industry). Then, there is a trend of high buildings causing a high density and a less spreading of the built-up.
Campina Grande, Caruaru, and Mossoró are known because of their strategic location in their states. They are middle-sized cities crossed by major roads, making them “passing through” cities for many NEB trade routes. Besides, those cities have a strong relationship with cultural tourism, which attracts tourists from many other parts of the country in some months of the year. The built-up process in those cities is very similar, as are their climate conditions and urban water problems. Fortaleza was excluded from this graph analysis because it is the biggest city (with more than 250 km2 of built-up area, making it impossible to visualise it in the same graphic scale of the other cities), and it presents itself with behaviour typical for a capital and coastal city in NEB—with urban growth and spreading along the seaside.
Evidently, in addition to urban patterns, understanding urban densification processes (with lots of high buildings close to each other) transcends a two-dimensional view of urban space by integrating issues linked to the multiple dimensions of space production (economic, social, political, and cultural). This result can support similar land-use plans and permits to improve water security in those cities. However, the slight difference between the trends reflects historical differences in the urban growth spatial pattern, once the simulation is based on transition rules calibrated for the GHSL past data. That is something exciting for using this methodology in other cities in NEB. Although this study used an automatic calibration method based on accuracy increasing for all six cases, there was a high sensibility related to individual historical trends of built-up spreading. This fact is directly related to the GHSL input data as they are primarily generated by years of remote sensing observation.
The global built-up areas and population density data are used to make up for the missing information to understand disaster impacts and model mitigation and adaptation strategies for climate changes or extremes [69]. The Brazilian Urban Master Plans usually do not consider water resources issues or environmental issues [30]. So, the land use and occupation planning usually do not consider the pressure they impose on water resources. Climate change and urban growth in an ill-planned scenario also affect run-off patterns in cities. Besides, high buildings (urban density increasing) drive a water supply and water drainage pressure by reducing green and open spaces in urban areas. Poverty and economic issues cause different perceptions with different vulnerability levels [20,27]. There is a lack of synergy between the water resources, sanitation, social, environmental, and urban policies. In this sense, the next sections show some impressive results using future built-up scenarios for water demand applications and flood simulations.

4.1. Water Demand Applications

From 2012 onwards, the Brazilian semi-arid region suffered the impacts of one of the most extended droughts ever [18], which affected water availability in hundreds of cities and towns across the NEB region. The overlapping of droughts with pre-existing social, economic, and political tensions has placed intense pressure on the availability of fresh, quality water in the region and has threatened water, energy, and food security [58]. Figure 11 shows water consumption in the six cities from 2004 to 2018 and identifies water consumption reduction, reflecting the period of water scarcity and water rationing. The graph can be used as a possible consumption upper threshold in water security plans.
Caruaru had the lowest LPD average for the analysed period. In 2017, for example, the population living in that city was submitted to a severe water rationing with only five days with water supply service in every 25 (twenty-five) days. At the end of the drought period, the population started being supplied by water 10 (ten) days per month (five days every 15 days) [59], which reduced water consumption considerably.
Only Fortaleza (the only one located outside the semi-arid region) did not undergo water rationing among the cities analysed. However, the city started to encourage water savings, charging extra fees to residents who did not save on monthly water expenses, which justifies the decrease in daily consumption [69]. Caicó, Patos, and Campina Grande also joined the rationing during the drought period [20,27], leaving up to seven days without water. Among the cities located in the semi-arid region, Mossoró was the only one that underwent a nongeneralised rationing system, applying measures in only a few neighbourhoods (water was supplied only 12 h per day). These initiatives explain the water consumption curve’s behaviour, where cities that underwent rationing had sharp reductions in consumption per person in 2014, while Fortaleza and Mossoró had fewer reductions than other cities. Figure 12 shows different relations between built-up increase and population increase for the six cities.
When the population increase is more prominent than the built-up increase, it can mean a high-density occupation trend. It can mean the densification of buildings in some urban areas and a more punctual pressure for water resources in some areas of the city than others. This was the case in Caicó, Patos, Mossoró, Caruaru, and Fortaleza. Campina Grande differs from other cities and has a higher percentage of the built-up area; this behaviour reflects housing estates’ construction in peripheral neighbourhoods (urban fringes) and new residential condominiums, accentuating land-use changes and spreading.
The natural resilience phenomena (mentioned in the previous section) can be observed in all those six cities. To learn how to keep living with minimum health conditions, even in a total absence of water supply service for many days is a survival lesson and sure, a perfect coping capacity opportunity. To use the results of built-up simulations for a water demand estimate for future scenarios shall consider that resilience and at the same time, it can stimulate a more resilient behaviour through regulations and laws.

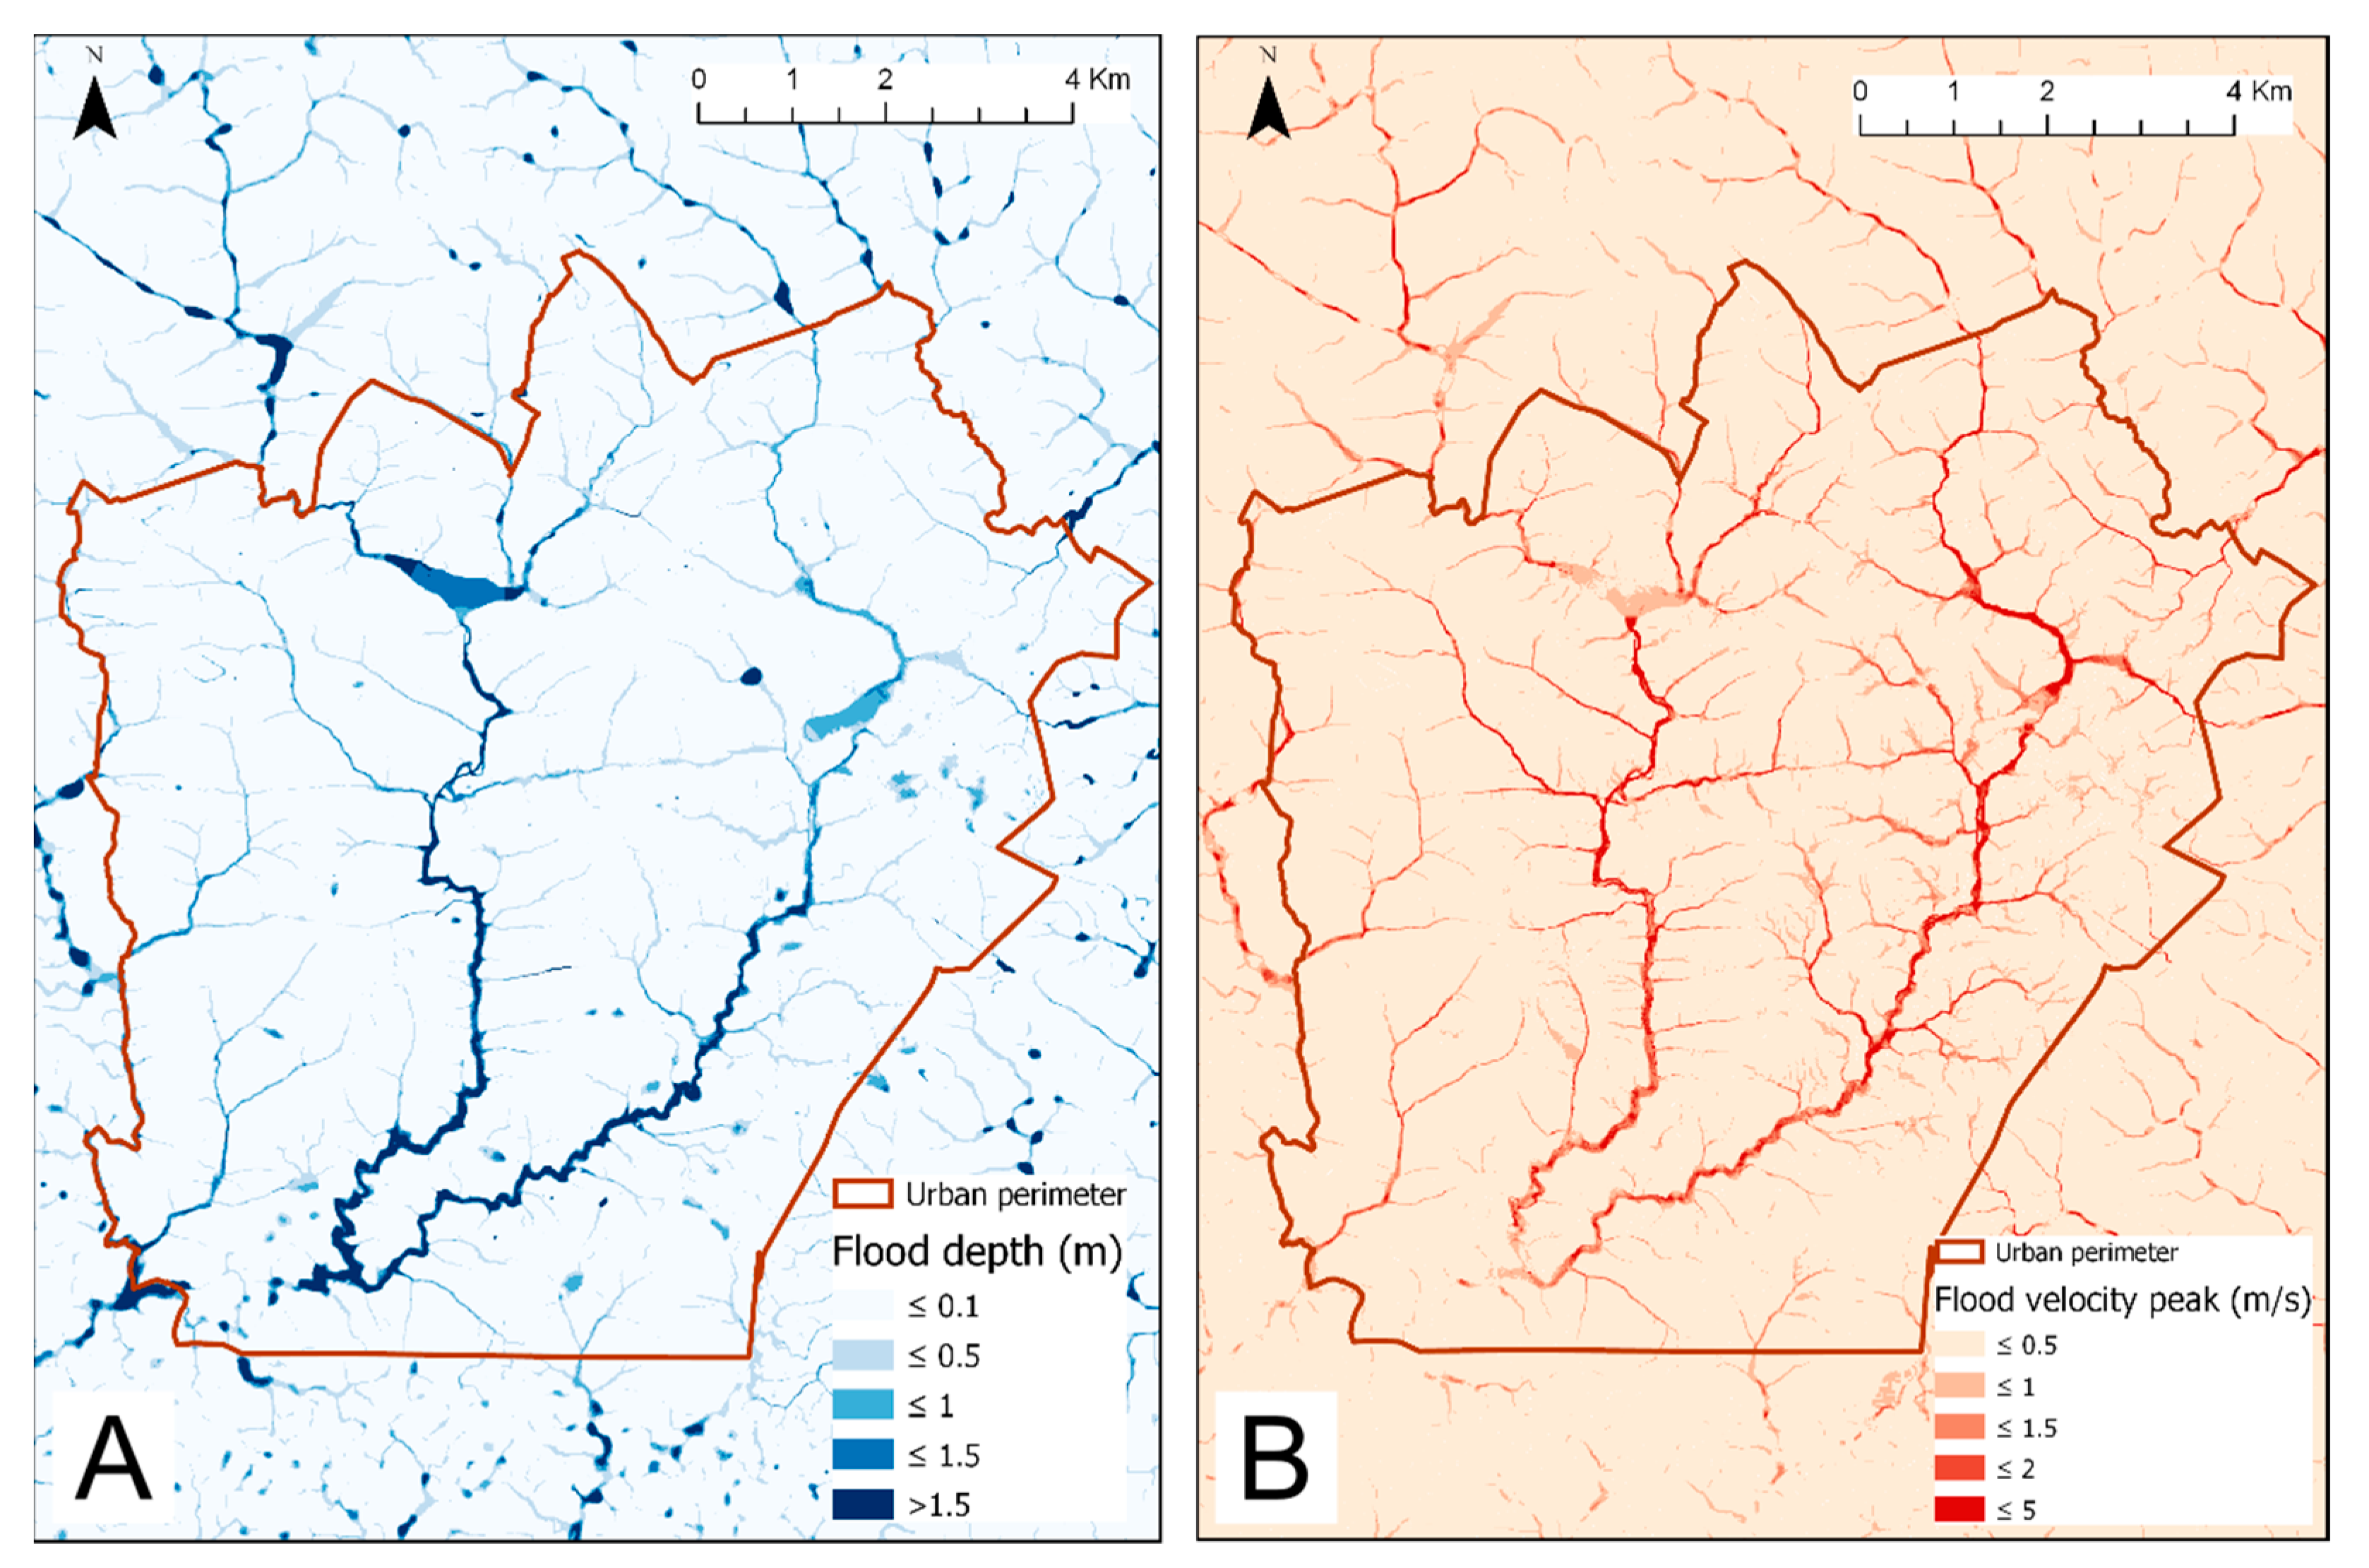
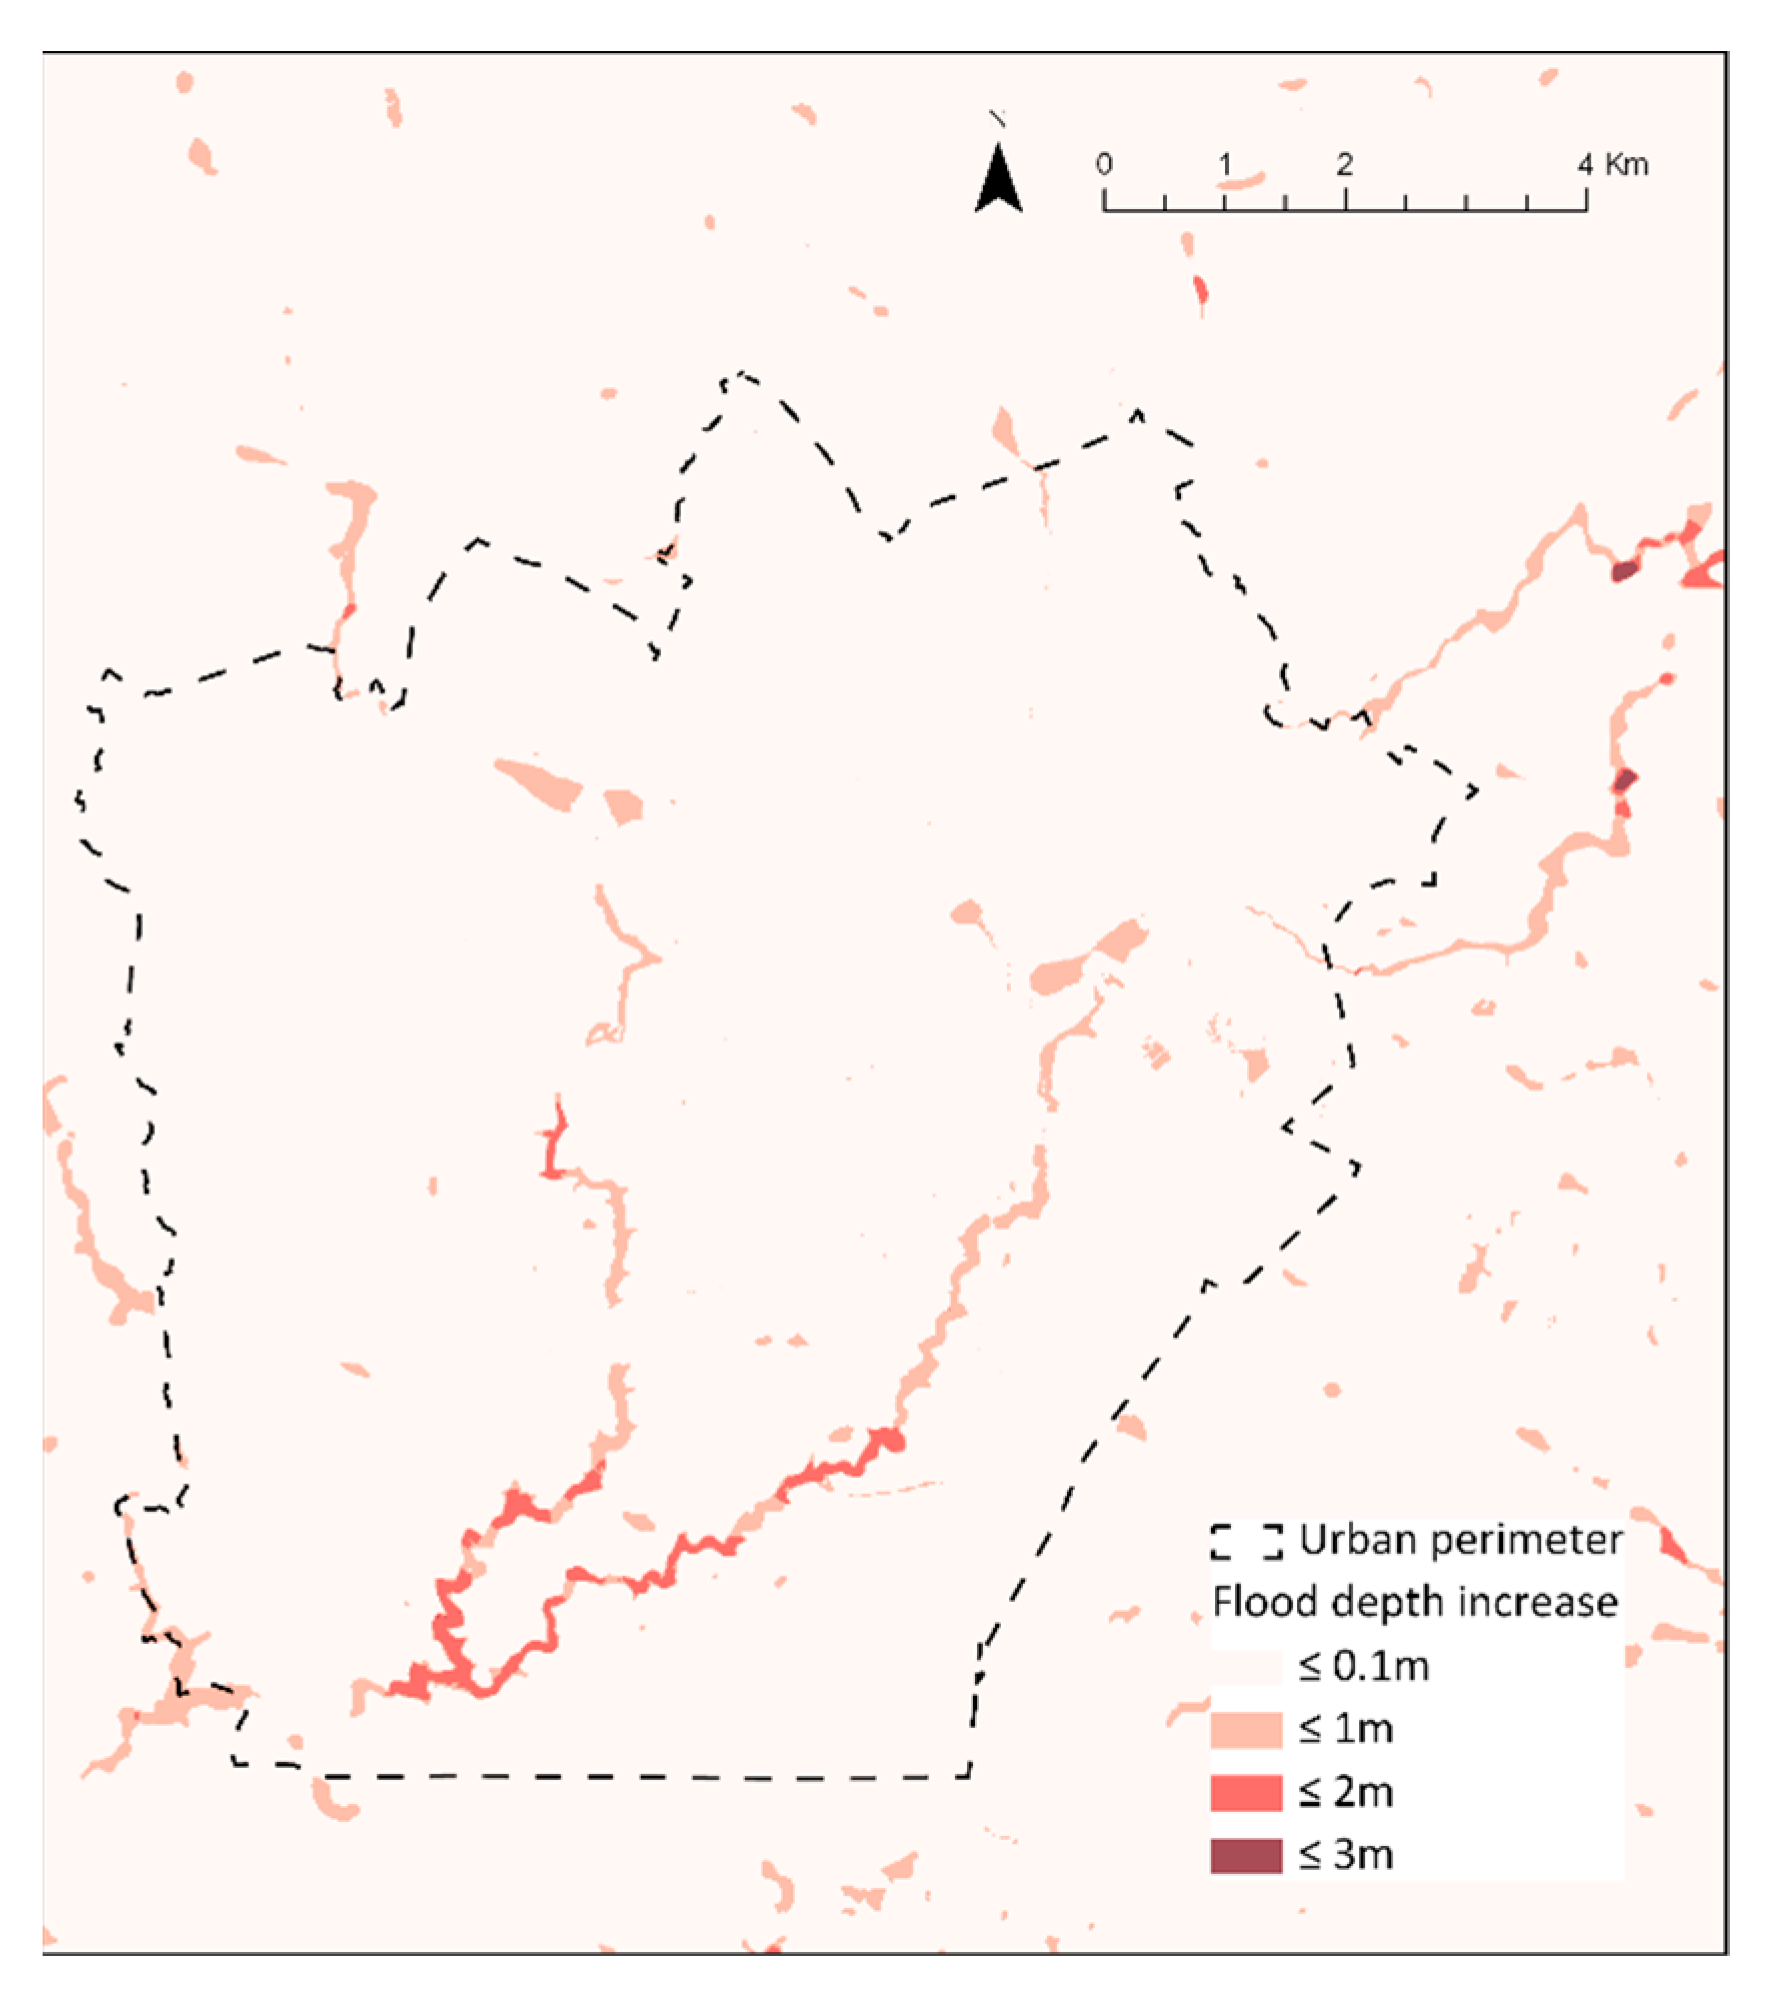
4.2. Flood Simulation Applications

The flood simulations corresponding to the 2011 rainfall event are presented in this study. The land use represents the built-up information of 2040, the street delineation (from the premise that the streets will be the same in 2040), and urban areas. Figure 13A presents peak flood depth across Campina Grande (PB) in 2040. Despite the flooding being localised mainly in the city’s two main watercourses, many places will be facing flooding. This is particularly important since Campina Grande is a middle-sized city currently facing urbanisation and is currently reviewing its Master Plan [30].
For comparisons, a historical flooding map with 237 flood points was built with information from social media, news websites, civil defence reports, and informal meetings with authorities. Besides, a survey applied to 123 residents from Campina Grande confirmed that they have experienced flooding in their households in the past [31,70]. The locations of the 360 flood cases represent areas in the city with the probability of flooding.
For sustainable drainage systems projects, the imperviousness rates (past and future) are crucial data. They are ubiquitous input data for run-off models. Usually, scenarios for floods are simulated according to the existing methodologies simulating the drainage response in an urban environment [71,72]. As future land-use is unknown, the conventional procedure estimates percentual increases in imperviousness rates based on past trends. The current approach enables planners and engineers to see more deeply where and if the water depth will increase in a possible future with urban growth or spreading. To illustrate the approach, this methodology considers the following equation:
Flood Depth Increase (FDIn) = 〖WD〗_tf − 〖WD〗_ti
WD refers to water depth, tf refers to the final year in analysis, and ti to the initial year in the analysis. In this case, we considered the years 2040 and 2020, respectively (Figure 14). Figure 15 shows the same information in two different aggregation unities using spatial zonal analysis: census track and urban basins.
Having the flood depth increase for any future scenario in a raster with values per pixel allows flexibility of urban water management and planning once it is possible to aggregate and visualise the information by census block or urban basins (Figure 15A,B). Figure 15 is an example of a significant result derived from the built-up simulation when it is used for floods studies. Administrative boundaries as a census track or hydrological unities as the urban basin can be chosen as planning unities for zonal guidelines.

5. Conclusions

In a CA model, neighbourhood influencing functions can be calibrated using multi-temporal remote sensing data [9,12,39]. Global datasets, such as the GHSL, can be used in a wide range of applications avoiding the time-consuming task of field acquiring of data and amplifying possibilities [7,8,73].
This study, as well as a similar study in other NEB cities [42,43,44,45], can help water supply planning when making possible the visualisation of the urban sprawl trends. The traditional approach to estimate water demands based on population projections does not allow spatial planning, which is crucial for water supply systems. In this sense, dynamic modelling of the urban grow tells more for planners and policymakers.
Cross-related analysis with statistical grids of population density could improve the estimation of water consumption per pixel. This pixel rate could be used in future scenarios as well as the ones we got in this work. First, tests using water consumption average from SNIS (national database) [60] showed some good results but still lacked data for better validation. Further steps include finding a calibrated function to cross-relate built-up data and population density and include using water meter readings (historical series) from the cities to refine the calibration.
Future built-up information is meaningful information for flooding management. Usually, drainage plans use a fixed rate for urban growth, which can or cannot happen. This present study’s approach allows a much more refined approximation the reality and the visualisation of the built-up sprawling out. One of the most significant advantages of this methodology is shown in Figure 14 and Figure 15. The current approach enables the planners to see where the flood depth will be increased for different years (2021 to 2040). Also, The analysis of flooding in the future scenario allows the integration of water resources with urban planning.
In Brazil, the Integrated Water Resources Management (IWRM) is often considered insufficient and weak [74], due to critical issues like policy implementation and policy review. For [75], there is a lack of successful integrating territorial planning and water resources planning in Brazil. In this context, flooding analysis in the future can be beneficial for the development of collaboration between water and planning sectors. For example, flood pixels can be zoned within planning boundaries, such as census blocks and neighbourhoods, to provide guidelines for constructing future buildings. Also, other information like flood velocity and extent (Figure 15B) can be used as input for an informed proposal of green infrastructure (GI) and nature-based solutions (NbS) in local scales. As an application for the subsequent studies, the model can be improved by analysing the flooding with future built-up information and climate change scenarios.
Then, priority areas can be pointed out to the policymakers improving coping capacity [70]. Regulation and spatial planning can make use of these results to define land-use permits or even water permits. Dynamic modelling results also allow simulations of possible situations in pessimistic and optimistic scenarios of climate change.
Some of the approach’s limitations are the lack of ground truth information for simulations (both water demand estimates and floods simulation). Most of the databases are country-based with inherent uncertainties of regional or national databases when it is downscaled for a local application. Although the built-up data showed a very high potential for urban water management, land-use data could add more details to improve the accuracy of the simulations proposed. Land-use data define better water consumption (residential, commercial, services) and run-off values (different materials). However, the possibility of having future built-up scenarios like the one shown in Figure 9 for all the most important cities in NEB, with the trends of spreading and dynamicity well described, is an excellent advance for urban planners and water managers.

Author Contributions

Conceptualisation, I.R. and S.D.; methodology, I.R., H.C.d.B., and P.B.R.A.; software, H.C.d.B. and P.B.R.A.; validation, I.R., H.C.d.B., and P.B.R.A.; formal analysis, H.C.d.B. and P.B.R.A.; investigation, I.R., S.D., and P.B.R.A.; resources, I.R.; data curation, I.R., H.C.d.B., and P.B.R.A.; writing—original draft preparation, I.R.; writing—review and editing, I.R., H.C.d.B., S.D., and P.B.R.A.; visualisation, I.R.; supervision, I.R. and S.D.; project administration, I.R. and S.D.; funding acquisition, I.R. and S.D. All authors have read and agreed to the published version of the manuscript.

Funding

This research was funded by CNPq/PDE (Grant No 205565/2018-2), by CNPq/PQ (Grant No 313323/2017-8), by Coordenação de Aperfeiçoamento de Pessoal de Nível Superior—Brasil (CAPES)—Finance Code 001 (Grant No 88881.129673/2016-01) and (Grant No 88882.455177/2019-01).

Data Availability Statement

The data presented in this study are available on request from the corresponding author.

Conflicts of Interest

The authors declare no conflict of interest.

References

  1. Seto, K.C.; Guneralp, B.; Hutyra, L.R. Global forecasts of urban expansion to 2030 and direct impacts on biodiversity and carbon pools. Proc. Natl. Acad. Sci. USA 2012, 109, 16083–16088. [Google Scholar] [CrossRef] [Green Version]
  2. Wu, J. Urban ecology and sustainability: The state-of-the-science and future directions. Landsc. Urban Plan. 2014, 125, 209–221. [Google Scholar] [CrossRef]
  3. Simpson, R. Introduction: A Green Economy for Green Cities. In The Economy of Green Cities; Springer: Dordrecht, The Netherlands, 2013; pp. 13–16. [Google Scholar]
  4. Khan, D.M.; Veerbeek, W.; Chen, A.S.; Hammond, M.J.; Islam, F.; Pervin, I.; Djordjević, S.; Butler, D. Back to the future: Assessing the damage of 2004 Dhaka flood in the 2050 urban environment. J. Flood Risk Manag. 2018, 11, S43–S54. [Google Scholar] [CrossRef]
  5. Gennaio, M.-P.; Hersperger, A.M.; Bürgi, M. Containing urban sprawl—Evaluating effectiveness of urban growth boundaries set by the Swiss Land Use Plan. Land Use Policy 2009, 26, 224–232. [Google Scholar] [CrossRef]
  6. Pesaresi, M.; Ehrlich, D.; Kemper, T.; Siragusa, A.; Florczyk, A.J.; Freire, S.; Corbane, C. Atlas of the Human Planet 2017 Global Exposure to Natural Hazards; Publications Office of the European Union: Luxembourg, 2017. [Google Scholar] [CrossRef]
  7. Corbane, C.; Politis, P.; Syrris, V.; Pesaresi, M. GHS Built-Up Grid, Derived from Sentinel-1 (2016), R2018A; Joint Research Centre (JRC): Ispra, Italy, 2018. [Google Scholar]
  8. Corbane, C.; Pesaresi, M.; Politis, P.; Syrris, V.; Florczyk, A.J.; Soille, P.; Maffenini, L.; Burger, A.; Vasilev, V.; Rodriguez, D.; et al. Big earth data analytics on Sentinel-1 and Landsat imagery in support to global human settlements mapping. Big Earth Data 2017, 1, 118–144. [Google Scholar] [CrossRef] [Green Version]
  9. Soares-Filho, B.S.; Nepstad, D.C.; Curran, L.M.; Cerqueira, G.C.; Garcia, R.A.; Ramos, C.A.; Voll, E.; McDonald, A.; Lefebvre, P.; Schlesinger, P. Modelling conservation in the Amazon basin. Nature 2006, 440, 520–523. [Google Scholar] [CrossRef]
  10. Alnsour, J.A. Managing urban growth in the city of Amman, Jordan. Cities 2016, 50, 93–99. [Google Scholar] [CrossRef]
  11. Gant, R.L.; Robinson, G.M.; Fazal, S. Land-use change in the ‘edgelands’: Policies and pressures in London’s rural–urban fringe. Land Use Policy 2011, 28, 266–279. [Google Scholar] [CrossRef]
  12. Soares-Filho, B.S.; Coutinho Cerqueira, G.; Lopes Pennachin, C. Dinamica—A stochastic cellular automata model designed to simulate the landscape dynamics in an Amazonian colonisation frontier. Ecol. Model. 2002, 154, 217–235. [Google Scholar] [CrossRef]
  13. van Vliet, J.; Hurkens, J.; White, R.; van Delden, H. An Activity-Based Cellular Automaton Model to Simulate Land-Use Dynamics. Environ. Plan. B Plan. Des. 2012, 39, 198–212. [Google Scholar] [CrossRef]
  14. Verburg, P.H.; Overmars, K.P. Dynamic Simulation of Land-Use Change Trajectories with the Clue-S Model. In Modelling Land-Use Change; Springer: Dordrecht, The Netherlands, 2007; pp. 321–337. [Google Scholar]
  15. Neumann, J.; Burks, A.W. Theory of Self-Reproducing Automata; University of Illinois press: Urbana, IL, USA, 1966. [Google Scholar]
  16. Conway, J. The game of life. Sci. Am. 1970, 223, 4. [Google Scholar]
  17. Stanganini, F.N.; de Lollo, J.A. O crescimento da área urbana da cidade de São Carlos/SP entre os anos de 2010 e 2015: O avanço da degradação ambiental. Urbe. Rev. Bras. Gestão Urbana 2018, 10, 118–128. [Google Scholar] [CrossRef] [Green Version]
  18. Marengo, J.A.; Cunha, A.P.; Soares, W.R.; Torres, R.R.; Alves, L.M.; de Barros Brito, S.S.; Cuartas, L.A.; Leal, K.; Ribeiro Neto, G.; Alvalá, R.C.S.; et al. Increase Risk of Drought in the Semiarid Lands of Northeast Brazil Due to Regional Warming above 4 °C. In Climate Change Risks in Brazil; Springer International Publishing: Cham, Switzerland, 2019; pp. 181–200. [Google Scholar]
  19. Campos, J.N.B. Paradigms and Public Policies on Drought in Northeast Brazil: A Historical Perspective. Environ. Manag. 2015, 55, 1052–1063. [Google Scholar] [CrossRef] [PubMed] [Green Version]
  20. Grande, M.; Galvão, C.; Miranda, L.; Rufino, I. Environmental equity as a criterion for water management. Proc. Int. Assoc. Hydrol. Sci. 2014, 364, 519–525. [Google Scholar] [CrossRef] [Green Version]
  21. Beck, H.E.; Zimmermann, N.E.; McVicar, T.R.; Vergopolan, N.; Berg, A.; Wood, E.F. Present and future Köppen-Geiger climate classification maps at 1-km resolution. Sci. Data 2018, 5, 180214. [Google Scholar] [CrossRef] [PubMed] [Green Version]
  22. Agência Nacional de Águas (Brasil). Conjuntura dos Recursos Hídricos no Brasil 2019: Informe Anual; ANA: Brasília, Brazil, 2019.
  23. Maisonnave, F.; Prado, A. Nordeste: Seca Histórica já Dura Seis Anos e Ameaça Tornar-Se Regra No Semiárido. Available online: https://arte.folha.uol.com.br/ciencia/2018/crise-do-clima/nordeste/seca-historica-ja-dura-seis-anos-e-ameaca-tornar-se-regra-no-semiarido/ (accessed on 20 November 2020).
  24. Magalhães, A.R. Vida e seca no Brasil. In Secas No Brasil: Política e Gestão Proativas; Centro de Gestão e Estudos Estratégicos—CGEE: Brasília, Brazil, 2016; pp. 19–35. [Google Scholar]
  25. De Medeiros, M.D.; Zanella, M.E. Estudo das vazões e estimativas de inundações no Baixo-Açu-RN. Geo UERJ 2019, 34, e40946. [Google Scholar] [CrossRef]
  26. De Freitas, C.M.; Silva, D.R.X.; de Sena, A.R.M.; Silva, E.L.; Sales, L.B.F.; de Carvalho, M.L.; Mazoto, M.L.; Barcellos, C.; Costa, A.M.; Oliveira, M.L.C.; et al. Desastres naturais e saúde: Uma análise da situação do Brasil. Cien. Saude Colet. 2014, 19, 3645–3656. [Google Scholar] [CrossRef] [PubMed] [Green Version]
  27. de Sousa, M.J.C.; Rufino, I.A.A.; Alves, P.B.R.; Filho, M.N.M.B. Water shortage risk mapping: A GIS-MCDA approach for a medium-sized city in the Brazilian semi-arid region. Urban Water J. 2020, 17, 642–655. [Google Scholar] [CrossRef]
  28. Alves, P.B.R.; de Melo Filho, H.; Tsuyuguchi, B.B.; Rufino, I.A.A.; Feitosa, P.H.C. Mapping of flood susceptibility in Campina Grande county—PB: A spatial multicriteria approach. Bol. Ciências Geodésicas 2018, 24, 28–43. [Google Scholar] [CrossRef]
  29. Instituto Trata Brasil. Ranking do Saneamento; GO Associados: São Paulo, Brazil, 2018. [Google Scholar]
  30. Alves, P.B.R.; Rufino, I.A.A.; Feitosa, P.H.C.; Djordjević, S.; Javadi, A. Land-Use and Legislation-Based Methodology for the Implementation of Sustainable Drainage Systems in the Semi-Arid Region of Brazil. Sustainability 2020, 12, 661. [Google Scholar] [CrossRef] [Green Version]
  31. Alves, P.B.R.; Djordjevic, S.; Javadi, A.; Lucena, D.P.M.M.; Barbosa, G.A.; Lacerda, M.C.; Alvarenga, V.M.L.; Agra, S.T.M.C.; Simões, P.C.; Vieira, M.D.A.; et al. Evaluation of a socio-environmental approach for disaster risk management. In Proceedings of the Water Efficiency Conference, Bristol, UK, 3–4 September 2020; Ward, S., Staddon, C., Eds.; University of West of England: Bristol, UK, 2020. [Google Scholar]
  32. Thapa, R.B.; Murayama, Y. Scenario based urban growth allocation in Kathmandu Valley, Nepal. Landsc. Urban Plan. 2012, 105, 140–148. [Google Scholar] [CrossRef]
  33. Gonzalez-Aguilera, D.; Crespo-Matellan, E.; Hernandez-Lopez, D.; Rodriguez-Gonzalvez, P. Automated Urban Analysis Based on LiDAR-Derived Building Models. IEEE Trans. Geosci. Remote Sens. 2013, 51, 1844–1851. [Google Scholar] [CrossRef]
  34. Nyamekye, C.; Kwofie, S.; Ghansah, B.; Agyapong, E.; Boamah, L.A. Assessing urban growth in Ghana using machine learning and intensity analysis: A case study of the New Juaben Municipality. Land Use Policy 2020, 99, 105057. [Google Scholar] [CrossRef]
  35. Mondal, B.; Das, D.N.; Dolui, G. Modeling spatial variation of explanatory factors of urban expansion of Kolkata: A geographically weighted regression approach. Model. Earth Syst. Environ. 2015, 1, 29. [Google Scholar] [CrossRef]
  36. Triantakonstantis, D.; Mountrakis, G.; Wang, J. A Spatially Heterogeneous Expert Based (SHEB) Urban Growth Model using Model Regionalisation. J. Geogr. Inf. Syst. 2011, 3, 195–210. [Google Scholar] [CrossRef] [Green Version]
  37. Aburas, M.M.; Ho, Y.M.; Ramli, M.F.; Ash’aari, Z.H. The simulation and prediction of spatio-temporal urban growth trends using cellular automata models: A review. Int. J. Appl. Earth Obs. Geoinf. 2016, 52, 380–389. [Google Scholar] [CrossRef]
  38. Liao, J.; Shao, G.; Wang, C.; Tang, L.; Huang, Q.; Qiu, Q. Urban sprawl scenario simulations based on cellular automata and ordered weighted averaging ecological constraints. Ecol. Indic. 2019, 107, 105572. [Google Scholar] [CrossRef]
  39. Hewitt, R.; Pacheco, J.D.; Gómez, B.M. A Cellular Automata Land Use Model for the R Software Environment (Weblog). Available online: https://simlander.wordpress.com (accessed on 10 May 2020).
  40. Hewitt, R.; Díaz Pacheco, J.; Moya Gómez, B. APoLUS/SIMLANDER Updated Versions Released. Available online: https://simlander.wordpress.com/2020/04/01/apolus-simlander-updated-versions-released/ (accessed on 10 May 2020).
  41. Hermanns, T.; Helming, K.; König, H.J.; Schmidt, K.; Li, Q.; Faust, H. Sustainability impact assessment of peatland-use scenarios: Confronting land use supply with demand. Ecosyst. Serv. 2017, 26, 365–376. [Google Scholar] [CrossRef]
  42. De Nys, E.; Engle, N.L.; Quintana, C. A Framework and Convening Power. In Drought in Brazil: Proactive Management and Policy; De Nys, E., Engle, N.L., Magalhães, A.R., Eds.; CRC Press: Boca Raton, FL, USA, 2016; pp. 27–35. [Google Scholar]
  43. Filho, F.D.A.S.; Formiga-Johnsson, R.M.; Studart, T.M.D.C.; Abicalil, M.T. From Drought to Water Security: Brazilian Experiences and Challenges. In Global Water Security: Lessons Learnt and Long-Term Implications; Springer: Singapore, 2018; pp. 233–265. [Google Scholar]
  44. Marengo, J.A.; Cunha, A.P.; Alves, L.M. A seca de 2012-15 no semiárido do Nordeste do Brasil no contexto histórico. Climanálise 2016, 3, 49–54. [Google Scholar]
  45. Oliveira, D.H.M.C.; Lima, K.C. What is the return period of intense rainfall events in the capital cities of the northeast region of Brazil? Atmos. Sci. Lett. 2019, 20. [Google Scholar] [CrossRef]
  46. Cemaden (Centro Nacional de Monitoramento e Alertas de Desastres Naturais). Available online: http://www.cemaden.gov.br/municipios-monitorados-2/ (accessed on 15 December 2020).
  47. SNIS (Sistema Nacional de Informações sobre Saneamento). Available online: http://www.snis.gov.br/ (accessed on 15 December 2020).
  48. Salinas, C.E.T.; de Oliveira, V.P.V.; Brito, L.; Ferreira, A.V.; de Araújo, J.C. Social impacts of a large-dam construction: The case of Castanhão, Brazil. Water Int. 2019, 44, 871–885. [Google Scholar] [CrossRef]
  49. Suassuna, J. Açude de Boqueirão Atinge Seu Ponto Mais Crítico e Entra No Volume Morto. Available online: http://www.suassuna.net.br/2016/02/acude-de-boqueirao-atinge-seu-ponto.html (accessed on 24 November 2020).
  50. Redação GNEWS. Abastecimento: Com Baixa No rio Piranhas-Açu, Caern Intensifica Rodízio em Três Cidades do Seridó. Available online: https://guamarenews.com/abastecimento-com-baixa-no-rio-piranhas/ (accessed on 15 November 2020).
  51. Júnior, P. Chuvas Ocasionam Alagamento e Impedem Passagem de Veículos em Frente ao Cemitério do Bairro Boa Passagem. Available online: https://correiodoserido.com.br/chuvas-ocasionam-alagamento-e-impedem-passagem-de-veiculos-em-frente-ao-cemiterio-do-bairro-boa-passagem/ (accessed on 10 December 2020).
  52. Antoni, J.-P.; Vuidel, G.; Omrani, H.; Klein, O. Geographic Cellular Automata for Realistic Urban form Simulations: How Far Should the Constraint be Contained? In The Mathematics of Urban Morphology; Birkhäuser: Cham, Switezerland, 2019; pp. 147–162. [Google Scholar]
  53. Kong, F.; Yin, H.; Nakagoshi, N.; James, P. Simulating urban growth processes incorporating a potential model with spatial metrics. Ecol. Indic. 2012, 20, 82–91. [Google Scholar] [CrossRef]
  54. Li, F.; Wang, L.; Chen, Z.; Clarke, K.C.; Li, M.; Jiang, P. Extending the SLEUTH model to integrate habitat quality into urban growth simulation. J. Environ. Manag. 2018, 217, 486–498. [Google Scholar] [CrossRef] [PubMed] [Green Version]
  55. Braimoh, A.K.; Onishi, T. Spatial determinants of urban land use change in Lagos, Nigeria. Land Use Policy 2007, 24, 502–515. [Google Scholar] [CrossRef]
  56. IBGE. Grade Estatística. Available online: https://mapasinterativos.ibge.gov.br/grade/default.html (accessed on 5 June 2020).
  57. Shi, Y.; Sun, X.; Zhu, X.; Li, Y.; Mei, L. Characterising growth types and analysing growth density distribution in response to urban growth patterns in peri-urban areas of Lianyungang City. Landsc. Urban Plan. 2012, 105, 425–433. [Google Scholar] [CrossRef]
  58. Gutiérrez, A.P.A.; Engle, N.L.; De Nys, E.; Molejón, C.; Martins, E.S. Drought preparedness in Brazil. Weather Clim. Extrem. 2014, 3, 95–106. [Google Scholar] [CrossRef] [Green Version]
  59. Diário de Pernambuco. Racionamento de Água em Caruaru é Reduzido em Cinco Dias. Available online: https://www.diariodepernambuco.com.br/noticia/vidaurbana/2017/06/racionamento-de-agua-em-caruaru-e-reduzido-em-cinco-dias.html (accessed on 23 December 2020).
  60. SNIS (Sistema Nacional de Informações sobre Saneamento). Diagnóstico dos Serviços de Água e Esgotos—2018. Available online: http://www.snis.gov.br/diagnostico-anual-agua-e-esgotos/diagnostico-dos-servicos-de-agua-e-esgotos-2018 (accessed on 14 May 2020).
  61. Zubaidi, S.L.; Ortega-Martorell, S.; Al-Bugharbee, H.; Olier, I.; Hashim, K.S.; Gharghan, S.K.; Kot, P.; Al-Khaddar, R. Urban Water Demand Prediction for a City That Suffers from Climate Change and Population Growth: Gauteng Province Case Study. Water 2020, 12, 1885. [Google Scholar] [CrossRef]
  62. Zheng, H.; Zhou, W.; Zhang, L.; Li, X.; Cheng, J.; Ding, Z.; Xu, Y.; Hu, W. Urban Water Consumption Patterns in an Adult Population in Wuxi, China: A Regression Tree Analysis. Int. J. Environ. Res. Public Health 2020, 17, 2983. [Google Scholar] [CrossRef]
  63. Vamvakeridou-Lyroudia, L.S.; Chen, A.S.; Khoury, M.; Gibson, M.J.; Kostaridis, A.; Stewart, D.; Wood, M.; Djordjevic, S.; Savic, D.A. Assessing and visualising hazard impacts to enhance the resilience of Critical Infrastructures to urban flooding. Sci. Total Environ. 2020, 707, 136078. [Google Scholar] [CrossRef]
  64. Guidolin, M.; Chen, A.S.; Ghimire, B.; Keedwell, E.C.; Djordjević, S.; Savić, D.A. A weighted cellular automata 2D inundation model for rapid flood analysis. Environ. Model. Softw. 2016, 84, 378–394. [Google Scholar] [CrossRef] [Green Version]
  65. Wang, Y.; Chen, A.S.; Fu, G.; Djordjević, S.; Zhang, C.; Savić, D.A. An integrated framework for high-resolution urban flood modelling considering multiple information sources and urban features. Environ. Model. Softw. 2018, 107, 85–95. [Google Scholar] [CrossRef]
  66. Webber, J.L.; Booth, G.; Gunasekara, R.; Fu, G.; Butler, D. Validating a rapid assessment framework for screening surface water flood risk. Water Environ. J. 2019, 33, 427–442. [Google Scholar] [CrossRef]
  67. Wong, T.H.F.; Brown, R.R. The water sensitive city: Principles for practice. Water Sci. Technol. 2009, 60, 673–682. [Google Scholar] [CrossRef] [PubMed] [Green Version]
  68. McCuen, R.H.; Johnson, P.A.; Ragan, R.M. Hydrology, Hydraulic Design Series No. 2. FHWA–SA–96–067; Federal Highway Administration, US Department of Transportation: Washington, DC, USA, 1996.
  69. G1 Ceará. Consumo de Água cai na Grande Fortaleza Após Cobrança de Tarifa. Available online: http://g1.globo.com/ceara/noticia/2016/03/consumo-de-agua-reduz-na-grande-fortaleza-apos-cobranca-de-tarifa.html (accessed on 21 December 2020).
  70. Alves, P.B.R.; Cordão, M.J.D.S.; Djordjević, S.; Javadi, A.A. Place-Based Citizen Science for Assessing Risk Perception and Coping Capacity of Households Affected by Multiple Hazards. Sustainability 2021, 13, 302. [Google Scholar] [CrossRef]
  71. CHOW, V.T. Open-Channel Hydraulics; McGraw-Hill: New York, NY, USA, 1959. [Google Scholar]
  72. UK Environment Agency. What Is the Updated Flood Map for Surface Water; UK Environment Agency: Bristol, UK, 2013.
  73. Ehrlich, D.; Kemper, T.; Pesaresi, M.; Corbane, C. Built-up area and population density: Two Essential Societal Variables to address climate hazard impact. Environ. Sci. Policy 2018, 90, 73–82. [Google Scholar] [CrossRef]
  74. Libanio, P.A.C. Two decades of Brazil’s participatory model for water resources management: From enthusiasm to frustration. Water Int. 2018, 43, 494–511. [Google Scholar] [CrossRef]
  75. Miranda, L.I.B.D. A Crise Hidrica e a Gestão das Águas Urbanas na Bacia Hidrográfica do Rio Paraíba. In Proceedings of the XVII ENANPUR, São Paulo, Brazil, 22–26 May 2017. [Google Scholar]
Figure 1. Brazilian geographic regions and Köppen–Geiger classification map. Adapted from [21,22].
Sustainability 13 00748 g001
Figure 2. Northeastern Brazilian region (NEB)’s numbers and characterisation. Adapted from [29].
Sustainability 13 00748 g002
Figure 3. Conceptual graph of the “natural resilience” developed in the NEB’s cities.
Sustainability 13 00748 g003
Figure 4. Six selected cities in the NEB.
Sustainability 13 00748 g004
Figure 5. (A) Flood in Caicó (B) and Campina Grande. (C) Water level decreasing in the Caicó primary supply source. (D) Water level decreasing in the Campina Grande primary supply source. Sources: [49,50,51].
Sustainability 13 00748 g005
Figure 6. Global Human Settlement Layer (GHSL) conceptual extraction: built-up extraction [7].
Sustainability 13 00748 g006
Figure 7. Influencing factors maps for one city (Campina Grande, PB).
Sustainability 13 00748 g007
Figure 8. Methodology workflow.
Sustainability 13 00748 g008
Figure 9. Results of simulation for the city of Campina Grande.
Sustainability 13 00748 g009
Figure 10. Built-up areas for the cities (past, present, and future).
Sustainability 13 00748 g010
Figure 11. Water consumption for the cities from 2004 to 2018. Data extracted from [60].
Sustainability 13 00748 g011
Figure 12. The build-up increase versus population increase (1991 to 2010) for the six NEB cities.
Sustainability 13 00748 g012
Figure 13. CADDIES simulations for Campina Grande (PB): (A) flood depth peak, (B) flood velocity peak.
Sustainability 13 00748 g013
Figure 14. Flood depth increase (2040–2020) for Campina Grande, PB.
Sustainability 13 00748 g014
Figure 15. Flood increase in Campina Grande, PB in a zonal analysis: (A) census blocks, (B) basin.
Sustainability 13 00748 g015
Table 1. Criteria for the sample selection.
CriterionDescription
Population threshold
(over 50 thousand people)
Most of the towns in NEB are small cities (under 50 thousand people), and there are some “spots” that have been attracting urban growth over recent decades. Population information was collected through the Brazilian Institute of Geography and Statistics (IBGE).
The occurrence of water-related hazardsThis is mainly related to water scarcity and floods. The databases about floods are surrounded by uncertainty, but there has been national risk disaster mapping [46] of high-risk areas in those selected cities (as well as in many others in the NEB). The water supply services can be evaluated by a national database [47], and the latest information was considered in the selection of the cities.
Degree of urbanisation (over 70%)Considering the whole NEB, more than 70% of the population lives in an urban area. This study selected only cities with the degree of urbanisation above 70%. Although initially the study was focused on “non-capital” cities, all NEB capitals face some level of troubles regarding floods seasonally. In this sense, having one capital sample could improve the outreach of our research. The chosen capital (Fortaleza-CE) is one of the NEB capitals more dependent on semi-arid water resources. Past policymakers’ choices made the water supply highly dependent on Castanhão lake, one of the most affected surface reservoirs in the last drought [48].
Dynamic movement attractionThis characteristic is due to the movement attraction that some cities have because of the importance within a state. For example, Campina Grande and Caruaru are the second-most urbanised cities in Paraiba and Pernambuco states, respectively (IBGE). Both cities attract visitors due to commercial, industrial, cultural, and education activities. This increases the dynamic in each city and makes the prediction even more critical for the management
Previous studies and proximity for future assessmentsDue to the high applicability of the built-up information in further studies, this work also considered the proximity and previous knowledge and studies about them [27,30]. It shall facilitate the development of field studies in the future.
Table 2. Selected cities for this study. Source: IBGE (National Institute of Geographical and Statistical data).
CitiesPopulation (2020)Area (km2)Degree of Urbanisation (%)State Ranking (Population)
Fortaleza—CE2,669,342312.391.8
Campina Grande—PB409,731591.689.6
Mossoró—RN297,3782099.379.7
Caruaru—PE361,118920.677.4
Caicó—RN67,9521228.584.5
Patos—PB107,605472.890.4
Table 3. Primary data used in the study for the six selected cities.
GHSL Data/CollectionDescriptionTechnical Information
GHS_BUILT_LDSMT_GLOBE_R2018Abuilt-up up to the 1975 period
built-up during the 1975 to 1990 period
built-up during the 1990 to 2000 period
built-up during the 2000 to 2014 period
Multitemporal classification of built-up presence from Landsat images; 30 m of resolution—Pseudo Mercator (EPSG:3857)
GHS_BUILT_S1NODSM_GLOBE_R2018Abuilt-up presence as derived from Sentinel1 image collections (2016)Built-up surfaces derived from global Sentinel-1 Synthetic Aperture Radar (SAR) satellite data, collected during 2016; 20 m of resolution—Spherical Mercator (EPSG:3857)
Table 4. Influencing variables of changes in urban areas.
VariablesAssumptionsReferences
Distance to city centreThe more is the proximity to the city centre is an area, the more attractive it is to changes. Land-use changes tend to be more frequent in the NEB city centres, as well as the number of buildings and imperviousness. The assumption here is: the built-up areas increase as long they are close to the city centre
[13,14]
[32,38,39,40,41,42,43,44]
[52,53,54,55]
Distance to main roadsChanges are more substantial and often close to the main roads. Accessibility attracts changes in urban areas.
Distance to belt highwaysThe cities’ fringes are continually changing in NEB. Usually close to the belt highways. Those areas can be becoming attractive for the easy access options in the edge of the traffic of a city.
Distance to other citiesThe neighbourhood influence is strong in NEB. There is a lot of economic and social dependence between the cities, which is a change attractor. The nearer to other cities, the more the possibility to change increases.
Population densityA statistical grid of population density [56] was used and the closer to more populated pixels, the more the possibility to change increases. Usually, areas with a higher number of buildings and high density levels tend to attract changes.
Inherent dynamic (changes)For each city, the distance to the pixels that changed (more attractive pixel) was considered. The 2014 grid and 1975 grid were compared, and all changed pixels were change attractor pixels.
Table 5. Parameter values in Cellular Automata Dual-Drainage Simulation (CADDIES).
Land UseInfiltration
(mm h−1)
Roughness (Manning’s)Sources
Built-up imperviousness00.012McCuen [66]
Roads100.013Chow [67]
Urban120.065EA [68]
Publisher’s Note: MDPI stays neutral with regard to jurisdictional claims in published maps and institutional affiliations.

