Abstract
Nowadays, energy management aims to propose different strategies to utilize available energy resources, resulting in sustainability of energy systems and development of smart sustainable cities. As an effective approach toward energy management, non-intrusive load monitoring (NILM), aims to infer the power profiles of appliances from the aggregated power signal via purely analytical methods. Existing NILM methods are susceptible to various issues such as the noise and transient spikes of the power signal, overshoots at the mode transition times, close consumption values by different appliances, and unavailability of a large training dataset. This paper proposes a novel event-based NILM classification algorithm mitigating these issues. The proposed algorithm (i) filters power signals and accurately detects all events; (ii) extracts specific features of appliances, such as operation modes and their respective power intervals, from their power signals in the training dataset; and (iii) labels with high accuracy each detected event of the aggregated signal with an appliance mode transition. The algorithm is validated using REDD with the results showing its effectiveness to accurately disaggregate low-frequency measured data by existing smart meters.
1. Introduction
Due to the unpredictable nature of both generation, caused by renewable energy resources, and consumer demand, maintaining the balance between generation and demand is one of the main challenges in smart grids [1,2]. Residential demand-side management programs have thus emerged as a promising set of methods to strike such balance [3]. In view of these programs, non-intrusive load monitoring (NILM), that is, the process of extracting the power profile or operating pattern of each appliance from the aggregated power signal of a house using purely analytical methods, has gained a great deal of attention in recent years [4]. Practical and efficient, NILM provides consumers with an opportunity to track the energy consumption of each appliance and voluntarily change their usage patterns to save energy and reduce the cost while maintaining their comfort which also results in higher stability and efficiency of the power grid [5,6].
The concept of NILM was first introduced in 1992 by Hart [7]. Since then, a variety of analytical algorithms have been proposed to address the NILM problem. These algorithms employ various features and parameters such as voltage, current, and active and reactive power signals of a house. As measuring the active power is cost-efficient, a majority of studies have focused on this feature alone [8]. NILM research based on the active power signal diverged into two main lines of study: (i) state-based algorithms that consider each appliance as a finite-state machine and disaggregate the total power signal based on the learned model of state transitions of appliances [9] and (ii) event-based algorithms, which are based on the edges or considerable variations of the signal caused by turning ON/OFF of appliances or their other mode transitions [3]. Due to the low computational complexity of event-based techniques, they have proved more popular than the state-based ones [10].
In designing an event-based algorithm, multiple challenges are involved. The first one lies in the event detection part caused by the presence of noise, spikes, uncertainties in the voltage of the grid, and overshoots in appliances’ power signals. The second challenge is closeness of different appliances’ consumption values which makes them somewhat indistinguishable. The third and last challenge is that high volume training datasets and ground-truth information about each appliance are scarce in practice, although a small amount of data can perhaps be collected for each residential building. Overcoming these challenges, this paper proposes an event-based NILM algorithm with competitive accuracy, which, first, detects events in the power signals via a novel method, then extracts specific features and information about appliances from their consumption profiles in a small training dataset, and finally utilizes them to disaggregate the aggregated power signal.
1.1. Related Work
The most well-known state-based NILM algorithms are the Hidden Markov Model (HMM) [11] and its variants such as Factorial HMM methods [12]. The main drawback of these methods is the requirement for a large training dataset to construct and learn the model. Computational complexities of these methods also increases exponentially by adding a new appliance [13]. However, event-based NILM techniques which deal with the detected events of the aggregated signal and classify them have lower computational complexities in comparison with state-based ones [14]. Recent research of event-based NILM falls into two main categories: unsupervised and supervised methods [15]. Unsupervised NILM algorithms, tackling the so-called blind source problem, deal with the case where no prior information about appliances is available. In these methods, events are detected and different clustering algorithms such as subtractive clustering [16] and k-means [17] are applied to them. They detect different clusters of appliances without assigning a label to each cluster. Despite some success in the case where all appliances have only two (ON and OFF) modes, these algorithms have been ineffective in dealing with multi-mode appliances [17,18].
In contrast with unsupervised NILM methods, supervised algorithms such as NILM classification algorithms require prior metadata information about the number of appliances and their operation modes as well as a training dataset containing appliances’ consumption profiles for a period of time. Considering modes of appliances as class labels, various classification methods such as KNN [19], multi-label classification [20,21], and deep learning [22] have been utilized in this field. These methods have proved to be significantly more accurate than their unsupervised counterparts, particularly in the presence of multi-state appliances [22]. However, their main drawback is the need for an enormous training dataset that is not in general feasible to collect [23]. Therefore, extracting useful information from a small training dataset for the NILM classification problem has become a topic of great interest in the past few years [24].
1.2. Contributions
This paper proposes a novel event-based NILM algorithm that minimizes the ground-truth data required, performs well in analyzing real data measured by existing meters, and remains efficient and accurate even for large numbers of appliances. Major contributions of this work are detailed below.
- (1)
- Event-based algorithms are highly dependent on detection of events. Therefore, the event detection algorithm used for the NILM purpose should be accurate in the sense that it should not miss any actual event or mistake fluctuations of the signal as an event. We propose in Section 3 a novel statistics-based method that filters the signal and does not require any predefined threshold.
- (2)
- For NILM as a classification problem, the number of operation modes of appliances and their respective consumption values are key to assigning labels. In most of the existing literature, these modes are obtained by visually analyzing the appliances’ power signals in the training dataset. We introduce a clustering approach in Section 4.1, using in part the linkage-Ward algorithm, which automatically extracts appliances’ modes and their respective consumption values. Then, in Section 5, a novel classification technique, with competitive accuracy, is established for the NILM problem employing previously extracted features.
- (3)
- Existing classification algorithms consider appliances’ consumption values at each mode as their main characteristics. However, the appliance consumption pattern, its transitions between different modes, their ON duration period, and their probability of occurrence are also key information that can be used to distinguish two appliances with close consumption values. Analyzing the training dataset in Section 4, we extract these features of appliances and utilized them for label refinement.
1.3. Paper Organization
The remainder of this paper is organized as follows. The terminology and problem statement are presented in Section 2. In Section 3, the proposed signal filtering and event detection techniques are described. The feature extraction methods are then detailed in Section 4, followed by the proposed classification method in Section 5. The effectiveness and accuracy of the proposed algorithms are evaluated and compared with other algorithms using the REDD [25] in Section 6. Finally, Section 7 concludes the paper.
2. Terminology and Problem Statement
In this section, we present the terminology and the event-based NILM classification problem considered in this paper.
2.1. Notions and Terminology
In this research, power refers to active power. Operation modes of an appliance refer to a fixed set of modes, including the OFF mode, in which the appliance can operate. Appliances are assumed to have two or more operation modes. The operating mode of an appliance is the mode in which the appliance is operating at a specific point in time. When no ambiguity results, the term mode is used to refer to an operation mode or operating mode. A state of an appliance is defined as its power amount in one of its operation modes. As this amount is assumed to vary at least slightly over time, a state is represented by a fixed closed interval within the set of real numbers. One notices that there exists a state corresponding to each operation mode of an appliance.
The aggregated power signal, or simply the aggregated signal, refers to the sum of power signals of all appliances of a house or specific appliances of interest. The term non-intrusive load monitoring, or NILM, in this work is then defined as extracting the sequence of operating modes of each appliance from the aggregated signal. This NILM problem is sometimes referred to as the NILM classification problem. While deducing individual power signals of appliances from the aggregated signal is also a NILM problem, that one views as a NILM regression problem, it is not considered in this work.
Given the power signal of an appliance, an event is a change in the signal value caused by a mode transition of the appliance. Similarly, an event of the aggregated signal is a change in the signal value caused by a mode transition of any of the appliances contributing to the aggregated signal.
2.2. Event-Based NILM Problem
The event-based NILM (classification) problem can be described as the process of assigning proper labels to events of the aggregated power signal, where the set of labels consists of all appliance mode transitions. It should be noted that a training set in the form of a set or sequence of events and their corresponding labels is in general not immediately available. Instead, it has to be derived from the given individual appliances’ power signals over a period of time. No additional information, such as the number of modes of each appliance or their nominal consumption values, is available. It is assumed throughout the paper that the given signals are measured in discrete time.
3. Signal Filtering and Event Detection
A fundamental part of event-based NILM is detecting events accurately. Event detection should be executed on individual appliances’ power signals in the training set as well as the aggregated signal in the test set. In the vast majority of the literature, an event is detected based on the difference between two consecutive sampled values [6]. More precisely, if the absolute value of this difference is greater than a certain threshold, an event is considered to have occurred between the two sampling times [26]. Existing threshold-based event detection techniques rely heavily on the threshold that is selected manually given the dataset in hand. Thus, they are not expected to perform as well on the meter’s data of a different residential house. Beside this extensibility issue, there appears to exist a fundamental limit on the accuracy of threshold-based event detection techniques, which is caused by fluctuations of voltage in the power grid and noise, spikes, and the various ranges of overshoots in the signal, as shown in Figure 1 [27]. In this section, we propose a novel statistics-based algorithm that overcomes all these challenges and accurately detect events.
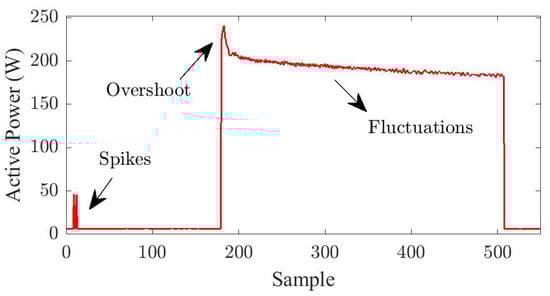
Figure 1.
Typical outliers in power signal.
While the mainstream view of an event is a significant value change in the signal, our view of an event is an uncommon value change. Thus, considering a set formed based on value changes in the signal, we search for “outliers” of the set. As it will be explained later in this section, this set consists of the min/max ratios between consecutive sampled values of the signal, subtracted from 1. Of course, careful considerations should be made with regard to transient spikes and lengthy overshoots during mode transitions, as they would also be outliers of the formed set. Detecting these spikes and overshoots and filtering them will also prove significant for getting more accurate results in the event-based NILM problem.
Our proposed event detection algorithm consists of three main steps: (1) outlier detection, (2) filtered signal construction, and (3) event detection, which will be discussed in the following subsections.
3.1. Outlier Detection
Different fields of research have been dealing with the outlier detection problem given a dataset and different methods have been proposed to address it [28,29]. We herein extend a statistics-based outlier detection method to suit the NILM problem. The algorithm starts with calculating the min/max ratio between any two consecutive sampled values of signal as (1), subtracting them from 1, and saving them in a vector M as (2).
Finally, for any t, if is greater than the calculated standard deviation, it is considered an outlier, and t is saved as the outlier occurrence instance in vector of outlier instances. Algorithm 1 illustrates the procedure of the proposed outlier detection method.
| Algorithm 1: Proposed algorithm for outlier detection. |
 |
3.2. Filtered Signal Construction
Having performed outlier detection, outliers’ instances are obtained, as well as instances that are not outliers, referred to as inlier instances. In this so-called filtering step, the aim is to flatten spikes and overshoots of the signal. To achieve this aim, the signal value at each outlier instance is substituted with the mean of the signal values at the following consecutive inlier instances, as shown in Figure 2. You may note that, unlike for spikes and overshoots, the signal values at actual event times will not experience significant change in the filtering step.
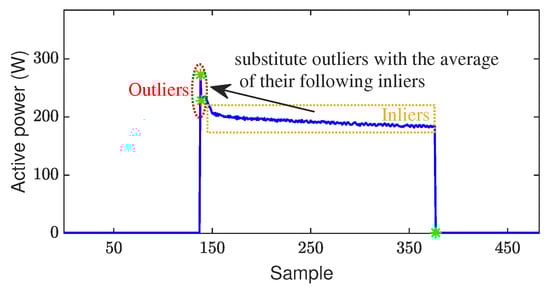
Figure 2.
Construction of the filtered signal.
3.3. Event Detection
In the final step, to detect events, Algorithm 1 is applied to the filtered signal. Now, all detected outlier instances are considered as event instances. We note that transient spikes and overshoots of the original signal have already been flattened in constructing the filtered signal, meaning that they can no longer be mistaken for events.
4. Feature Extraction
The most common specific feature of appliances utilized in NILM algorithms is their consumption values at their operation modes. However, as different appliances may have operation modes with close consumption values, an effective load disaggregation algorithm should use additional appliance features broadly called finger prints in [30]. In this section, we propose different methods to extract operation modes of appliances and additional features from a small training dataset. The framework of this stage is illustrated in Figure 3.
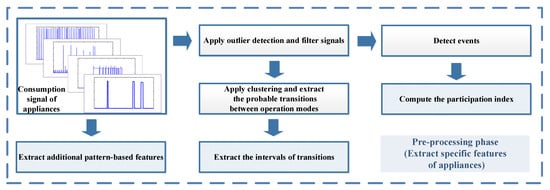
Figure 3.
Different stages of the proposed feature extraction method.
4.1. Modes and States of Appliances
The states of an appliance, defined as the power interval corresponding to its operation modes, are its most useful features widely used for the NILM purpose. Therefore, detecting the number of modes of an appliance and their corresponding states plays a crucial role in the accuracy of NILM. As opposed to most of the existing literature that extracts an appliance’s modes/states visually using its consumption values in the training set or by using the datasheet of the appliance, we propose a novel clustering-based approach for appliance modes/states extraction from its power signal in a systematic fashion.
Our approach is based on the linkage-Ward (LW) clustering algorithm [31]. The objective function of the LW algorithm is the squared sum of distances between data points and the their cluster centroids. The LW clustering algorithm first treats each data point as a cluster of its own, which means that the initial value of the objective function is 0. Then, clusters are merged together, one pair at every stage, based on the following merging policy: clusters A and B are merged if is a minimum among all pairs of clusters,
where , , and are centroids of clusters A, B, and , respectively, and and are the size of clusters A and B, respectively. One notices that , which is non-negative, is in essence the cost of merging clusters A and B. Thus, the value of the objective function at any given stage is the total cost of all the merging up to that stage. Analyzing the increasing objective function, the elbow method [14] is often used to determine the optimal number of clusters, that is, to determine when to stop merging. Roughly speaking, according to the elbow method, merging stops when it becomes too costly compared to the merging at the previous stage.
It can be seen from the definition of in (4) that the combination of the LW algorithm and the elbow method is susceptible to unbalanced data. More precisely, when the LW algorithm is close to reaching the optimal number of clusters, the elbow method discourages stopping where two or more small clusters exist since merging them is now not relatively “too costly” even though their centroids may be far apart. For the mode/state extraction purpose, this could be a significant issue, as infrequently occurring modes of an appliance may be lumped into one mode with a wide-ranging power, which would undermine any attempt of NILM. Therefore, one should take advantage of the LW algorithm in such a way to suit the NILM purpose by discouraging merging of clusters that are far apart. Thus, the following algorithm is suggested for mode extraction.
After filtering the power signal of each appliance in the training dataset, the LW algorithm is applied to the signal’s data considering K clusters, where . The cluster centroids are then computed and sorted in descending order. From this stage forward, a different merging policy, entitled as distance-based policy, is adopted that only depends on the distance between cluster centroids. It starts by considering the cluster with the highest centroid as the root cluster. If its centroid’s distance to the next highest centroid is less than 15% of the root cluster’s centroid, the two clusters merge and the step is repeated considering the merged cluster as the new root cluster. Otherwise, the cluster with the next highest centroid to the root cluster’s centroid is considered as the new root cluster and the step is repeated. The algorithm terminates when no further merging can take place. The flowchart of the proposed mode extraction method is illustrated in Figure 4, where centroids of the root cluster and the cluster with the next highest centroid are denoted as and , respectively.
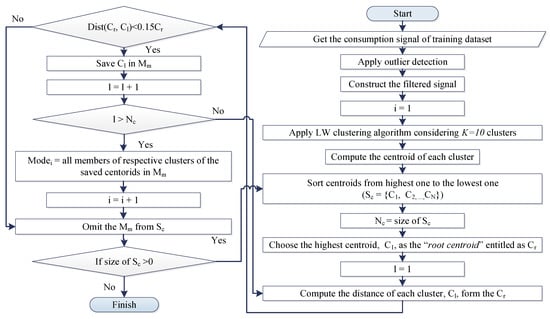
Figure 4.
Flowchart for the proposed mode extraction algorithm.
4.2. Transition Intervals of Appliances
Consider an arbitrary mode transition of an appliance from a (relatively) high state to a (relatively) low state . Then, the interval of this transition is defined as
where and show the lowest and highest value of the specific transition of T, respectively.
4.3. Transition Participation Indices
Two appliances with some overlapping transition intervals can be difficult to separate in the aggregated signal. The participation index of their transitions defined as (6), obtained from each appliance’s usage pattern in the training set, may help separate these appliances. Given a transition T of an appliance, its participation index is defined as
where is the total number of days of training dataset in which the transition T happened. In other words, this parameter measures the daily average of contribution of a specific transition of an appliance in events of the total signal.
4.4. Additional Features of Appliances
Analyzing the power signals of appliances in the training dataset, one observes that some of the appliances exhibit very specific behavioral patterns. Some of these features, which can further help improve the accuracy of load disaggregation, are listed below.
- As shown in Figure 5, the dishwasher exhibits the same pattern when it is ON. As this pattern is complex, using it may reduce efficiency of NILM. However, one notices that in any given day, the dishwasher operates in either all or non of its modes. This simple characteristic will prove significant for NILM.
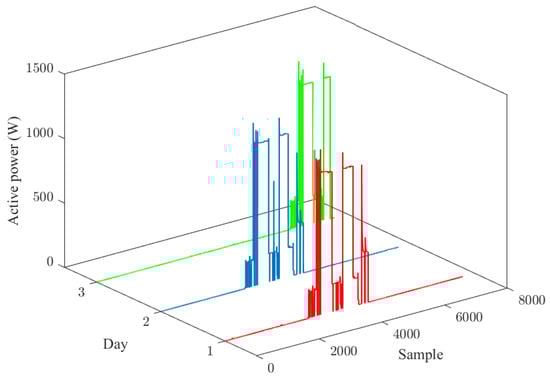 Figure 5. Daily usage pattern of the dishwasher.
 - One observes that not all possible mode transitions of multi-mode appliances can ever occur.
- Some appliances appear to have unique mode transition overshoots in their signals.
- The time period between two consecutive ON samples (with OFF samples in between) of different appliances are significantly different.
5. Classification
In this section, a novel classification algorithm is proposed to address the NILM problem, that is, to determine each event in the aggregated power signal corresponds to which appliance mode transition. Different steps of the proposed classification method is displayed in Figure 6.
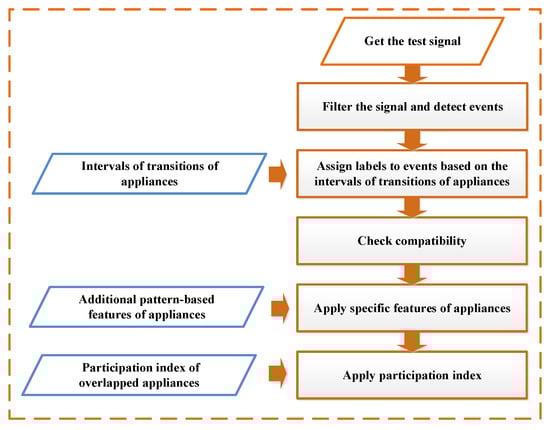
Figure 6.
The procedure of the proposed classification method.
Based on this method, to label a given event, the classifier first obtains all transition intervals containing the value of that event. As a simple example, consider two ON/OFF appliances 1 and 2, whose ON modes correspond to states and , respectively. Given an event with value 980 in the aggregated test signal, the classifier first associates this event with OFF-to-ON transition of appliance 1 as well as that of appliance 2. Afterward, taking other specific features of each appliance into considering along with the test signal’s behavior near the event, a single label is assigned to the event.
Defining and as the total number of events in the test signal and the number of all possible appliance mode transitions, respectively, let be an binary-valued matrix, with columns corresponding to events and rows corresponding to mode transitions, which represents predicted labels for events of the test signal. Obviously, an element 1 of indicates that its row’s corresponding transition is the predicted label of its column’s event. The proposed classification algorithm is detailed in 4 steps below.
- Step 1: Given an event of the test signal and a mode transition of an appliance, if the event value is within the transition interval, the respective element of is labeled 1. Otherwise, it is labeled 0. It should be clear that as transition intervals may overlap, some events may be assigned multiple labels in this step. We also point out that some events may remain unlabeled, which means that matrix may have some all-zero columns. Each of these unlabeled events is then labeled with the transition whose interval is closest to the event value. We note that the distance between a value and an interval is calculated as the minimum distance between the value and any point within the interval.Step 2: Analyzing the daily aggregated signal, it can be observed that in the majority of time samples, appliances are in their OFF modes. With that in mind, one should focus on parts of the aggregated signal where at least one appliance is ON. In particular, given the aggregated signal, one obtains its cycles, where each cycle starts with an event succeeding an all-OFF sample and ends with the nearest event preceding an all-OFF sample. Figure 7 illustrates how cycles of an aggregated signal are derived. Over each cycle, the labels assigned to the events should be compatible.
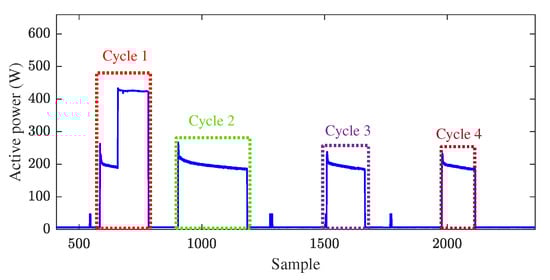 Figure 7. Daily usage pattern of the refrigerator vs. its cycles.
To clarify what is meant by labels’ compatibility over a cycle, one thinks of an undirected graph in which nodes represent all mode vectors , where each element of is a mode of appliance a. Two nodes are then connected by an edge if their corresponding vectors differ in exactly one element. It should be clear that an edge represents a single appliance mode transition, while noting that two different edges may correspond to the same transition. Now, a sequence of labels over a cycle are said to be compatible if starting from the all-OFF node of the graph, one can walk according to the labels in the sequence and terminate at the all-OFF node. In other words, labels/transitions over a cycle are compatible if they form a cycle in the graph constructed above.
Using the compatibility condition described, the multiple labels assigned to some events can be narrowed down as some labels are deemed inadmissible. More precisely, a label within a cycle is removed if it is not part of any compatible sequence of labels over the cycle. As an example, consider 3 type I (ON-OFF) appliances with the transition intervals shown in Table 1.

Table 1.
Transition intervals of appliances.
Figure 8 shows a specific cycle of this dataset. Based on the event matching classification in Step 1, the first event is assigned two labels: one a mode transition of appliance A and one a mode transition of appliance C, while other events are assigned single labels. Figure 9 displays the predicted graph based on assigning different labels to the first event. As it is shown, the mode transition of appliance C is ruled out as a label of the first event since it is not part of any compatible sequence of labels from Step 1 over the cycle. In other words, appliance C cannot possibly be ON when the first event occurs.
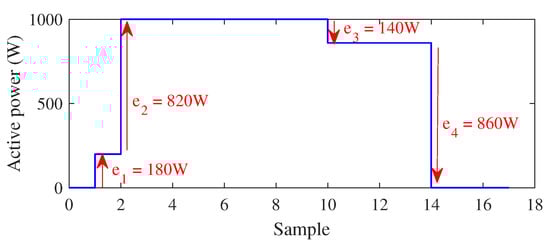
Figure 8.
Specific cycle of total power signal vs. its events.
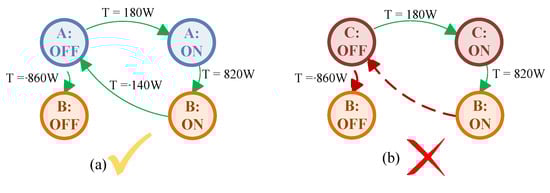
Figure 9.
Predicted graph paths based on different label assignment, (a) Correct predicted paths, (b) Incorrect predicted paths.
In this case, to detect the incompatible predicted labels, a label matrix is computed as Figure 10. In the matrix, the first row and column show the value of transitions and appliances, respectively. If a positive transition belongs to an appliance, label = 1 is assigned to the corresponding element of the matrix and for a negative transition, label = −1 is assigned. As each transition is caused by an appliance, the sum of each column should be 1 or −1. On the other hand, If an appliance is turned ON in a cycle, it should be turned OFF in the same cycle. In this regard, the sum of each row should equal zero. Otherwise, incompatible labels are assigned to transitions. As an example, in Figure 10 first column and third row, show that appliance C should not be assigned to the first event. For multi-mode appliances, the sum of rows is obtained based on probable transitions between different operation modes.
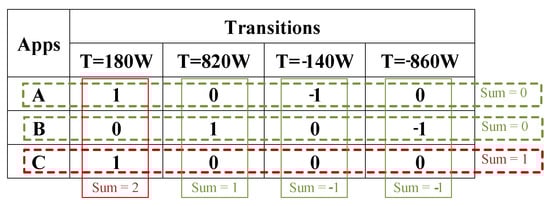
Figure 10.
Matrix of predicted labels.
- Step 3: After Step 2’s cycle-based label refinement, each event may still be assigned multiple labels. Considering extracted specific features of some appliances as described in Section 4.4, some labels are removed from the multi-labeled events.Step 4: Finally, based on participation indices of appliance transitions explained in Section 4.3, the most probable label is chosen for the multi-labeled events.
6. Simulation Study
In this section, the accuracy and effectiveness of our algorithms proposed in Section 3, Section 4 and Section 5 for the NILM purpose are evaluated by applying them to two low-frequency datasets, the gathering of which is practical as it can be done using existing smart meters [14,32]. To measure the accuracy of the proposed classification, following evaluation metrics are used [33],
where and show the precision and recall, respectively; is true positive; is false positive; is true negative; and is false negative. It should be noted that for evaluation purposes, in line with the NILM literature, appliances with more than two operation modes are treated as ON/OFF appliances. In other words, all non-OFF modes of an appliance are lumped into an ON mode.
6.1. Evaluation on Residential Energy Disaggregation Dataset (REDD)
The dataset considered consists of 28 days of power data for seven appliances of house 1 in the REDD [25]. These appliances are listed as oven (OV), microwave (MW), kitchen outlets (KO), bathroom GFI (BGFI), washer/drier (W/D) with a high consumption state, refrigerator (RFG), and dishwasher (DW). The first five listed appliance only have ON and OFF modes, while the last two have more than two operation modes. Figure 11 shows the power signals of all seven appliances in one day of the dataset and the total consumption of all individual appliances’ consumption. Three weeks of data from this dataset is considered as the training dataset, and the rest is considered as the test dataset.
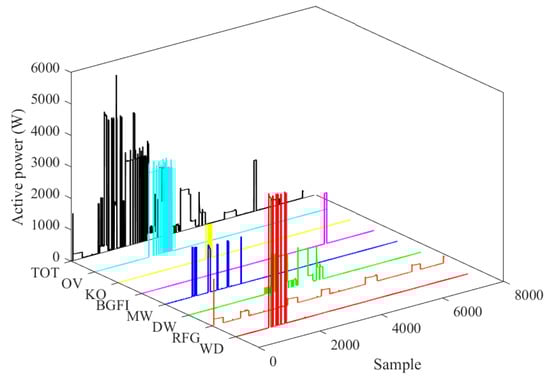
Figure 11.
Total consumption vs. the consumption of each appliance in REDD.
In the following subsections, first the proposed filtering end event detection method are applied to training and test dataset. Then, based on the filtered signal of each appliance, their specific features are extracted. Finally, considering these features the proposed classification technique is utilized to disaggregate the test signal.
6.1.1. Signal Filtering and Event Detection
The filtering and event detection method of Section 3 is applied to individual appliances’ power signals in the training dataset as well as the aggregated signal in the test dataset. As an example, Figure 12 illustrates the outliers of the signal, the overshoots and spikes in the signal, and the constructed filtered signal of the dishwasher for a period of time, respectively.
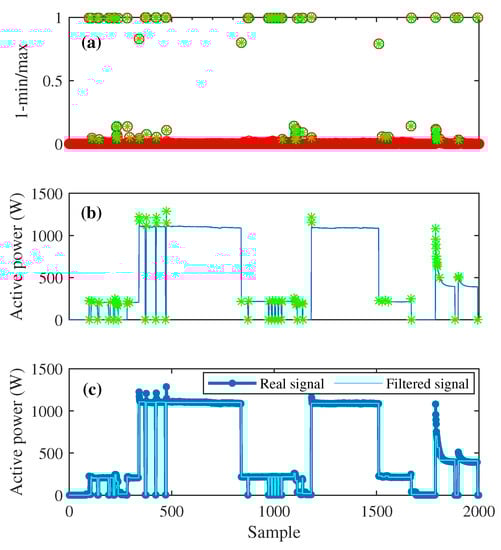
Figure 12.
Filtering the dishwasher’s signal: (a) inliers (red circles) vs. outliers in 1-min/max ratios of consecutive samples (green stars), (b) real signal (blue line) vs detected outliers in the power signal (green stars), and (c) the orignal signal vs. the filtered signal.
6.1.2. Feature Extraction
Having individual appliances’ signals filtered, their features are extracted via methods of Section 4 as discussed below.
- States of Each Appliance: Applying the LW-based clustering method of Section 4.1 to the filtered signal of each appliance, its modes and their corresponding states are obtained. One recalls that the merging policy is that of the LW algorithm until 10 clusters are obtained, then changes to that of distance-based policy. As an example, Table 2 shows the 10 obtained clusters for modes/states of the dishwasher before the merging policy changes from the LW method, and Table 3 shows the final obtained states of all appliances.
Table 2. Minimum, maximum, and centroid of the 10 LW-obtained clusters for dishwasher’s modes/states.
Table 3. States corresponding to non-OFF modes of appliances in REDD.
- Transition Intervals of Appliances: Intervals of probable mode transitions of all appliances are now derived using (5). When a mode transition is from or to the OFF mode of an appliance, it simply coincides with the state corresponding to the other appliance mode involved in that transition. Considering probable transitions of multi-mode appliances, non-trivial transition intervals and should be considered for DW and RFG, respectively.
- Transition Participation Index: One recalls that transition participation index is only used to separate appliance transition with overlapping intervals. Table 4 shows participation index for different groups of the overlapped appliances.
Table 4. Transition participation index.
6.1.3. Classification
To apply the proposed classification method, events of the filtered test signal are detected. Then, the classification-based algorithm is applied to detected events based on the transition intervals of appliances. Table 5 illustrates the evaluation metrics after the first step of the proposed classification method (event-matching step). As OV and W/D do not have overlapping consumption values, they are detected accurately. However, as it is shown in Figure 13, as BGFI and MW have overlapping consumption values, there exist some events of MW which are incorrectly assigned to BGFI decreasing its . Finally, after cycle-based label refinement, to refine the remained multiple labeled events and choose the most probable label for each event, the following specific features of appliances are considered.
Table 5.
Evaluation metrics after event-matching classification.
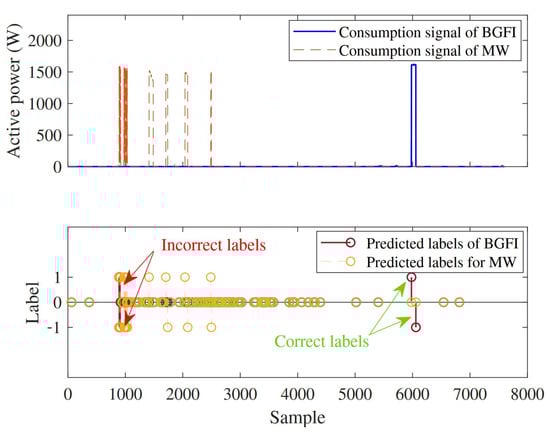
Figure 13.
Misclassification of bathroom GFI (BGFI) events.
- (1)
- Based on the power signal of the dishwasher, one observes that during every ON cycle, all its modes occur. Thus, if the transition with interval [643–737] of the dishwasher, which happens to not overlap with any other transition interval, is not detected, the dishwasher can be assumed OFF during that whole day. Consequently, all candidate labels/transitions involving a non-OFF mode of the dishwasher in that day can be ruled out.
- (2)
- Three modes for the refrigerator have been detected, namely, the OFF mode, the lower ON mode, and the higher ON mode. It is observed in the training dataset that the transition from the OFF mode to the higher ON mode never happens. Thus, all candidate labels of such can be removed.
- (3)
- Overshoot values appearing in the refrigerator’s signal are higher than 500 W as opposed to those of the dishwasher. This can be used to separate transitions of the refrigerator and dishwasher with overlapping intervals.
Applying aforementioned features, for each remaining event with multiple labels, the participation index is calculated for overlapped appliances separately. The appliance which has close to the calculated participation index of appliances in training dataset, is assigned to events.
Table 6 shows the high accuracy of our classification method for each appliance in comparison with the results of [24,34]. Keeping in mind that a higher number of appliances should diminishes the accuracy of NILM, note that the number of appliances considered in this work and in [24] are seven and six, respectively. On the other hand, considering multi-mode appliances such as dishwasher increases the complexity of disaggregation. However, the accuracy of our proposed method in which we have considered dishwasher is higher than [34] which did not considered dishwasher in appliances’ set.
Table 6.
for different methods.
6.2. Evaluation on Almanac of Minutely Power Dataset (AMPds)
In this case study, we have considered six appliances from AMPds: fridge (FGE), Basement plugs (BME), clothes dryer (CDE), dishwasher (DWE), heat pump (HPE), and whole oven (WOE) [32]. Five-hundred-and-fifty days of data are considered as the training dataset and 180 days of data as the test dataset. Figure 14 illustrates the consumption pattern of these appliances in a day of this dataset, along with the aggregated consumption which is the sum of the individual appliances’ consumption.
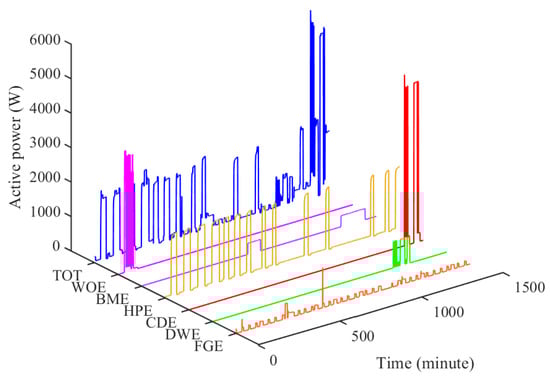
Figure 14.
Total consumption vs. the consumption of each appliance in AMPds.
6.2.1. Signal Filtering and Event Detection
In the first stage of the proposed classification method, outlier detection and event detection methods are applied to the power signal of each appliance in the training dataset as well as the aggregated test signal. Figure 15 displays a day of the test signal versus its filtered signal.
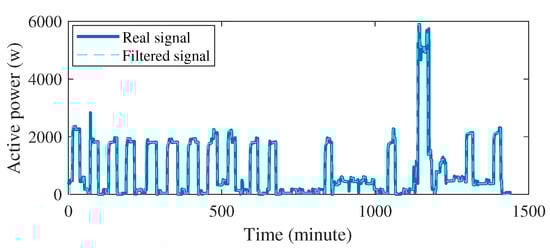
Figure 15.
Filtered total power signal of AMPds vs. its real signal.
6.2.2. Feature Extraction
The proposed state extraction method in Section 4.1 is applied to the filtered signal of each appliance in the training dataset. Then, the intervals of the plausible transitions of appliances is computed based on (5), as reported in Table 7. Finally, participation indices are obtained via (6) for three overlapping transition groups, as provided in Table 8.
Table 7.
Intervals of transitions of appliances in AMPds.
Table 8.
Transition participation index of overlapping appliances in AMPds.
6.3. Classification
The first step of proposed classification method (event matching step) is applied to the events of the filtered test signal. As shown in Table 9, in this step, appliances which do not have overlapping consumption values with others, such as HP, are disaggregated more accurately. However, appliances such as BM which have overlapping intervals of transitions have low . After conducting cycle-based label refinement, the following pattern-based features are applied to multi-labeled events to role out the misclassified ones.
Table 9.
Evaluation metrics after event-matching classification.
- As shown in Figure 16, WO and DW have specific operation patterns, in which they operate in either all or non of their operation modes.
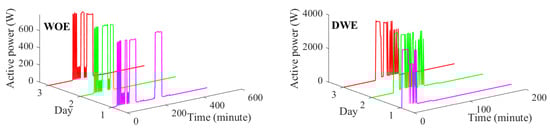 Figure 16. Daily usage pattern of the DW and WO.
 - FG shows specific overshoots which makes it distinguishable from BM and WO.
- The ON durations of CD and FG differs considerably which make them distinguishable from each other.
In the last step, of appliances with overlapping consumption values are considered to assign the most probable label to the remaining multi-label transitions. Table 10 displays the of the proposed classification method in comparison with [35]. It should be noted that in this paper, 14 operation modes which consist of multiple overlapping ones are considered. However, the authors of [35] considered a total of nine operation modes that do not have overlapping consumption values. This shows the effectiveness of our proposed method in the disaggregating a high number of multi-mode appliances with overlapping consumption values.
Table 10.
for AMPds dataset based on different methods.
7. Concluding Remarks and Future Work
In this paper, we have proposed a novel classification method to address the NILM problem given a small dataset. The proposed algorithm has three main phases: (1) filtering training and test signals and accurately detecting their events using a statistics-based method,; (2) extracting features of appliances, most notably their modes and states via a clustering approach that in part uses the LW clustering method; and (3) proposing a classification algorithm labeling events of the aggregated test signal with mode transitions of appliances, where various features and techniques are utilized to enhance its accuracy. The proposed event detection and modes/states extraction methods have been done in a systematic fashion in such a way to perform well for any sets of power data. The proposed filtering method, feature extraction techniques, and event-based NILM classification algorithm have been validated using the REDD. Juxtaposing the results of our classification algorithm with two recently introduced event-based NILM methods indicate a relatively high accuracy of our algorithm.
Reconstructing the power signals of appliances, which can be cast as a regression problem as opposed to the classification problem we considered in this work, is one of the main challenges of event-based NILM problems. We aim to modify our presented algorithm in Section 5, to address the reconstruction problem. Moreover, due to the lack of a training dataset for each residential building, we wish to move a step further to use transfer learning to bypass the training phase of the proposed method, with the practical assumption that nominal values for appliances’ power are given.
Author Contributions
Conceptualization, E.A., M.T.H.B., and S.B.; methodology, E.A., M.T.H.B., and S.B.; software, E.A.; validation, E.A., M.T.H.B., and S.B.; formal analysis, E.A., M.T.H.B., and S.B.; investigation, E.A.; resources, E.A.; data curation, E.A.; writing—original draft preparation, E.A.; writing—review and editing, M.T.H.B. and S.B.; visualization, E.A.; supervision, M.T.H.B. and S.B.; project administration, M.T.H.B. and S.B.; funding acquisition, M.T.H.B. and S.B. All authors have read and agreed to the published version of the manuscript.
Funding
This research received no external funding.
Informed Consent Statement
Not applicable.
Data Availability Statement
This data set can be found here: [http://redd.csail.mit.edu/]. [dataset] Kolter, J. Zico, and Matthew J. Johnson. “REDD: A public data set for energy disaggregation research.” Workshop on data mining applications in sustainability (SIGKDD), San Diego, CA. Vol. 25. No. Citeseer. 2011.
Conflicts of Interest
The authors declare no conflict of interest.
References
- Nizami, M.S.H.; Hossain, M.J.; Fernandez, E. Multiagent-Based Transactive Energy Management Systems for Residential Buildings With Distributed Energy Resources. IEEE Trans. Ind. Inform. 2020, 16, 1836–1847. [Google Scholar] [CrossRef]
- Moradzadeh, A.; Sadeghian, O.; Pourhossein, K.; Mohammadi-Ivatloo, B.; Anvari-Moghaddam, A. Improving Residential Load Disaggregation for Sustainable Development of Energy via Principal Component Analysis. Sustainability 2020, 12, 3158. [Google Scholar] [CrossRef]
- Lu, M.; Li, Z. A Hybrid Event Detection Approach for Non-Intrusive Load Monitoring. IEEE Trans. Smart Grid 2019, 11, 528–540. [Google Scholar] [CrossRef]
- Liu, H.; Yu, C.; Wu, H.; Chen, C.; Wang, Z. An improved non-intrusive load disaggregation algorithm and its application. Sustain. Cities Soc. 2020, 53, 101918. [Google Scholar] [CrossRef]
- Ji, T.; Liu, L.; Wang, T.; Lin, W.; Li, M.; Wu, Q. Non-Intrusive Load Monitoring Using Additive Factorial Approximate Maximum a Posteriori Based on Iterative Fuzzy c-Means. IEEE Trans. Smart Grid 2019, 10, 6667–6677. [Google Scholar] [CrossRef]
- Gopinath, R.; Kumar, M.; Joshua, C.P.C.; Srinivas, K. Energy management using non-intrusive load monitoring techniques-State-of-the-art and future research directions. Sustain. Cities Soc. 2020, 62, 102411. [Google Scholar] [CrossRef]
- Hart, G.W. Nonintrusive appliance load monitoring. Proc. IEEE 1992, 80, 1870–1891. [Google Scholar] [CrossRef]
- Rathore, V.; Jain, S.K. Non Intrusive Load Monitoring and Load Disaggregation using Transient Data Analysis. In Proceedings of the 2018 Conference on Information and Communication Technology (CICT), Jabalpur, India, 26–28 October 2018; pp. 1–5. [Google Scholar]
- Zhao, B.; He, K.; Stankovic, L.; Stankovic, V. Improving event-based non-intrusive load monitoring using graph signal processing. IEEE Access 2018, 6, 53944–53959. [Google Scholar] [CrossRef]
- Liu, Q.; Kamoto, K.M.; Liu, X.; Sun, M.; Linge, N. Low-complexity non-intrusive load monitoring using unsupervised learning and generalized appliance models. IEEE Trans. Consum. Electron. 2019, 65, 28–37. [Google Scholar] [CrossRef]
- Singh, S.; Majumdar, A. Deep sparse coding for non–intrusive load monitoring. IEEE Trans. Smart Grid 2017, 9, 4669–4678. [Google Scholar] [CrossRef]
- Bonfigli, R.; Principi, E.; Fagiani, M.; Severini, M.; Squartini, S.; Piazza, F. Non-intrusive load monitoring by using active and reactive power in additive Factorial Hidden Markov Models. Appl. Energy 2017, 208, 1590–1607. [Google Scholar] [CrossRef]
- He, K.; Jakovetic, D.; Zhao, B.; Stankovic, V.; Stankovic, L.; Cheng, S. A generic optimisation-based approach for improving non-intrusive load monitoring. IEEE Trans. Smart Grid 2019, 10, 6472–6480. [Google Scholar] [CrossRef]
- Azizi, E.; Shotorbani, A.M.; Hamidi-Beheshti, M.T.; Mohammadi-Ivatloo, B.; Bolouki, S. Residential Household Non-Intrusive Load Monitoring via Smart Event-based Optimization. IEEE Trans. Consum. Electron. 2020, 66, 233–241. [Google Scholar] [CrossRef]
- Zhao, B.; Ye, M.; Stankovic, L.; Stankovic, V. Non-intrusive load disaggregation solutions for very low-rate smart meter data. Appl. Energy 2020, 268, 114949. [Google Scholar] [CrossRef]
- Henao, N.; Agbossou, K.; Kelouwani, S.; Dubé, Y.; Fournier, M. Approach in nonintrusive type I load monitoring using subtractive clustering. IEEE Trans. Smart Grid 2015, 8, 812–821. [Google Scholar] [CrossRef]
- Kong, W.; Dong, Z.Y.; Ma, J.; Hill, D.J.; Zhao, J.; Luo, F. An extensible approach for non-intrusive load disaggregation with smart meter data. IEEE Trans. Smart Grid 2016, 9, 3362–3372. [Google Scholar] [CrossRef]
- Dinesh, C.; Makonin, S.; Bajić, I.V. Residential Power Forecasting Using Load Identification and Graph Spectral Clustering. IEEE Trans. Circuits Syst. II Express Briefs 2019, 66, 1900–1904. [Google Scholar] [CrossRef]
- Schirmer, P.A.; Mporas, I. Statistical and electrical features evaluation for electrical appliances energy disaggregation. Sustainability 2019, 11, 3222. [Google Scholar] [CrossRef]
- Tabatabaei, S.M.; Dick, S.; Xu, W. Toward non-intrusive load monitoring via multi-label classification. IEEE Trans. Smart Grid 2017, 8, 26–40. [Google Scholar] [CrossRef]
- Massidda, L.; Marrocu, M.; Manca, S. Non-Intrusive Load Disaggregation by Convolutional Neural Network and Multilabel Classification. Appl. Sci. 2020, 10, 1454. [Google Scholar] [CrossRef]
- Singhal, V.; Maggu, J.; Majumdar, A. Simultaneous Detection of Multiple Appliances from Smart-meter Measurements via Multi-Label Consistent Deep Dictionary Learning and Deep Transform Learning. IEEE Trans. Smart Grid 2018. [Google Scholar] [CrossRef]
- Yang, C.C.; Soh, C.S.; Yap, V.V. A systematic approach in load disaggregation utilizing a multi-stage classification algorithm for consumer electrical appliances classification. Front. Energy 2019, 13, 386–398. [Google Scholar] [CrossRef]
- Dash, S.; Sodhi, R.; Sodhi, B. An Appliance Load Disaggregation Scheme Using Automatic State Detection Enabled Enhanced Integer-Programming. IEEE Trans. Ind. Inform. 2020, 17, 1176–1185. [Google Scholar] [CrossRef]
- Kolter, J.Z.; Johnson, M.J. REDD: A public data set for energy disaggregation research. In Workshop on Data Mining Applications in Sustainability (SIGKDD); Citeseer: San Diego, CA, USA, 2011; Volume 25, pp. 59–62. [Google Scholar]
- Faustine, A.; Mvungi, N.H.; Kaijage, S.; Michael, K. A survey on non-intrusive load monitoring methodies and techniques for energy disaggregation problem. arXiv 2017, arXiv:1703.00785. [Google Scholar]
- Lu, T.; Xu, Z.; Huang, B. An event-based nonintrusive load monitoring approach: Using the simplified viterbi algorithm. IEEE Pervasive Comput. 2017, 16, 54–61. [Google Scholar] [CrossRef]
- Kandanaarachchi, S.; Muñoz, M.A.; Hyndman, R.J.; Smith-Miles, K. On normalization and algorithm selection for unsupervised outlier detection. Data Min. Knowl. Discov. 2020, 34, 309–354. [Google Scholar] [CrossRef]
- Chakhchoukh, Y.; Liu, S.; Sugiyama, M.; Ishii, H. Statistical outlier detection for diagnosis of cyber attacks in power state estimation. In Proceedings of the 2016 IEEE Power and Energy Society General Meeting (PESGM), Boston, MA, USA, 17–21 July 2016; pp. 1–5. [Google Scholar]
- Ma, M.; Lin, W.; Zhang, J.; Wang, P.; Zhou, Y.; Liang, X. Toward energy-awareness smart building: Discover the fingerprint of your electrical appliances. IEEE Trans. Ind. Inform. 2017, 14, 1458–1468. [Google Scholar] [CrossRef]
- Alpaydin, E. Introduction to Machine Learning; MIT Press: Cambridge, MA, USA, 2020. [Google Scholar]
- Makonin, S.; Popowich, F.; Bartram, L.; Gill, B.; Bajić, I.V. AMPds: A public dataset for load disaggregation and eco-feedback research. In Proceedings of the 2013 IEEE Electrical Power & Energy Conference, Halifax, NS, Canada, 21–23 August 2013; pp. 1–6. [Google Scholar]
- Pereira, L.; Nunes, N. An empirical exploration of performance metrics for event detection algorithms in Non-Intrusive Load Monitoring. Sustain. Cities Soc. 2020, 62, 102399. [Google Scholar] [CrossRef]
- Li, D.; Dick, S. Residential household non-intrusive load monitoring via graph-based multi-label semi-supervised learning. IEEE Trans. Smart Grid 2018, 10, 4615–4627. [Google Scholar] [CrossRef]
- Machlev, R.; Levron, Y.; Beck, Y. Modified cross-entropy method for classification of events in nilm systems. IEEE Trans. Smart Grid 2018, 10, 4962–4973. [Google Scholar] [CrossRef]


Publisher’s Note: MDPI stays neutral with regard to jurisdictional claims in published maps and institutional affiliations. |
© 2021 by the authors. Licensee MDPI, Basel, Switzerland. This article is an open access article distributed under the terms and conditions of the Creative Commons Attribution (CC BY) license (http://creativecommons.org/licenses/by/4.0/).