Article

Analysis of Non-Structural Carbohydrate in Relation with Shoot Elongation of Rice under Complete Submergence

by
Arinal Haq Izzawati Nurrahma
1,
Shin Yabuta
2,
Ahmad Junaedi
3 and
Jun-Ichi Sakagami
1,2,*
1
The United Graduate School in Agriculture Sciences, Kagoshima University, Kagoshima 890-0065, Japan
2
Faculty of Agriculture, Kagoshima University, Kagoshima 890-0065, Japan
3
Faculty of Agriculture, Bogor Agricultural University, Bogor 16680, Indonesia
*
Author to whom correspondence should be addressed.
Sustainability 2021, 13(2), 670; https://doi.org/10.3390/su13020670
Submission received: 2 December 2020 / Revised: 28 December 2020 / Accepted: 11 January 2021 / Published: 12 January 2021
(This article belongs to the Special Issue Sustainable Tropical Crop Science and Agriculture Management)

Abstract

:
Regulation of non-structural carbohydrates (NSCs) are important for plants in response to submergence. In this study, the difference in non-structural carbohydrates in relation with shoot elongation between Sub1A and non-Sub1A rice genotypes was investigated. Two rice genotypes, namely Inpari30 (Sub1A genotype) and IR72442 (non-Sub1A genotype), were submerged completely for 6 days and re-aerated by lowering water level up to stem base for 6 days of post submergence. In addition, non-submerged plants (control) was treated with water level up to stem base during the experiment. Photosynthesis rate decreased in both submerged Inpari30 and IR72442 genotypes 71% and 96% lower than their control, respectively. Submerged IR72442 declined Fv/Fm 15.6% lowest than its control and both control and submerged Inpari30. Investigation of the distribution of starch and soluble sugar content in plant organs suggested that shoot elongation of non-Sub1A genotype led to starch and sugar consumption that distributed faster to the new developed organ during submergence. In contrast, Sub1A genotype of Inpari30, which did not exhibit shoot elongation and showed slower NSCs distribution during submergence, performed better on post submergence by maintaining NSCs and distributing to the new developed organ faster than IR72442. These results suggest that Sub1A genotype managed elongation and NSCs during submergence more efficiently than non-Sub1A genotype.

1. Introduction

Non-structural carbohydrates (NSCs) are photosynthetic products that provide growth and metabolism substrates, which can be stored in a plant. During vegetative growth, the plant increases geometrically as plants invest more of the assimilated carbohydrate into new leaves [1]. However, plants also respond to environmental changes by regulating the translocation and partitioning of assimilated carbon, which will determine photosynthetic capacity [2]. When plants are completely submerged in water, O2 diffusion is restricted, photosynthesis decreases due to reduced light intensity, lowering the internal O2 content, and anaerobic respiration increases at the expense of the aerobic process [3]. Consequently, the carbohydrate levels and energy status in the shoot will drop to levels harmful to the plant [4,5].
Previously, we observed that photosynthetic rates decreased during submergence in rice cultivars tolerant and intolerant to submergence stress [6]. However, some rice plant elongates during submergence, which requires initial energy. High initial carbohydrate levels in the stem are essential to provide energy for rapid elongation [7] required for plant survival during submergence [3]. Later, it was demonstrated that survival under submergence is dependent on the ability to store non-structural carbohydrates (NSCs) and conserve energy through reduced underwater elongation [8]. Compared with sensitive parent lines, Sub1 introgression lines reduced less sugar and starch concentration after submergence [9,10]. Thus, tolerance genotype is not necessarily associated with the carbohydrate status before submergence, but rather with the ability to sustain energy levels throughout submergence [3]. The cultivars that maintain high NSC after submergence develop new leaves faster and accumulate greater biomass during recovery [9].
Sub1A, a major quantitative trait locus (QTL) responsible for submergence tolerance, has been widely studied in FR13A rice (Oryza sativa L.) and is considered to confer submergence tolerance in rice breeding [11,12,13]. It has been introgressed into the high-yielding rice variety Inpari30 that did not result in any significant trait differences compared to the parental variety (Ciherang) under normal conditions [14,15,16]. Other studies reported the effect of submergence on shoot elongation in 15 genotypes of Oryza sativa under 80 cm water depth for 7 days. Among the 15 cultivars, the non-Sub1A rice type, IR72442, exhibited the highest ratio of plant length on submersion compared to the control plant, indicating that this cultivar exploits the elongation mechanism on submergence [17]. Both Inpari30 and IR72442 are used in this experiment to demonstrate starch and sugar accumulation during submergence by representing Sub1A and non-Sub1A rice genotype, respectively.
Non-structural carbohydrates (NSCs) in rice subjected to submergence have been investigated in association with growth parameters [7], elongation ability [8], different ages of rice seedlings [18], impeded metabolism [19], catabolism processes [13,20], and application time of nitrogen and phosphorus fertilizers [10]. However, the most critical period for the plant to consume starch and soluble sugar, the distribution of starch and soluble sugar throughout the plant, and their relation to elongation on submergence has not been clearly described between Sub1A and non-Sub1A genotype. In this study, we analyze the starch and soluble sugar behavior during submergence using Inpari30, which is characterized by the Sub1A gene, and IR72442, which is characterized by non-Sub1A gene. This study could help develop an effective agronomical approach that can improve plant tolerance to submergence in relation with the efficient use of non-structural carbohydrates.

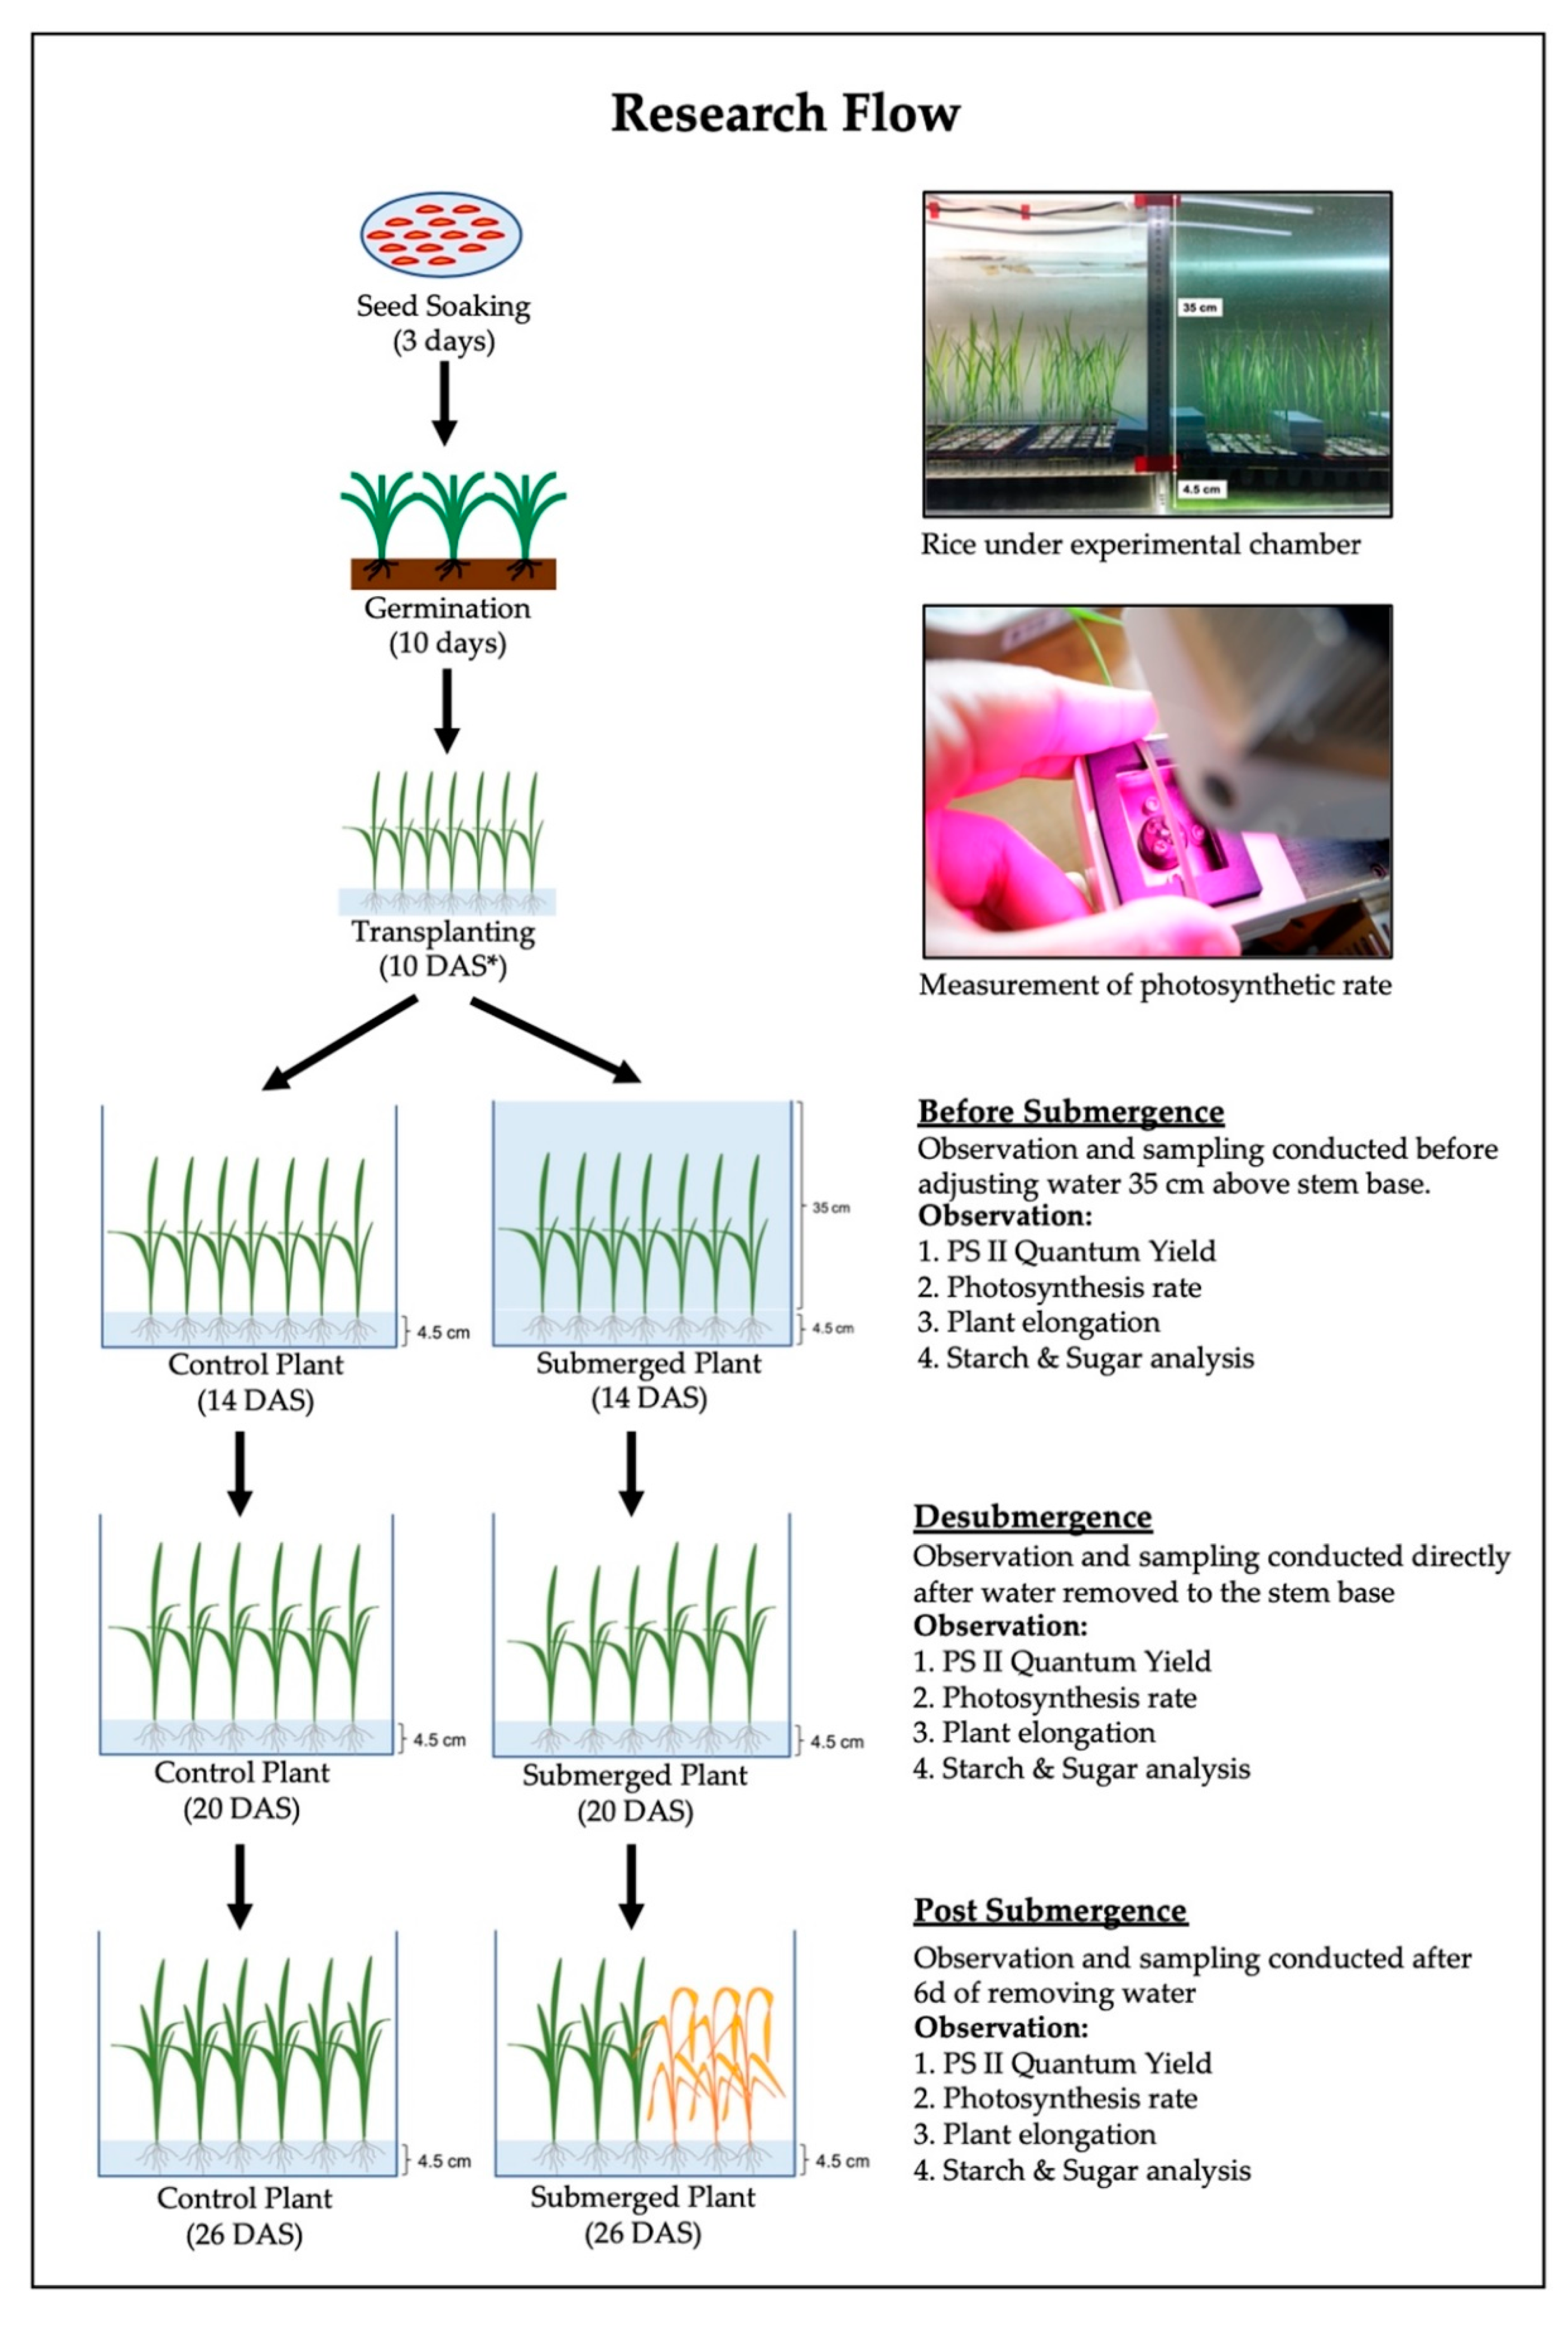
2. Materials and Methods

The research was conducted from August to November 2019 at the Tropical Crop Science Laboratory, Kagoshima University, Japan. The experiment was arranged in two factors. The environmental condition factor consisted of a control and submergence treatment. The rice variety factor was randomized completely within the environmental factor. Two Oryza sativa L. genotypes, Inpari30 with Sub1A and IR72442 without Sub1A, were compared during six days of complete submergence followed by six days of re-aeration.
Comprehensive research flow is presented in Figure 1. The experiment was started by soaking rice seeds of Inpari30 and IR72442 in an incubator at 30 °C for three days. The germinated rice seeds were then sown in commercial soil (N/P/K = 0.9:2.3:1.1; pH 4.5–5.2) in a greenhouse. Ten-day-old seedlings were transplanted into hydroponic sponge (30 mm), which were then inserted into seedling trays inside experiment glasses (45 cm × 45 cm × 60 cm). Water was maintained at 4.5 cm from the container base, the same height as the seedling tray surface. Seedlings were grown at 27 °C and exposed to 12 h of light per day with an intensity of 300–350 μmol m−2 s−1 measured 20 cm above the tray surface.
On 14 days after seeding (DAS), the plant has, in total, four leaves with the third leaf as the most fully expanded. The submergence treatment was applied at 14 DAS by increasing the water level of the transparent container box to 35 cm above the plant shoot base. The water level of the control was maintained at 1 cm from the glass base throughout the experiment. The submergence treatment ended after six days (20 DAS, observed as desubmergence); the water level was then maintained at 1 cm from the glass base for the six-day recovery period. After the recovery period (26 DAS), all plants were removed from the containers for post submergence observation. Observations of variables explained below were conducted before water level was increased (referred to as ‘before submergence’), upon 6 days of submergence the plants were directly observed after the water was just removed from the experiment glasses (referred to as ‘desubmergence’), and 6 days after desubmergence (referred to as ‘post submergence’).

2.1. Photosystem II (PS II) Quantum Yield

Fv/Fm was measured following the method used by [6]. After 2 h in the dark, the third fully developed leaf of the rice plant was clipped with chlorophyll fluorescence equipment (AquaPen-P AP-P 100, PSI, Czech Republic). The maximal quantum yield of PS II photochemistry, calculated as variable fluorescence (Fv) divided by maximum fluorescence (Fm), was obtained by emitting an actinic light through the quantum yield menu.

2.2. Net Photosynthesis Rate

Net photosynthesis (Pn) was measured using a portable photosynthesis analysis system (LI-6400; LI-COR, Lincoln, NE, USA) as mentioned by [6]. Before the measurement, plant samples were adapted to light exposure 100–200 µmol m−2 s−1. The third leaf from each plant was collected and kept inside the chamber until a stable reading was recorded. The leaf was measured to the calculate gas exchange rate per observed area. During measurement, relative humidity was ~50%, leaf temperature was 27 °C with an ambient CO2 concentration ~400 µmol mol−1, airflow through the chamber was maintained at 500 µmol s−1, and photosynthetic photon flux density was 1100 µmol m−2 s−1.

2.3. Shoot Elongation (cm)

The length of each plant was measured from the base of the stem to the highest shoot tip using a ruler. Elongation was calculated as the difference of plant length on desubmergence with before submergence, and the difference of plant length on post submergence with desubmergence. Data are presented as the average from 12 plant samples in 3 replications.

2.4. Starch and Sugar Analysis

Forty plant samples was harvested from each time of observations to be separated into each leaf number and root. The samples were then dried at 80 °C using drying oven for 72 h. After that, the samples were milled using mortar and pestle to pass a 0.5 mm screen, then 100 mg was transferred to a glass test tube.
Next, 0.2 mL of aqueous ethanol (80% v v−1) was added to the tube to wet the sample and aid dispersion. A vortex mixer was used to stir the tube contents, then 3 mL of distilled water was added. The tube was then incubated in a boiling water bath for six minutes and vigorously stirred after two, four, and six minutes. The solvent was then separated into another tube and the process was repeated. The accumulated solvent was used for soluble sugar analysis and the remaining dissolved sample was used for starch analysis using total starch assays kit (K-TSTA) from Megazyme (AOAC Method 996.11, AACC Method 76-13.01) [21,22].

2.5. Statistical Analysis

Data were analyzed using a two-way analysis of variance. If significant differences were found, Tukey’s test was performed at a probability of 0.05. T-test was performed a probability of 0.05 to compare between submerged Inpari30 and IR72442.

3. Results

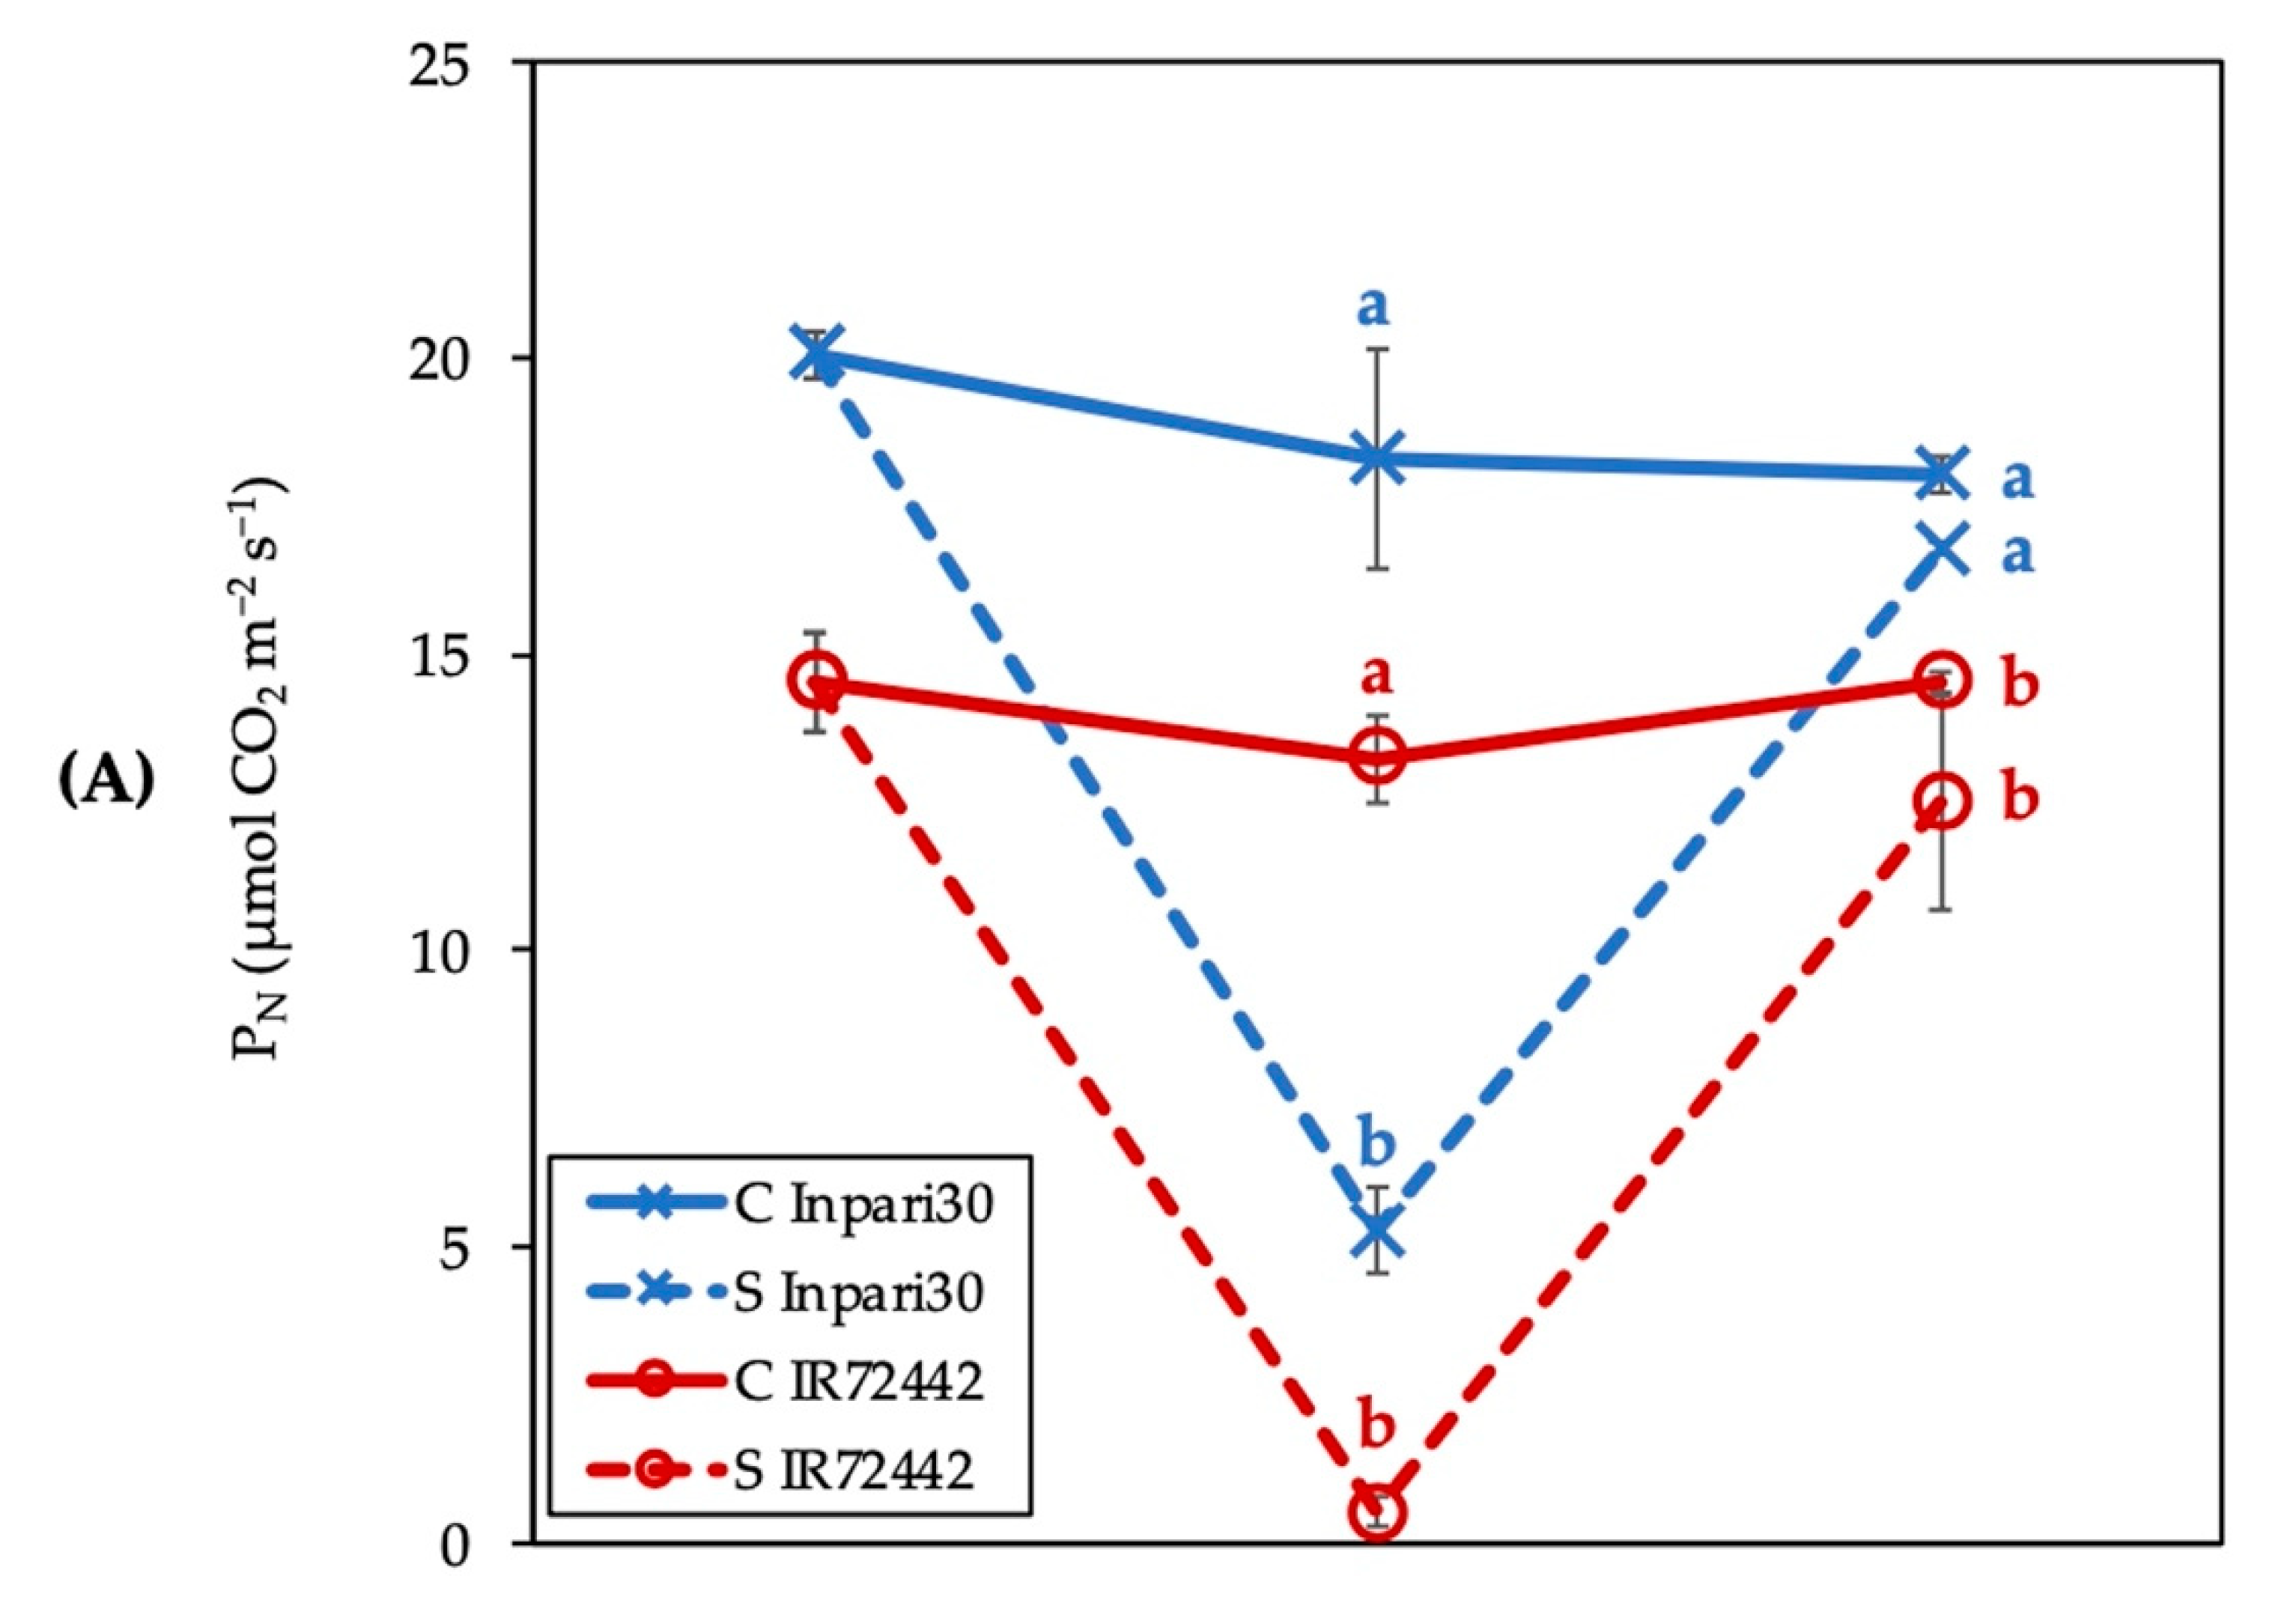
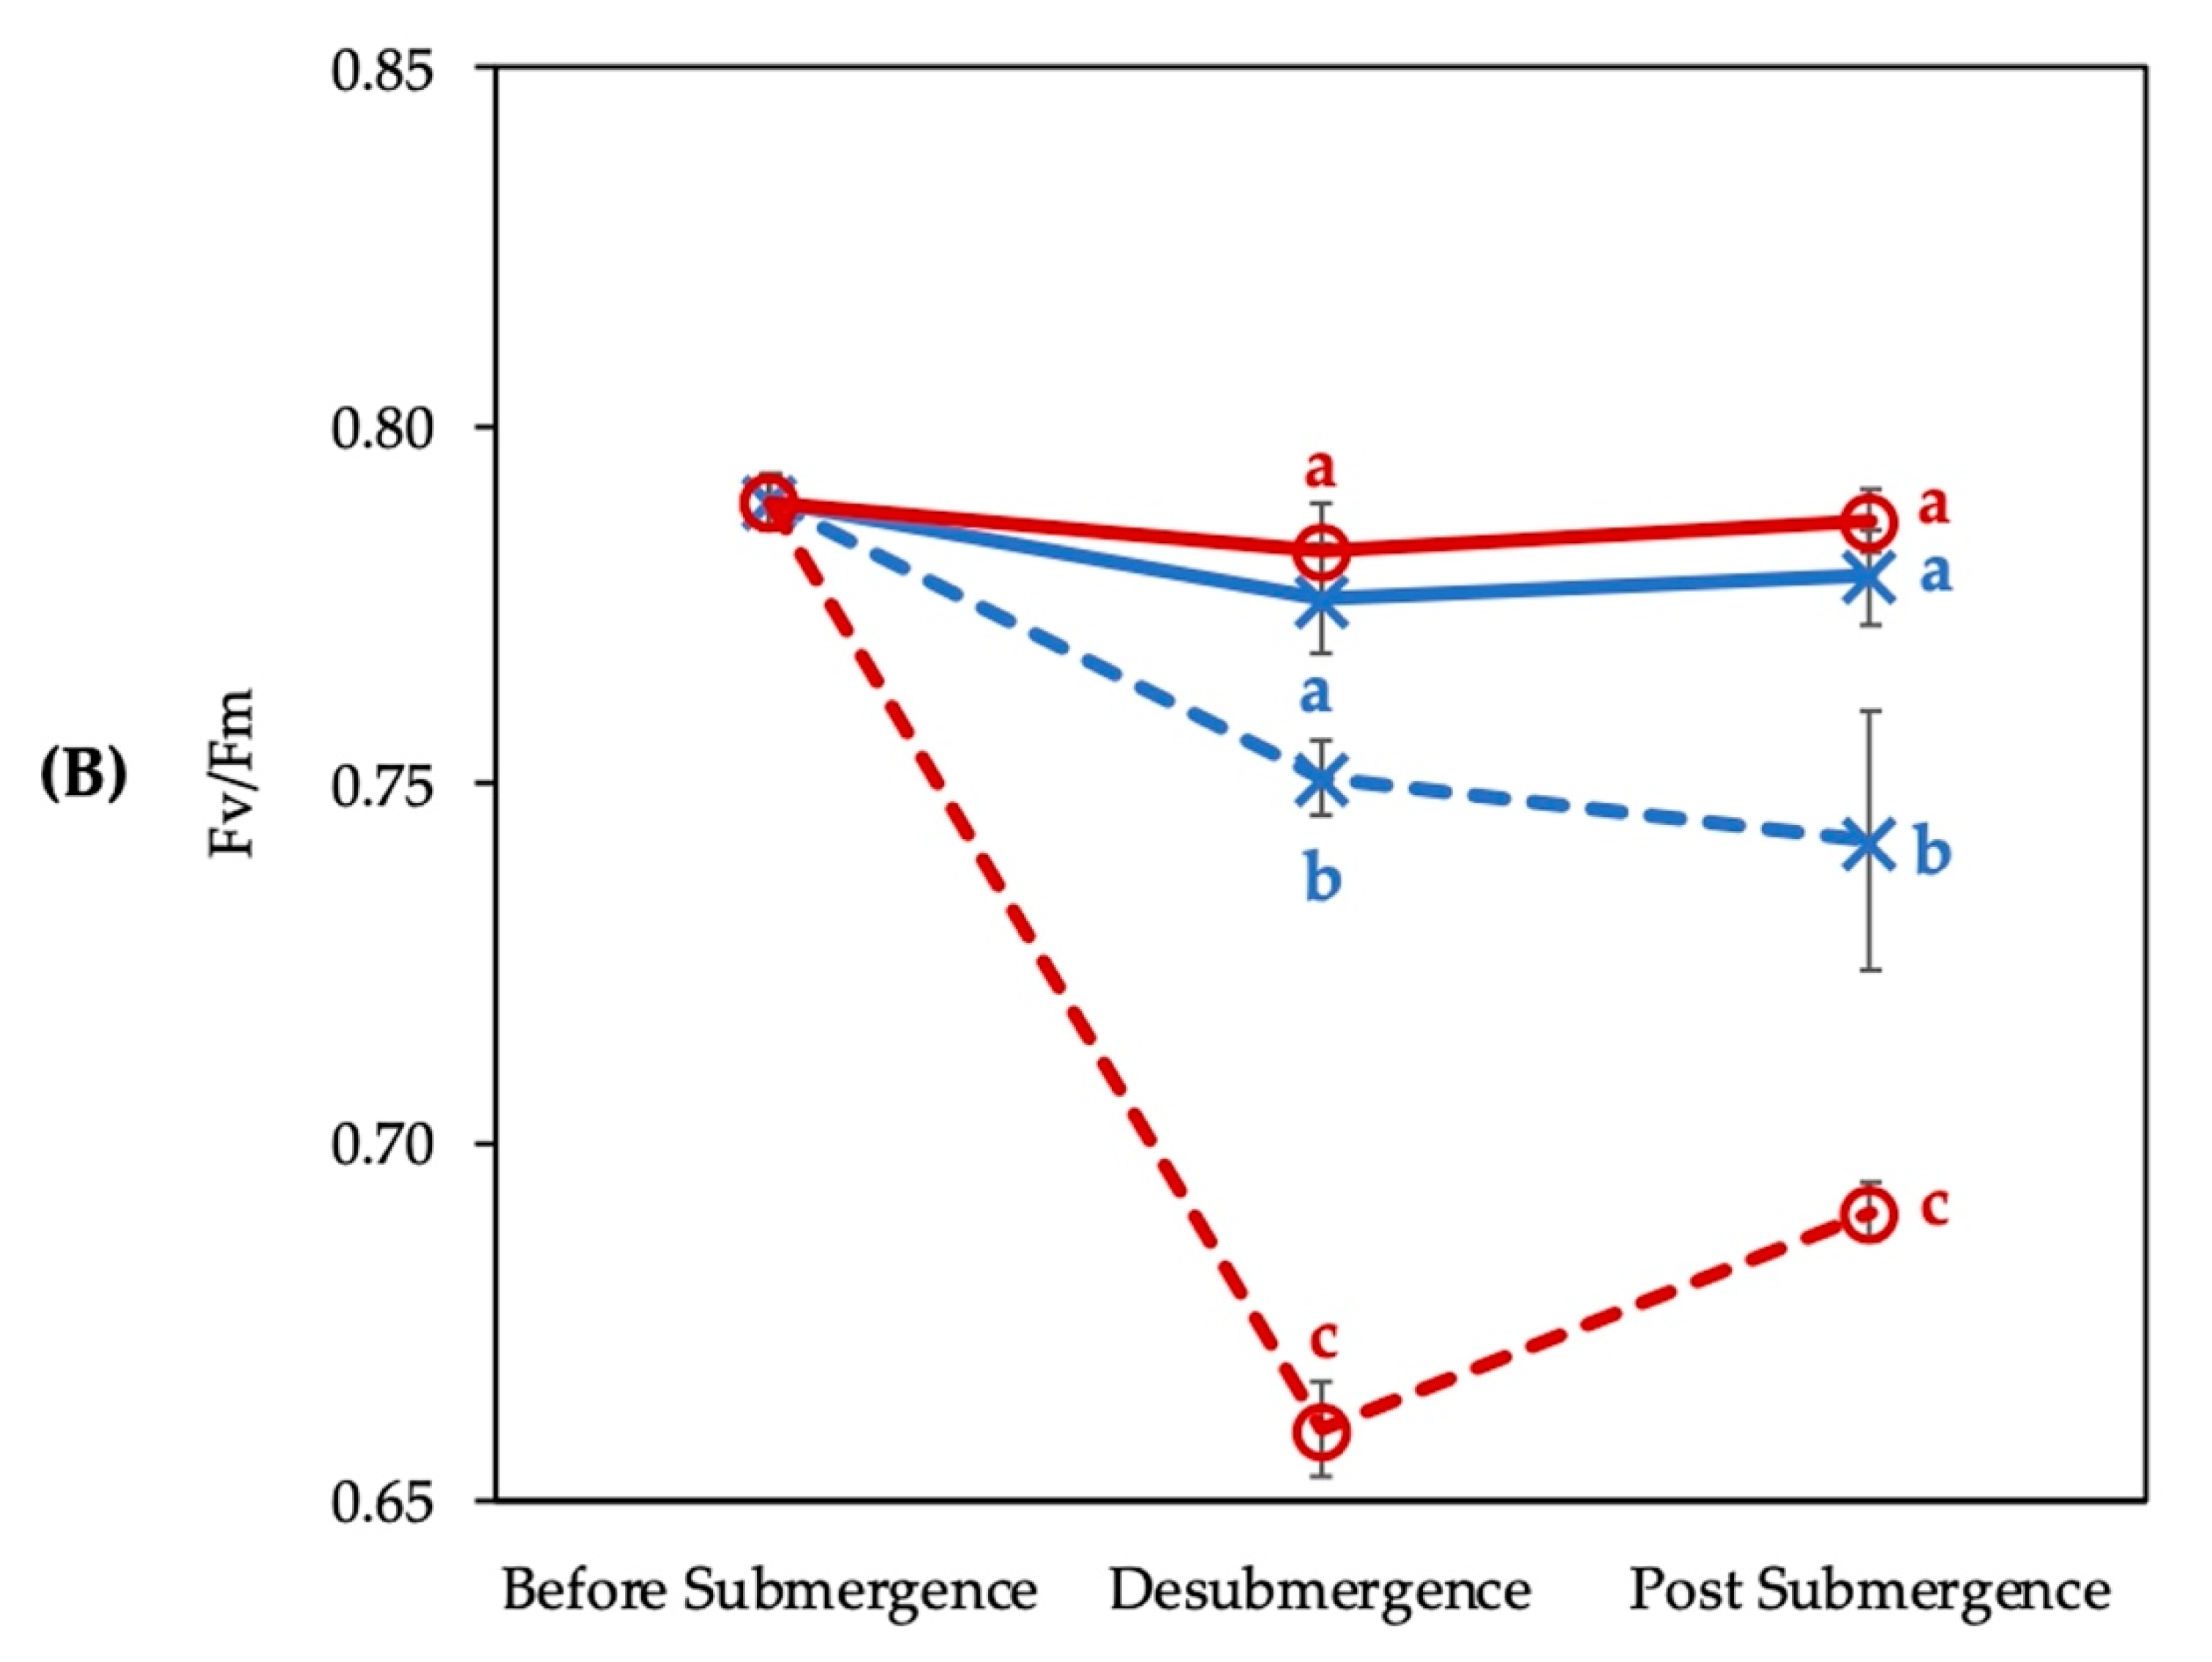
3.1. Photosynthesis Rate and Fv/Fm of Chlorophyll Fluorescence Affected by Submergence

The photosynthesis rate was 20.1 and 14.5 μmol CO2 m−2 s−1 in Inpari30 and IR72442, respectively, and was the same between control and submerged plant at before submergence. Then, the submerged plant gradually decreased to 5.3 and 0.5 μmol CO2 m−2 s−1 in Inpari30 and IR72442, respectively, at desubmergence, significantly lower by 71% and 96% than its control plant, respectively. At post submergence, photosynthesis rate was 18.0 and 16.8 μmol CO2 m−2 s−1 in control and submerged Inpari30, respectively, 14.5 and 12.5 μmol CO2 m−2 s−1 in control and submerged IR72442, respectively. No significant difference was found between submerged compared to control plants of the same genotype at post submergence (Figure 2A).
Fv/Fm value was 0.79 in Inpari30 and IR72442 regardless of control and submerged plant at before submergence. In desubmergence, Fv/Fm was 0.75 and 0.66 in submerged Inpari30 and IR72442, respectively, significantly 3.2% and 15.6% lower compared to the controls that were not submerged. In post submergence, Fv/Fm was 0.74 and 0.69 in submerged Inpari30 and IR72442, respectively, significantly 4.7% and 12.2% lower than the controls. The lowest Fv/Fm value was observed in submerged IR72442, which was four times lower than that of submerged Inpari30 (Figure 2B).

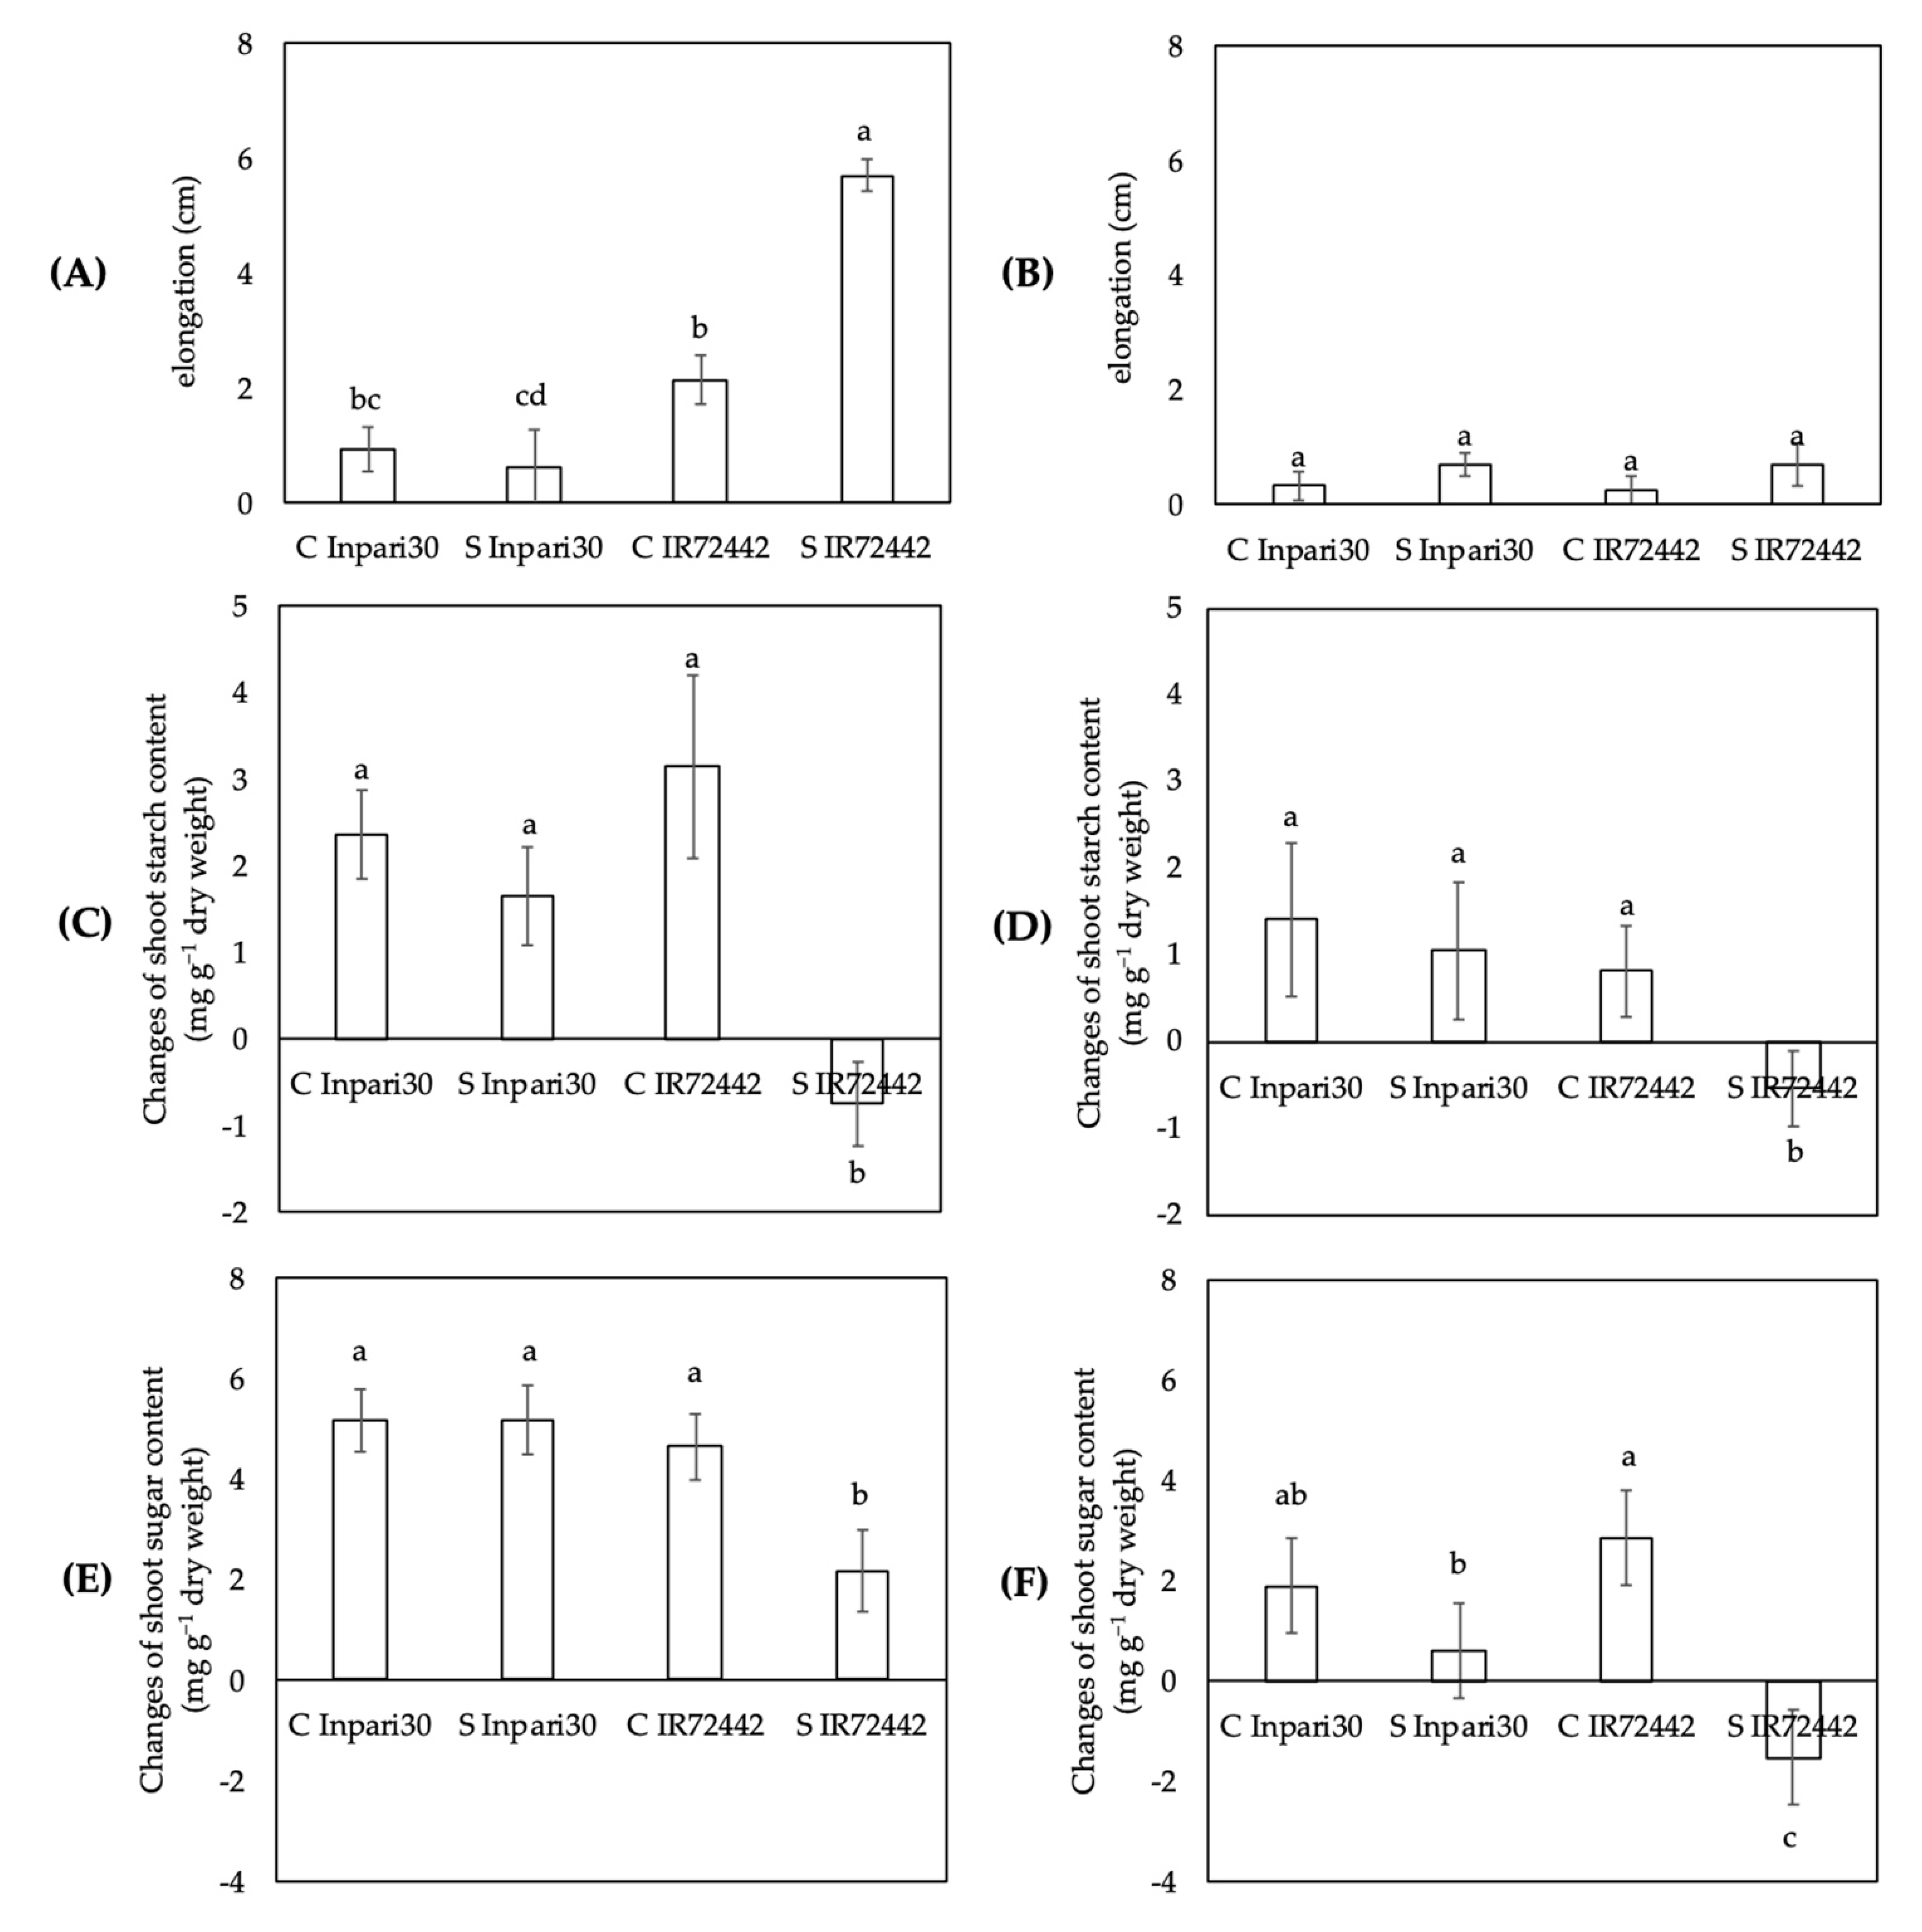
3.2. Changes in Starch and Soluble Sugar Content in Relation to Elongation

Environmental change occurred two times, from before submergence to desubmergence, which refers to ‘submergence condition’, and from desubmergence to post submergence, which refers to ‘recovery condition’. Here we compare the shoot elongation, change of shoot starch and sugar content to calculate the needs of starch and non-soluble sugar resulted from shoot elongation. The calculation revealed greater differences from the first period of before submergence to desubmergence than in the second period from desubmergence to post submergence (Figure 3). At submergence condition, submerged IR72442 exhibited a rate of shoot elongation 1.7 times higher than control IR72442 and more than 5.2 times higher than both control and submerged Inpari30 (Figure 3A). Significant differences in shoot elongation rate were not observed between treatments at recovery condition (Figure 3B). Comparison of the shoot starch content revealed that submerged IR72442 exhibited the smallest changes in these parameters, compared to control IR72442 and both control and submerged Inpari30 (Figure 3C). No significant differences were observed between control and submerged Inpari30 (Figure 3D). Submerged IR72442 exhibited the smallest changes in shoot sugar content among all treatments from before submergence to desubmergence (Figure 3E,F).

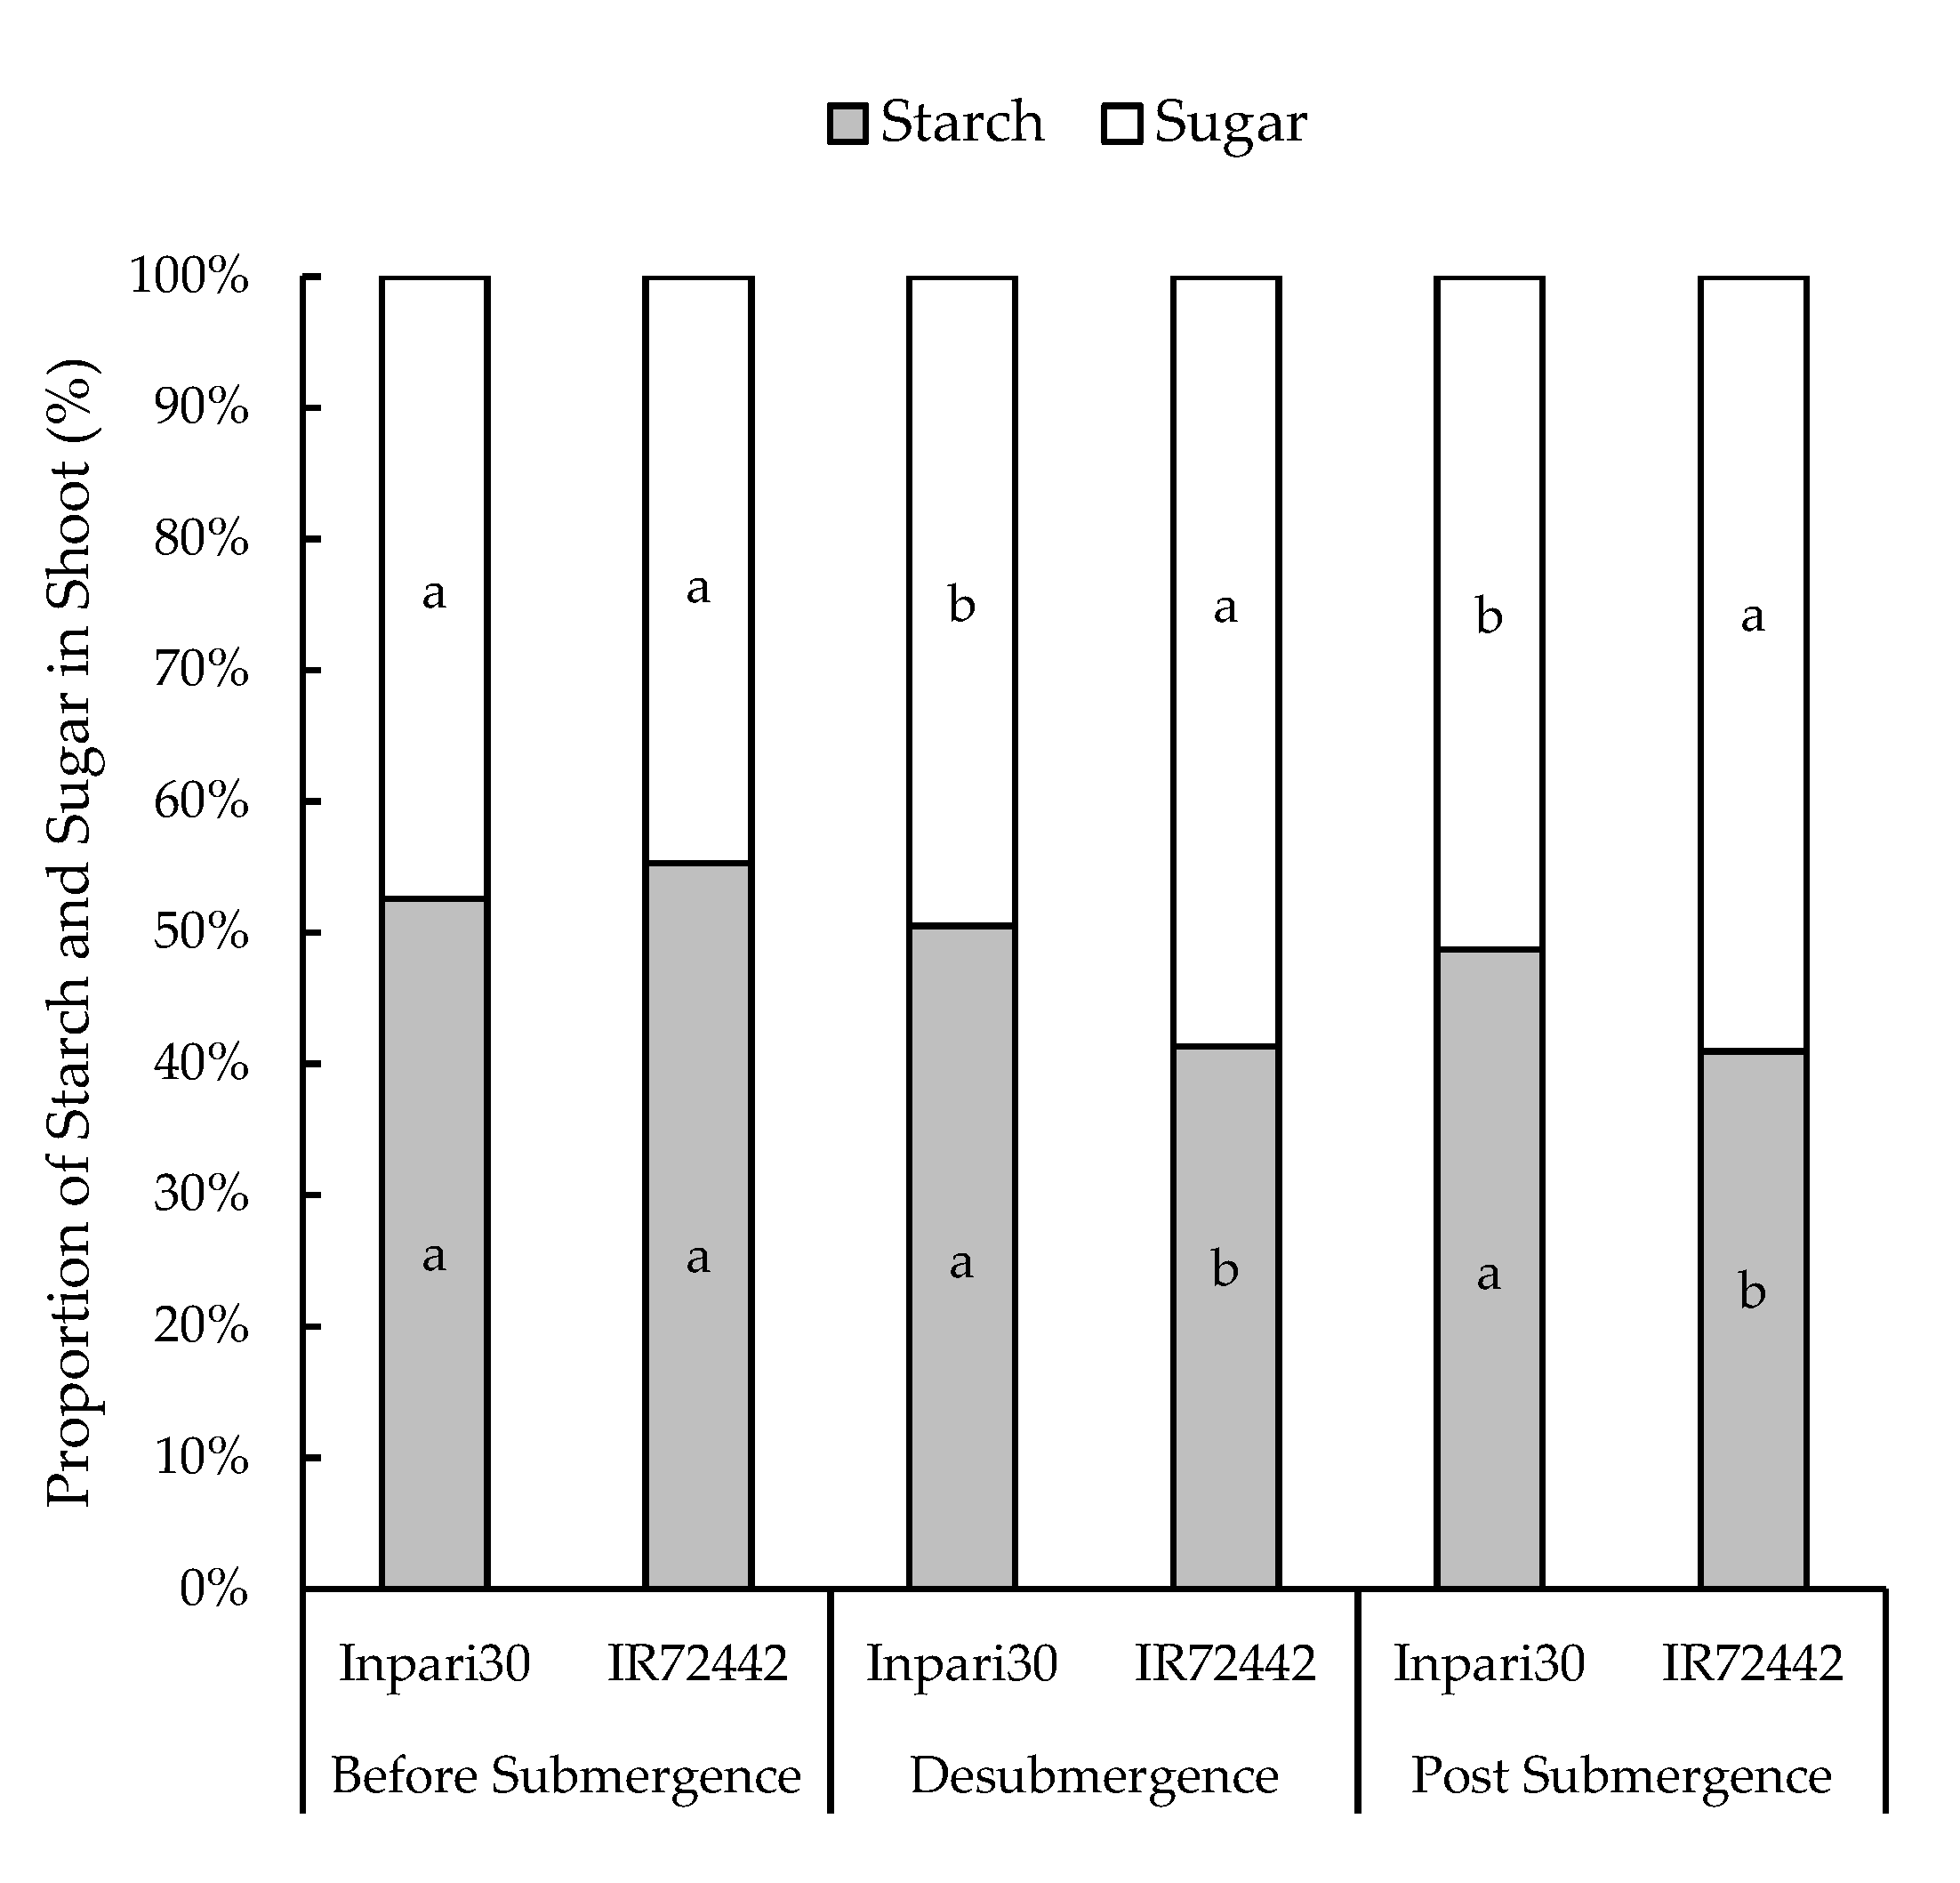
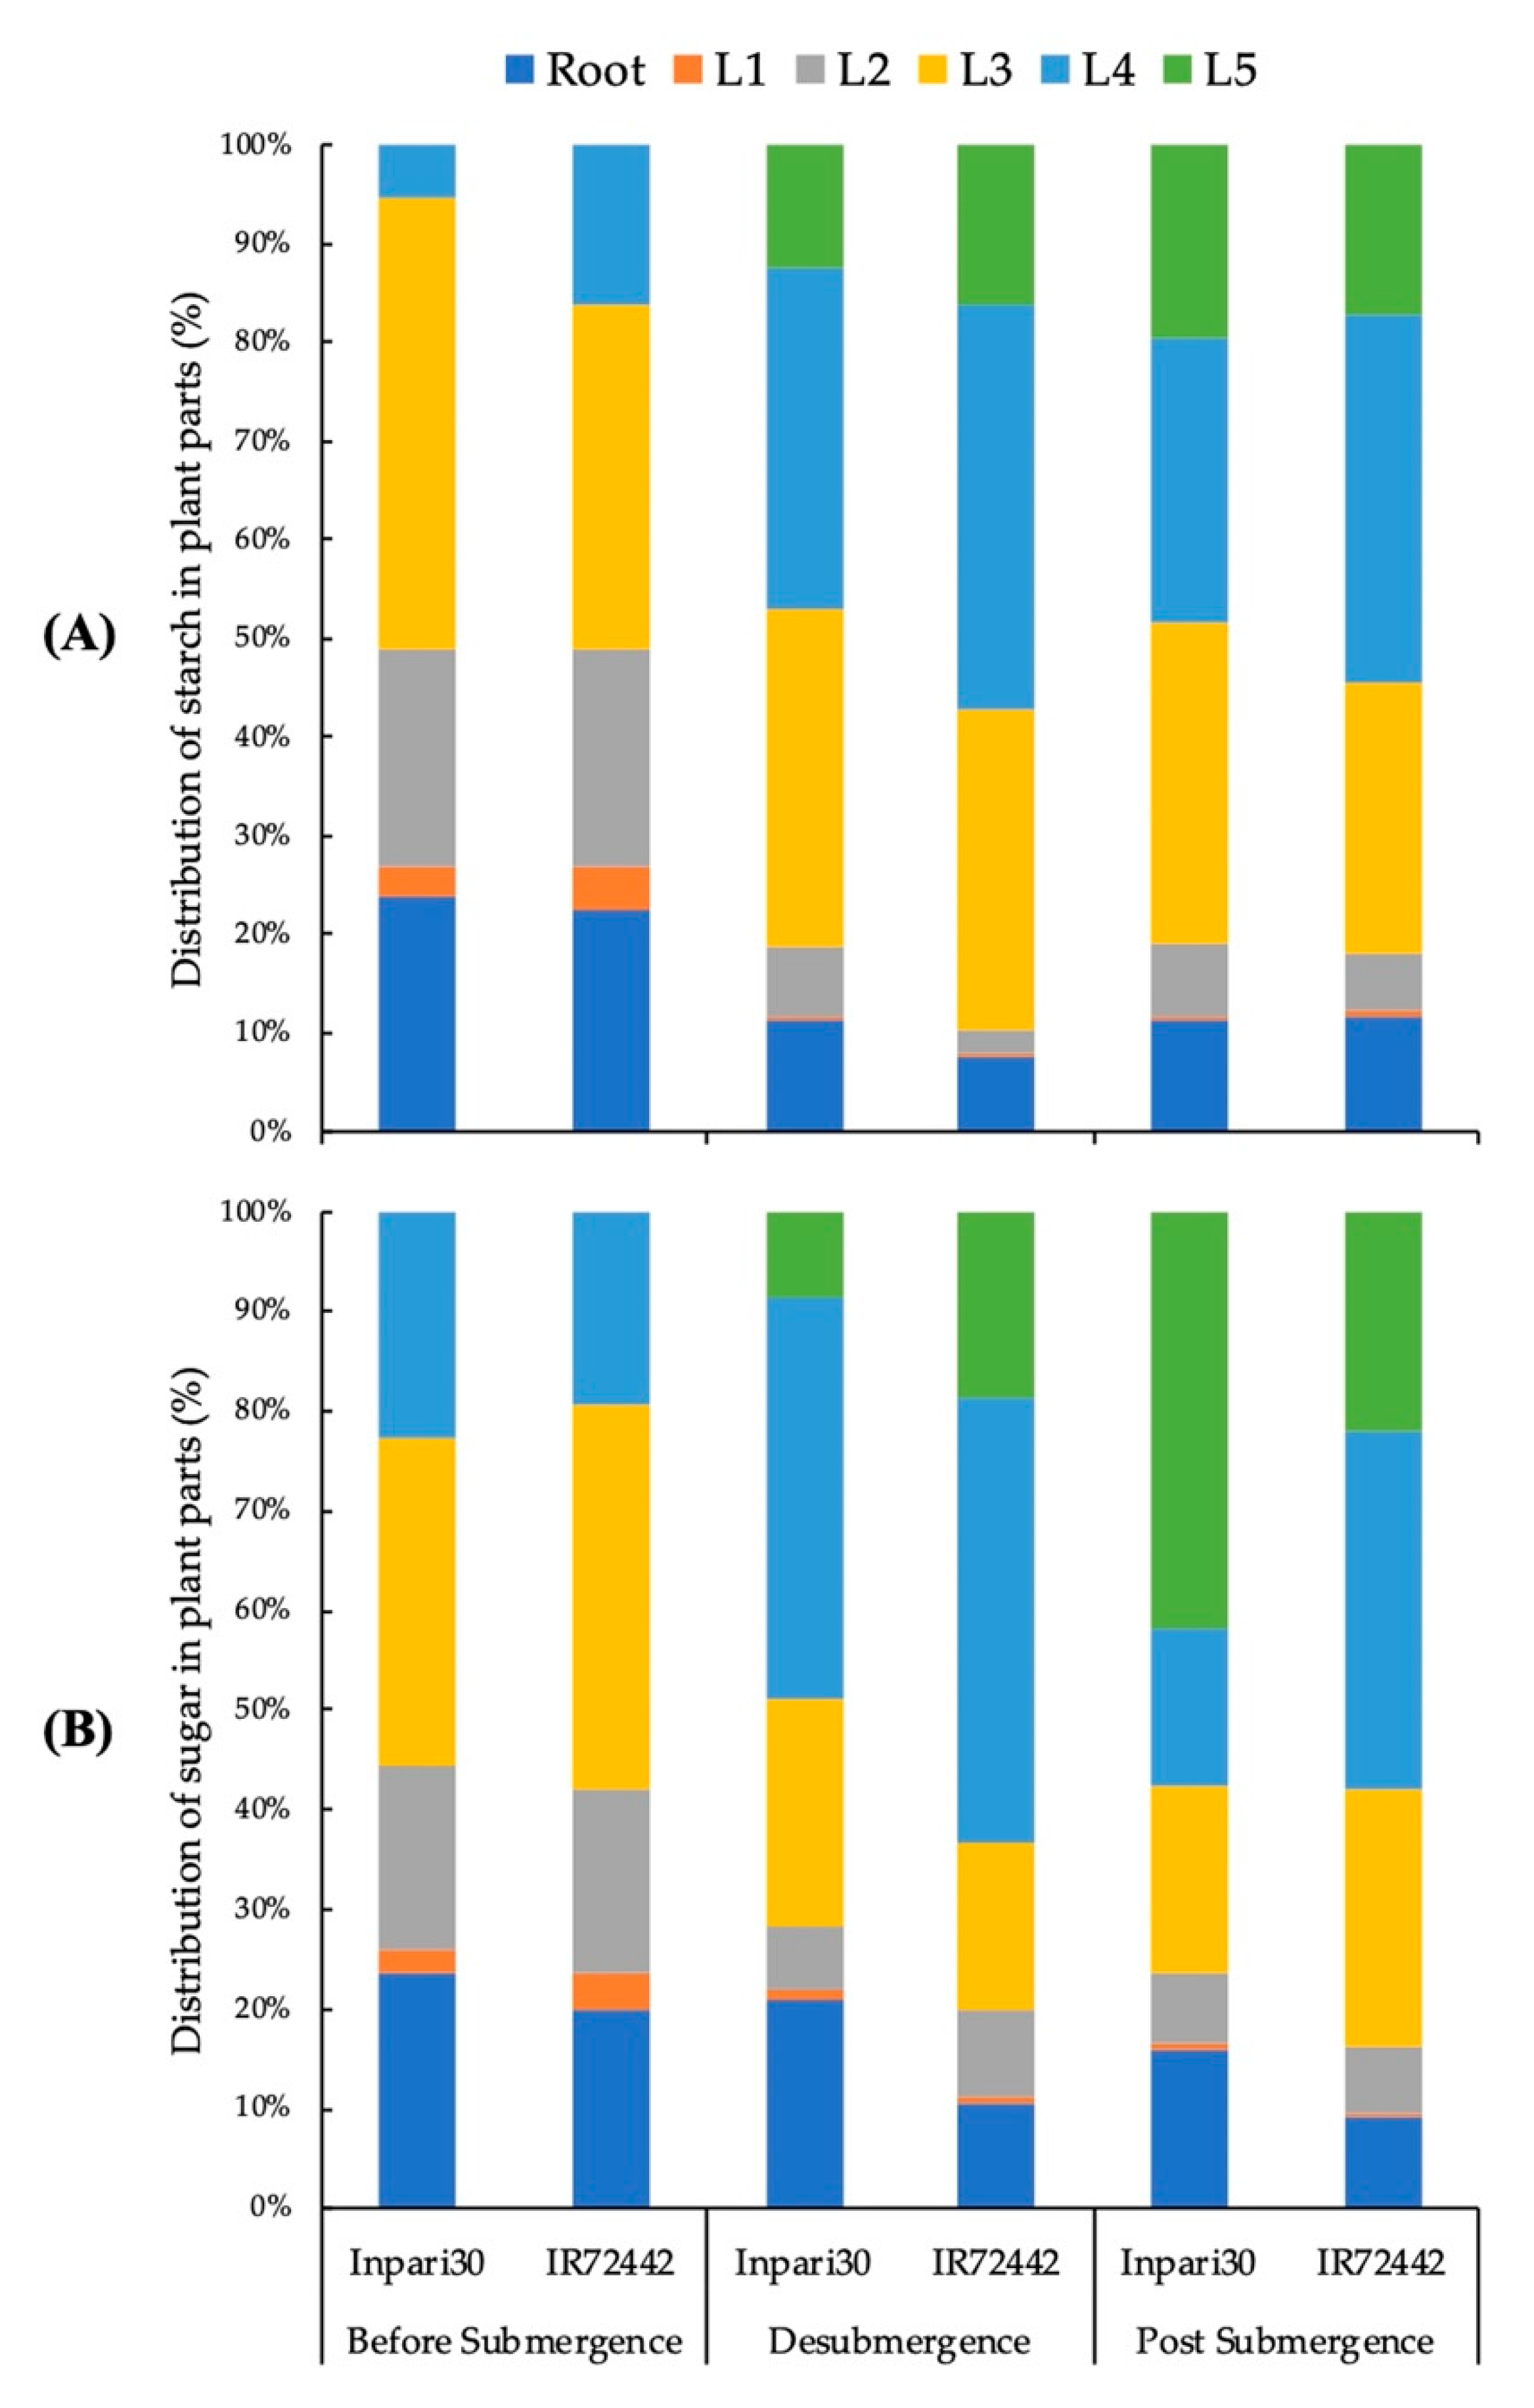
3.3. Distribution of Starch and Soluble Sugar to the Plant Organs

The third leaf was the most expanded leaf when the experiment started, comprised of high distribution of starch and sugar both on submerged Inpari30 and IR72442 (Figure 4A,B). Inpari30 distributed lower starch and sugar to the new, fifth, leaf than IR72442 on desubmergence. However, Inpari30 distributed higher starch and sugar to the 5th leaf than IR72442 on post submergence. The distribution of sugar tends to be higher than starch in the 5th leaf. The distribution of starch and sugar to the 5th leaf leads to decreasing distribution from root, 2nd, 3rd, and 4th leaves.
Before submergence was applied to the plants, the proportion of starch and sugar content in both genotypes were the same. However, at desubmergence and post submergence, Inpari30 had a higher proportion of starch content than IR72442, and IR72442 had a higher proportion of sugar contents than Inpari30 (Figure 5).

4. Discussion

Submergence changes the environmental conditions that a plant is exposed to, leading to several adjustments. In this experiment, the photosynthetic rate decreased on desubmergence in both the Sub1A genotype of Inpari30 and non-Sub1A genotype of IR72442 (Figure 2A). Observation of underwater photosynthesis on FR13A (a Sub1A donor genotype) was not proven in Swarna-Sub1 (Swarna that carries Sub1) and the rate was declined equal to Swarna and IR42. This result suggested that the ability to maintain underwater photosynthesis from the tolerant donor of Sub1A (FR13A) is not inherited to other genotype with Sub1A [23]. Fv/Fm, a measurement of the efficiency of PSII, observed at desubmergence was lowest in submerged IR72442 (Figure 2B). Chlorophyll fluorescence (Fv/Fm) is an effective indicator of submergence tolerance of rice [17]. The decline in Fv/Fm observed at desubmergence likely reflects a reduced ability of PSII to reduce the primary acceptor [13], which provides evidence for disorganization of the photosynthetic apparatus and is attributed to a decrease in light intensity and oxygen level in floodwater [13,24]. This reduction is also indicative of photoinhibition damage in response to environmental stress, resulting in a decline in the efficiency of solar energy conversion during photosynthesis [25,26].
Photosynthetic activity is a major determining factor of sucrose availability for translocation [27]. Plant carbohydrates are comprised of NSC, such as starch and soluble sugars that play important roles in the metabolic process of plants. As photosynthesis rates decreased on desubmergence, we examined the changes of starch and sugar in relation with elongation (Figure 3). Environmental change occurred two times, from before submergence to desubmergence, which refers to ‘submergence condition,’ and from desubmergence to post submergence, which refers to ‘recovery condition.’ Both changes resulted in changes of starch and sugar in response to elongation, mentioned by [28] as internal triggers that affects plant growth. Submerged IR72442 exhibited highest shoot elongation on submergence condition followed by smallest changes of starch and sugar content. Changes of starch and sugar on submerged IR72442 continues to occur in recovery period even if shoot elongation does not occur. However, submerged Inpari30 did not exhibit shoot elongation on submergence condition with no significant changes of starch and sugar content compared to the control plant. Change of starch and sugar content of submerged Inpari30 also was not significantly observed on recovery condition. This result suggests that the consumption of starch and soluble sugar in submerged IR72442 was a consequence of the rapid shoot elongation upon submergence. Shoot elongation is a vegetative response to escape from complete submergence [29]. Complete submergence reduces the rate of growth and carbohydrate concentration in shoot tissues [30]. Shoot elongation processes compete with maintenance processes for energy during submergence, resulting in low survival [7,13,31]. Additionally, decreases in the proportion of starch content during submergence might be due to low light intensity and lower chlorophyll content, resulting in reduced photosynthetic rates and subsequent depletion of starch [18]. However, shoot elongation during submergence may result in weak and droopy blades that are easily damaged by wind and water [4].
Distribution of starch and soluble sugar in specific plant organs reflects the translocation between organs before submergence, on desubmergence, and post submergence. Submerged IR72442 distributed starch and sugar content on the 5th leaf higher than submerged Inpari30 on desubmergence. However, the distribution changes on post submergence, whereas submerged Inpari30 distributed starch and sugar content on 5th leaf higher than submerged IR72442 (Figure 4). A proportion of sugar was higher than starch on desubmergence and post submergence of submerged IR72442 (Figure 5). This result suggested that in order to elongate, submerged IR72442 transported a proportion of starch and sugar into the 5th leaf as the newly developed leaf. Transport of photo-assimilates depends on source supply and sink demand; roots and young leaves are major sinks during early developmental stages. Balanced development could be achieved if prioritized photo-assimilate translocation was established between sinks. When photosynthetic rates decline during submergence, older leaves provide the only source of photo-assimilates to the younger leaves [27].

5. Conclusions

Generally, decreasing photosynthesis during submergence was observed in Sub1A and non-Sub1A genotype. Fv/Fm and NSC content decreased more in submerged IR72442 than in submerged Inpari30. Rapid shoot elongation was apparent during submergence following the consumption of starch and soluble sugar. Investigation of the distribution of starch and soluble sugar content in plant organs suggested that elongation of non-Sub1A genotype led to starch and sugar consumption that distributed faster to the new developed organ during submergence. In contrast, Sub1A genotype of Inpari30, which did not exhibit shoot elongation and showed slower NSCs distribution during submergence, performed better on post submergence by maintaining NSCs and distributing to the new developed organ faster. This study suggested that Sub1A genotype managed elongation and NSCs during submergence more efficiently than non-Sub1A genotype. Through this understanding, we can apply agronomical cultivation approaches for improving rice resistance tolerance to submergence in relation with the efficient use of non-structural carbohydrates. However, further research examining enzymatic schemes and gene expression would clearly distinguish the roles of starch and NSC behavior in plants subjected to submergence.

Author Contributions

A.H.I.N., S.Y., and J.-I.S. contributed in developing the research ideas, analyzing the data, conducting the research, and writing the manuscript; A.J. contributed in analyzing the data and writing the manuscript. All authors have read and agreed to the published version of the manuscript.

Funding

This research received no external funding.

Institutional Review Board Statement

Not applicable.

Informed Consent Statement

Not applicable.

Data Availability Statement

The data presented in this study are available on request from the corresponding author.

Conflicts of Interest

The authors declare no conflict of interest. The authors have agreed that this research is included as a chapter of a Doctoral Thesis at The United Graduate School of Agricultural Sciences, Kagoshima University, Japan.

References

  1. Geiger, D.R.; Servaites, J.C.; Fuchs, M.A. Role of starch in carbon translocation and partitioning at the plant level. Funct. Plant Biol. 2000, 27, 571–582. [Google Scholar] [CrossRef]
  2. Chatterton, N.J.; Silvius, J.E. Photosynthate partitioning into starch in soybean leaves: I. Effects of photoperiod versus photosynthetic period duration. Plant Physiol. 1979, 64, 749–753. [Google Scholar] [CrossRef] [PubMed]
  3. Das, A.; Nanda, B.B.; Sarkar, R.K.; Lodh, S.B. Effect of Complete Submergence on the Activity of Starch Phosphorylase Enzyme in Rice (Oryza sativa L.) Leaves. J. Plant Biochem. Biotechnol. 2000, 9, 41–43. [Google Scholar] [CrossRef]
  4. Catling, D. Rice in Deep Water; Palgrave Macmillan: London, UK, 1999. [Google Scholar]
  5. Mommer, L.; Pons, T.L.; Visser, E.J. Photosynthetic consequences of phenotypic plasticity in response to submergence: Rumex palustris as a case study. J. Exp. Bot. 2006, 57, 283–290. [Google Scholar] [CrossRef] [PubMed]
  6. Nurrahma, A.; Yabuta, S.; Junaedi, A.; Sakagami, J.I. Characterizing the photosynthetic ability of the submergence-tolerant rice variety of Inpari30 via maximum quantum yield performance during transient flooding stress and recovery. Aust. J. Crop Sci. 2021, 15. [Google Scholar] [CrossRef]
  7. Sarkar, R. Saccharide content and growth parameters in relation with flooding tolerance in rice. Biol. Plant. 1997, 40, 597–603. [Google Scholar] [CrossRef]
  8. Das, K.K.; Sarkar, R.K.; Ismail, A.M. Elongation ability and non-structural carbohydrate levels in relation to submergence tolerance in rice. Plant Sci. 2005, 168, 131–136. [Google Scholar] [CrossRef]
  9. Singh, S.; Mackill, D.J.; Ismail, A.M. Physiological basis of tolerance to complete submergence in rice involves genetic factors in addition to the SUB1 gene. AoB Plants 2014, 6, plu060. [Google Scholar] [CrossRef] [Green Version]
  10. Gautam, P.; Nayak, A.; Lal, B.; Bhattacharyya, P.; Tripathi, R.; Shahid, M.; Mohanty, S.; Raja, R.; Panda, B. Submergence tolerance in relation to application time of nitrogen and phosphorus in rice (Oryza sativa L.). Environ. Exp. Bot. 2014, 99, 159–166. [Google Scholar] [CrossRef]
  11. Xu, K.; Mackill, D.J. A major locus for submergence tolerance mapped on rice chromosome 9. Mol. Breed. 1996, 2, 219–224. [Google Scholar] [CrossRef]
  12. Xu, K.; Xu, X.; Fukao, T.; Canlas, P.; Maghirang-Rodriguez, R.; Heuer, S.; Ismail, A.M.; Bailey-Serres, J.; Ronald, P.C.; Mackill, D.J. Sub1A is an ethylene-response-factor-like gene that confers submergence tolerance to rice. Nature 2006, 442, 705–708. [Google Scholar] [CrossRef] [PubMed] [Green Version]
  13. Panda, D.; Sarkar, R.K. Role of non-structural carbohydrate and its catabolism associated with Sub 1 QTL in rice subjected to complete submergence. Exp. Agric. 2012, 48, 502. [Google Scholar] [CrossRef]
  14. Septiningsih, E.M.; Hidayatun, N.; Sanchez, D.L.; Nugraha, Y.; Carandang, J.; Pamplona, A.M.; Collard, B.C.; Ismail, A.M.; Mackill, D.J. Accelerating the development of new submergence tolerant rice varieties: The case of Ciherang-Sub1 and PSB Rc18-Sub1. Euphytica 2015, 202, 259–268. [Google Scholar] [CrossRef]
  15. Nugraha, Y.; Hidayatun, N.; Trisnaningsih, T.; Yuliani, D. Phenotypic performance of Ciherang SUB1 near isogenic line as an adaptive variety for flooding conditions. Indones. J. Agric. Sci. 2017, 18, 7–16. [Google Scholar] [CrossRef] [Green Version]
  16. Nurrahma, A.H.I.; Junaedi, A.; Purnamawati, H.; Sakagami, J.I. Rice Root Distribution of Four Rice Varieties to Different Depth of Submergence. Agrivita J. Agric. Sci. 2017, 39, 9. [Google Scholar] [CrossRef] [Green Version]
  17. Sone, C.; Ito, O.; Sakagami, J.I. Characterizing submergence survival strategy in rice via chlorophyll fluorescence. J. Agron. Crop Sci. 2012, 198, 152–160. [Google Scholar] [CrossRef]
  18. Das, B.; Dash, P.; Roy, A. Role of total sugar and starch content of rice seedlings at different ages in variable submergence tolerance. Oryza-Int. J. Rice 2009, 46, 304–309. [Google Scholar]
  19. Adak, M.K.; Ghosh, N.; Dasgupta, D.K.; Gupta, S. Impeded Carbohydrate Metabolism in Rice Plants under Submergence Stress. Rice Sci. 2011, 18, 116–126. [Google Scholar] [CrossRef]
  20. Panda, D.; Sarkar, R.K. Mechanism associated with nonstructural carbohydrate accumulation in submergence tolerant rice (Oryza sativa L.) cultivars. J. Plant Interact. 2014, 9, 62–68. [Google Scholar] [CrossRef]
  21. Horwitz, W. Official Methods of Analysis of AOAC International. Volume I, Agricultural Chemicals, Contaminants, Drugs; Horwitz, W., Ed.; AOAC International: Gaithersburg, MI, USA, 1997. [Google Scholar]
  22. AACC International. Approved Methods of Analysis; AACC International: St. Paul, MN, USA, 2010. [Google Scholar]
  23. Winkel, A.; Pedersen, O.; Ella, E.; Ismail, A.M.; Colmer, T.D. Gas film retention and underwater photosynthesis during field submergence of four contrasting rice genotypes. J. Exp. Bot. 2014, 65, 3225–3233. [Google Scholar] [CrossRef] [Green Version]
  24. Panda, D.; Sharma, S.G.; Sarkar, R.K. Chlorophyll fluorescence parameters, CO2 photosynthetic rate and regeneration capacity as a result of complete submergence and subsequent re-emergence in rice (Oryza sativa L.). Aquat. Bot. 2008, 88, 127–133. [Google Scholar] [CrossRef]
  25. Inamullah; Isoda, A. Adaptive Responses of Soybean and Cotton to Water Stress II. Changes in CO2 Assimilation Rate, Chlorophyll Fluorescence and Photochemical Reflectance Index in Relation to Leaf Temperature. Plant Prod. Sci. 2005, 8, 131–138. [Google Scholar] [CrossRef]
  26. Maxwell, K.; Johnson, G.N. Chlorophyll fluorescence—A practical guide. J. Exp. Bot. 2000, 51, 659–668. [Google Scholar] [CrossRef]
  27. Lemoine, R.; La Camera, S.; Atanassova, R.; Dédaldéchamp, F.; Allario, T.; Pourtau, N.; Bonnemain, J.-L.; Laloi, M.; Coutos-Thévenot, P.; Maurousset, L. Source-to-sink transport of sugar and regulation by environmental factors. Front. Plant Sci. 2013, 4, 272. [Google Scholar] [CrossRef] [Green Version]
  28. Pradhan, C.; Mohanty, M. Submergence Stress: Responses and adaptations in crop plants. In Molecular Stress Physiology of Plants; Rout, G.R., Das, A.B., Eds.; Springer: Chennai, India, 2013; pp. 331–357. [Google Scholar] [CrossRef]
  29. Hattori, Y.; Nagai, K.; Ashikari, M. Rice growth adapting to deepwater. Curr. Opin. Plant Biol. 2011, 14, 100–105. [Google Scholar] [CrossRef]
  30. Krishnan, P.; Ravi, I.; Krishnayya, G.R. Leaf senescence in submerged rice plants. Exp. Agric. 1999, 35, 345–355. [Google Scholar] [CrossRef]
  31. Setter, T.L.; Laureles, E.V. The beneficial effect of reduced elongation growth on submergence tolerance of rice. J. Exp. Bot. 1996, 47, 1551–1559. [Google Scholar] [CrossRef] [Green Version]
Figure 1. Schematic research flow of rice under complete submergence. The experiment was started by seed soaking in an incubator at 30 °C for three days, then germinated for 10 days in commercial soil. Then, 10 days after seeding (DAS) plants were transplanted into hydroponic sponge (30 mm), which were then inserted into seedling trays inside experiment glasses (45 cm × 45 cm × 60 cm). Submergence started at 14 DAS by increasing water 35 cm above stem base for submerged plant after taking observations and samplings. After six days of complete submergence, water was removed from the glass containers up to the height of stem base. Observations and samplings were conducted directly after water was removed. Six days after removing the water, observations and sampling were conducted to evaluate plant performance at post submergence. * DAS: Days After Seeding.
Sustainability 13 00670 g001
Figure 2. Photosynthetic rate (A) and Fv/Fm (B) of two rice genotypes (Blue color: Inpari30, a Sub1A genotype; Red color: IR72442, a non-Sub1 genotype) in two treatments (Line: C, Control; Dashes: S, Submerged) at before submergence, desubmergence, and post submergence. Different lowercase letters in the same column indicate a significant difference at p < 0.05 with Tukey test.
Sustainability 13 00670 g002aSustainability 13 00670 g002b
Figure 3. Elongation between (A) desubmergence and before submergence, (B) post submergence and desubmergence; changes of shoot starch content between (C) desubmergence and before submergence, (D) post submergence and desubmergence; and changes of shoot sugar content between (E) desubmergence and before submergence, (F) post submergence and desubmergence. Different lowercase letters in a single graph indicate a significant difference at p < 0.05 with Tukey test. Error bar represent standard deviation from three replications. C, Control; S, Submerged.
Sustainability 13 00670 g003
Figure 4. Distribution of (A) starch and (B) sugar of submerged Inpari30 (Sub1A genotype) and IR72442 (non-Sub1A genotype) in plant parts observed at before submergence, desubmergence, and post-submergence.
Sustainability 13 00670 g004
Figure 5. Proportion of starch and sugar in shoot of submerged Inpari30 (Sub1 genotype) and IR72442 (non-Sub1A genotype) before submergence, on desubmergence, and post submergence (re-aeration). Different lowercase letters in the same parameter indicate a significant difference at p < 0.05 with T-test.
Sustainability 13 00670 g005
Publisher’s Note: MDPI stays neutral with regard to jurisdictional claims in published maps and institutional affiliations.

