Abstract
Government provision of public housing services eases the disorderly spread of urban space, avoids the social risks caused by high density, and maintains a safe social life. The role of public housing services in realizing urban sustainable development has become increasingly prominent, yet the provision of adequate public housing of a decent quality in a desirable location is a major challenge. Therefore, this study proposes a holistic conceptual model of public housing service quality (PHSQ) and establishes corresponding evaluation indicators to objectively evaluate the current status of housing services. The results show that the overall PHSQ is low- to medium-quality; the city center has become a high-quality gathering area, and the suburbs are generally low-quality. The spatial pattern shows that a single high-quality center coexists with multiple low-quality centers, forming an approximate M-shaped distribution pattern. The geodetector results show that foundation supporting capacity, government control capacity, resource agglomeration capacity, market driving capacity, and social promotion capacity significantly affect the PHSQ. The influence produced by the interaction between different factors shows an enhanced relationship, especially between public discourse expression and other factors, implying the need to remove the overemphasis on “supply-side reform” and focus on the effectiveness of demand-side factors.
1. Introduction
Housing is fundamental to the social structure of society [1], and many aspects of urban dynamics are strongly affected by local housing policies [2]. Public housing and related policies are connected to the ecological, economic, and social aspects of sustainability [3]. The construction of public housing with limited investment can stimulate innovation in clean energy, water saving, noise reduction, building durability, materials application, construction technology, and other aspects. Undoubtedly, ecological and environmental benefits can promote sustainable urban development. While the ecological aspects of sustainability may not rely on single-building improvements that focus on a building’s life-cycle and performance, the economic and social aspects of sustainability focus on the connection between buildings and people, as well as the surrounding environment [4]. The role of community is emphasized in sustainable development since it is closely related to the lives of urban residents, yet it is simultaneously seen as the root of some social problems [5]. Public housing has an effect on improving the living environment of slums, curbing the disorderly spread of urban poverty space, and reducing crime rates [6]. Due to its effect on sustainable development, many megacities in China have successively invested a large amount of funds into building affordable housing. For instance, after the financial crisis, Shanghai began the construction of large-scale affordable housing from 2009 to 2019, building and raising 1.86 million sets of various types of affordable housing; the total financial investment reached 130 billion yuan. However, despite the large financial investment and completion of an enormous quantity of affordable housing, the public housing satisfaction ranking in Shanghai has stagnated, remaining in the middle or lower levels for a long time. Currently, public housing has serious problems such as poor property management services, low housing quality, insufficient public services, unfair distribution of housing, and unreasonable compensation for demolition [7]. There is even a welfare paradox of public service deprivation and group resistance in some areas. This phenomenon shows that the actual effect of the continuous investment in public housing services has not efficiently transformed into the improvement of people’s sense of satisfaction and service quality, and is far from meeting the needs and expectations of urban sustainable development.
We attempt to treat this phenomenon as the internalization of public housing services. That is, after housing security work has developed to a certain stage, a large amount of material input has not brought about substantial improvement in the effect of housing security or residents’ satisfaction. To improve the efficiency of resource utilization, it is necessary to thoroughly evaluate the current supply of public housing services. Scholars have formed a variety of methods; among them, satisfaction surveys, performance measurements, and social-space effect measurements are the most common. However, there is disagreement when applying these methods to evaluate the status of public housing service supply. For instance, satisfaction surveys are widely challenged by their subjectivity and limited participation in the supply chain [8]. Performance measures have drawn much criticism over the artificial selection of sets of objective output and outcome indicators in the models, as a result ACSI model has been widely used [9], increasing the difficulty of reflecting public expectations and public value demands [10]. The social-space effect evaluation is regarded as an outcomes-based evaluation, which cannot be tracked to the source of planning practices and policy decisions [11].
Due to these shortcomings, existing evaluation methods cannot adequately reflect the reality of the housing security services, and the problems within the housing security services hinder the realization of sustainable urban development. Therefore, to fill this gap, scholars urgently need to explain the current status of public housing service supply by assessing the strengths and weaknesses of different evaluation methods to establish an evaluation system that is centered on both people’s sense of benefit and of public value. The theory of public service quality has attracted the attention of many scholars. It emphasizes that the supply of public services can improve an individual’s subjective perception and recognition of public housing, meet the common needs within the community, adhere to the rules of decision-making in ethics and the ethical standards of public interest, achieve the goal of enhancing social welfare, and promote fairness and justice [12]. This theory is connected to the essential attributes of public housing services. Therefore, this study develops a comprehensive conceptual model of public housing service quality (PHSQ), based on the theory of public service quality, to clarify the reality of the housing security service supply and the attempts to analyze the mechanism shaping it. Shanghai is the largest city in China and has many housing problems. Therefore, this study chose Shanghai as its case study to answer the following questions:
- What is PHSQ? What attributes and elements are included?
- How can we evaluate PHSQ? What is the level of PHSQ in Shanghai? What kind of spatial pattern does it present?
- What are the key factors and motivation mechanisms that affect PHSQ?
2. Literature Review and Conceptual Connotations
2.1. Literature Review
Scholars have formed the following three paths to evaluate the provision of public housing services.
2.1.1. Performance Measurement
This type of research mostly analyzes the efficiency and effects of tangible resource elements such as land, capital, technology, human resources, and materials from input–output, output–result, and efficiency–fairness perspectives. Wu [13] established an evaluation index system from five aspects of investment, construction, control, guarantee, and execution. Fiscal expenditure funds, land input, applicants’ average income ratios, loans, and accommodation amounts are usually used to conduct evaluations [14,15]. Based on data on housing sales and residential investment, Chen and Nong [16] found that affordable housing has a significant crowding-out effect on pure commodity housing prices.
2.1.2. Satisfaction Survey
This type of research mostly analyzes residents’ subjective perceptions on their living environment, neighborhood relations, social interactions, property management, and public facilities from subjective–objective, government–citizen, and implicit–dominant perspectives. Li and Zhou [17] applied living conditions, educational facilities, employment environment, traffic conditions, safety, neighborhood relations, and psychological conditions to measure residents’ satisfaction and found that the psychological condition of low-income groups had improved significantly but the characteristics of deprivation of education, medical care, and employment opportunities were persistent. Social ties, social capital, social cohesion, security levels, and social attitudes are usually used to assess the supply of housing security services in residents’ satisfaction surveys [18].
2.1.3. Social-Space Effect Evaluation
This type of research mostly measures the space deprivation, neighborhood effect, and welfare level of social housing communities from body–psychology, space–behavior, and individual–group perspectives. Based on indicators of mental health, neighborhood facilities, and social environment, McCormick et al. [19] found that the probability of residents in social housing communities suffering from diabetes, hypertension, and chronic disease was more than three times that of ordinary commercial housing communities. Welfare communities with public entrances have supplanted mid- and high-rise buildings with communal hallways and new urbanism townhouses, apt at attracting outsiders and criminals [20]. Many studies have used crime rates, levels of incivility, and drug trafficking to evaluate social-space effects [21,22]. Moreover, some studies have found that long commute time not only affects residents’ willingness to travel, but also exacerbates the emergence of psychological problems [23] such as the desire for intimacy and belonging, the sense of alienation and loneliness, and other emotions [24]. Regarding the evaluation of public housing services, scholars have yielded many original research achievements. However, there is still much room for improvement. Generally, most studies have failed to escape the contradictions of the two-dimensional assessment framework. Product quality and service quality are artificially separated, dynamic processes and static results appear side-by-side, and private utility and public value cannot be integrated. Specifically:
1. The performance evaluation of public housing services can only evaluate its “obvious quality” rather than its “latent quality”. Performance measurement may focus on input and output indicators, which makes it difficult to simultaneously meet the requirements of standardization and variability [25], and also hard to reflect the essential connotations of fairness, social justice, and government interactions with the public when providing public services and implementing public policies [26]. The basic value pursuit of public services is in fairness rather than efficiency, and the particularity of public services requires not only the measurement of quantity but also of quality [27]. The performance evaluation of public housing services cannot take on multiple tasks such as evaluating whether an organization’s social goal is achieved, increasing public value, and the degree of goal achievement and value realization [28].
2. The satisfaction survey of public housing services has been questioned due to its “distortion” and “subjectivity”. There is active debate over the differences between agency- and citizen-generated data [29] and the content and methodological factors that determine these perceptions when conducting satisfaction surveys [30,31]. Citizens do not normally evaluate performance based on a full set of information [32], instead they use shortcuts or cues, meaning that measurement errors cannot be effectively avoided. Many studies have concluded that satisfaction cannot truly measure the quality of government services [33], while others have found the relationship between satisfaction and government service performance to be controversial [34].
3. The evaluation of the social-space effect is results-based; thus, it is difficult to reflect the overall picture of public housing service provision since it cannot be “traced to the source”. The market mechanism is embedded in the affordable community, and capital and power jointly shape the social-space landscape. After evaluating the social-space effect, it is difficult to distinguish the action and influence of government behavior and market behavior [35].
There are certain problems in these three research perspectives. Therefore, we need to assess their strengths and weaknesses based on the essential attributes of public housing services, and return to the essential functions of housing and people’s basic needs to evaluate the supply of public housing services. Power and rights, demand and supply, tools and values, and goals and means form the foundation of housing security services. Based on the theory of public service quality, this study establishes a holistic conceptual model of PHSQ to fill the gaps between the various theoretical perspectives.
2.2. Concept of PHSQ
Since the 1990s, research on the theory of public service quality has made great progress, passing through different stages such as product quality, service quality, and public service quality. The theories of process control and total quality management have become the basis of public service quality [14]. By combining the relevant basic theories, we can see that service quality is the link between multiple key elements which focus on process control, customer needs, and service efficacy to ensure service quality and achieve expected goals through intervention in the external environment. However, unlike general commodity services, publicity is the essential attribute of public housing services. The core dimension of publicity is to maintain public interests and meet public needs. Therefore, PHSQ has value attributes and functional attributes as its characteristics. The external forms of public housing services are presented in various dynamic behaviors, activities, processes and static products, functions, welfare, and other forms. Therefore, PHSQ also has process attributes and result attributes as its characteristics. Thus, according to research on the essential attributes and external forms of public services, the current study establishes a four-dimension model of the quality elements of public housing services, containing value–function–process–results. Table 1 shows the nature and elemental sources of each dimension.

Table 1.
Characteristics of PHSQ.
2.3. Policy Background
In fact, the emergence of the internalization of public housing services has a deep-rooted institutional and policy background. Existing research has shown that a shift in the provisional responsibility of urban housing from work units to the market was a precondition of the market-oriented reforms of state-owned enterprises in the early 1980s, making the revitalization of China’s urban economy possible [45]. Nonetheless, the Chinese post-reform urban housing system has put excessive priority on the economic function of housing investment, while largely overlooking the basic shelter needs of low-income households [46]. Many local governments regard housing security policies as a tool to promote economic growth; the housing security policies they implemented also have distinct attributes of group exclusion and ignore the public attributes of public housing service. Despite the market-oriented housing reform of 1998, the state did not plan to withdraw completely from the provision of housing.
Therefore, a two-tier public housing system, consisting of cheap rental housing (CRH) and economical and comfortable housing (ECH), was introduced in 2001. In Shanghai, the CRH program targets low-income households with a nominal rent rate, and the ECH program is expected to promote home ownership within low- to medium-income households who could not afford to buy a home at market price. The Shanghai government usually appropriates state-owned land to real estate developers for free or for a very low price, then directs them to take responsibility of the financing and construction of ECH. The profit for real estate developers is capped at around 3%, so as to keep the price of ECH at an affordable level for most low-income households. Due to the limit on land revenue, since 2010, Shanghai has launched shared ownership housing (SOH), which clearly requires about half of the capital gains when selling the housing be returned to the government, while ECH does not explicitly have such regulation. Around 2008, public rental housing (PRH) emerged, with rapid development in Shanghai, and the municipal and district governments have successively established public rental housing operating companies. PRH is the only type of public housing accessible to migrants (residents without local residence permits or hukou), and its rent is generally only slightly lower than market rent. The four main types are shown in Table 2.
Table 2.
Types of public housing in Shanghai.
At present, Shanghai has formed a four-in-one housing security system, but due to the inherent deficiencies of the policy, it is still difficult for public housing services to meet the goals of social equity and maintain the living requirements of low-income households. Significant public financial resources and a large number of policies have not achieved considerable public satisfaction. Therefore, it is necessary to find a suitable method to evaluate PHSQ.
3. Data Sources and Methods
3.1. Establishment of an Index System
The above elaboration of the attributes and characteristics of PHSQ lays a solid foundation for its evaluation. Based on the routine, availability, representativeness, and comparability principles of data acquisition, we developed an index system for evaluating PHSQ. The main steps were as follows. (1) We combined the relevant literature and conducted small-scale interviews with experts to determine initial indicator sets, using four dimensions and nine attributes. The selection of indicators in each dimension had a sufficient academic basis. (2) We used the Delphi method to optimize the indicators. To ensure professionalism, comprehensiveness, and representativeness of the experts’ opinions, scholars and government officials were invited to score the indicators. First, academic experts with significant research in the fields of public housing, performance evaluation, and public service quality were selected through the China national knowledge infrastructure (CNKI). Then, we interviewed intermediate officials from the Shanghai Municipal Housing Security Bureau, the Pudong Construction and Transportation Commission, and other departments. Finally, a total of 30 academic and government experts were interviewed to select and score the initial indicators via online interviews, letters, and e-mails. (3) To eliminate inappropriate indicators and determine the final ones, we effectively issued 30 questionnaires; 21 were recovered (the recovery rate was 70%) and the CR (Coefficient of Variation) value was less than 0.05. Among them, 95% of the experts believed that the existing index system was qualified. Based on the results of the experts’ scores, we then selected the top two scoring indicators among the three-level indicators as final, and eliminated those that were considered to be inappropriate by more than 60% of the experts. Based on the nature and connotations of PHSQ, and the combined existing research and expert interviews, we finally determined the index system (see Table 3).
Table 3.
The index system and weight of PHSQ.
3.2. Research Methods
3.2.1. Analytic Hierarchy Process (AHP)
This study used the AHP method to determine the weight of the index. The first-level indicators were more important and relatively complex for PHSQ and showed how the four irreplaceable dimensions interacted and merged with each other. Therefore, the AHP method was only used to determine the weights of the secondary and tertiary indicators. This study first used the root-finding method to calculate the maximum eigenvalue of the reciprocal matrix and its corresponding eigenvector, then determined the weight of each index. The coefficient of variation was less than 0.05, which passed the consistency test. The specific weights are shown in Table 3.
3.2.2. Full Arrangement Polygon Method
Considering that there were incomplete, replaceable relationships among the four dimensions in the analysis framework, this study chose the full arrangement polygon method to comprehensively integrate the PHSQ in the four dimensions.
Supposing that the PHSQ of the i-th residential community is a polygon, and the individual comprehensive scores of the four dimensions are a, b, c, and d, then the angle between any two dimensions is , and area S of the quadrilateral is:
Since the area of polygons combined by different sorting methods will be different, the average area of all polygons composed of the four dimensional qualities is selected. The average area of all possible combinations of polygons depends on the total value of the four dimensional qualities multiplied by each other. Therefore, this value is used as the index of PHSQ:
The above formula can better reflect the incomplete, replaceable relationship between the four dimensions as it is more in line with the conceptual definition of PHSQ than the weighted average method. If the quality index distribution of the four dimensions is more balanced, the score calculated from this formula will also be greater. Conversely, if the quality index of the different dimensions is highly polarized, the score will be greatly reduced. For example, in Figure 1 (below), a, b, c, and d represent the individual comprehensive scores of the four dimensions, while A, B, C, and D represent the comprehensive service quality index composed of the four dimensions.
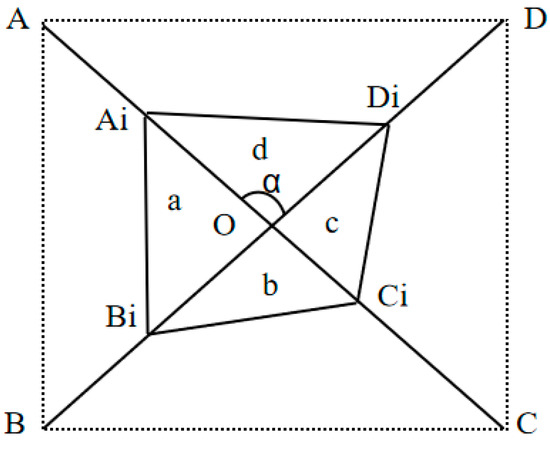
Figure 1.
Schematic diagram of PHSQ.
3.2.3. Geodetector Model
The geodetector model is a statistical analysis method developed by Wang Jinfeng and Xu [60] to detect spatial differentiation and reveal its driving factors. It includes four tools: differentiation factor detection, interaction detection, risk area detection, and ecological detection. The coupling of variables’ spatial distribution can be tested to detect possible causal relationships between them. We will use the geodetector model to find the main factors affecting PHSQ. Factor detection and interaction detection are used in this study. Factor detection is used to analyze the decisive power of each independent variable. Factor detection can be measured using q value; the range of q is (0–1), the greater the value of q, the greater the influence of the factor. Interaction detection is used to identify the interaction between different factors and assess whether the synergy between different factors will increase or weaken the explanatory power. The types of interaction between two covariates include non-linear weakening relationships, single-factor nonlinear weakening relationships, non-linear enhancement relationships, and two-factor strengthening relationships. The use of interaction factor detection methods helps in discovering the dynamic mechanisms affecting PHSQ.
3.2.4. Spatial Autocorrelation Analysis
Spatial autocorrelation analysis is a research method that integrates a variety of spatial analysis techniques. The core of this method is to analyze the correlation degree between different interest points in a certain area unit under the condition of spatial proximity or similarity. Spatial autocorrelation analysis can be divided into global and local spatial autocorrelation. Global spatial autocorrelation mainly analyzes the distribution characteristics of spatial data in the entire region, while local mainly analyzes the distribution characteristics of local units. Moran’s I is the main indicator used for judging global spatial autocorrelation. When the value of I > 0, the observation object tends to cluster in a space. When I < 0, the spatial distribution of the observation object tends to be discrete or uniform.
4. Results and Analysis
This study collected a total of 530 public rental housing, affordable housing, and resettlement housing communities, distributed over 152 streets and towns, through the Shanghai municipal and district government websites. Using the weighted average method, we obtained the PHSQ in each street/town (see Table 4) and analyzed them from two aspects: overall level and spatial characteristics. (Note: according to Shanghai’s official documents, the 16 administrative districts are divided into core areas (Jingan, Huangpu, Xuhui, and Changning), core marginal areas (Yangpu, Putuo, and Hongkou), suburban areas (Baoshan, Jiading, Pudong, Minhang, and Songjiang), and outer suburbs (Qingpu, Jinshan, Chongming, and Fengxian).
Table 4.
PHSQ in each town/street (partial).
4.1. Level Characteristics of PHSQ
4.1.1. Comprehensive Level Analysis
Using the systematic clustering method, PHSQ was divided into five types: high-quality area (3.00 ≦ PHSQ ≦ 4.00), medium-high-quality area (2.40 ≦ PHSQ < 3.00), medium-quality area (1.90 ≦ PHSQ < 2.40), medium-low-quality area (1.20 ≦ PHSQ < 1.90), and low-quality area (0.50 ≦ PHSQ < 1.20). The proportions of the five types are shown in Figure 2.
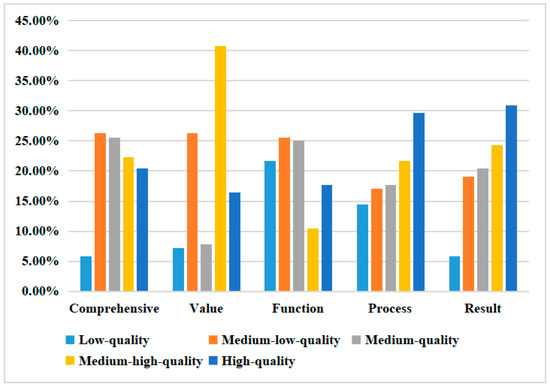
Figure 2.
Proportion of each level of PHSQ.
Overall, the PHSQ in Shanghai has the following characteristics. (1) The overall quality level remains dominated by medium and low grades. From the proportion of each type, the medium-low-quality area > medium-quality area > medium-high-quality area > high-quality area > low-quality area, and the medium- and below-quality grades accounted for 57.8%. This shows that the current PHSQ in Shanghai is dominated by middle and low grades, and the overall level remains unsatisfactory. (2) The central city has become a high-quality gathering area. In terms of individual streets and towns, Jiangning Road in Jingan District is highest (3.93), and the top 10 streets/towns are all located in the core area. In terms of average quality, the core area (3.21) > core edge area (2.85) > suburban area (2.12) > outer suburban area (1.65), and the core area and the core edge are have become high-quality agglomeration areas. (3) The quality of the suburbs is generally low, and the relatively superior streets/towns in the outer suburbs have an obvious orientation toward the administrative centers. All of the 75 streets/towns that have a lower than average PHSQ are located in the suburbs and outer suburbs, and the overall quality is low. In the outer suburbs, most of the medium- and high-quality streets/towns are those where the district or neighboring administrative center is located, such as Nanqiao Town in Fengxian District, Chengqiao Town in Chongming District, and Shihua Street in Jinshan District. The characteristic of administrative power in the outer suburbs affecting the distribution of resources is more pronounced.
4.1.2. Single-Dimensional Quality Level Analysis
The four dimensions of PHSQ show large differences with obvious differentiation characteristics, as follows.
- In the value dimension, the medium-high-quality areas are the majority, and the high- and low-quality towns/streets are intermingled. In terms of the proportion of each type, the medium-high-quality area (40.7%) > medium-low-quality area (26.3%) > high-quality area (16.4%) > medium-quality area (7.9%) > low-quality area (7.23%). The proportion of the medium-high-quality areas are greater than other types. In terms of the average quality of each district, the core edge area (0.58) > suburban area (0.56) > central city area (0.43) > outer suburban area (0.39). The average quality of the core edge area is 1.49 times that of the outer suburban area, and the highest-quality street/town is 10.87 times that of the lowest-quality street/town. The city-wide difference coefficient was 0.37, which reflects significant regional differences in the quality of value dimensions.
- In the functional dimension, the quality is mainly in the middle and low grades and decreases from the core to the periphery, while the outer suburbs have become places of depression. In terms of the proportion of each type, the medium-low-quality area (25.6%) > medium-quality area (25.0%) > low-quality area (21.7%) > high-quality area (17.7%) > medium-high-quality area (10.5%). The middle- and below-quality areas accounted for 72.3%, implying that the streets/towns that had inferior quality accounted for the vast majority. Only one of the 84 towns that exceeds average quality is in the outer suburbs (Xujing Town, Qingpu). In terms of average values, the outer suburban area (0.44) < core area (0.72) < inner suburban area (0.67) < core edge area (0.61), and the quality of the outer suburban area is significantly lower than other areas.
- In the process dimension, the quality is mostly above the middle level, and the core area is outstanding. In terms of the proportion of each type, the high-quality area (29.6%) > medium-high-quality regional area (21.7%) > medium-quality area (17.7%) > medium-low-quality area (17.1%) > low-quality area (14.4%). The quality of the middle- and high-quality districts accounted for 69.0%, which reflects that the quality advantage of streets/towns accounted for the vast majority. Among the 26 high-quality streets/towns, 18 are in the core area or core edge areas, and the quality of Jiangsu Road in Changning District (belonging to the core area) is the highest (0.90). In terms of average quality, the core area (0.77) > suburban area (0.67) > outer suburban area (0.65) > core edge area (0.64), which reflects that the average quality of the process dimension in the core area far exceeds that of the other areas.
- In the result dimension, the quality is mainly of high and medium level, and each district matches one another. In terms of the proportion of each type, the high-quality area (30.9%) > medium-high-quality area (24.3%) > medium-quality area (20.4%) > medium-low-quality area (19.1%) > low-quality area (5.9%). The medium- and high-quality levels accounted for the vast majority. In terms of average quality, the core area (0.97) > core edge area (0.95) > suburban area (0.93) > outer suburban area (0.91), and the average quality of each district was between 0.91 and 0.97, while the coefficient of variance for each street/town was only 0.11. We can infer that the quality of the results dimension is relatively balanced, since each district is similar and has little difference.
4.2. Space Characteristics Analysis of PHSQ
Using Geodata software, we calculated Moran’s I of PHSQ and of each dimension. We conducted the statistical test on the Z-value and P-value, and the relevant results are shown in Table 5. The P-values pass the 5% significance level, meaning that the PHSQ and the quality of its various dimensions have a certain degree of concentration.
Table 5.
Moran’s I of PHSQ and subsystems.
4.2.1. Comprehensive Spatial Characteristics
In terms of comprehensive spatial patterns, PHSQ has three obvious spatial characteristics, as follows:
- From the perspective of spatial form, a single high-quality center coexists with multiple low-quality centers, and a circle structure of “one high and many low” forms an approximate M-shaped spatial distribution pattern (Figure 3). The high-quality levels are mainly located in the core and core edge areas (the solid circle in Figure 3). With Dapuqiao Street in Huangpu District, Jiangsu Road in Changning District, and Fenglin Street in Xuhui District as the core, it then expands to the periphery, forming an approximately elliptical high-quality agglomeration area. The contiguous medium-low-quality and low-quality areas are concentrated in the north, west, and south (the dotted circle in Figure 3), forming six quality-depression areas. In the north, the center is composed of Chenjia Town in Chongming District, Luodian Town or Gucun Town in Baoshan District, and Anting Town in Jiading District. In the west, Jiuting Town, Sijing Town, and Dongjing Town in Songjiang District are the core. In the south, Caojing Town in Jinshan District, Qingshan Town in Fengxian District, and Huinan Town in Pudong are the core.
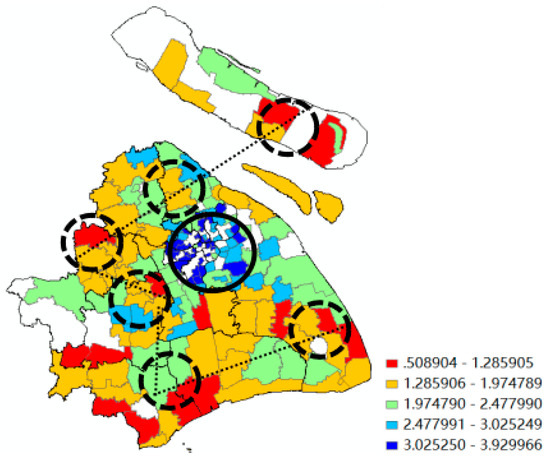 Figure 3. The spatial pattern of PHSQ.
 - From the perspective of overall trends (Figure 4), the city has formed a “core-periphery” pattern, with a high center and low periphery that gradually decreases from the center to the outside. The east is better than the west, the north higher than the south, and the difference in the north–south direction is notably greater than the difference in the east–west direction. The three low-quality depressions in the north can be regarded as the connection points that form a low-quality central axis, running from the northeast to the southwest. In the west, Songjiang is the core and its quality decreases in the two directions of northwest and southwest, respectively, while the south is linked by Jinshan, Fengxian, and Chongming Districts to form a low-quality central axis with an east–west trend.
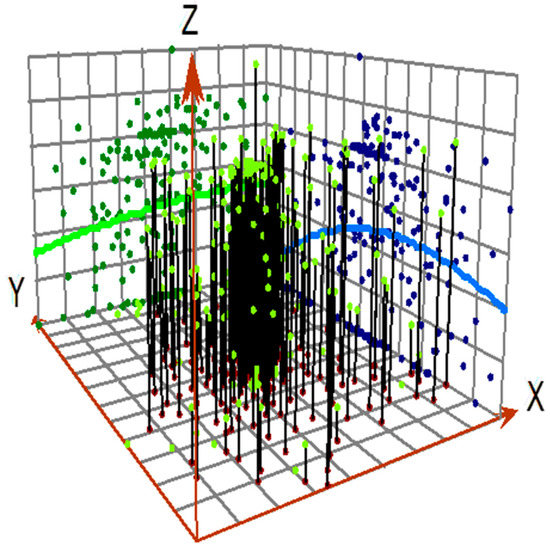 Figure 4. The overall trend of PHSQ.
 - The spatial pattern of PHSQ is marked by obvious economic development and an urban development layout. The current low-quality agglomeration areas can be roughly divided into three categories. The first is the migrant-population concentrated area, represented by Jiuting Town in Songjiang District and Luxiang Town in Jinshan District. These regions have developed manufacturing industries and densely floating populations and have strong demand for housing security and public services. The second category is the large-scale residential communities that are imported from the urban area, represented by Maqiao Town in Minhang District, Sijing Town in Songjiang District, and Huinan Town in Pudong District. These areas coincide with the spatial location of 46 large residential communities, planned by the Shanghai Housing Construction Committee, which has undertaken many urban relocation and resettlement populations. However, the speed of infrastructure construction does not match the speed of the high-density residential development and large-scale population introduction. The third category is the urban fringe areas, represented by Gangyan Town in Chongming District, Baihe Town in Qingpu, and Jinshanwei Town in Jinshan District. Most of these low-quality streets/towns have relatively lagging economic development, marginalized access to resource elements, small radial driving effects from the central city, and insufficient socioeconomic endowment; and these factors have affected the PHSQ.
4.2.2. Spatial Characteristics of Each Dimension
In the single-dimensional quality, the spatial patterns of the four dimensions are different. However, the overall trend is basically the same; that is, the quality of the core and core edge areas are higher than the outer suburbs and suburbs (Figure 5 and Figure 6).
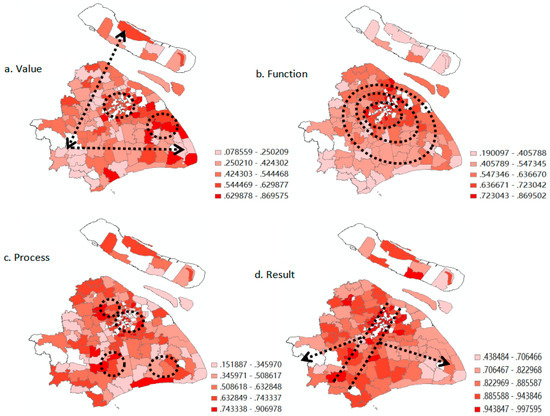
Figure 5.
The spatial difference pattern of each dimension. (a). Value; (b). Function; (c). Process; (d). Result.
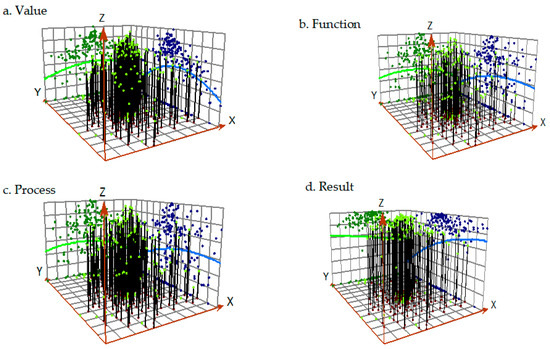
Figure 6.
Single dimensional global trend surface analysis of PHSQ. (a). Value; (b). Function; (c). Process; (d). Result.
The value dimension presents a spatial pattern of “two circles and two lines”; that is, a structure in which two high-quality agglomeration circles and two low-quality center lines coexist. Specifically, the high-quality areas within the city are mainly distributed in two agglomeration circles: one is the suburban high-quality agglomeration circle with Zhangjiang Town and Chuansha Town in Pudong District as the core, the other is the central city high-quality agglomeration circle with Caojiadu Street in Jing’an District and Wujiaochang Street in Yangpu District as the core. From the perspective of the overall trend, with Qibao Town in Minhang District as the axis, it decreases to the northeast, southwest, and southeast, respectively, forming two medium- and low-quality shafts. One is the “northeast–southeast axis”, extending from Xuxing Town in Jiading District in the north to Shanyang Town in Jinshan District, the other is the “east–west axis”, from Jiuting Town in Songjiang District in the west to Laogang Town in Pudong New District. Both sides of the lines that extend in either direction are mostly low-quality areas.
The functional dimension presents a core-periphery structure of “high center and low periphery”, which gradually decreases from the center to the periphery. Specifically, among the 28 high-quality towns/streets, the core area and core edge area accounted for 35.7% and 46.4%, respectively. Among the 24 low-quality towns/streets, 21 towns/streets are located in the outer suburbs such as Jinshan District, Chongming District, Fengxian District, and Qingpu District. Most of the medium-quality, medium-high-quality, and medium-low-quality streets/towns are embedded in the central city and outer suburbs. Combined with the global trend surface analysis, the change rate from east to west and from south to north is more coordinated. The quality decreases from the core area to the outer suburbs in the order of high-grade to medium-grade to low-grade, thus showing a relatively regular “concentric circle” of the distribution structure.
In the process dimension, the quality presents a multi-core spatial structure of “one main and three assistants”, with one main being a main high-quality center, and the three assistants being three sub-high-quality centers. Specifically, the high-quality agglomeration center is a central urban agglomeration area with a bullseye of Jiangning Street in Jing’an District and Jiangsu Street in Changning District. There are three sub-high-quality agglomeration centers, including the northern agglomeration area centered on Nanxiang Town, Jiangqiao Town, and Jiading District; the southwest agglomeration area at the core of Jiangchuan Street in Minhang District; and the southern coastal agglomeration area centered on Si Tuan Town in Pudong. Based on the global trend surface analysis, the quality of the eastern region is higher than the western region, the northern region is higher than the southern region, and the middle-quality streets/towns are distributed between high-quality clusters. The medium-low-quality and low-quality regions are mainly located at the fringe area of the city.
In the result dimension, the high-quality agglomeration areas are scattered and show a spatial pattern of “one body and two wings”. That is, one high-quality regional corridor being the mainstay with two low-quality extension lines supplementing it. Specifically, high-quality streets/towns are evenly distributed in the core area, the core edge area, the suburbs, and the outer suburbs. Chongmingbao Town in the north connects to Minhang Xinzhuang in the middle and reaches Zhujing Town in Jinshan in the south to form a number of high-quality corridors in the northeast–southwest direction. Low-quality agglomeration areas are mainly distributed in two areas: one core is at Xinbang Town in the west, and the other core is at Situan Town in the southeast. The combination of the two cores forms low-quality depressions. Considering the global trend surface analysis, the north is more balanced while the south is more varied. The quality index decreases along the two directions of center–west and center–southeast, forming a low-quality distribution extension line.
5. Formation Mechanism of PHSQ
In the early stage, the motivation mechanism impacting the effective supply of public housing services was dominated by government fiscal determinism [61]. With a deepening understanding of the essential attributes of public housing services, pluralism was widely accepted by most scholars, and academic circles have generally recognized that public housing services are the result of the joint actions of the government, citizens, and social organizations [62,63]. Based on previous studies and the above evaluation of the results, we summarize the key driving forces that affect PHSQ as: the foundation supporting capacity, resource agglomeration capacity, government control capacity, market driving capacity, and social promotion capacity.
The foundation supporting capacity mainly refers to the current status of urban development and the level of economic development. The maturity of urban development planning is the foundation that affects the quality of housing security. In areas with mature urbanization, public service facilities are more complete and of higher quality. In areas with a higher level of economic development, local governments have more funds to provide public housing services for low-income groups.
Resource agglomeration capacity mainly refers to the total amount and opportunities of available public resources. Increased traffic network density helps to speed up the flow of production factors, enhance the convenience of regional life, and improve the quality of living space [64].
Government regulatory capacity mainly refers to the government’s behavior and role in housing security. The local government is responsible for both the formulation and implementation of public housing policies and the cooperation between regions. The behavioral logic of the local government has become an internal influence, affecting the provision of public housing services [65].
Market driving capacity mainly refers to the development of the urban housing market. With the boosting of capital and power, the trend of urban space financialization has become increasingly prominent. The cost for low-income groups to obtain housing resources through commercial channels continues to increase, and high housing prices have spawned numerous housing difficulties for groups that urgently need public supply [66]. The scale and complexity of the supply of public housing service are increasing.
Social promotion capacity mainly refers to the duty of performance by both the neighborhood committee and public discourse. Neighborhood committees are not only a community’s statutory autonomous organization but are also a tool and foothold for the state to extend its functions to the grassroots level. Neighborhood committees play an important role in qualification checks, housing allocation, and compensation negotiations. The performance of the residents’ committee is directly related to the residents’ satisfaction and government trust perception. In recent years, the upsurge of a rights protection movement that is centered on housing property rights has forced the government to provide better services. The public’s attitude and behavioral tendency toward public housing services have also become important variables affecting the quality of public housing services. Based on the above theoretical connotations, we selected 10 representative factors to further diagnose the dominant factors affecting PHSQ via geographic detectors (see Table 6).
Table 6.
Diagnostic factors and descriptions of PHSQ.
5.1. Factor Detection of PHSQ
According to the geodetector module method, we calculated the q-value which reflects each factors’ ability to affect PHSQ. The q-values of the detection results were all less than 0.05, which shows that each index significantly affected PHSQ. To clearly show the differences of the factors affecting PHSQ, the q-values of each factor were sorted. The sorting result was represented by the decision degree (DD), and the value of DD was 1–10. The larger the DD, the lower the influence of the detection factor on PHSQ. The rankings of the relevant results are shown in Figure 7.
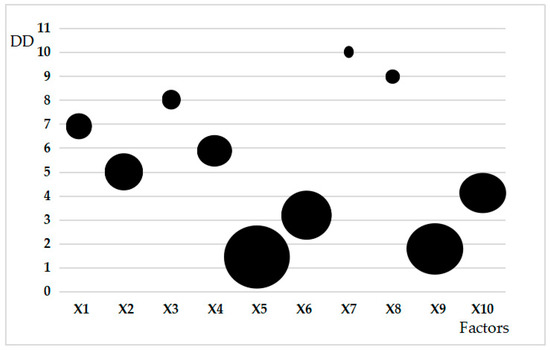
Figure 7.
Detection factor determination.
Figure 7 shows that two types of indicators (including X5, X6, X9, and X10) of government regulation and social support are the leading factors affecting PHSQ. From the perspective of specific factors, the ratio of housing security fiscal expenditure to total fiscal expenditure (0.248) ranks first. This shows that local government actions have played a key role in the formation of PHSQ. The distortion of policy implementation, deviation of policy function, and quality of policy effects all originate from the formulation and implementation of policies. The value connotation and target positioning of the government’s housing security policy determine the guarantee object and level of service resource enjoyment, affecting the fairness and welfare of PHSQ. In the supply process, government supervision and management of housing resource allocation and market order are closely related to the responsibility and responsiveness of PHSQ. Simultaneously, with the successive completion of large-scale affordable housing construction, the importance of community management and living services has become increasingly prominent. Whether the neighborhood committee can maintain a balance between autonomy and administration, and realize the accurate transmission of residents’ needs and opinions, is directly related to the satisfaction of the survival and development needs of public housing services.
In comparison, among the foundation support capacity, the maturity of urban planning development has greater impact, which reflects the close relationship between the urban built environment and PHSQ. The urban built environment in the central city is relatively mature and the public service facilities are relatively complete, thus there is no doubt that the PHSQ is relatively high. In the resource agglomeration capacity, the accessibility of public transportation has a greater impact. This implies that the construction of social housing must not only be integrated in the new development zone but also with urban traffic arteries, rail transits, and bus hubs. Traffic location orientation is an important direction from which to improve the quality of public housing services. Within the market driving capacity, development of the housing market has a greater impact, which highlights the unique role of establishing both a sound basic housing system and a long-term mechanism for the stable and healthy development of the real estate market to improve PHSQ.
5.2. Detection of PHSQ Interaction Factors
We conducted a pairwise interactive detection of 10 factors that drove the quality of public housing services. The results show that the interaction between different impact factors has an enhanced relationship, mainly manifested as nonlinear enhancement and dual-factor enhancement (Table 7). From the results of the interaction coefficient, the interaction between public discourse expression (X10) and government attention (X5) has the most significant impact on the PHSQ. This shows that whether the government’s attitude and behavioral tendency in implementing housing security policies can be combined with the real demands of the guarantee object will have a decisive impact on PHSQ. Moreover, the interactive influence between public discourse expression and the level of economic development, intergovernmental cooperation, and housing market development is also significant. This shows that improving PHSQ does not stop at the investment of public financial resources. It is more important to establish a supply mechanism that matches the individual needs of the public more closely. Simultaneously, the interaction between land development status and various indicators is relatively stable, with all indicators above 0.5, which shows that the input of land resources and other tangible element resources in the formation of PHSQ still cannot be underestimated. Improving PHSQ has significant spatial dependence. The spatial layout of affordable housing communities determines the opportunities and costs of obtaining public resources, which are closely related to the success or failure of residential housing welfare and even the policy of affordable housing. Therefore, the establishment of a land resource supply mechanism, that is mutually suitable for the development of urban land space, is particularly important for improving PHSQ.
Table 7.
Interactive detection results of each factor.
6. Conclusions and Discussion
This study developed a holistic conceptual model of PHSQ and established an evaluation index system. It attempted to go beyond the limitations of traditional performance evaluations, satisfaction surveys, and social-space effect evaluations to highlight the roles of the public’s sense of acquisition and public value in the supply of public housing services. The main conclusions are as follows.
The supply of public housing services is different from the physical entity supply of affordable housing, as the output of public housing services includes both tangible products and intangible services in the supply process. Public housing services are not only a dynamic provision process but also a static provision result. Inherent characteristics exist in the process and results of public housing service provision. Public housing services are not commodity services, but a quasi-public product provided by the government. The inherent characteristics include not only the general attributes of commodity services but also public characteristics. As a constantly changing process, PHSQ can be defined as a basic public service provided by the government to solve the housing needs of low-income groups, and is the degree to which the inherent characteristics of the process and results of the provision can meet relevant regulations and social public requirements, manifested as the degree and level of this inherent characteristic. Specifically, PHSQ is composed of nine attributes (fairness, welfare, survivability, development, responsibility, participation, responsiveness, accessibility, and satisfaction) in four dimensions.
The quality of public housing services in Shanghai has the following two distinctive features: (1) the overall quality level is still dominated by middle- and low-levels, the central urban area has become a high-quality cluster, the suburban area is generally low in quality, and the high-quality streets/towns have obvious orientations toward administrative centers. The quality level of each dimension is also different. (2) In terms of spatial characteristics, a single high-quality center and multiple low-quality centers coexist. The circle structure of “one high and many lows”, forms an approximate M-shaped spatial distribution pattern. In different streets/towns, PHSQ has distinct spatial agglomeration, and the weak links in different regions are also different. Therefore, the government should abandon the “one size fits all” management model in the supply of public housing services and establish a pertinent and differentiated quality improvement mechanism that is based on differences in spatial regions and dimensions. The government’s next step should focus on strengthening precise policy implementation and precise guarantees and achieving coordinated development between different spatial regions and dimensions.
The quality of public housing services is the result of the combined effect of foundation supporting capacity, government control capacity, resource agglomeration capacity, market driving capacity, and social promotion capacity. The role of social promotion capacity is more significant, and the interaction between neighborhood committees’ implementation functions, public discourse expression, and various indicators has been significantly enhanced. This highlights the important role of demand-side factors in affecting the quality of public housing services. Regarding the power of discourse expression, public discourse has had a revolutionary impact on public service supply by government departments in the Internet age. The public’s political attitudes and service preferences are influencing ubiquitous online public opinion formation through new media. Maintaining stability is an important political goal for local governments. The mismatch between supply and demand caused by the obstruction of public demand expression and the rupture of information transmission has caused a “bottom cycle” of PHSQ. Therefore, the improvement of PHSQ needs to go beyond the inertia of overemphasizing supply-side reforms and should pay attention and respond to demand-side factors, such as public discourse, in a timely manner. Good education can be a better way for a person to express their needs and promote the awakening of rights protection awareness. The government needs to improve the overall education level of low-income groups and establish inclusive and shared institutional channels so that they may express, dare to express, want to express, and express well. In China, the neighborhood committee is a statutory autonomous organization of residents, and an important channel for residents to express their demands and safeguard their interests. Simultaneously, neighborhood committees are also an extension of the state’s power at the grassroots level, undertaking a myriad of administrative tasks. This also means that neighborhood committees can get closer to local governments and obtain public resources from the government. Therefore, neighborhood committees and other formal organizations should strengthen the precise information transmission of low-income groups, balance autonomy and administration, remove the concept of pure autonomy to complete de-administration, and make full use of administrative resources to increase the degree of public demand in organizations and realize the normalization and long-term effect of improving PHSQ.
Compared to the methods of satisfaction surveys, performance measurements, and social-space effect measurements, the introduction of the PHSQ concept can better highlight the government’s rational pursuit of public value and return to the basic functions of housing. PHSQ has the following three distinct characteristics. (1) The fusion of subjective and objective; the degree of meeting the requirements of relevant regulations can be called its objective quality, and the degree of meeting the requirements of the public can be called its subjective quality. (2) The combination of process and result. Public housing services are not just a single physical entity of affordable housing, but also include all aspects of service supply. From the perspective of regulating the operation of power, the quality of public housing services includes relevant standards that should be met during the supply process, and corresponding social benefits that should be obtained at the service supply point. (3) The unity of instrumental rationality and value rationality. Housing security is an output of government public resources and a process of using public power to allocate public funds. Therefore, it has the value attribute of maintaining fairness and justice and protecting the public interest. As a quantifiable and predictable management tool, the purpose of the PHSQ measure is to improve the quality level and provide an objective reference for improving government work. Therefore, PHSQ provides a new perspective for us to evaluate the supply of housing security services more scientifically. However, it also has certain shortcomings. PHSQ includes four dimensions and nine attributes. Each dimension has great meaning, and the meaning of its attributes is even broader. Therefore, the selection of indicators is often not representative enough to reflect the true meaning behind these grand concepts. At the same time, this measurement requires data of different spatial scales, which makes data acquisition more difficult. With the use of big data and the development of user content production models, in the future, this holistic conceptual model can be used as the basis to explore more scientific and accurate measurement methods to evaluate the supply of public housing services quality.
Author Contributions
This paper was researched and compiled by two authors with the following responsibilities: Conceptualization, Y.W.; methodology, C.R.W.; software, C.R.W.; validation, Y.W., C.R.W.; formal analysis, C.R.W.; investigation, Y.W., C.R.W.; resources, C.R.W.; data curation, C.R.W.; writing—original draft preparation, C.R.W.; writing—review and editing, Y.W., C.R.W.; visualization, C.R.W.; supervision, Y.W. All authors have read and agreed to the published version of the manuscript.
Funding
This research was funded by the Shanghai Development and Reform Commission in Shanghai, China.
Institutional Review Board Statement
Not applicable.
Informed Consent Statement
Not applicable.
Data Availability Statement
The data presented in this study are available on request from the author. The data are not publicly available due to privacy.
Acknowledgments
The research team seek to acknowledge the support of Shanghai Municipal Commission of Housing and Urban-rural Development, grant number (2019-1-24-2).
Conflicts of Interest
The authors declare no conflict of interest.
References
- Kemeny, J. Housing and Social Theory; Routledge: London, UK, 2015; Volume 5, pp. 133–142. [Google Scholar]
- Glaeser, E.L.; Saks, G.R.E. Urban growth and housing supply. J. Econ. Geogr. 2005, 6, 71–89. [Google Scholar] [CrossRef]
- Li, D.; Chen, Y.; Chen, H.; Guo, K.; Hui, C.M.; Yang, J. Assessing the integrated sustainability of a public rental housing project from the perspective of complex eco-system. Habitat Int. 2016, 53, 546–555. [Google Scholar]
- Wu, G.; Duan, K.; Zuo, J.; Zhao, X.; Tang, D. Integrated sustainability assessment of public rental housing community based on a hybrid method of AHP-Entropy weigh and cloud model. Sustainability 2017, 9, 603. [Google Scholar]
- Galdini, R.; Lucciarini, S. Social innovation and environmental sustainability in social housing policies: Learning from two experimental case studies in Italy. In Different Strategies of Housing Design; Intech Open Limited: London, UK, 2019; Volume 2, pp. 105–121. [Google Scholar]
- Wu, F.; Liu, Y.; Zeng, Y. Evaluation of the human settlement environment of public housing community: A case study of Guangzhou. Sustainability 2020, 12, 7361. [Google Scholar] [CrossRef]
- Zeng, W.; Rees, P.; Xiang, L. Do residents of affordable housing communities in China suffer from relative accessibility deprivation? A case study of Nanjing. Cities 2019, 90, 141–156. [Google Scholar] [CrossRef]
- Andrews, R.; Steven, V.D.W. New public management and citizens′ perceptions of local service efficiency, responsiveness, equity, and effectiveness. Public Manag. Rev. 2013, 15, 762–783. [Google Scholar] [CrossRef]
- Gregg, G.; Van, R.; Douglas, M.; Stephen, I. Drivers and consequences of citizen satisfaction:an Application of the American Customer Satisfaction Index Model to New York City. Public Admini Rev. 2010, 3, 331–341. [Google Scholar]
- Heinrich, C.J. Outcomes-based performance management in the public sector: Implications for government accountability and effectiveness. Public Adm. Rev. 2002, 62, 712–725. [Google Scholar] [CrossRef]
- Wong, C. Indicators of Urban and Regional Planning: The Interplay of Policy and Methods; Routledge: London, UK, 2006; Volume 6, pp. 67–81. [Google Scholar]
- Shworth, R.E.; Boyne, G.A.; Entwistle, T. Public Service Improvement: Theories and Evidence; Oxford University Press: Oxford, UK, 2010; Volume 4, pp. 45–68. [Google Scholar]
- Wu, B.; Sun, H. Government performance evaluation research in housing security policy implementation in China. J. Ocean. Univ. China (Soc. Sci.) 2013, 4, 70–76. (In Chinese) [Google Scholar]
- Yuhong, P.; Yuanjun, X.; Weijun, M. An optimal public rental housing (PRH) distribution model based on DEA of the ideal decision-making unit. Urban. Stud. 2011, 8, 34–56. (In Chinese) [Google Scholar]
- Esruq-Labin, A.M.J.; Che-Ani, A.I.; Tawil, N.M. Criteria for affordable housing performance measurement: A review. E3S Web Conf. 2014, 3, 01003. [Google Scholar] [CrossRef]
- Chen, J.; Nong, H. The nonlinear and heterogeneous crowding-out effect of public housing: Empirical evidence from Chinese provincial panel data. Stat. Res. 2016, 33, 27–35. [Google Scholar]
- Li, M.; Zhou, Y. Measurement and empirical research on the social welfare effect of social housing construction. J. Zhongnan Univ. Econ. Law 2012, 5, 29–42. [Google Scholar]
- Xiao, Y.; Miao, S.; Sarkar, C. Do neighborhood ties matter for residents’ mental health in affordable housing: Evidence from Guangzhou, China. Cities 2020, 100, 1–4. [Google Scholar] [CrossRef]
- McCormick, N.J.; Joseph, M.L.; Chaskin, R.J. The new stigma of relocated public housing residents: Challenges to social identity in mixed-income developments. City Community 2012, 11, 285–308. [Google Scholar] [CrossRef]
- Varady, D.P.; Matos, F. Comparing public housing revitalization in a liberal and a Mediterranean society (US vs. Portugal). Cities 2017, 64, 37–46. [Google Scholar] [CrossRef]
- Chaskin, R.J.; Joseph, M.L. Integrating the Inner City: The Promise and the Perils of Mixed-Income Public Housing Transformation; University of Chicago Press: Chicago, IL, USA, 2015; Volume 7, pp. 47–51. [Google Scholar]
- Allen, R.; Goetz, E.G. Nativity, ethnicity, and residential relocation: The experience of Hmong refugees and African Americans displaced from public housing. J. Urban Aff. 2010, 32, 321–344. [Google Scholar] [CrossRef]
- Chen, J. Spatial mismatch evolution study of Tianjin public housing based on commuter perspective. Chin. Popul. Res. Environ. 2016, 26, 409–412. (In Chinese) [Google Scholar]
- Mohan, J.; Twigg, L. Sense of place, quality of life and local socioeconomic context: Evidence from the survey of English housing. Urban Stud. 2007, 44, 2029–2045. [Google Scholar] [CrossRef]
- Bouckaert, G.; Van, W.S. Comparing measures of citizen trust and user satisfaction as indicators of “good governance”. Int. Rev. Adm. Sci. 2003, 69, 329–343. [Google Scholar]
- Aernouts, N.; Ryckewaert, M. Reconceptualizing the “publicness” of public housing: The case of Brussels. Soc. Incl. 2015, 3, 56–61. [Google Scholar] [CrossRef]
- Rutgers, M.R. As good as it gets? On the meaning of public value in the study of policy and management. Am. Rev. Public Adm. 2015, 45, 29–45. [Google Scholar] [CrossRef]
- Jorgensen, T.B.; Bozeman, B. Public values: An inventory. Adm. Sci. 2007, 39, 354–381. [Google Scholar] [CrossRef]
- Schachter, H.L. Objective and subjective performance measures: A note on terminology. Adm. Soc. 2010, 42, 550–567. [Google Scholar] [CrossRef]
- James, O. Evaluating the expectations disconfirmation and expectations anchoring approaches to citizen satisfaction with local public services. J. Public Adm. Res. Theory 2009, 19, 107–123. [Google Scholar] [CrossRef]
- Van de Walle, S.; Van Ryzin, G.G. The order of questions in a survey on citizen satisfaction with public services: Lessons from a split-ballot experiment. Public Adm. 2011, 89, 1436–1450. [Google Scholar] [CrossRef]
- James, O. Performance measures and democracy: Information effect on citizens in field and laboratory experiments. J. Public Adm. Res. Theory 2011, 3, 399–418. [Google Scholar] [CrossRef]
- Ma, L.; Yang, Y. How does public participation in government performance evaluation affect citizen satisfaction? Evidence from Chinese prefectural-level cities. Adm. Trib. 2019, 26, 86–94. [Google Scholar]
- Swindell, D.; Kelly, J.M. Linking citizen satisfaction to performance measures: A preliminary evaluation. Pub. Perform. Manag. Rev. 2000, 24, 30–52. [Google Scholar] [CrossRef]
- Weizhen, C. Spatial effect and social influence of public space planning. Archit. J. 2004, 30, 34–42. [Google Scholar]
- Gowan, M.; Seymou, J. Service quality in a public agency: Same expectations but different perceptions by employees, managers, and customers. J. Qual. Manag. 2001, 6, 275–291. [Google Scholar] [CrossRef]
- Bouckaert, G. Conditions for introducing quality in public administration: Some elements of measurement and control. Natl. Cent. Public Adm. Athens 2010, 5, 46–71. [Google Scholar]
- Real-Estate Research Center of Speedbank. Correlation of the Price of Housing Units and Expected Economic Profit by Rebuilding; Real-estate Research Center Report: Texas, TX, USA, 2003. [Google Scholar]
- Kim, S.S.; Yang, I.H.; Yeo, M.S. Development of a housing performance evaluation model for multi-family residential buildings in Korea. Build. Env. 2005, 40, 1103–1116. [Google Scholar] [CrossRef]
- Ma, Z.; Li, C.; Zhang, J. Affordable housing brings about socio-spatial exclusion in Changchun, China: Explanation in various economic motivations of local governments. Habitat Int. 2018, 76, 40–47. [Google Scholar] [CrossRef]
- Skelcher, C. Improving the quality of local public services. Serv. Ind. J. 1992, 12, 463–477. [Google Scholar] [CrossRef]
- Rhee, S.K.; Rha, J.Y. Public service quality and customer satisfaction: Exploring the attributes of service quality in the public sector. Serv. Ind. J. 2009, 13, 1121–1123. [Google Scholar] [CrossRef]
- Xie, X. Basic public service quality: Multidimensional construction and stratified evaluation. J. Shanghai Adm. Inst. 2018, 19, 14–26. [Google Scholar]
- Oliver, R.L. Cognitive, affective, and attribute bases of the satisfaction response. J. Consum. Res. 1993, 20, 418–430. [Google Scholar] [CrossRef]
- Shin, H.B. Residential redevelopment and the entrepreneurial local state: The implications of Beijing’s shifting emphasis on urban redevelopment policies. Urban. Stud. 2009, 46, 2815–2839. [Google Scholar] [CrossRef]
- Shi, W.; Chen, J.; Wang, H. Affordable housing policy in China: New developments and new challenges. Habitat Int. 2016, 54, 224–233. [Google Scholar] [CrossRef]
- Rigolon, A. Green gentrification or “just green enough”: Do park location, size, and function affect whether a place gentrifies or not? Urban. Stud. 2020, 57, 402–420. [Google Scholar] [CrossRef]
- Available online: https://shanghai.anjuke.com/sale/ (accessed on 16 July 2020).
- Available online: https://sh.lianjia.com/46 (accessed on 17 July 2020).
- Galster, G.C.; Metzger, K.; Waite, R. Neighborhood opportunity structures and immigrants’ socio-economic advancement. J. Hous. Res. 1999, 10, 95–127. [Google Scholar] [CrossRef]
- Cheng, Z.; Wang, H. Do neighborhoods have effects on wages? A study of migrant workers in urban China. Habitat Int. 2013, 38, 222–231. [Google Scholar] [CrossRef]
- García, J.; Montolio, D.; María Raya, J. Local public expenditure and housing price. Urban. Stud. 2013, 47, 1501–1512. [Google Scholar] [CrossRef]
- Wang, Z.; Zhang, F.; Wu, F. Intergroup neighboring in urban China: Implications for the social integration of migrants. Urban. Stud. 2016, 53, 651–668. [Google Scholar] [CrossRef]
- Available online: https://www.haodf.com/ (accessed on 19 July 2020).
- Yang, Z.; Yi, C.; Zhang, W. Affordability of housing and accessibility of public services: Evaluation of housing programs in Beijing. J. Hous. Built Environ. 2014, 29, 521–540. [Google Scholar] [CrossRef]
- Available online: https://www.hujiang.com/46 (accessed on 18 July 2020).
- Levine, J.C. Rethinking accessibility and jobs-housing balance. J. Am. Plan. Assoc. 1998, 64, 133–149. [Google Scholar] [CrossRef]
- Available online: http://962121.fgj.sh.gov.cn/wyweb/web/front/index.jsp (accessed on 10 July 2020).
- Seng, M.P. Comment on Martin D. Abravanel’s public knowledge of fair housing law: Does it protect against housing discrimination? Hous. Pol. Debate 2002, 12, 334–354. [Google Scholar] [CrossRef]
- Wang, J.; Xu, C. Geodetector: Principle and prospective. Acta Geogr. Sin. 2017, 72, 116–134. [Google Scholar]
- Wijburg, G.; Aalbers, M.B. The alternative financialization of the German housing market. Hous. Stud. 2017, 32, 11–22. [Google Scholar] [CrossRef]
- Cleary, S. Funding community initiatives: The role of NGOs and their community organizations in improving housing and living conditions in the third world. Habitat Int. 1994, 18, 154–155. [Google Scholar] [CrossRef]
- McIntyre Hall, L.; Hula, R. Resident Initiatives in Public Housing. Hous. Soc. 1997, 11, 75–92. [Google Scholar] [CrossRef]
- Zhu, P.; Yu, T.; Chen, Z. High-speed rail and urban decentralization in China. Transp. Res. Rec. 2015, 15, 16–26. [Google Scholar] [CrossRef]
- Wynne, L.; Rogers, D. Emplaced displacement and public housing redevelopment: From physical displacement to social, cultural, and economic replacement. Hous. Pol. Debate 2020, 1, 1–16. [Google Scholar]
- Fields, D. Contesting the financialization of urban space: Community organizations and the struggle to preserve affordable rental housing in New York City. J. Urban Aff. 2015, 37, 334–356. [Google Scholar] [CrossRef]


Publisher’s Note: MDPI stays neutral with regard to jurisdictional claims in published maps and institutional affiliations. |
© 2021 by the authors. Licensee MDPI, Basel, Switzerland. This article is an open access article distributed under the terms and conditions of the Creative Commons Attribution (CC BY) license (http://creativecommons.org/licenses/by/4.0/).