Article

The Innovative Model of Runway Sustainable Management on Smaller Regional Airports

1
Faculty of Civil Engineering, Transportation Engineering and Architecture, University of Maribor, Smetanova 17, 2000 Maribor, Slovenia
2
Ministry of the Environment and Spatial Planning, Dunajska Cesta 48, 1000 Ljubljana, Slovenia
*
Author to whom correspondence should be addressed.
Sustainability 2021, 13(2), 652; https://doi.org/10.3390/su13020652
Submission received: 29 November 2020 / Revised: 3 January 2021 / Accepted: 6 January 2021 / Published: 12 January 2021
(This article belongs to the Special Issue Sustainability in Pavement Design and Pavement Management)

Abstract

:
Airport runways are exposed to large traffic loads and other external factors which cause their transformation. Monitoring the state of the unevenness and determining the runway defectiveness is a complex procedure which includes fast and qualitative measurements of the execution of flatness, their evaluation and the determination of the level of runway defectiveness. For this purpose, an improved process of determining airport runway defectiveness is proposed, based on geodetic survey and the management information system prototype, which enables evaluating the results of the executed survey and suggesting the runway maintenance measures. A similar analysis of the considered data on the example of a smaller, regional airport in Maribor, Slovenia, was performed with the help of our own algorithm, which, on various platforms, enables the tabular and graphical display of surface irregularities. The algorithm prototype allows the automated monitoring and evaluating of the unevenness or runway states, determining their defectiveness and advising adequate action. With the help of the suggested method and developed information system prototypes, it is possible to confirm the demand for professionally adequate and on-time planning of necessary maintenance works, with which it is surely possible to prevent an eventual unexpected closing of the runway and related costs. The suggested method is also usable in evaluating the state of other traffic infrastructure.

1. Introduction

Logistics systems, including those regarding airport infrastructure, in most cases, function effectively and successfully only if all of the corresponding elements function effectively and successfully. In their research [1,2], note that improper and insufficient logistics infrastructure is the second most important factor affecting logistics. In [3], the authors suggest a guidance model in the case of accidents or disorders which limit the function of logistics (including those regarding airport) infrastructure. The extraction of such data is generally linked to automated procedures, and the demand for their promptness, exactness and availability at any time encourages the development of systems which allow automated extraction and processing in real time [4,5,6].
Aircraft traffic has a significant role in the global economy [7]. The authors of [8] point out that improving airport infrastructure can reduce air traffic costs by up to 15%.
Traffic safety is key in aircraft traffic. Most international organizations work to provide traffic safety in aircraft traffic. Everybody is aware that a high level of safety provision in aviation means a safe and uninterrupted occurrence of aircraft traffic. Due to this, it is necessary to unify, as much as possible, all the procedures which are related to providing traffic safety and establish the generally well-established procedures (methodology). Considering the need to design a global safety plan, the International Civil Aviation Organisation (ICAO) proposed that the following groups of events cause the highest risks to disorder development in aircraft traffic [7,9]:
  • events on the area intended for aeroplane landing and take-off, and in their surroundings;
  • events related to loss of control over the aircraft while flying;
  • events while flying in the take-off or landing phase.
The present article considers in detail the first group of events, which can occur on the runway and in its surroundings. Among others, in this group belong the following events with a high level of risk to develop disorders and which are directly connected with the stage (status) of runways flatness:
  • unusual contact with the runway when landing—rough landing (hereinafter: ARC);
  • the trip from the runway (hereinafter: RE);
  • loss of control over the aircraft on the runway or taxiway (hereinafter: LOC-G) and
  • collision with the obstacles when aircraft take-off or landing (hereinafter: CTOL).
RE events present the biggest part of plane crashes and often surpass 25% of all plane crashes in commercial flights [7,9,10,11]. Deformations on the runway pavement surface obstruct pilots’ aircraft management and cause onboard vibrations, which makes it difficult to correctly read the measure instruments, cause mechanical defects on the aircraft and diminish the contact of the tire with the floor, which affects the correct action of the braking system. Most difficulties present dents and the production of aquaplaning [12].
Therefore, the safe occurrence of aircraft traffic is, to a great extent, connected with providing safety on the runway and its surroundings [13,14,15,16,17]. In order for these disorders to be limited and diminished to the greatest extent possible, the runways must also be in the best possible state (adequately maintained). Runways must provide adequate load capacity, good surface friction and a smooth aircraft run. All of these demands depend on adequate runway maintenance. Well maintained runways are very important for safe aircraft take-off and landing [18].

2. Related Works

2.1. Monitoring the Runways’ Conditions

Detection of runways‘ unevenness and determining their shape, dimensions and the causes of why these occur is a complex process which demands an interdisciplinary approach [19]. The interdisciplinary approach to problem solving is used in many modern scientific types of research, since it is necessary to research the exposed issue from a number of aspects. Recently, automated extraction and spatial data processing on roadway and runway unevenness are the subjects of many types of research [20,21,22,23,24,25,26]. The authors, in research, mainly focus on interpretation, pavement surface and runway analysis and the development of algorithms for automated recognition or extraction of unevenness (cracks, holes etc.) from the recordings, determining the dimensions of the unevenness (width and depth) and their classification [27,28,29]. The use of geodetic methods in determining the vertical deviations and detecting deformations on runway surfaces and predicting the occurrence of new deformations is not yet sufficiently researched and not many research pieces on this topic can be found in the open literature [30].

2.2. Management Information Systems

Airports are large, complex, dynamic systems which are constantly under the influences of internal and external participants. This demands the effective management of all processes which are necessary for uninterrupted airport function. The authors of [31,32,33,34,35] researched the use and prevalence of some information systems which are used at airports in the United States of America on the aerial and terrestrial parts of the airport. They note, in the research, that there are many types of information systems which are management support. The airports‘ equipment with them is very different and, to the greatest extent possible, it depends on the airport purpose and size [36]. In the 1990s, the Airport Association Council International showed the need to establish information systems intended for management maintenance; the authors of [37] also note that the establishment of such information systems is key for effective maintenance.
In the present work, we discuss the maintenance area, we focused in detail on logistics infrastructure maintenance the runway maintenance and the development of the process decision-making model, which will support basic maintenance process and direct participants in the maintenance process, and will also be used as management support for decision-making regarding the airport infrastructure maintenance area, mostly in runway maintenance. Infrastructure conditions data are a critical part of such models, which are extracted with measurements in the field [38,39]; in addition, the selection of the process decision-making models must be based on qualitative data the on the state of the infrastructure. Due to this fact, we focus in detail on the process decision-making model development in order to determine the deformations of the runways; we integrated it into the process decision-making maintenance model. This was necessary to establish Airport Pavement Management System (APMS). In the development of the APMS, we considered the demand that it mostly needs to be useful on smaller airports:by its extent, as well as the loading, and that it allows collecting, storing and maintenance of more types of measurement data and analysis performances.
APMS and PMS are built from six basic building blocks [40]: inventory of infrastructure characteristics (construction data, traffic data and infrastructure state data), the assessment of the infrastructure state (for prediction the future states, alternatives, decision making), the database (overview the results, executed and planned activities), the data analysis (choosing the optimal alternative), the results preparation (reports) and the feedback.
For logistics transport systems management, the decision-makers have computer-supported decision-making systems called Traffic Management Systems (TMS). Due to the requirement of airport specificity, the Air Transportation System (ATS) have developed parallelly. For adequate and timely road maintenance, the decision-makers use various technical and economic analyses when creating the maintenance strategies which are implemented in the Pavement Management System (PMS). Due to the airport specificity, the APMS is also used for the need to create adequate maintenance strategies. These include the procedures which are of help when evaluating and searching for adequate maintenance strategies. APMS is used by many airports around the world [41,42].
PMS and APMS development are subjects of many types of research [43,44,45,46]. The downside of the development of APMS is that it is intended mostly for larger and frequently used airports, but not for smaller or less frequently used airports, e.g., the Maribor Edvard Rusjan Airport, which is mostly intended for emergency flights, the performance of exhibition, training and school flights. In all described systems, there is not a system for automated unevenness detection on the runways and their evaluation. On the runways, instances of unevenness can appear in the shape of a lift of the runway, cracks or other dents, and all of these can affect safe landing or take-off of lighter aeroplanes. The biggest problem that can occur is aquaplaning risks. The authors conduicted the automated detection of the dents with the help of a point laser displacement sensor and accelerometer. They concluded that the biggest issues are in the accuracy of detecting the damage location in the dependence of certain measure time intervals. The runways unevenness is the biggest extent impact that increases the possibilities of suspension damage, the malfunction of sensitive devices, uneven contact with the floor, cargo damage or even aeroplane damage.

2.3. Contribution

The research works in the field of identifying different methods and methodologies for measuring unevenness at the airport runways have shown that the suggested method has not yet been used or carried out. Furthermore, in runway maintenance, special attention is given to larger, more burdened (also richer) airports which can implement larger financial inputs into management information systems, which are of course available in the market. Automated systems for evaluation of runway state at smaller regional airports are not detected. This is why the contribution of this article is provided with:
  • a changed (adjusted) method for execution of the measurements of unevenness on regional airports and
  • an adjusted, sustainably inclined information system for airport infrastructure management on smaller regional airports.

3. Methods and Materials

The methodology to establish an automated system for monitoring and evaluating runway unevenness was composed of the following steps:
  • a critical analysis of valid demands for evaluating the runways’ unevenness;an adapted method for measuring the runway’s state;
  • the analysis of (geodetic) methods;
  • the production of the adapted method suggestion;
  • the test of suggested method:
the execution of the measurements;
the recalculation and results evaluation.
  • an adapted information system for airport logistics infrastructure management:
  • the analysis of the possibility to upgrade existing information systems;
  • the suggestion and upgrade execution;
  • the test in a real environment.
Substantively, the research was executed in terms of a PhD thesis at the Faculty of Logistics, the University of Maribor, and the fieldwork was executed at the Maribor Edvard Rusjan Airport, Slovenia. The airport is a public international airport with the reference code 4D and is, in terms of volume of turnover, among the smaller public airports. The runway is 2500 m long, 45 m wide and has a load capacity PCN 86/F/A/X/T. The measurements of the unevenness on the Maribor Edvard Rusjan Airport runway were executed in agreement with the airport management.
The runway´s state was found out with the help of a geodetic survey. For this purpose, the vehicle with built-in geodetic sensors with which the state of runways was found out, was made. The key geodetic equipment was a robotized total station RTS Leica Nova TS50. With it, the moving towing vehicle on which the 360° prism was installed, was observed. RTS Leica Nova TS50 has the accuracy which is complied with the ISO 17123-3 for measuring angles and is 0,5” and with ISO 17123-4 for measuring the lengths and is 0,6 mm ± 1 ppm. All measurements were executed in a unified coordinate system.
The dual-frequency base GNSS receiver Topcon Hiper Pro was installed on the towing vehicle, with which the coordinates of the driving trajectories were encompassed and measured larger vertical unevenness were noted down. The data with RTS and GNSS were encompassed with the speed of 6–10 readings per second which means that, at an individual measurement at the constant speed of 6 km/h, on average, 7800 trajectory points were measured. In terms of the research, we made three independent measurements of the unevennessstate, which were later mutually analysed and compared.
The established geodetic net presents the geometric base of measuring of the runwaystate. This is essential to consider the rules of planning geodetic nets which determine that it is necessary to control the capture and data processing, consider the corrections of measured quantities and use an appropriate balancing method [47,48].
Stabilized points of the geodetic zero net provide stability for a longer time, and with optimal execution and multiple repetitions of the measurement (Figure 1).
To provide as much accuracy as possible, three classic terrestrial dimension methods were used: triangulation (the GNSS method which allows bonding on the national spatial coordinate system D96/TM), trilateration (a precise terrestrial method), and precise levelling.
The positional net balancing was executed based on the smallest squares method, with the software package Columbus 4.6. The points position accuracy of the geodetic zero net was estimated with standard ellipses of the errors [49,50] and with global accuracy measurement [50]. When balancing the altitude net, the Earth curvature effect and systematic environment effect were considered.
GRID (see Figure 1) presents a rectangular net of points of a mutual distance of 6 m. GRID was used as the base in the benchmarking of individual dimensions with the trailer. All relative deviations of individual dimensions are determined relatively based on the GRID. The GRID dimension points were executed with a precise terrestrial method.
The running surface state measurement was executed with an assumption that the object of observation (the runway) is still. Three dimensions for three meteorological periods (low temperatures in January 2018, medium temperatures in April 2018 and high temperatures in June 2018) were executed with the described equipment. Special attention was given to the touchdown runway zone (Figure 2).
In measuring the running surface state, the object of observation was a trailer with an installed 3600 reflective prism. The movement of the trailer was concerned as a kinematic process, and the position of the trailer was executed with the GNNS method and with the terrestrial cinematic dimension method. The robotized electronic tachymeter, Leica Nova TS50, followed the movement of the trailer and noted its position with the frequency of 10 measured positions in a second. Supernumerary measurements, which provide classic balancing of geodetic observations, were executed [51].

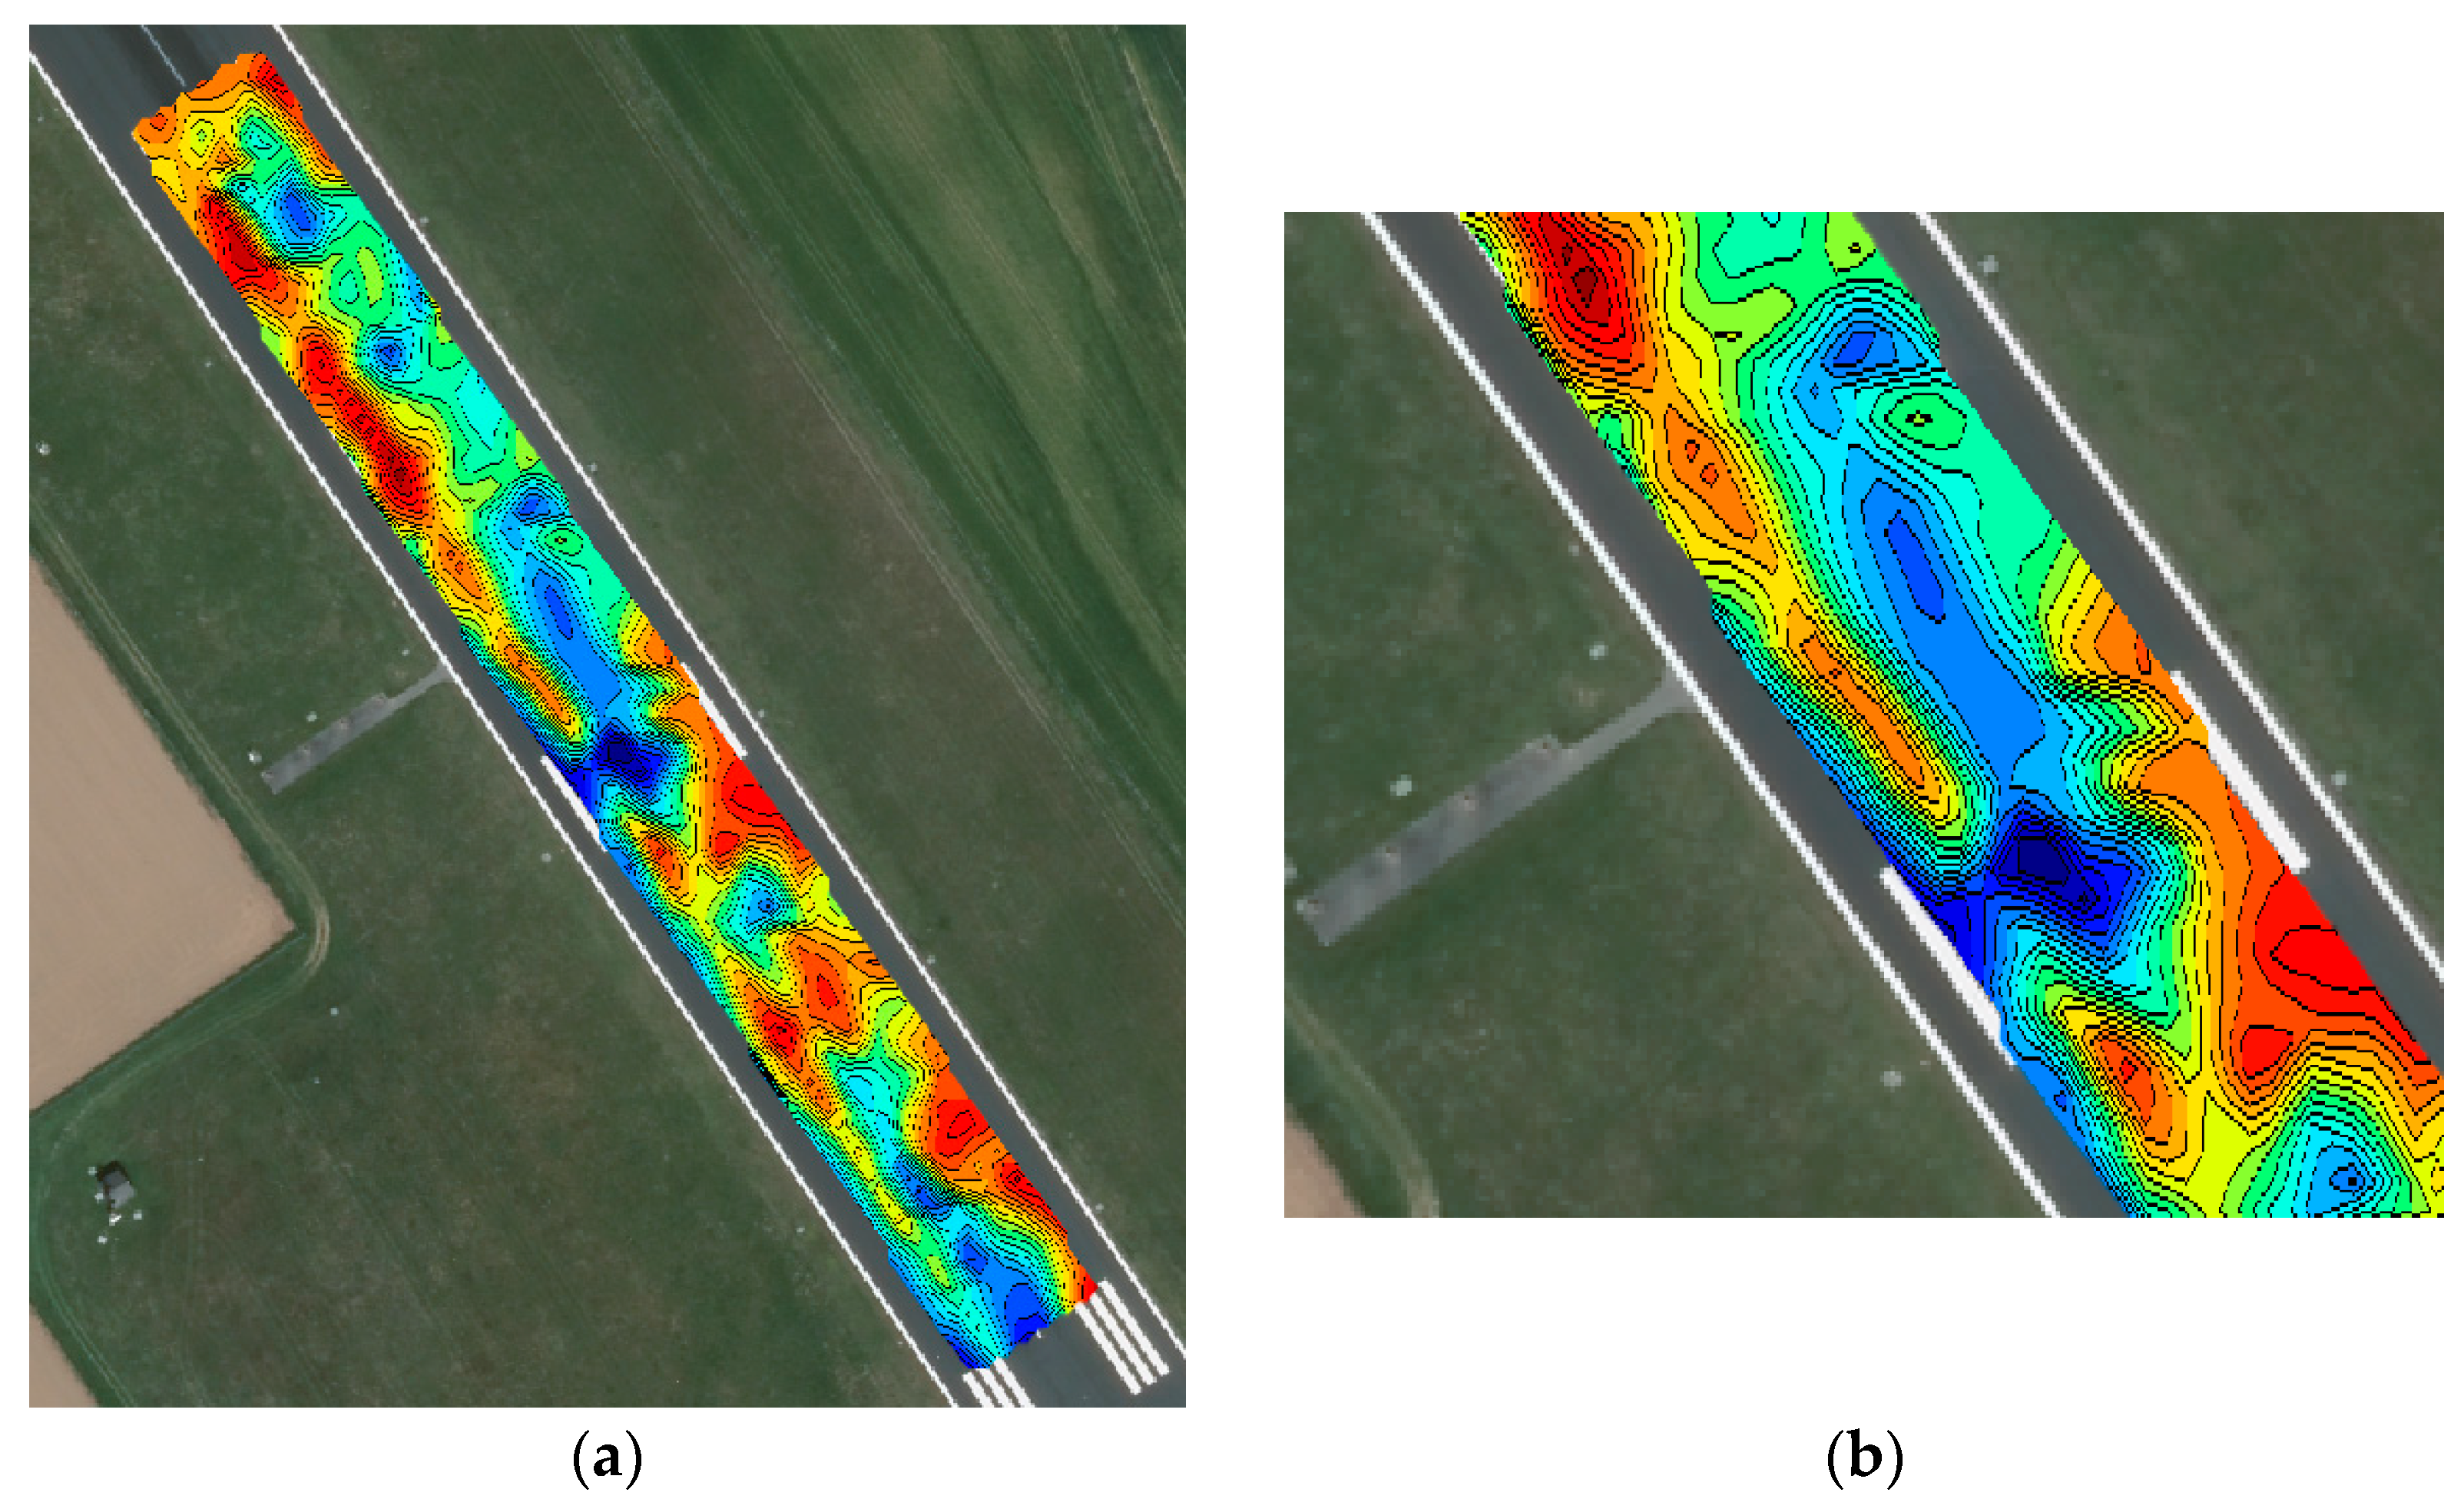
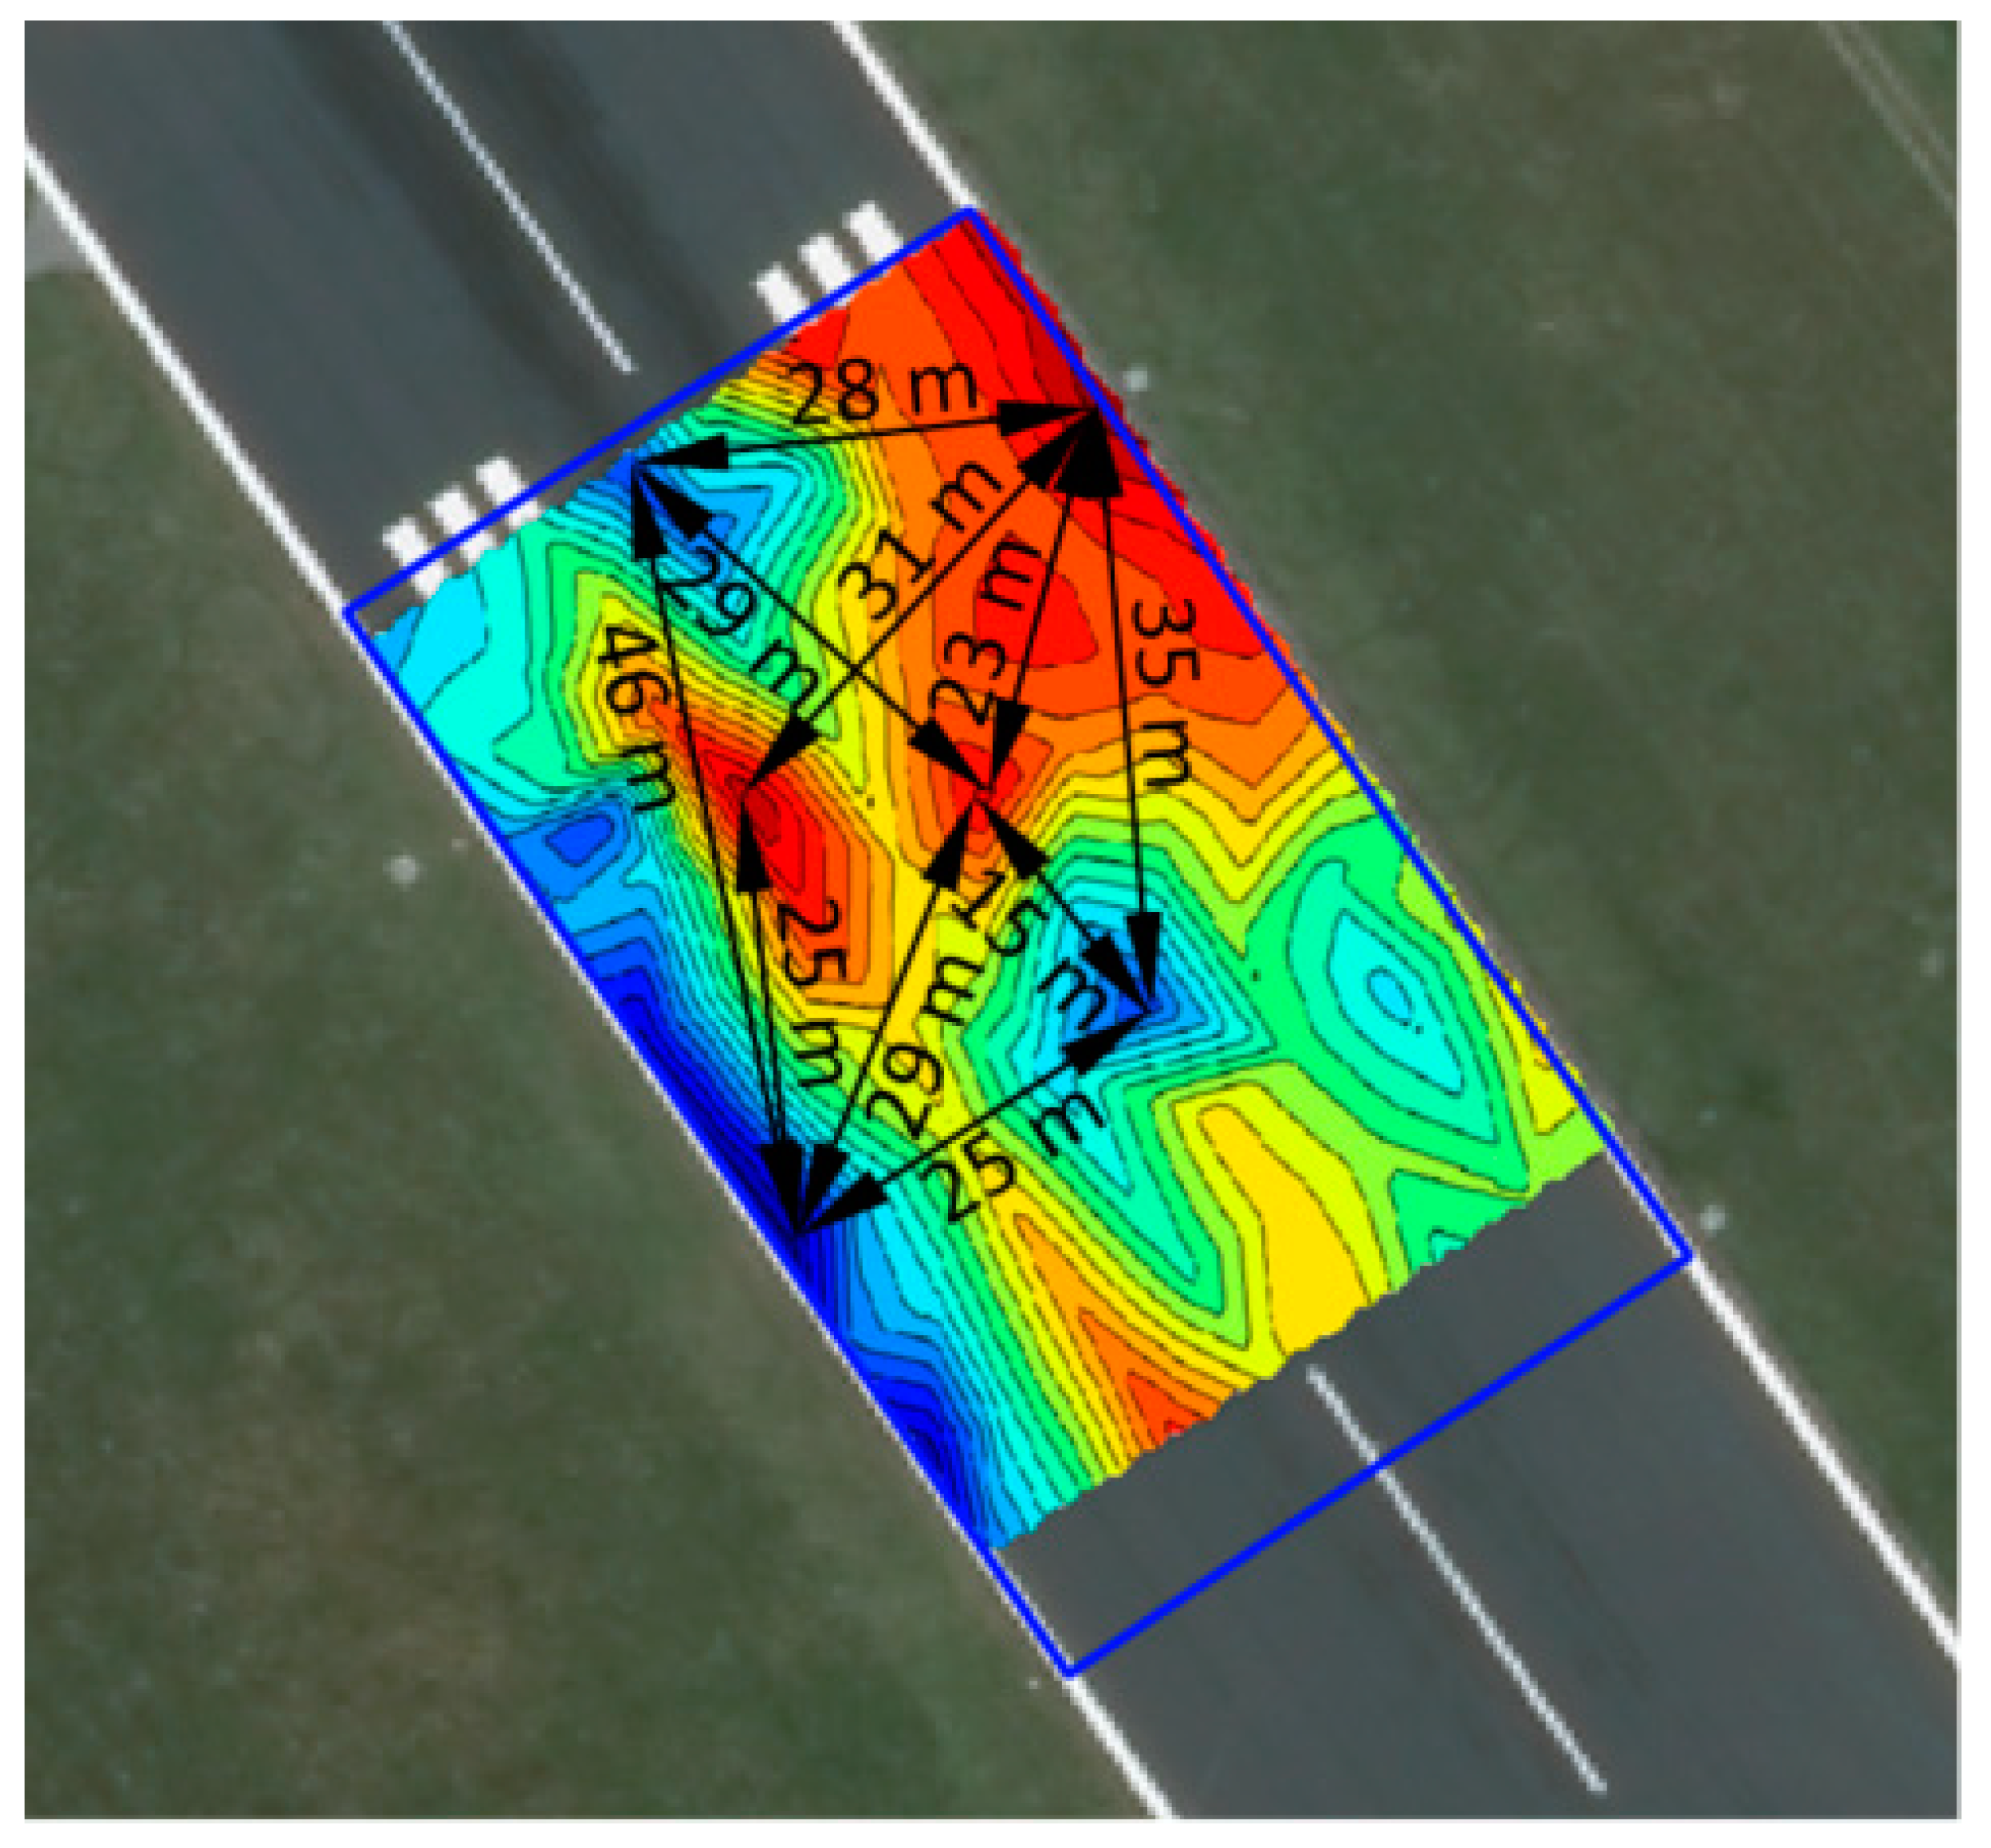
3.1. Determination of the Vertical Deviations

The direct comparison of measured points in more various time dimensions and with the condition that the points, according to the position, do not coincide, is not possible [52]. With appropriate processing of the point cloud (set of points), changes of the shape and position of the observed object can be found.
The data processing of individual dimensions was executed in the following steps and is described in more detail in [53]:
  • the calculation of the plain, measured through the points in individual time dimension: the equation of the plain through the non-coplanar points according to the Moor–Penrose inverse method;
  • the calculation of vertical deviations between individual dimensions and GRID;
  • the calculation of average vertical shift between individual dimensions.
The calculated values are shown in Table 2.
The algorithm for calculation of vertical deviations and graphical presentation of the calculation results was made in the software package MATLAB R2019b. The software LetMB.m is intended for the calculation of the regression plains and vertical deviations and graphical display of results. The algorithm is executed in two steps [52,53]:
  • In the first step, with the use of pseudoinverse matrix or Moor–Penrose matrix inverse for each time dimension, the parameters of regression plains—and in, hereinafter, vertical deviations of these regression plains from the GRID—are calculated,
  • In the second step, individual time dimensions are mutually compared and vertical shifts of regression plains between individual time dimensions are calculated.
At the execution of the measurements in the real environment, it is sensible to use at least two independent measuring methods [54]. As a supplementary method, the established geomechanics method was used: Falling Weight Deflectometer (FWD) (Figure 3). With the help of this method, comparison and evaluation of the relevance of the suggested method for monitoring the state of runways were allowed [53,55].

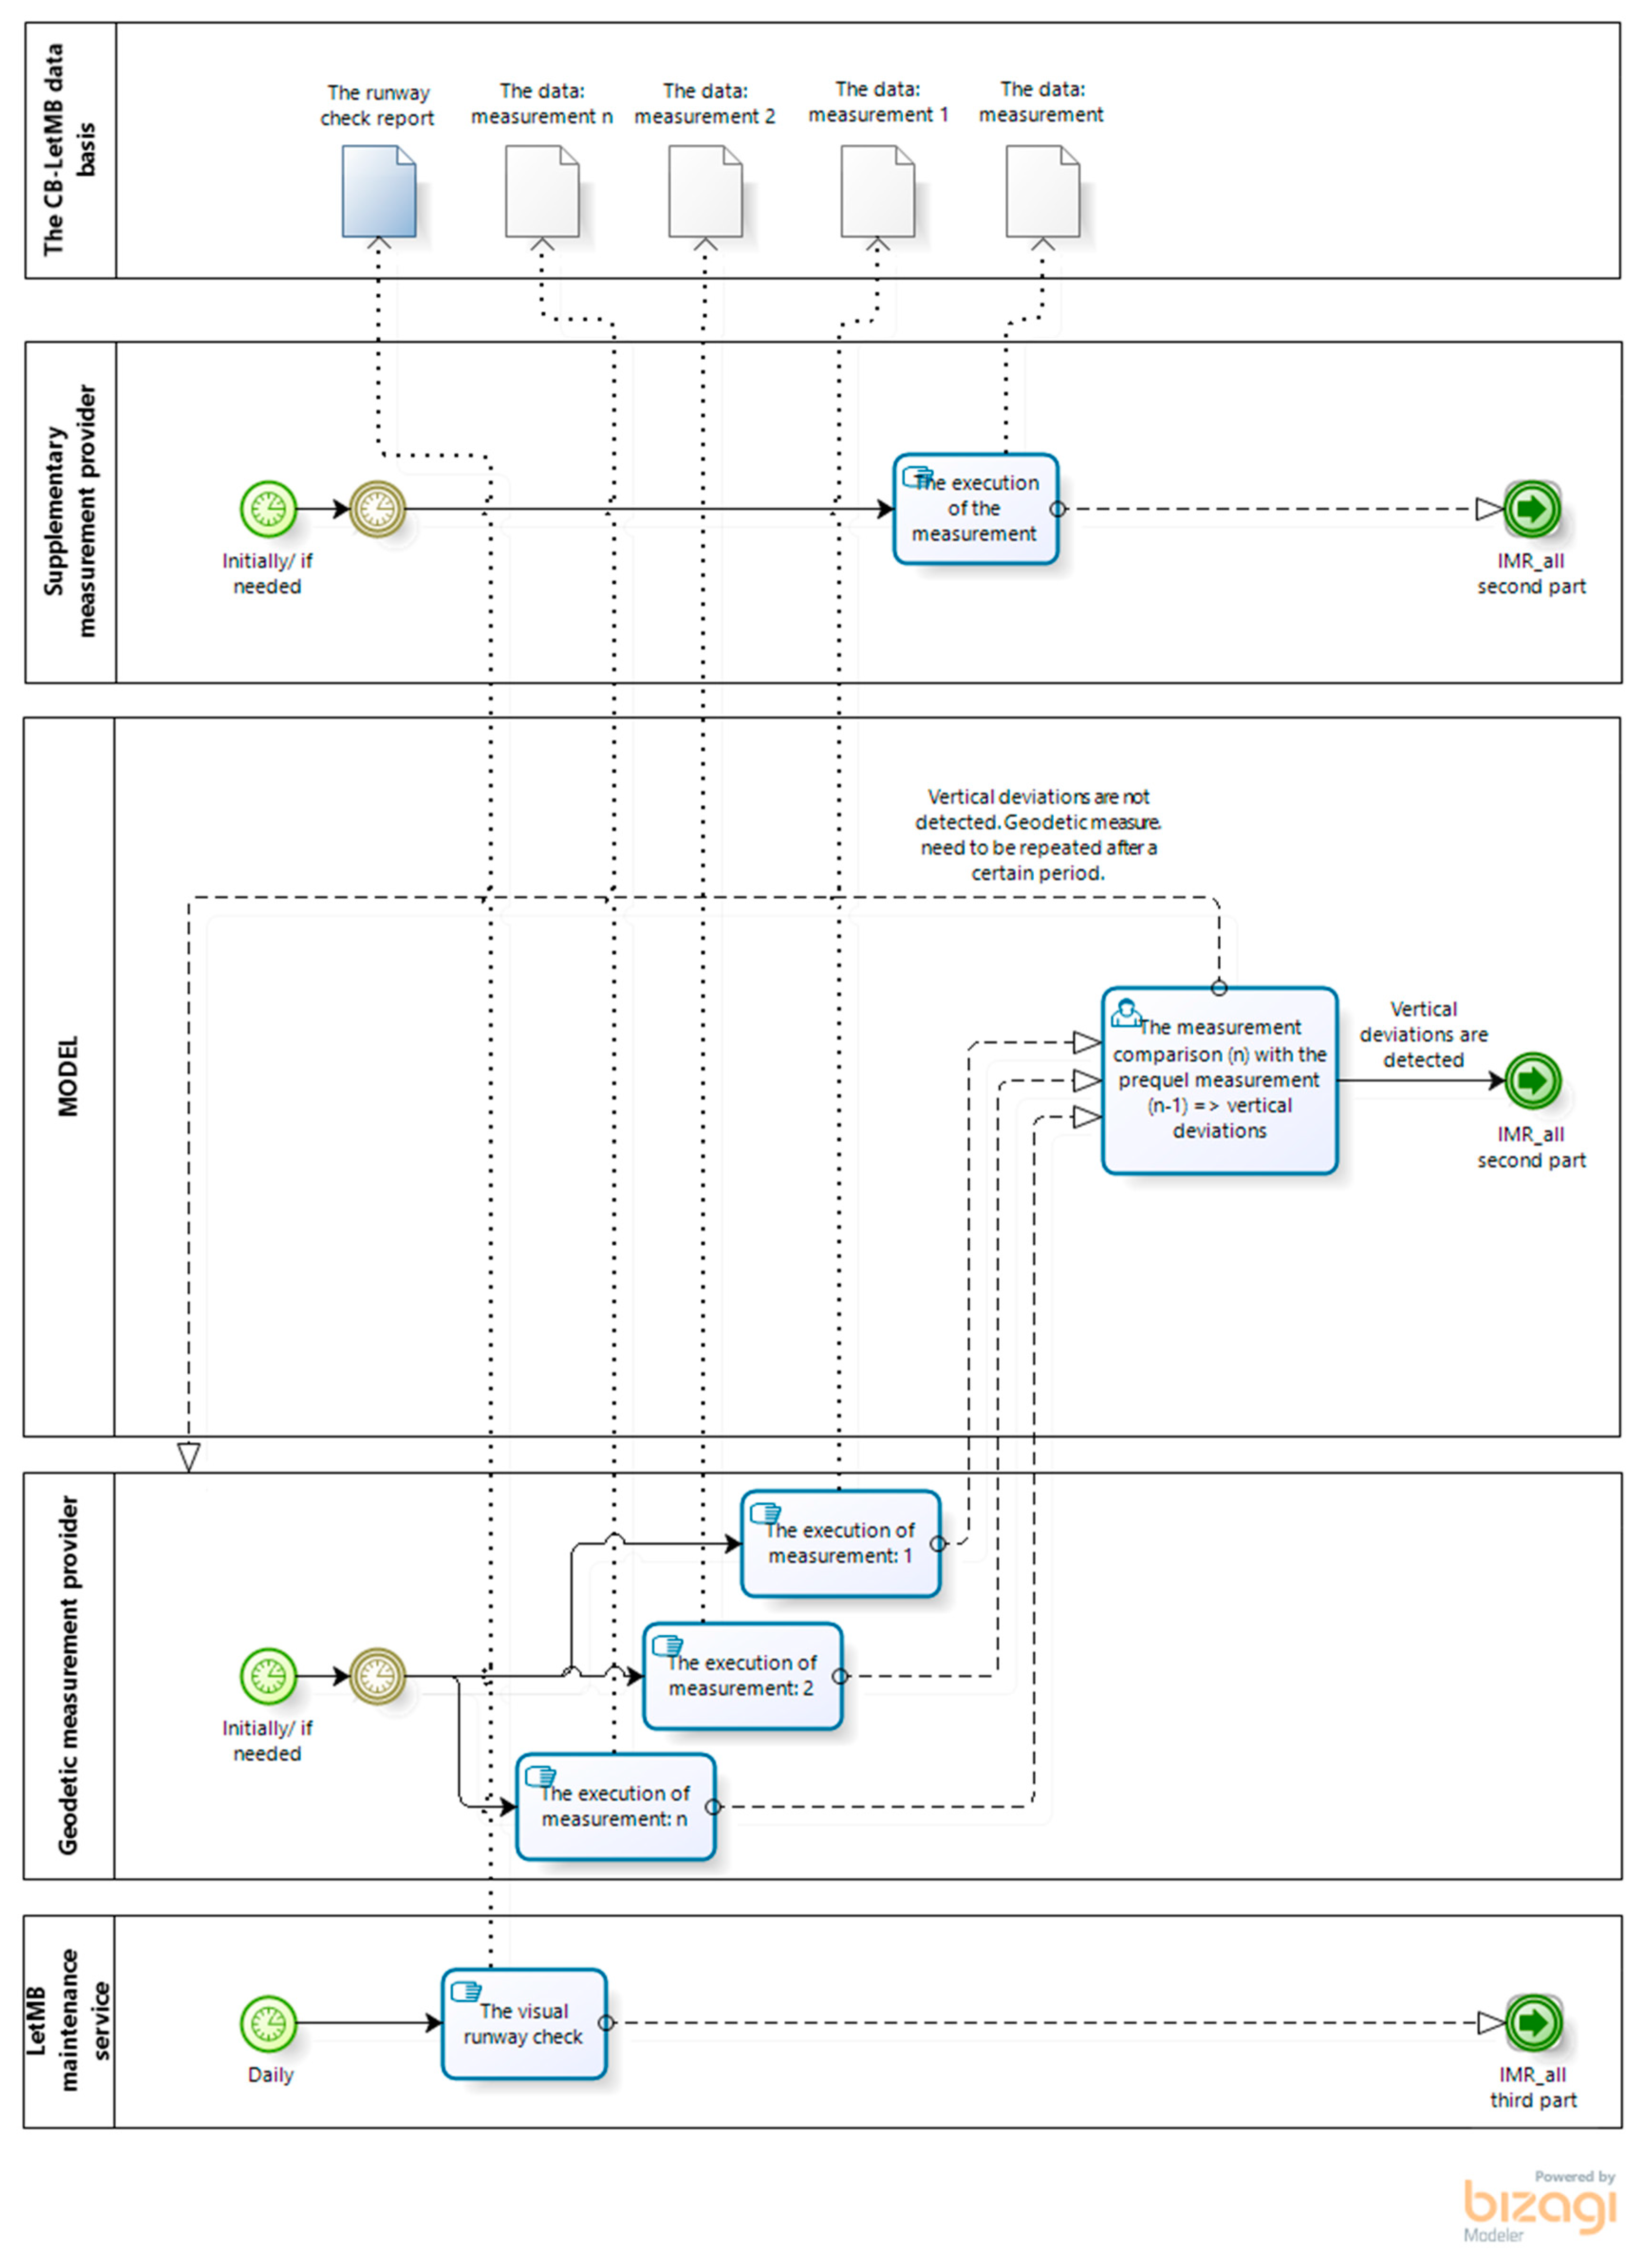
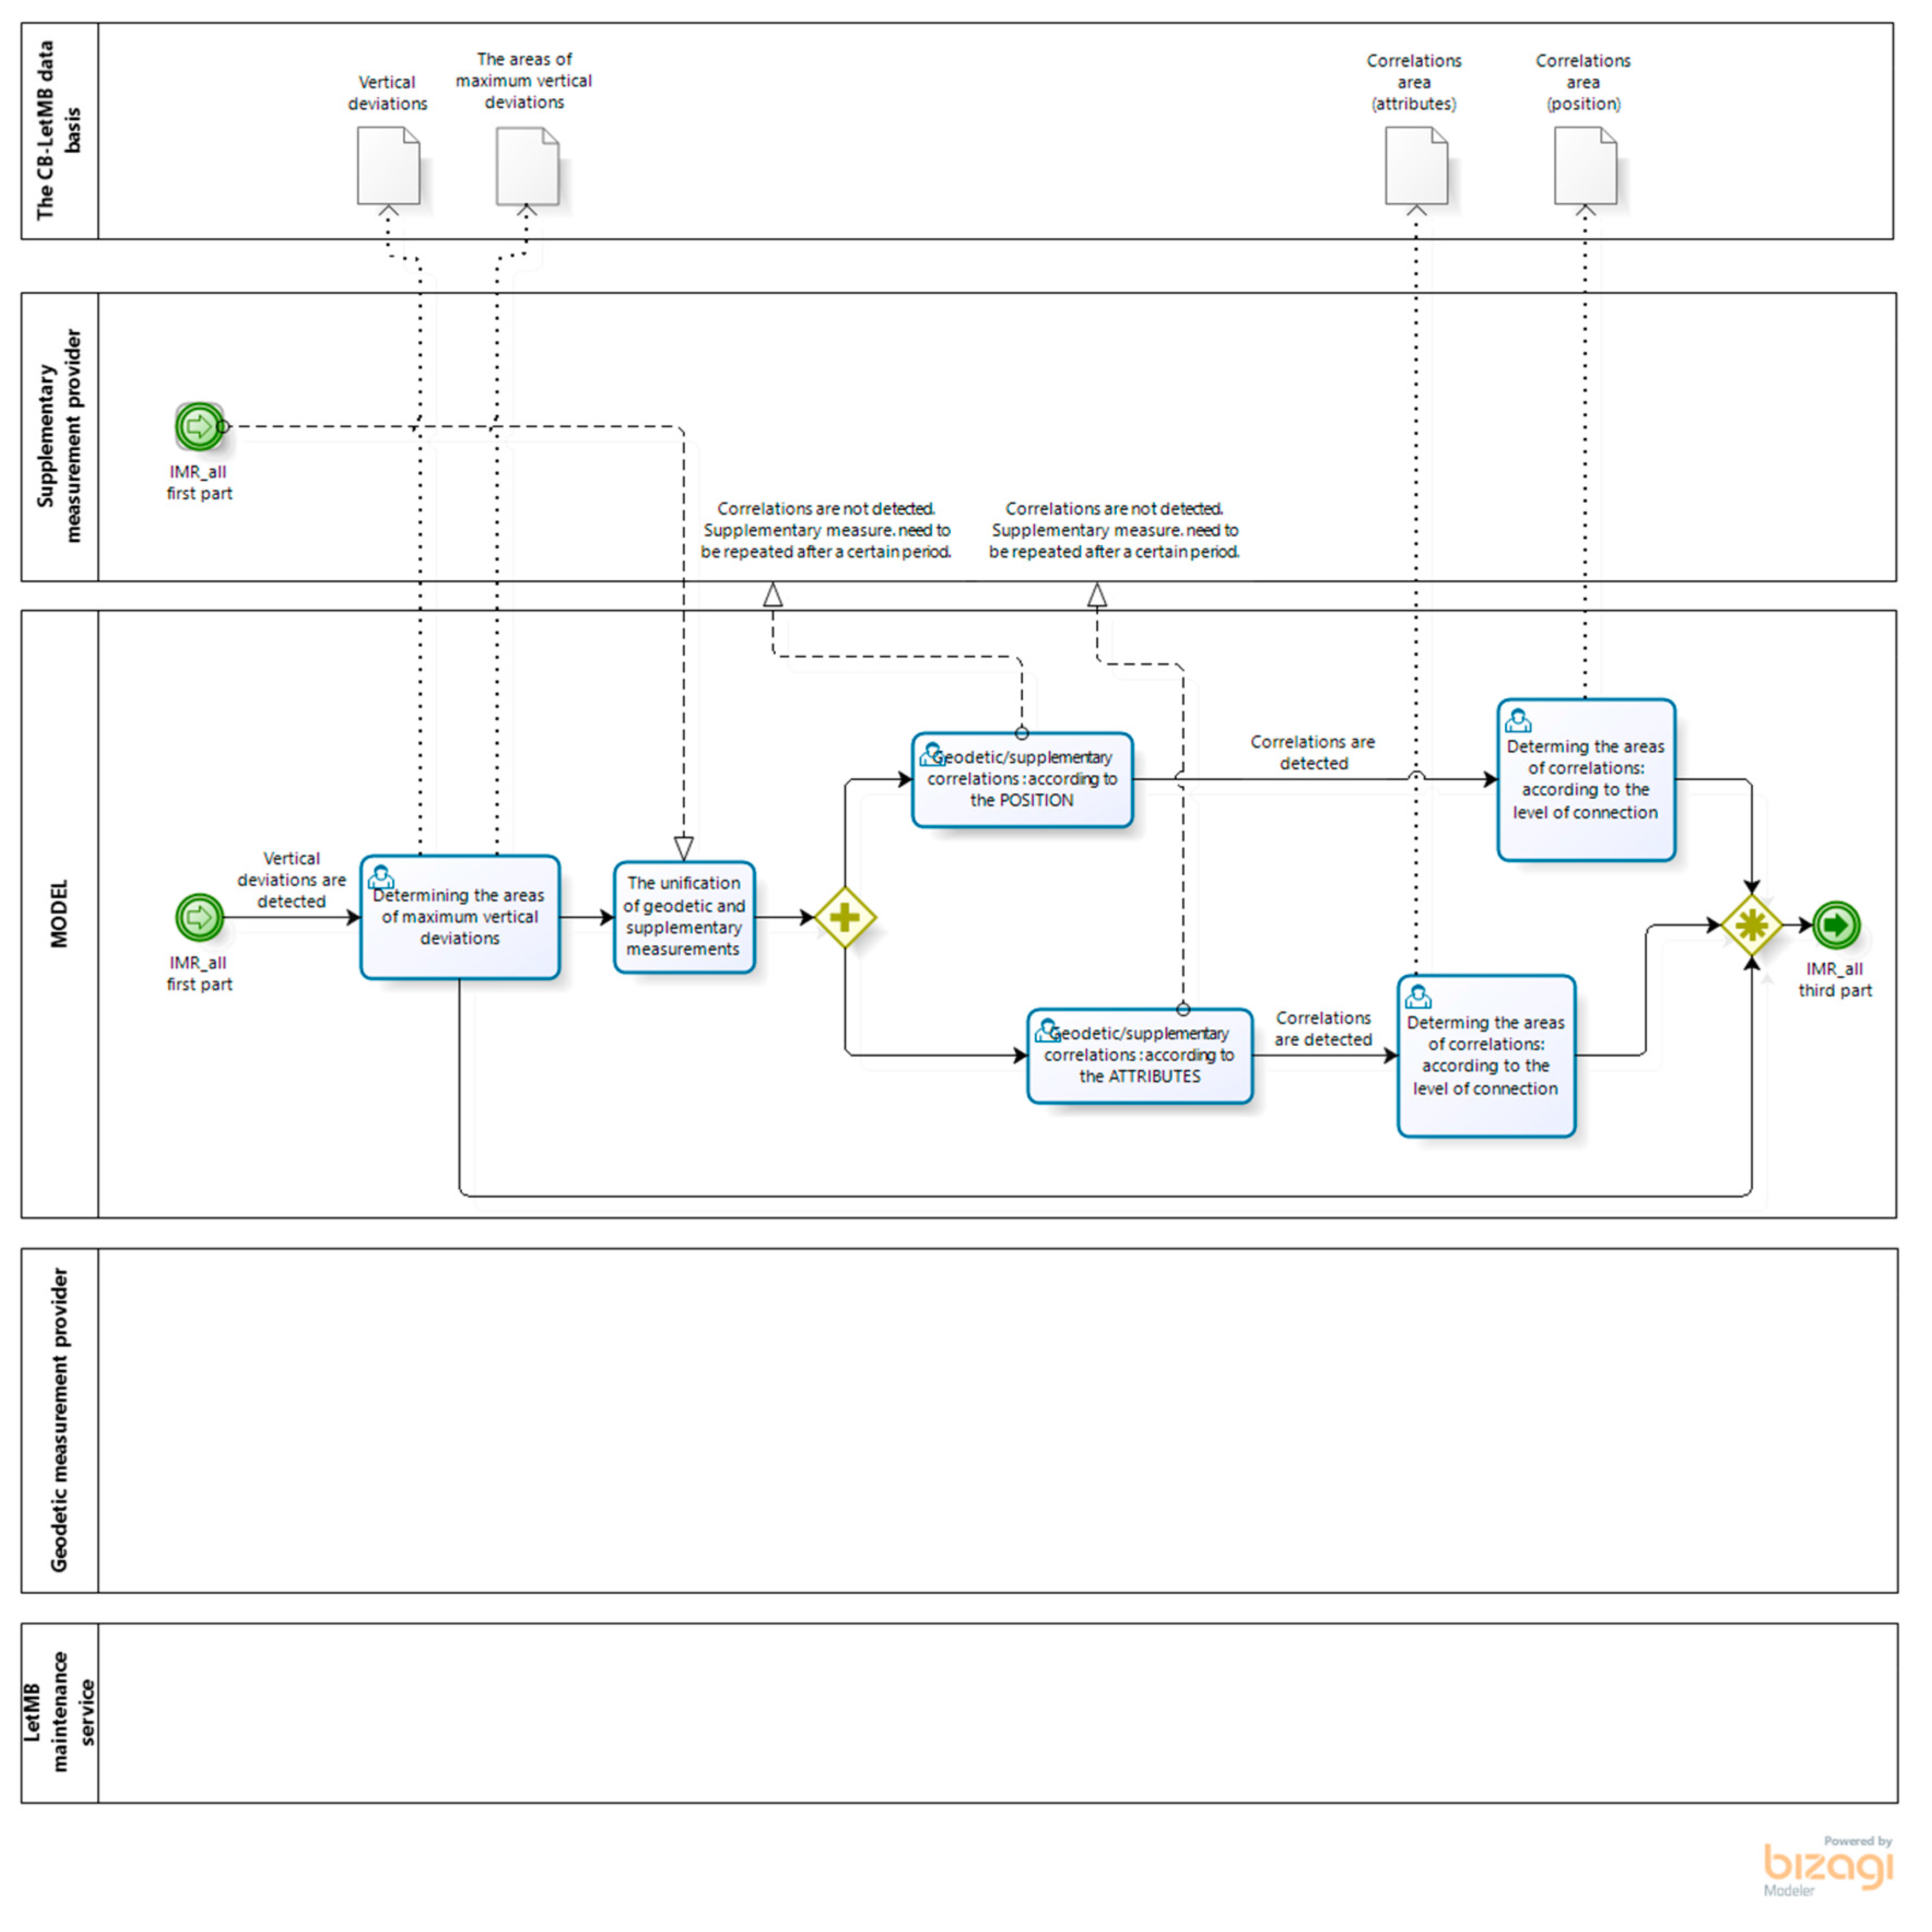
3.2. Management of Irregularities on the Airport Runway

International organizations in the area of aviation—including the European Union Aviation Safety Agency (EASA) in the documents Acceptable Means of Compliance (AMC) and Guidance Material (GM) to Authority, Organisation and Operations Requirements for Aerodromes in Certification Specifications (CS) and Guidance Material (GM) for Aerodromes Design and ICAO in the document Annex 14, among others—also prescribe the permissible presence of irregularities (dents and bulges) on runways and other surfaces intended for aircraft moving. On the surface, there must not be unevenness in the shape of bulges higher than 1.25 cm, measured with a 3 m long crossbar in any direction and dents deeper than 3 mm, measured with the 3 m long crossbar in any direction, which can be filled with water.
This demanding method is based on manual work; due to that, the method is unreliable, time-consuming and financially extensive. The key disadvantage of this method is that unevenness is not located in a unified coordinate system.
Due to the obsoleteness of the demanding but valid method, it was determined in the terms of the research that the measuring procedure, and consequently, the evaluation of the runway state (unevenness) is attempted to be automated. It was necessary to repeatedly study the strategy of evaluating the measurements results with modern measuring equipment and provide the methodology for making the adapted information system for the airport logistics infrastructure management.
The basis with which to establish the adapted information system presents the fact that the maintenance of the runway must be performed periodically, at short-term, middle-term and long-term plans, which are known in advance, with known equipment and methods, with the intention to as well as possible, with as little procedures as possible, with as little congestion as possible, and in an economically favourable way maintain the runways in the best condition. An overdue restoration of the deformations causes them to appear in the bigger extent, which consequently means that maintenance or renovation costs are bigger, and time necessary for renovation is longer [56,57,58,59]. Due to safety and economic reasons, it is necessary to constantly maintain the runways in an optimal state. The runway life expectance is approximately 20 years, but with proper and timely maintenance, this can be extenced to 40 years [59].
Extensive and prolonged renovations of the runways cause the closure or limited function of the runways, which can mean a failure in revenue from the principal activity for the airport manager. Furthermore, airline costs during the renovation forces the aircraft to ground or for an alternative location to be found, not to mention that the costs due to the delays occurred in the air traffic increase as well [60].
In developing the adapted information system for the airport logistics infrastructure management, the following assumptions were made:
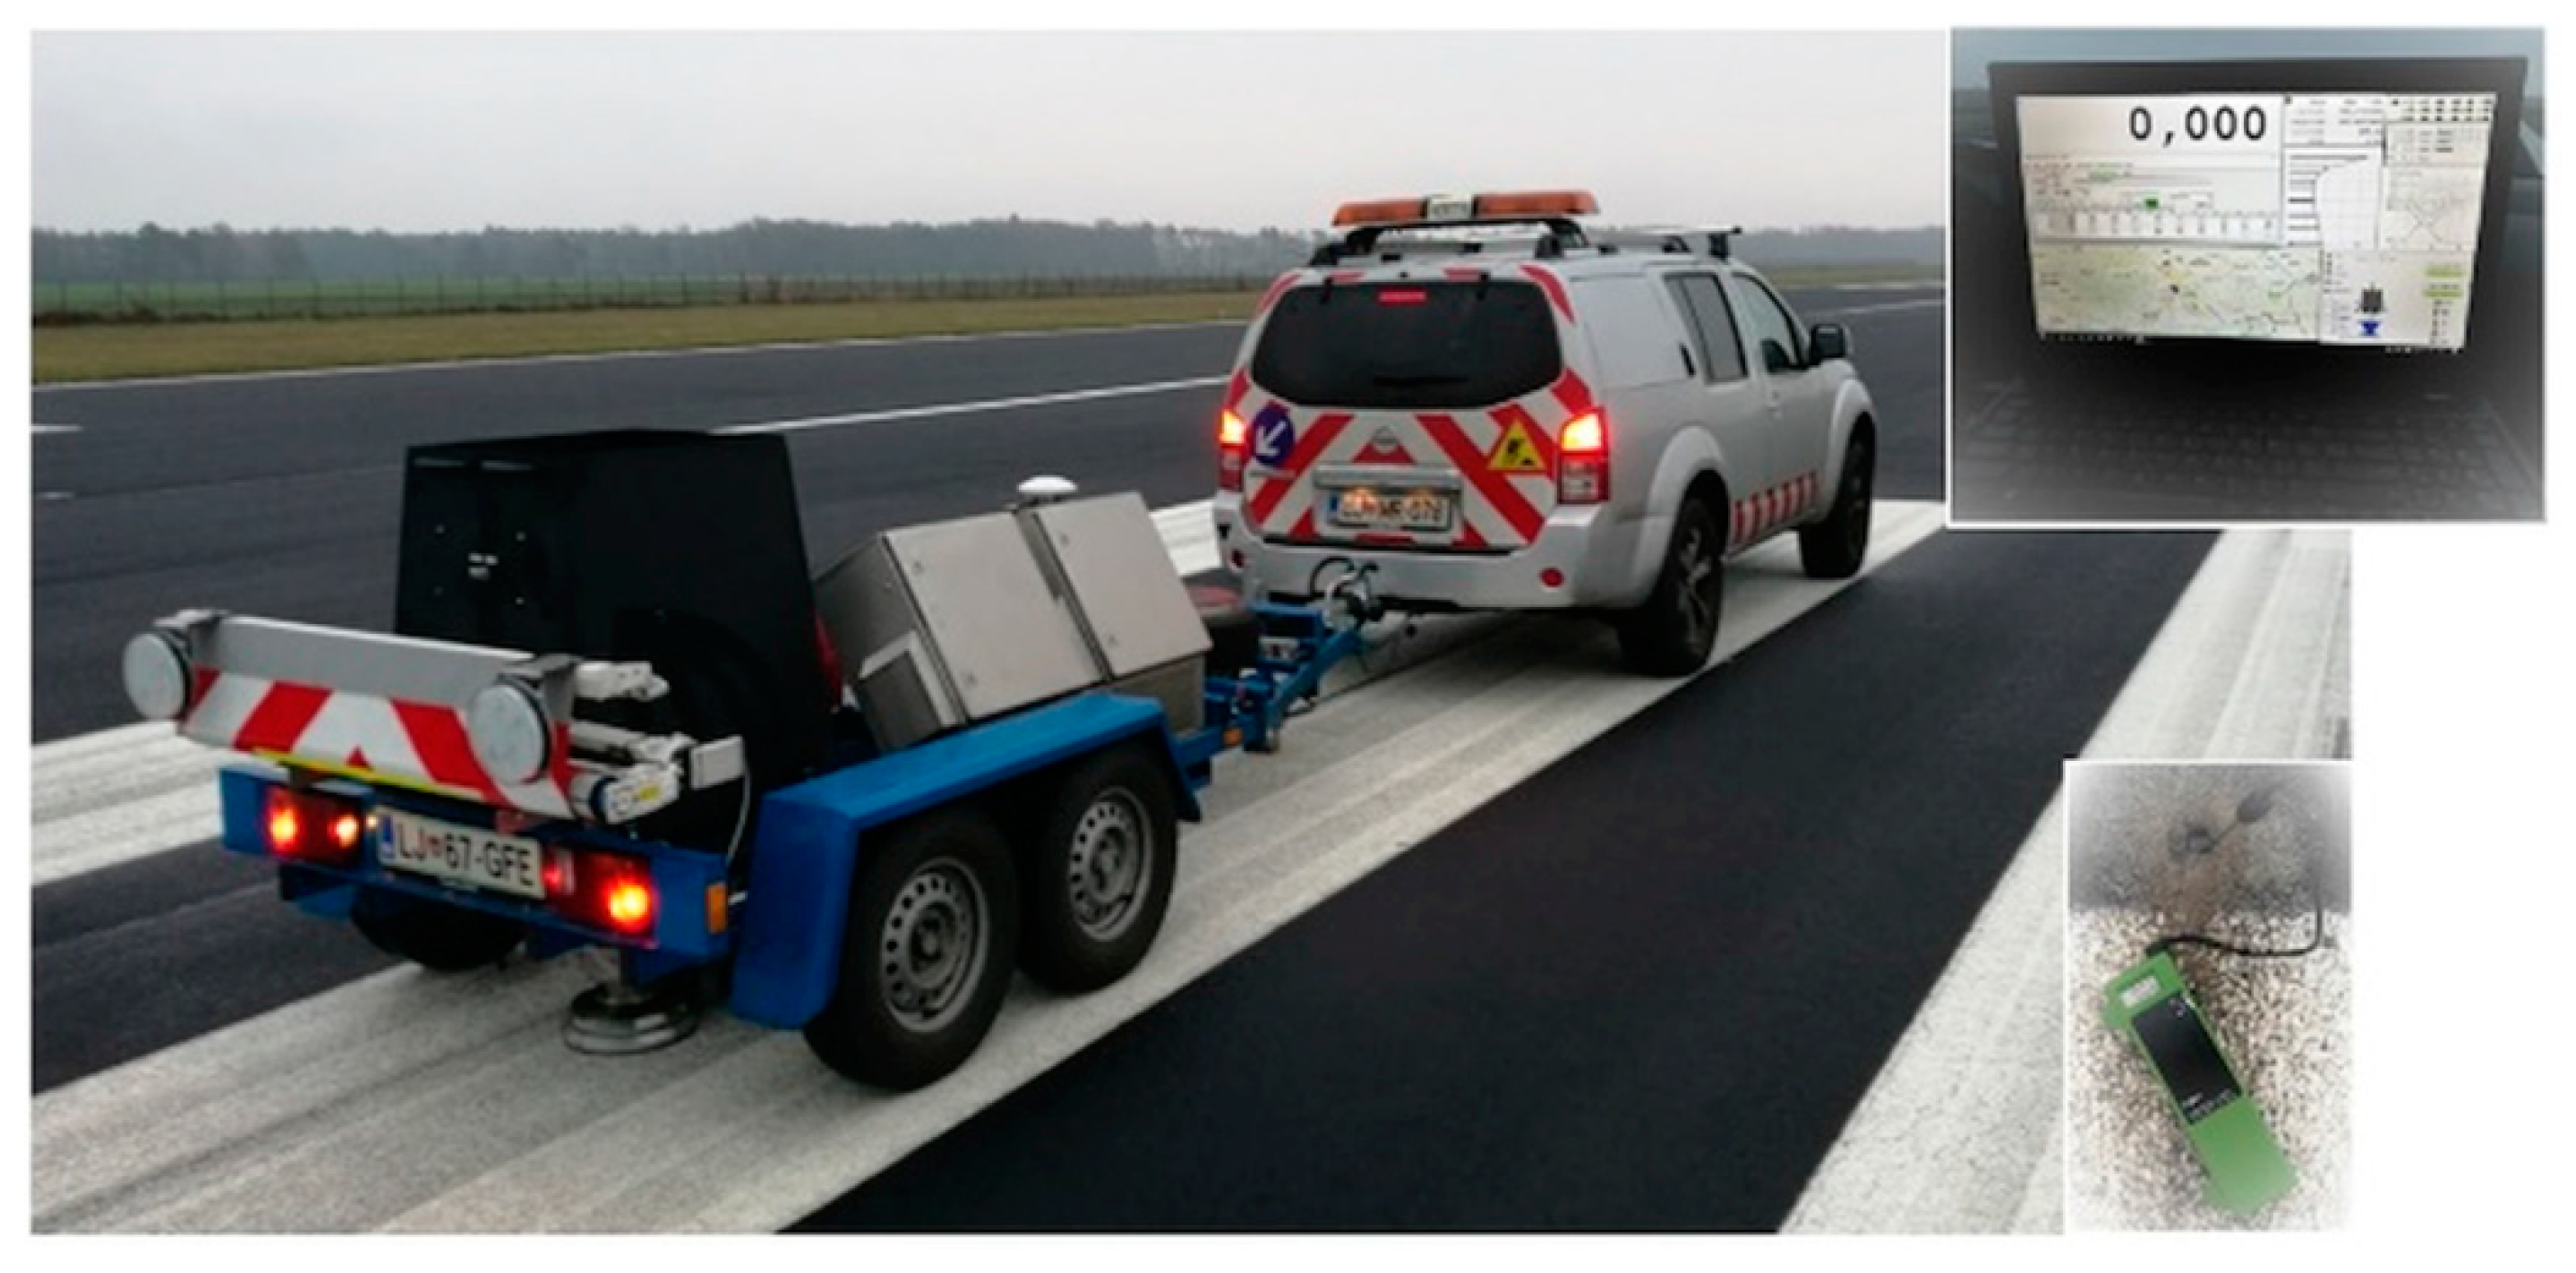
  • the measurements of runway unevenness need to be executed with modern geodetic equipment which provides the measurment in the unified coordinate system, high accuracy and repeatability of the measurements;
  • a variable state of the airport logistics infrastructure is established, which is easily and uniquely determinable based on the executed measurements with the modern geodetic equipment;
  • the strategy of airport logistics infrastructure maintenance is determined or suggested based on the executed evaluation of the state of the airport logistics infrastructure.
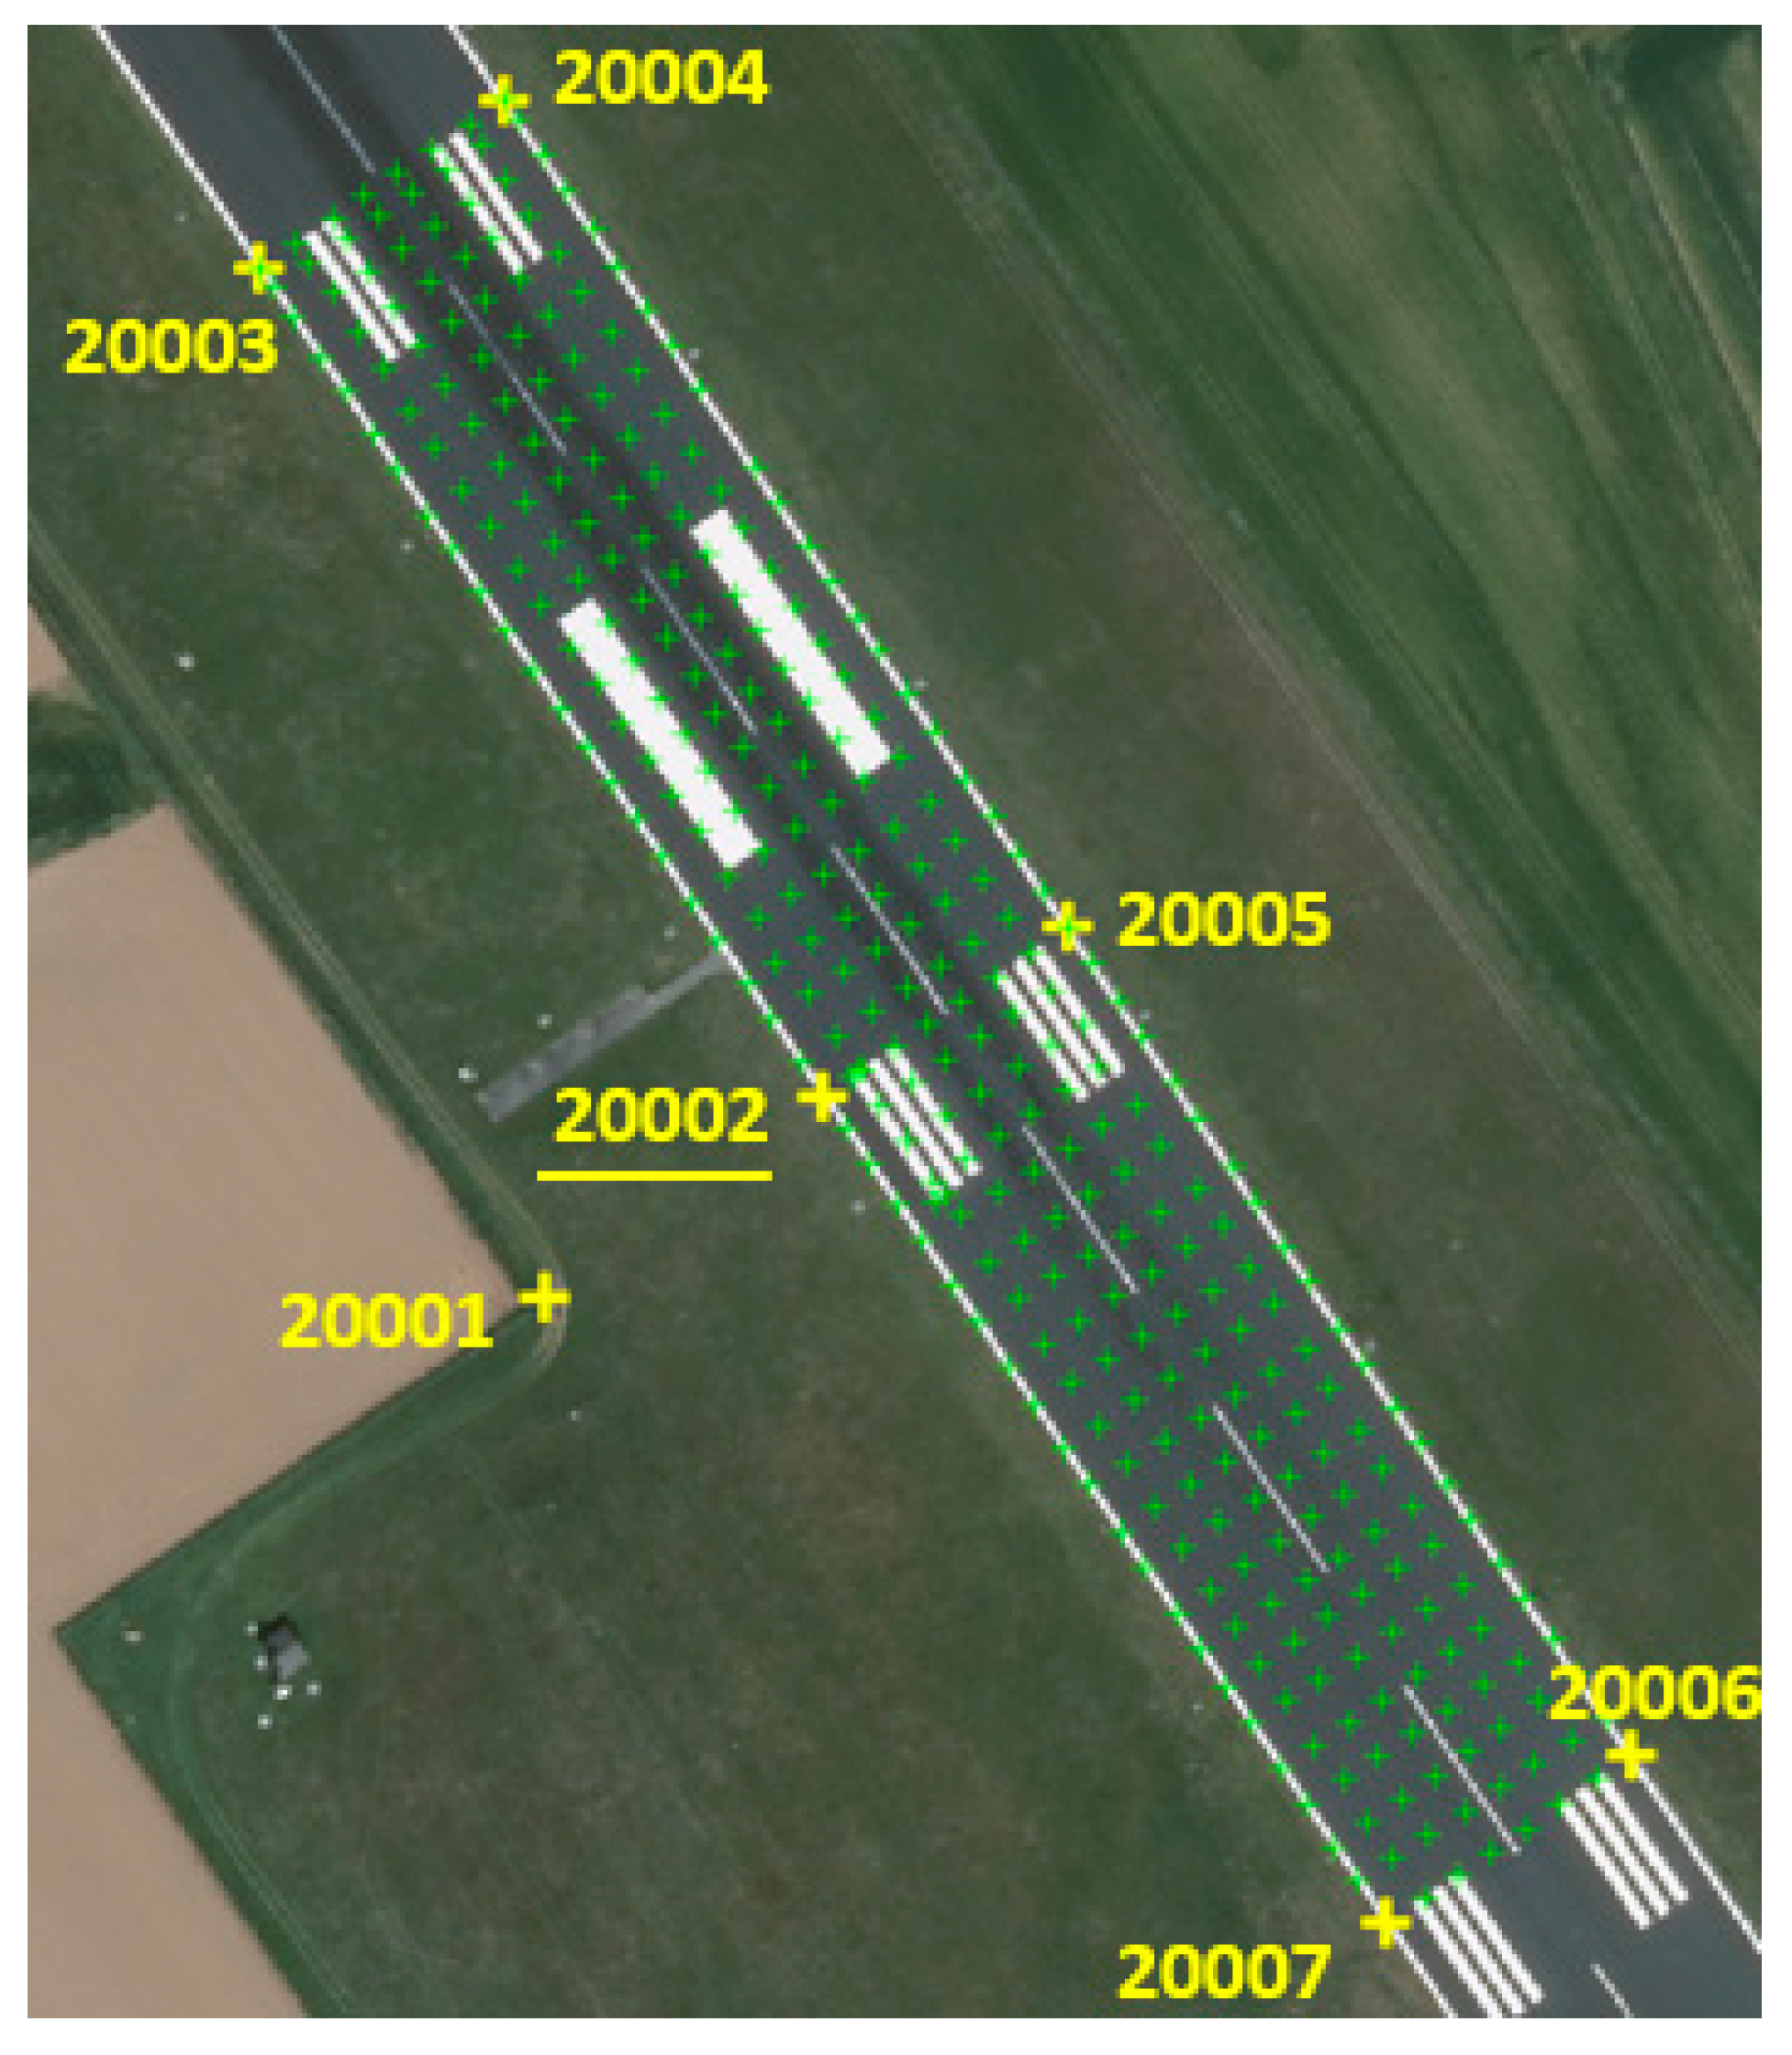
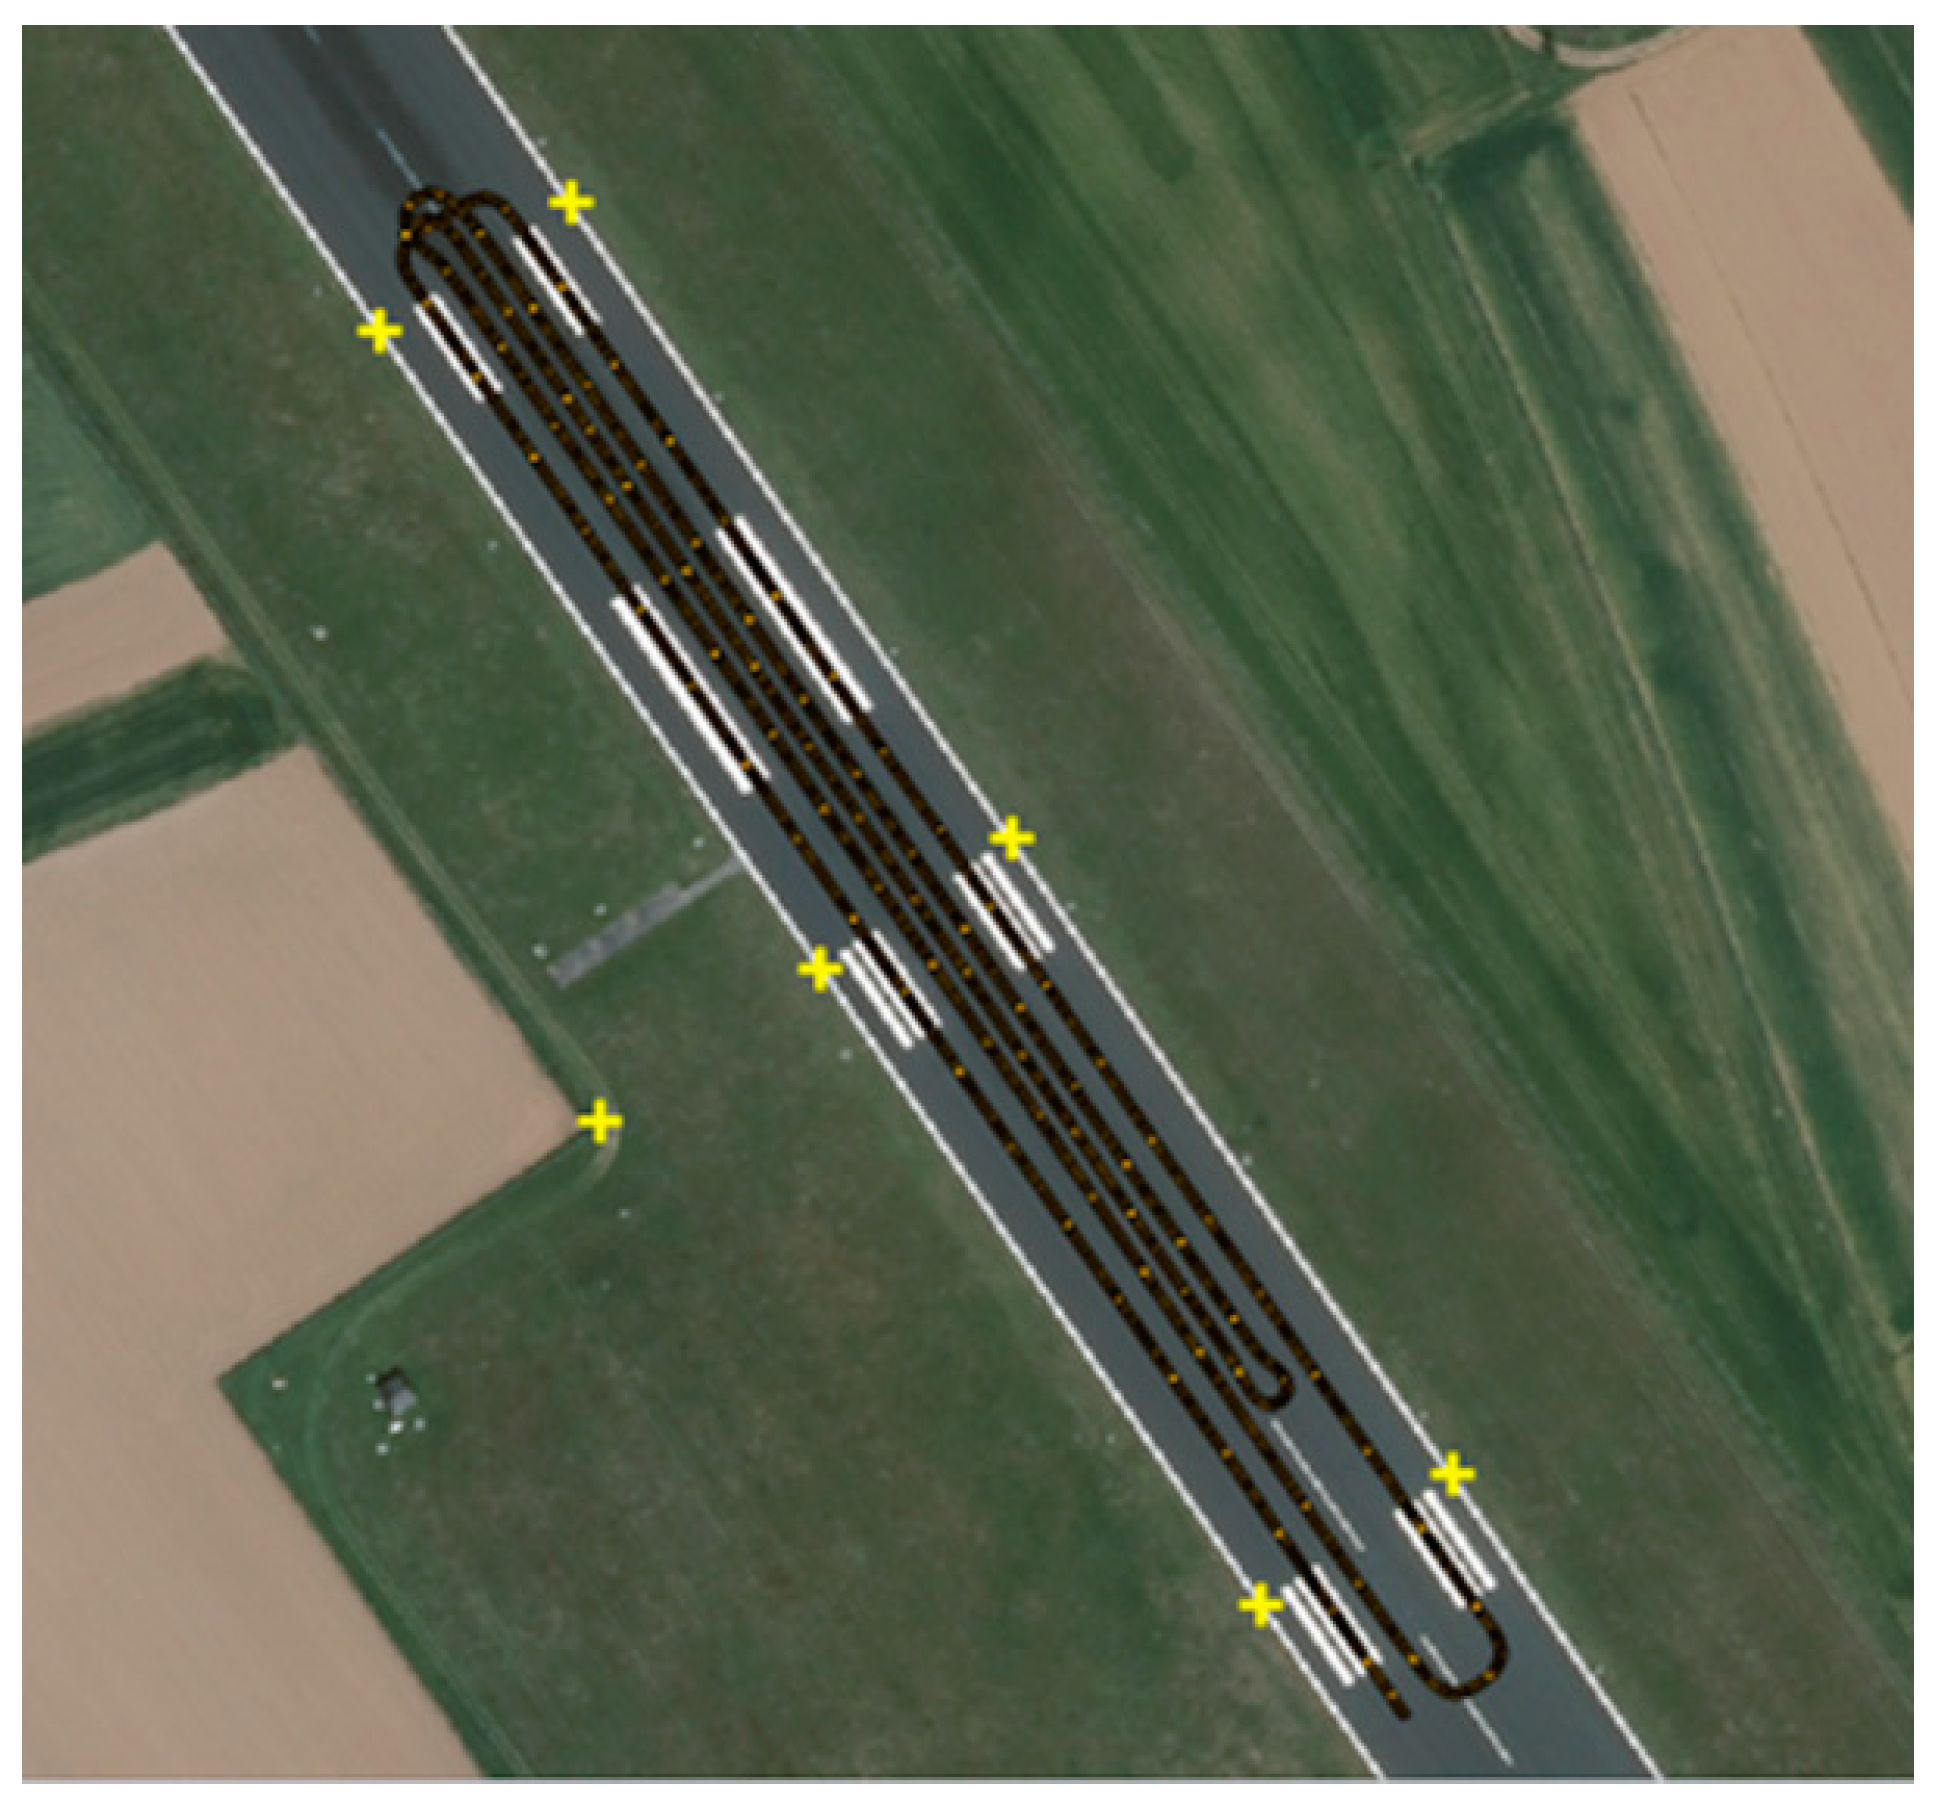
The final product is in the shape of the adapted information system prototype for the airport logistics infrastructure management. This was created in the software environment Bizagi Modeler, 3.6.0.044 version and was planned with a BPMN standard modelling technique, which is process-oriented and intended for the software development [61,62]. The conceptual model was made in the shape of LetMB high-level diagram.

4. Results

4.1. Monitoring the Runways State

The mathematical model to calculate vertical deviations and graphical presentation of the calculation results is made in the MATLAB R2019b software package. For this purpose, the LetMB.m programme was made, which is intended for the calculation of regression plains, vertical deviations and graphical display of the results. The calculation was made in two steps.
In the first step, for each time dimension, the calculation of the regression plain parameters and vertical deviations of regression plains from GRID was made. The results are shown in Table 1 for all three-time dimensions.
In the second step, the vertical shifts of regression plains between individual time dimensions were calculated. The comparison results are average vertical shifts of regression plains between time dimension. In Figure 4, only the results of third-time dimension are graphically displayed. On the left side, the results of the whole area of the processing are displayed and on the right is the detail. With the colour scale, the values of the difference of the average vertical shift between the compared plains are shown. The red coloured areas show that the deviations are positive (regression plain is above the GRID—bumps) and the blue coloured areas show that the deviations are negative (regression plain is below the GRID—holes). In the case of third time dimension measurement, the biggest deviation detected was in the value of 0.51 cm. The analytical results of the all time dimensions are shown in Table 2.
Later, with the purpose to determine the runway road surface value assessment state, we tried to implement the requirements of evaluating the runway state the according to ICAO (see Figure 5).
It was concluded that the ICAO demands in the computer environment cannot be used directly.
It was seen from the Figure 5 that the distance between the peaks of the deviations of individual time dimension measures from the demanded GRID was even up to 10× bigger than the ICAO demands, and the graphical analysis of the peaks (red encircled area in Figure 5) shows that even on shorter distances—assessed under 5 m—the deviations of the value of one equidistance (0.005 m) can be detected which very likely exceeds the other ICAO demand.
In Figure 5, the distances between the areas of the biggest vertical deviations in the case of the third time dimension measure in the touch-down area are shown. The biggest detected deviations on the concerned area were 3 cm (dark blue colour), the distance to other peaks of areas with the highest deviation was, on average, 29 m.
To update the obsolete evaluation system, it is suggested that, as the base for evaluating the runway state, the value of evaluated vertical deviations are obtained based on executed measurements and analysis, as it is suggested with the adapted method to monitor the runways state.
The airport logistics infrastructure maintenance strategy of smaller regional airports is determined in compliance with graph on Figure 6 as:
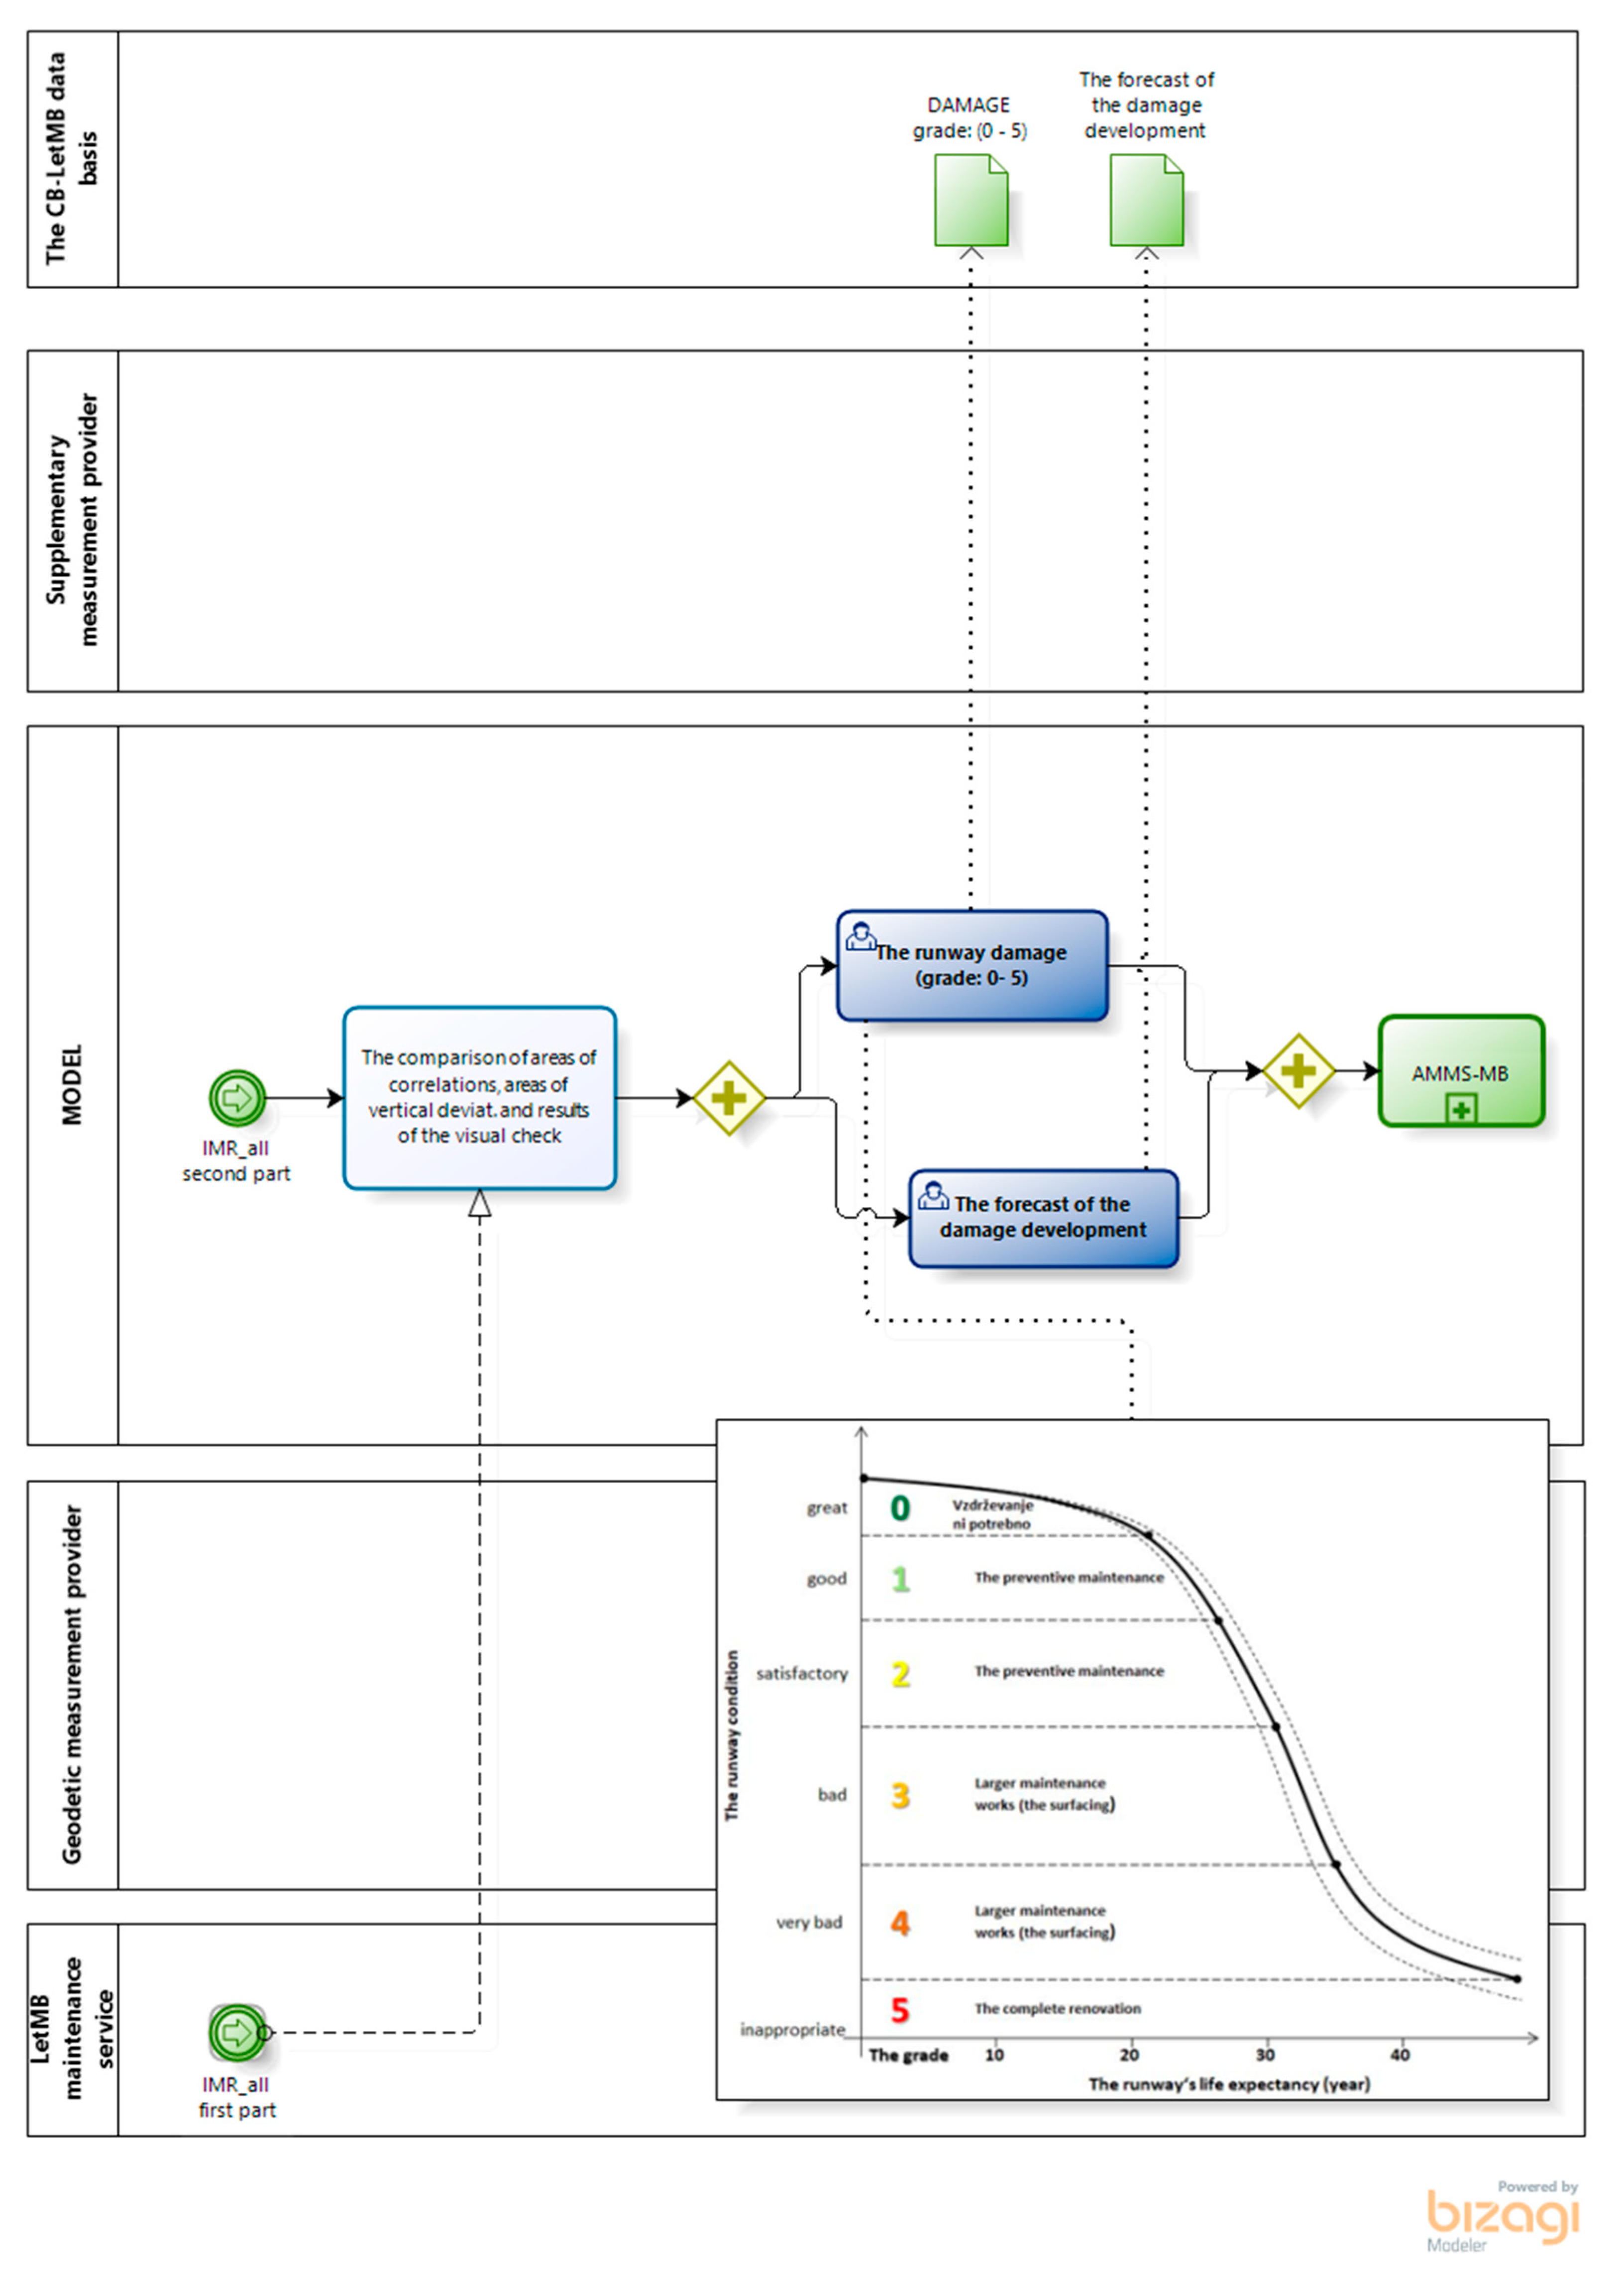
  • execution of basic measurements (zero net establishment of, the first time measurement), establishment (upgrade) of information system for airport logistics infrastructure maintenance on smaller regional airports (IMR)—basic condition for maintenance system to function;
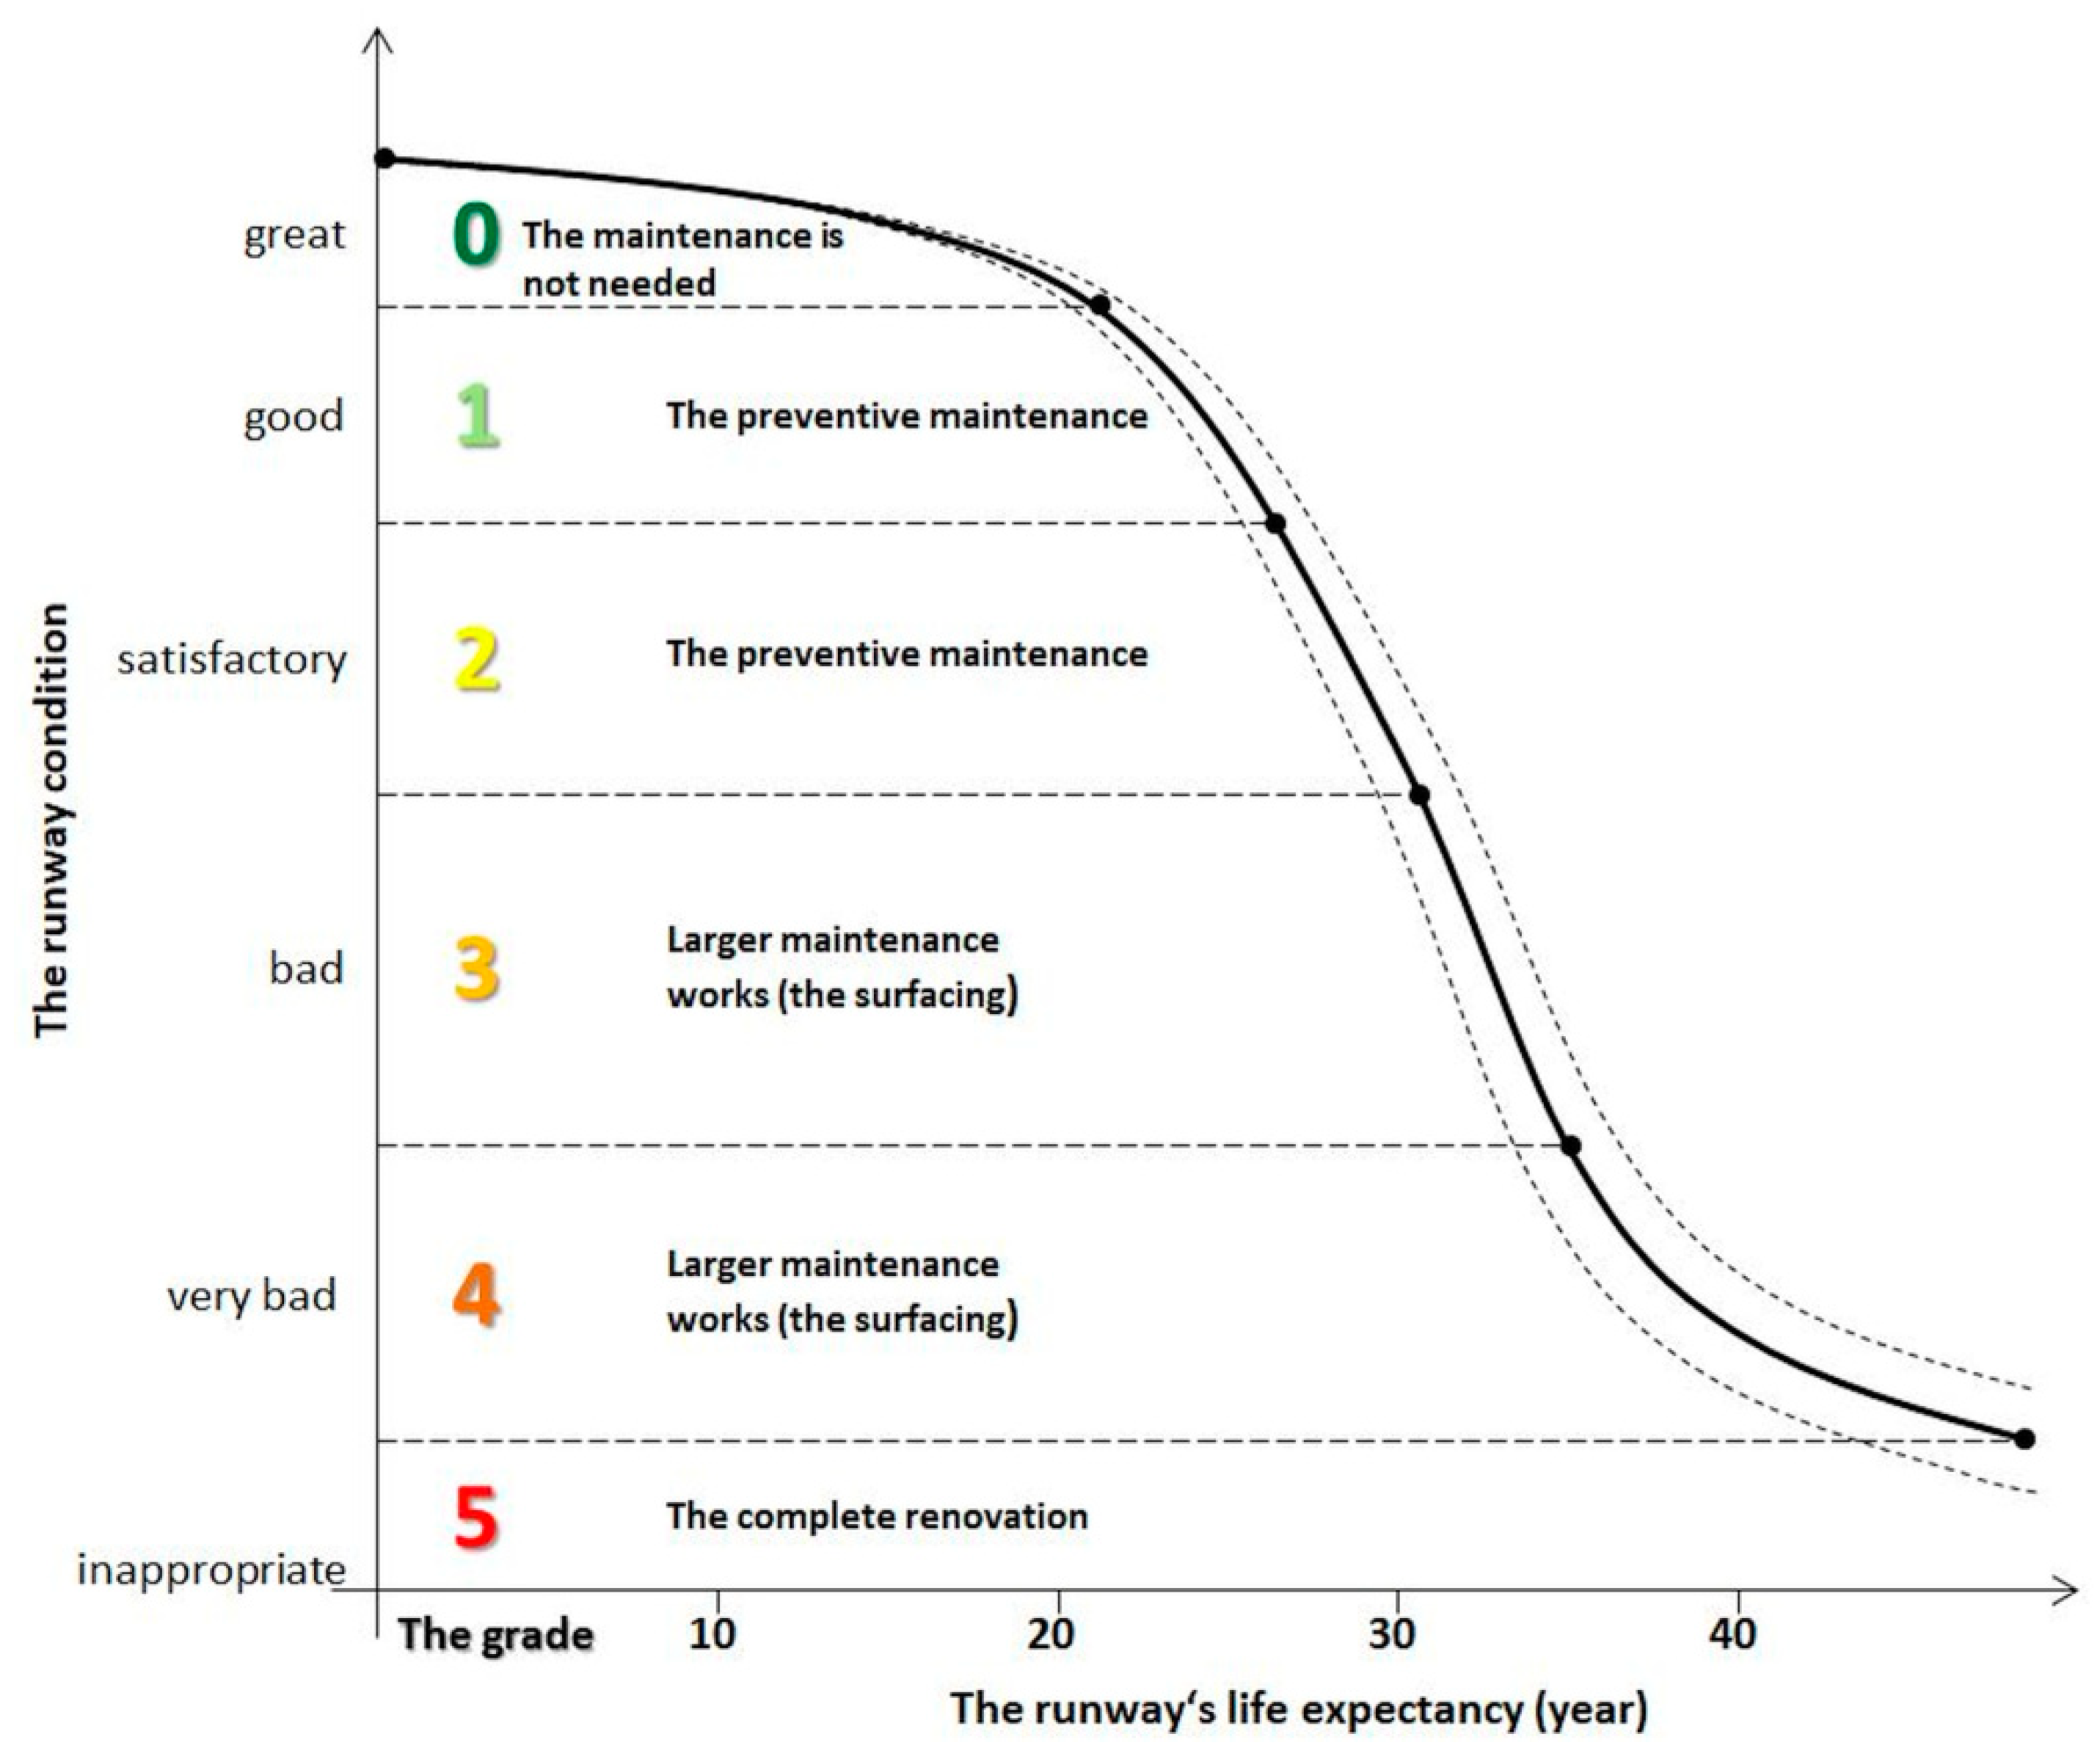
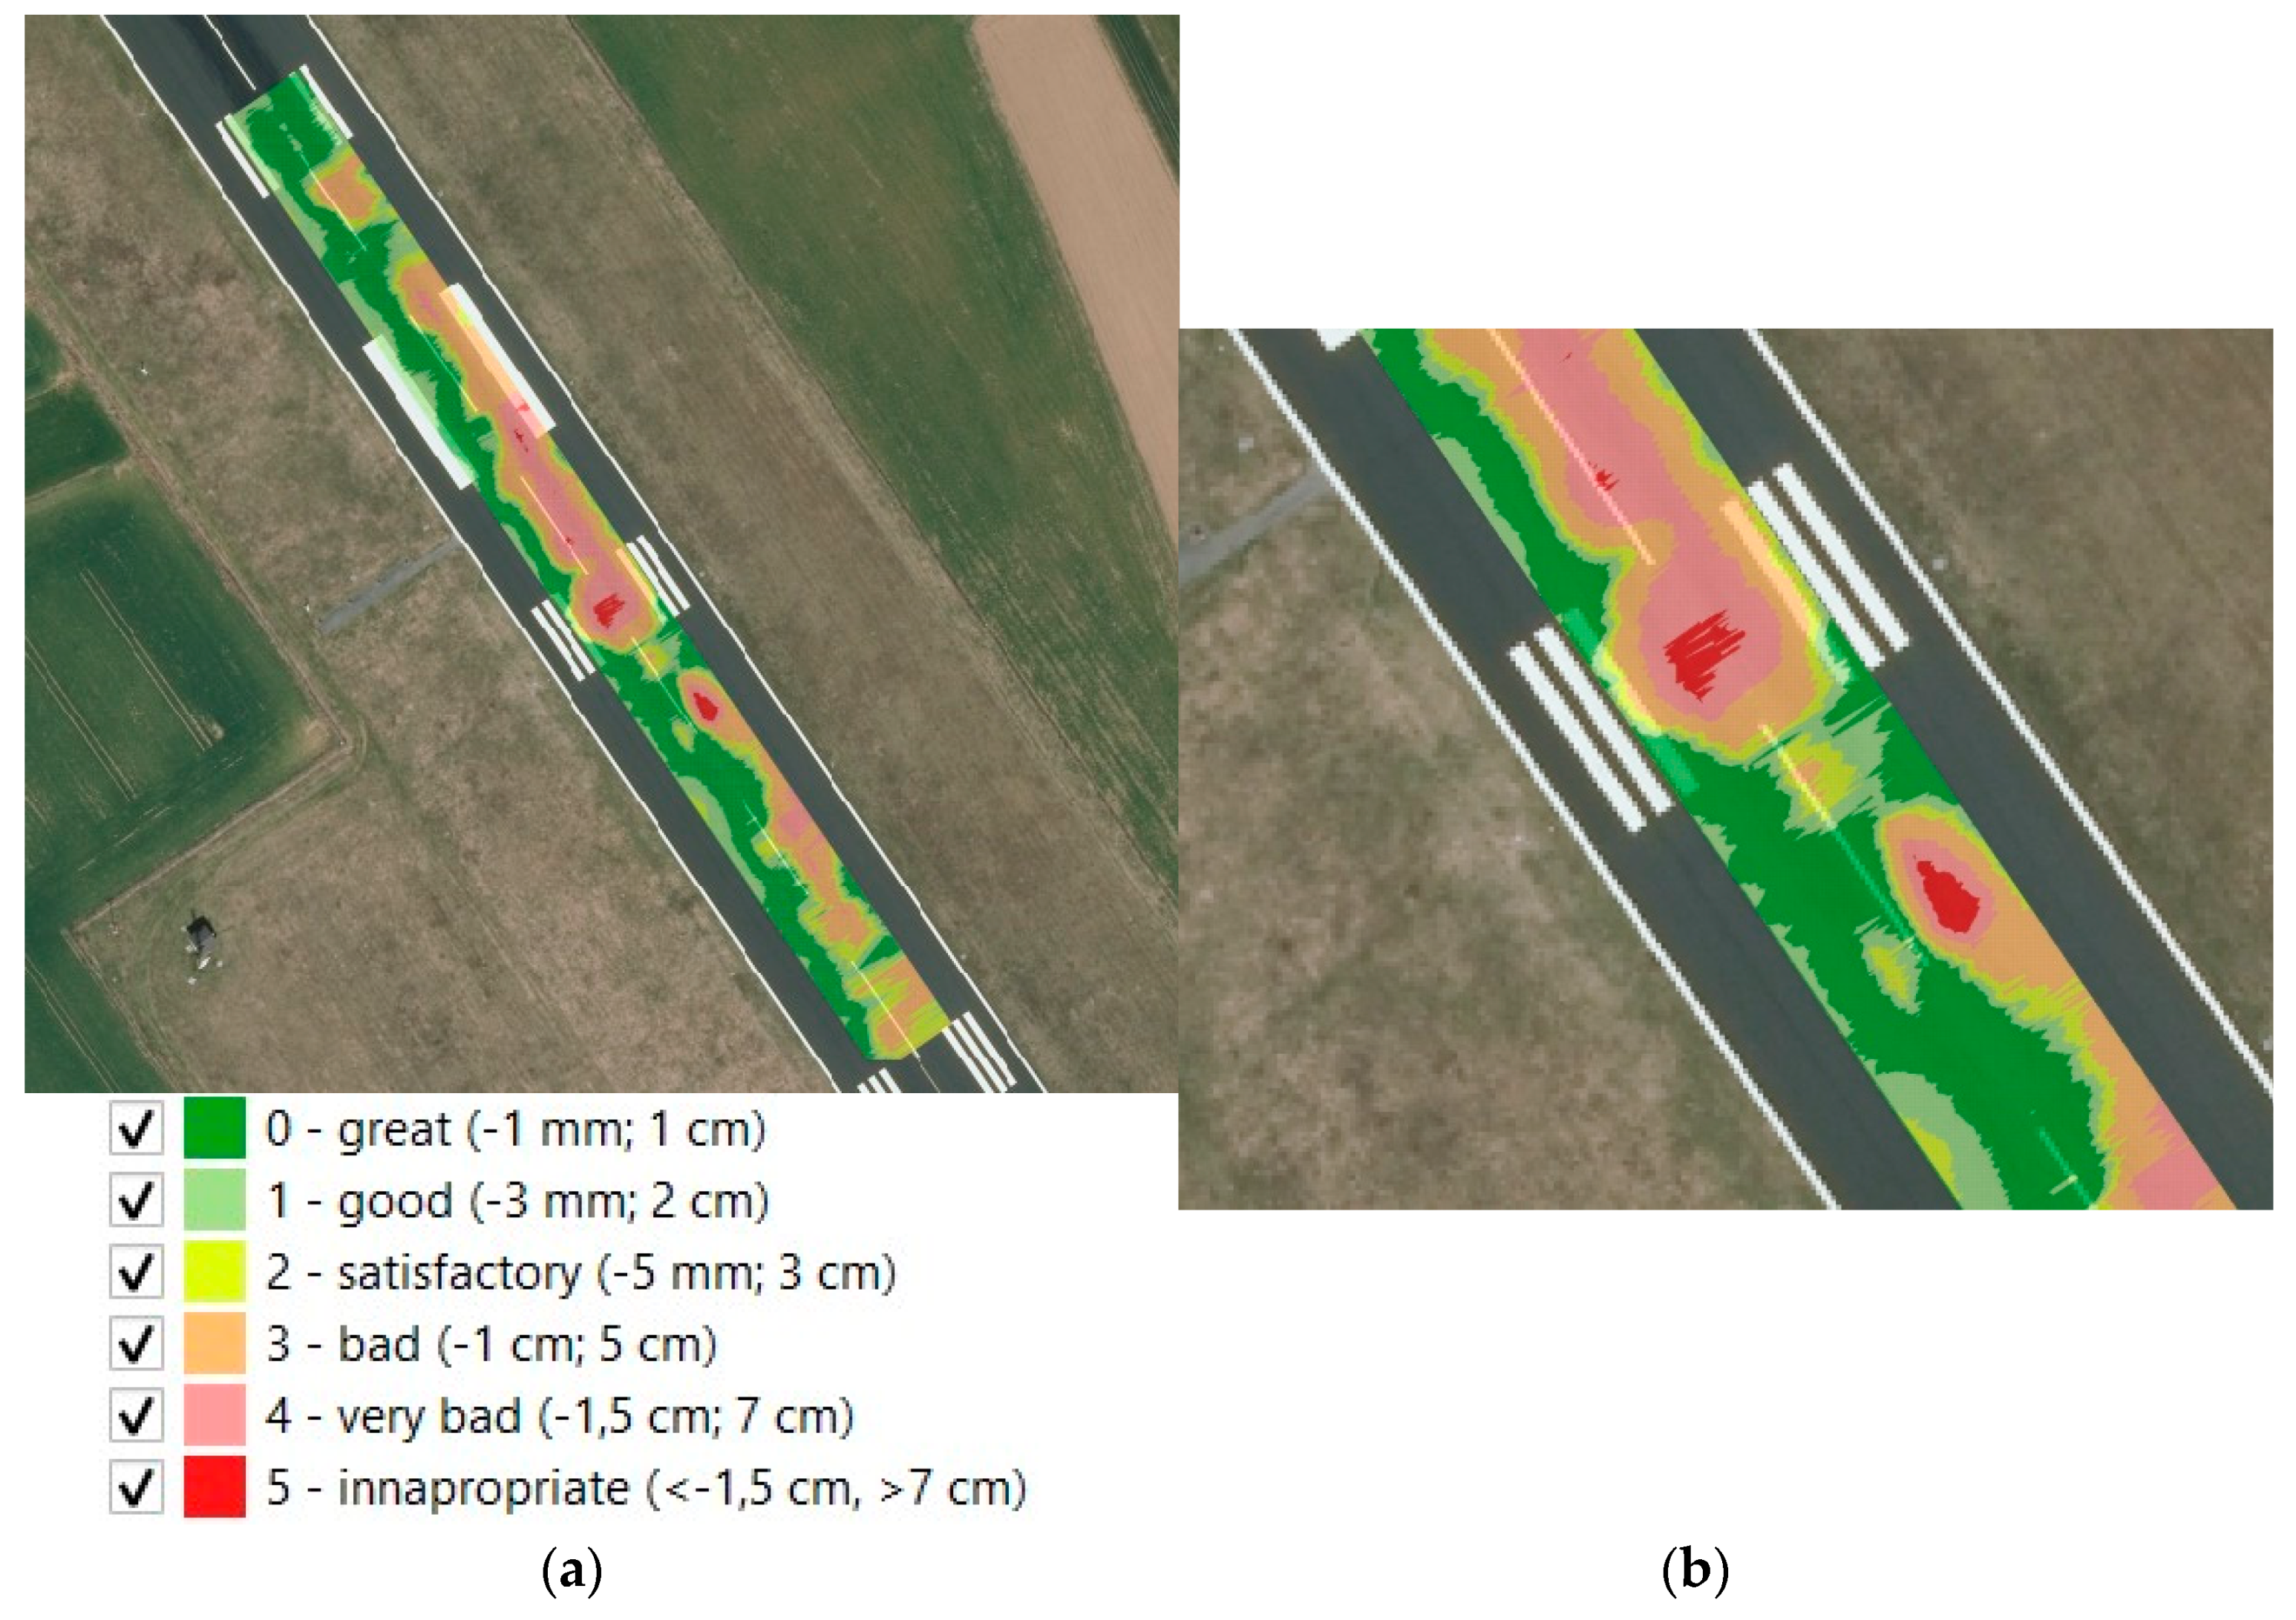
  • evaluation of assessed vertical deviations and determining the value of variable condition of airport logistics infrastructure (SLL) on the touch-down area:
    • SLL = »great«: no indentation bigger than 1 mm and no lifts of the runway surface bigger than 1 cm is not detected,
    • SLL = »good«: no indentation bigger than 3 mm and no lifts of the runway surface bigger than 2 cm are not detected, the SLL demand = »great is exceeded«;
    • SLL = »satisfactory«: no indentations bigger than 5 mm and no lifts of the runway surface bigger than 3 cm is not detected, the SLL demand = »good is exceeded«;
    • SLL = »bad«: no indentations bigger than 10 mm and no lifts of the runway surface bigger than 5 cm is not detected, the SLL demand = »satisfactory is exceeded«;
    • SLL = »very bad«: no indentations bigger than 15 mm and no lifts of the runway surface bigger than 7 cm, the SLL demand = »bad is exceeded«;
    • SLL = »inappropriate«: detected indentations bigger than 15 mm and lifts of the runway surface bigger than 7 cm,
  • intervention based on the evaluation of the airport logistics infrastructure state on smaller regional airports—Figure 6;
  • the monitoring is performed in regular periodical overviews every 5 years or since the last complete renovation or last larger maintenance works (surfacing).
The proposed model for assessing airport infrastructure conditions has been tested. Figure 7 shows the result of the assessment of the condition of the test runway based on real time data of the third time dimension measure. All analyses were perform in QGIS v 14.0 with tools of vektorisating and labelling polygons. As expected, the condition of airport logistics infrastructure (SLL) is inappropriate in the area of touch down where, in the event of rain, it could be expected larger puddles will appear right at the place where the aircraft needs the greatest possible grip when landing.
Monitoring (IMR) is based as a sub-process in the maintenance process (APMS-MB). In the monitoring process, the external geodetic measurements’ executant, according to the foreseen plan, executes measurements and writes the measurements results into the central database (»CB-LetMB«).
The results shown were also confirmed with supplementary measurements.
The Visualization of Results of the Monitoring with the Use of Augmented Reality
Since the preliminary analysis, we set an indirect goal which claims that the results of the model will be shown in a way that it will be presented to the user from a different perspective and provide them with some kind of ambient experience. AR-technology allows the data overview in a real environment or allows one to view the data in the interaction with the real environment.
The application was tested in February 2020. The outlines and surfaces of vertical deviations (2D) on the processing area were displayed in the interaction with the real environment. In practice, it means that the mobile device on which the real environment was displayed was directed towards the processing area on the runway and at that moment, on the mobile device’s screen, the contours and areas of vertical deviations were displayed. It is shown, in Figure 8, how the user sees the real picture of the runway, augmented with the outlines and areas of vertical deviations.
The testing was uninterrupted. The communication with the server and data transfer was executed as expected. At data transfer, no difficulties were expected since the quantity of transferred data was small. The application was first tested with the used of external GNSS and then with the use of internal GNSS, which was built-in in the mobile device. The accuracy of data displaying with the use of external GNSS was estimated on ten centimetres, and the accuracy of the data display with the use of internal GNSS was much worse and was estimated to approximately one meter. AR use aimed to display areas of vertical deviations and non-accurately show the position of an individual deformation; therefore, it is estimated that the meter accuracy of the data display is appropriate.
The graphical data on areas of vertical deviations and deformations, and especially their visual presentation in interaction with the real world, is in our opinion key in decision-making about the way and extent of the execution of maintenance or renovation works. The visualisation of graphical data with the use of advanced technologies, among them the AR, allows the decision-makers better data presentation and analysis results and allows the overview and interpretation of these data in a real environment without other professionals being presented (designers, builders, geodesists, etc.) As it is shown in Figure 8, the decision-makers, or all who overview and analyse the data, overview them in a real environment or interaction with it.

4.2. The Expanded Innovative Model for the Continuous Monitoring of the Runway’s Deformations

The monitoring (IMR) was, hereinafter, expanded with new actors, since the incorporation of additional supplementary measurements with which runway deformations can be detected or confirmed is intended. Thus, the expanded BDP-monitoring (IMR all), in which the geodetic measurement executant and supplementary measurement provider are included as outer actors, was created and shown in Appendix A Figure A1, Figure A2 and Figure A3.
The monitoring results (IMR all) are determined areas of vertical deviations, which are a combination of findings based on the visual runway check-up, the results of used geodetic method and the results of supplementary method, which is shown in [53]. The areas of the deformities can be shown as 2D contours of the plane of deviations from the regression plane, as a 3D plane of deviations from the regression plane or on a plate in a real space.

5. Discussion

Airport runways are exposed to the function of external and internal forces; therefore, they must be regularly checked and properly restored. For this purpose, on the airport in Maribor, which is not exposed to heavy air traffic, we executed the research of the runway unevenness with a geodetic survey, which is fast, accurate and economic. The measurements were executed in four time periods. The first measurement presents a comparative surface—GRID. The obtained results were processed and displayed in two different ways which offer similar results. The biggest vertical deviations from GRID are obtained in the third time dimension which was also used as the comparative one. With both methods, we got the biggest deformations on the same places of the runway, which proves the applicability hypothesis of various methods for measuring the unevenness state on the runways.
Later, the adapted management information system was developed, and with the help of the suggested automated system of evaluating the detected unevenness state on the runway, the execution of proper measures can be suggested. Parallelly, maintainance strategies and instructions which would need to be implemented in the case of it certain airports decide to use this method were developed.
Since the subject of the research was tested and applied only at the certain regional airport (Maribor Airport, Slovenia), where we concluded that the execution of suggested measures is possible and feasible, it is sensible to later test the suggested measures also on the other comparable airports.
In terms of the research, it was concluded that a generally valid and used evaluation system of unevenness is not appropriate for use in a computer environment [7]; therefore, the new adapted suggestion of evaluation was developed, which would be sensible to check in the wider experts public and according to the executed developed procedures, based on the normative provisions, place into official documents.

6. Conclusions

Computer-supported tools are also becoming more and more effective in the areas where, for whatever reason still (at least in the normative sense), the evaluation principles which were exposed in the middle or at the end of the 20th century are still valid. With the executed research, we have shown and proven that runway unevenness can be measured with modern tools, and the obtained results can be directly used in sustainably directed information systems for runway management on smaller regional airports.
In order to enable the measurement of the runway condition in geodetic accuracy, a vehicle with sensors was manufactured as part of the research. With the help of the vehicle, the vulnerability of the runway was measured in such a way that the results of the measurements are given with geodetic accuracy and transferable (digital record). The measurements themselves were performed during the closure of the test airport, and the method itself is made in such a way that it is not time consuming. A similar approach is not observed in the present literature.
The measurement results were computer-processed using our own algorithm (MATLAB) and compared using existing free geographic information system (QGIS) algorithms. The condition of the airport infrastructure was assessed on the basis of the difference found between the actual condition of the runway (time dimension measure) and the original constructed condition (GRID). From the point of view of monitoring the condition of runways, depressions or holes (the measured plane is below the GRID) may represent those conditions that could be problematic and would need to be monitored to ensure traffic safety.
In order to enable work with the available measurement results and the process of assessing the condition of the flatness of the runway in question in the field, a computer tool for smartphones was established. It allows the decision-makers better data presentation and analysis results and allows the overview and interpretation of these data in a real environment without other professionals being presented.
The used computer aided approach provides as much accuracy as possible, repeatability of measurements and thus professional credibility in the evaluation process of the runway unevenness state. Finally, considering the sustainability principle and runway life cycle, the innovative model of sustainable runway management was made; its use provides proper control of the runway state and proper professional action in the case of detected deviations.
With the suggested type of management, the always-useful runways state, the optimum recovery of airport infrastructure at minimal maintenance finance inputs and the most safe and efficient occurrence of air traffic at the airports is provided.

Author Contributions

Conceptualization: D.D., D.S. and B.K.; methodology: D.D.; software: D.D.; validation: D.D., D.S. and B.K.; formal analysis: D.D., D.S. and B.K.; investigation: D.D., B.K. and D.S.; resources: B.K.; data curation: D.D.; writing—original draft preparation: D.D., B.K. and D.S.; writing—review and editing: D.D., D.S. and B.K.; visualization: D.D.; supervision: B.K.; project administration: D.D. and B.K. All authors have read and agreed to the published version of the manuscript.

Funding

This research received no external funding.

Institutional Review Board Statement

Not applicable.

Informed Consent Statement

Informed consent statement was obtained from all subjects involved in the study.

Data Availability Statement

The data presented in this study are available on request from the corresponding author. The data are not publicly available. The data were obtained on the basis of own research within the doctoral dissertation of dr. Damjan Doler at the Faculty of Logistics, University of Maribor [53].

Acknowledgments

Authors of the article thank the airport staff, Faculty of Logistics, University of Maribor and the Troia d.o.o., Slovenj Gradec, Slovenia company, which provided the hardware for the realisation of the idea of the use of augmented reality in the procedures of evaluation of the runways state.

Conflicts of Interest

The authors declare no conflict of interest.

Appendix A

Figure A1. The first part of BPD˙s process decision-making maintenance model IMR all.
Sustainability 13 00652 g0a1
Figure A2. Second part BPDs process decision-making maintenance model IMR all.
Sustainability 13 00652 g0a2
Figure A3. The third part of Table 2016. 90, 1–6, doi:10.1016/j.autcon.2010.03.001.
Sustainability 13 00652 g0a3

References

  1. Tsai, M.C.; Su, Y.S. Political risk assessment on air logistics hub developments in Taiwan. J. Air Transp. Manag. 2002, 8, 373–380. [Google Scholar] [CrossRef]
  2. Caunhye, A.M.; Zhang, Y.; Li, M.; Nie, X. A location-routing model for prepositioning and distributing emergency supplies. Logist. Transp.Rev. 2016, 90, 161–176. [Google Scholar] [CrossRef]
  3. Jackson, P.T.G.; Nelson, C.J.; Schiefele, J.; Obara, B. Runway detection in High Resolution remote sensing data. In Proceedings of the 9th International Symposium on Image and Signal Processing and Analysis (ISPA), Zagreb, Croatia, 7–9 September 2015. [Google Scholar] [CrossRef] [Green Version]
  4. Lee, M.H.; Chou, C.P.; Li, K.H. Automatic measurement of runway grooving construction for pavement skid evaluation. Autom. Constr. 2009, 18, 856–863. [Google Scholar] [CrossRef]
  5. Moon, S.; Yang, B.; Kim, J.; Seo, J. Effectiveness of remote control for a concrete surface grinding machine. Autom. Constr. 2010, 19, 734–741. [Google Scholar] [CrossRef]
  6. ICAO—International Civil Aviation Organization (Safety Report, 2018 Edition). Available online: https://www.icao.int/safety/Pages/Safety-Report.aspx (accessed on 4 July 2019).
  7. Micco, A.; Serebrisky, T. Infrastructure, Competition Regimes, and Air Transport Costs: Cross-Country Evidence; Policy Research Working Paper Series; The World Bank: Washington, DC, USA, 2004. [Google Scholar]
  8. ICAO—International Civil Aviation Organization (Global Aviation Safety Plan, 2017–2019). Available online: https://www.ulc.gov.pl/en/safety-management/467-civil-aviation-safety-programmes/icao-global-aviation-safety-plan-gasp/5076-icao-global-aviation-safety-plan-gasp-2017-2019 (accessed on 14 July 2017).
  9. IATA—International Air Transport Association (Safety Report 2018). Available online: https://www.https://libraryonline.erau.edu/online-full-text/iata-safety-reports/IATA-Safety-Report-2018.pdf (accessed on 1 April 2019).
  10. IATA—International Air Transport Association (Runway Excursion Report 2004–2009). Available online: https://www.iata.org/en/pressroom/pr/2009-09-10-01/ (accessed on 10 September 2009).
  11. D’Apuzzo, M.; Festa, B.; Giuliana, G.; Mancini, L.; Nicolosi, V. The Evaluation of Runway Surface Properties: A New Approach. Procedia Soc. Behav. Sci. 2012, 53, 1192–1201. [Google Scholar] [CrossRef]
  12. Micaelo, R.; Soares, A.; Ferreira, A. Aquaplaning risk assessment in Portuguese road design guide. Proc. Inst. Civ. Eng. Trans. 2015, 168, 300–311. Available online: http://www.icevirtuallibrary.com/content/article/10.1680/tran.13.00029 (accessed on 19 September 2020). [CrossRef]
  13. Justo-Silva, R.; Ferreira, A. Pavement maintenance considering traffic accident costs. Int. J. Pavement Res. Technol. 2019, 12, 562–573. [Google Scholar] [CrossRef]
  14. Lord, D.; Mannering, F.L. The Statistical Analysis of Cresh-Frequency Data: A Review and Assessment of methodological Alternatives. Transp. Res. Part A Policy Pract. 2010, 44, 291–305. [Google Scholar] [CrossRef] [Green Version]
  15. Chang, L.Y.; Chen, W.C. Data mining of three-based models to analyze freeway accident frequency. J. Saf. Res. 2005, 36, 365–375. [Google Scholar] [CrossRef]
  16. Lee, J.; Mannenering, F.L. Impact of roadside features on the frequency and severity of run-off-roadway accidents: An empirical analysis. Accid. Anal. Prev. 2002, 34, 149–161. [Google Scholar] [CrossRef]
  17. Moretti, L.; Di Mascio, P.; Nichele, S.; Cokorilo, O. Runway veer-off accidents: Quantitative risk assessment and risk reduction measures. Saf. Sci. 2018, 104, 157–163. [Google Scholar] [CrossRef]
  18. Wang, W.; Deng, S. Evaluation and analysis of the pavement roughness of airport runway. J. Chin. Civ. Aviat. Coll. 2006, 24. [Google Scholar] [CrossRef] [Green Version]
  19. Wang, W. Protocol Based Pavement Cracking Measurement with 1 mm 3D Pavement Surface Model. Ph.D. Thesis, Oklahoma State University, Stillwater, OK, USA, 2015. [Google Scholar]
  20. Oliveira, H.; Correia, P.L. Automatic Road Crack Detection and Characterization. IEEE Trans. Intell. Transp. Syst. 2013, 14, 155–168. [Google Scholar] [CrossRef]
  21. Mokhtari, S.; Wu, L.; Yun, H.B. Comparison of Supervised Classification Techniques for Vision-Based Pavement Crack Detection. J. Transp. Res. Board 2016, 2595, 119–127. [Google Scholar] [CrossRef]
  22. Shi, Y.; Cui, L.; Qi, Z.; Meng, F.; Chen, Z. Automatic Road Crack Detection Using Random Structured Forests. IEEE Trans. Intell. Transp. Syst. 2016, 17, 3434–3445. [Google Scholar] [CrossRef]
  23. Wang, P.; Hu, Y.; Dai, Y.; Tian, M. Asphalt Pavement Pothole Detection and Segmentation Based on Wavelet Energy Field. Math. Probl. Eng. 2017, 2017, 1–13. [Google Scholar] [CrossRef] [Green Version]
  24. Peng, L.; Chao, W.; Shuangmiao, L.; Baocai, F. Research on Crack Detection Method of Airport Runway Based on Twice-Threshold Segmentation. In Proceedings of the Fifth International Conference on Instrumentation and Measurement, Computer, Communication and Control (IMCCC), Qinhuangdao, China, 18–20 September 2015. [Google Scholar] [CrossRef]
  25. Fernandez, C.A.; Lozano, F.J.R.; Villatoro, R.; Olivares, J.; Palomares, J.M. Efficient pavement crack detection and classification. EURASIP J. Image Video Process. 2017, 39. [Google Scholar] [CrossRef]
  26. Li, W.; Huyan, J.; Tighe, S.L.; Ren, Q.; Sun, Z. Three-Dimensional Pavement Crack Detection Algorithm Based on Two-Dimensional Empirical Mode Decomposition. J. Transp. Eng. Part B Pavement 2017, 143. [Google Scholar] [CrossRef]
  27. Loprencipe, G.; Zoccali, P. Comparasion of methods for evaluating airport pavement roughness. J. Pavement Eng. 2019, 20, 782–791. [Google Scholar] [CrossRef]
  28. Barbarella, M.; De Blasiis, M.R.; Fiani, M. Terrestrail Laser scanner for the analysis of airport pavement geometry. J. Pavement Eng. 2019, 20, 466–480. [Google Scholar] [CrossRef]
  29. Read, J.M. New Method for Measuring Crack Propagation in Asphalts. Int. J. Pavement Eng. 1999, 1, 15–34. [Google Scholar] [CrossRef]
  30. Duong, N.S.; Blanc, J.; Hornych, P.; Menant, F.; Lefeuvre, Y.; Bouveret, B. Monitoring of pavement deflections using geophones. Int. J. Eng. 2020, 21, 1103–1113. [Google Scholar] [CrossRef]
  31. De Souza, N.M.; de Almeida Filha, A.T. A systematic airport runway maintenance and inspection policy based on a delay time modeling approach. Autom. Constr. 2020, 110. [Google Scholar] [CrossRef]
  32. Marks, A.; Rietsema, K.; Hudson, G. Aviation Management Information Systems; Embry-Riddle Press: Daytona-Beach, FL, USA, 2013. [Google Scholar] [CrossRef] [Green Version]
  33. Marks, A.; Rietsema, K. Airport Information Systems—Airside Management Information System. Intell. Inf. Manag. 2014, 6, 149–156. [Google Scholar] [CrossRef] [Green Version]
  34. Marks, A.; Rietsema, K.; AL-Ali, M. Airport Information Systems—Landside Management Information System. Intell. Inf. Manag. 2015, 7, 130–138. [Google Scholar] [CrossRef] [Green Version]
  35. Khozeimeh, I. An Automated Maintenance Management System for International Airports. Ph.D. Thessis, The George Washington University, The School of Engineering and Applied Science, Washington, DC, USA, 1994. [Google Scholar]
  36. Flintsch, G.W.; McGhee, K.K. NCHRP Synthesis 401: Quality Management of Pavement Condition Data Collection; Transportation Research Board: Washington, DC, USA, 2009. [Google Scholar] [CrossRef]
  37. Chen, Y.; Chou, C. Effects of Airport Pavement-Profile Wavelength on Aircraft Vertical Responses. J. Trans. Res. Board 2004, 1889, 83–93. [Google Scholar] [CrossRef]
  38. Santos, J.; Ferreira, A.; Flintsch, G.; Cerezo, V. A multy-objective optimization approach for sustainable pavement management. Struct. Infrastruct. Eng. 2018, 14, 854–868. [Google Scholar] [CrossRef]
  39. WSAA—Washington State Aviation Alliance, Washington Airport Pavement Management Manual. Available online: https://wsdot.wa.gov/aviation/Grants/AirportPavementManagement.htm (accessed on 2 November 2020).
  40. De Luca, M.; Dell’Acqua, G. Runway surface friction characteristics assessment for Lamezia Terme airfield pavement management system. J. Air Trans. Manag. 2014, 34, 1–5. [Google Scholar] [CrossRef]
  41. De Luca, M.; Dell’Acqua, G. Touchdown Remaining Lift on the Wings and Dynamic Vertical Force Transmitted to the Runway. Period. Polytech. Civ. Eng. 2018, 34, 1–5. [Google Scholar] [CrossRef] [Green Version]
  42. Di Mascio, P.; Moretti, L. Implementation of a pavement management system for maintenance and rehabilitation of airport surfaces. Case Stud. Constr. Mater. 2019, 11, e00251. Available online: http://www.sciencedirect.com/science/article/pii/S2214509519301688 (accessed on 20 October 2020). [CrossRef]
  43. Ghosh, R.; Schilling, T.; Wicke, K. Theoretical framework of systems design for the air transportation system including an inherently quantitative philosophy of scenario development. J. Air Trans. Manag. 2017, 58, 58–67. [Google Scholar] [CrossRef] [Green Version]
  44. Bazlamit, S.M.; Ahmad, H.S.; Obaidat, T.I.A. Pavement Maintenance Applications Using Geographic Information Systems. Procedia Eng. 2017, 182, 83–90. [Google Scholar] [CrossRef]
  45. Gendreau, M.; Soriano, P. Airport pavement management systems: An appraisal of existing methodologies. Transportation. Res. Part A Policy Pract. 1998, 32, 197–214. [Google Scholar] [CrossRef]
  46. Mao, X.; Yuan, C.; Gan, J. Incorporating Dynamic Traffic Distribution into Pavement Maintenance Optimization Model. Sustainability 2019, 11, 2488. [Google Scholar] [CrossRef] [Green Version]
  47. Šarlah, N. Izdelava Modela Georadarskih Opazovanj za Evidentiranje Gospodarske Infrastrukture. Ph.D. Thesis, Univerza v Ljubljani, Fakulteta za Gradbeništvo in Geodezijo, Ljubljana, Slovenia, 2016. Available online: https://repozitorij.uni-lj.si/Dokument.php?id=97913&lang=slv (accessed on 17 May 2018).
  48. Ghilani, C.D. Adjustment Computations; John Wiley & Sons: Hoboken, NJ, USA, 2010. [Google Scholar] [CrossRef]
  49. Macarol, S. Praktična Geodezija; Tehnička Knjiga: Zagreb, Croatia, 1978; pp. 1–723. [Google Scholar]
  50. Bakker, G.; de Munck, J.C.; Strang van Hees, G.L. Radio Positioning at Sea—Geodetic Survey Computations, Least Squares Adjustment; Delf University of Technology, Faculty of Geodetic Engineering: Delft, The Netherlands, 1995. [Google Scholar]
  51. Holst, C.; Kuhlmann, H. Challenges and Present Fields of Action at Laser Scanner Based Deformation Analyses. J. Appl. Geod. 2016, 10. [Google Scholar] [CrossRef]
  52. Doler, D.; Kovačič, B. Improved Decision-Making Geo-Information System for Continuous Monitoring of Deformations on Airport Infrastructure. ISPRS Int. J. Geo-Inf. 2019, 8, 1. [Google Scholar] [CrossRef] [Green Version]
  53. Doler, D. Inoviran Model Kontinuiranega Spremljanja Deformacij Letaliških Vzletno-Pristajalnih Stez. Ph.D. Thesis, Fakulteta za Logistiko Univerza v Mariboru, Celje, Slovenia, 2020. [Google Scholar]
  54. Kovačič, B.; Kamnik, R.; Bieliatynskyi, A. The Different Methods of Displacement Monitoring at Loading Tests of Bridges or Different Structures. In Proceedings of the MATEC Web of Conferences 53, International Scientific Conference Week of Science in SPbPU—Civil Engineering (SPbWOSCE–2015), Saint-Petersburg, Russia, 3–4 December 2015. [Google Scholar] [CrossRef] [Green Version]
  55. Kovačič, B.; Želodec, D.; Doler, D. Prototype of the Runway Monitoring Process at Smaller Airports: Edvard Rusjan Airport Maribor. Processes 2020, 8, 1689. [Google Scholar] [CrossRef]
  56. Galehouse, L.; Moulthrop, J.S.; Hicks, R.G. Principles of pavement preservation: Definitions, Benefits, Issues, and Barrier. Highw. Infrastruct. Preserv. 2003, 4–9. Available online: http://worldcat.org/issn/07386826 (accessed on 3 July 2018).
  57. Ong, G.P.; Nantung, T.; Sinha, K. Indiana Pavement Preservation Program; Joint Transportation Research Program; Indiana Department of Transportation and Purdue University: West Lafayette, IN, USA, 2010. [Google Scholar] [CrossRef] [Green Version]
  58. Čokorilo, O.; De Luca, M.; Dell’Acqua, G. Aircraft safety analysis using clustering algorithms. J. Risk Res. 2014, 17, 1325–1340. [Google Scholar] [CrossRef]
  59. Liang, Z.; Xiao, F.; Qian, X.; Zhou, L.; Jin, X.; Lu, X.; Karichery, S. A column generation-based heuristic for aircraft recovery problem with airport capacity constraints and maintenance flexibility. Transport. Res. Part B Methodol. 2018, 113, 70–90. [Google Scholar] [CrossRef]
  60. Airlines for America. U.S. Passenger Carrier Delay Costs. 2019. Available online: https://www.airlines.org/dataset/per-minute-cost-of-delays-to-u-s-airline (accessed on 5 September 2018).
  61. Križevnik, M.; Jurič, M.B. Modeliranje in izvajanje poslovnih procesov v storitveno orientiranih arhitekturah. Uporabna Informatika 2009, 3, 137–147. [Google Scholar]
  62. Polančič, G.; Jošt, G. Analiza upravljanja poslovnih procesov z BPMN 2.0m. Uporabna informatika 2012, 3, 153–163. [Google Scholar]
Figure 1. Basic (zero) geodetic net and GRID on the runway.
Sustainability 13 00652 g001
Figure 2. Measured positions of the trailer in the third time dimensions.
Sustainability 13 00652 g002
Figure 3. Using FWD equipment.
Sustainability 13 00652 g003
Figure 4. LetMB.m results: Surface of the deviation of time dimension measure R3 from GRID (hole—blue colour; the biggest bump—red colour); (a) The difference of compared plains; (b) Detail.
Sustainability 13 00652 g004
Figure 5. The distances between the areas of maximal vertical deviations in the third time dimension measure.
Sustainability 13 00652 g005
Figure 6. Intervention based on the evaluation of the airport logistics infrastructure state on smaller regional airports [53,56,57].
Sustainability 13 00652 g006
Figure 7. Conditions of airport logistics infrastructure (SLL) on the touch-down area: (a) Evaluation of SLL, (b) Detail.
Sustainability 13 00652 g007
Figure 8. Left: visualisation of the monitoring results with the AR use; Right: visualisation of the monitoring results with the AR use (the detail display).
Sustainability 13 00652 g008
Table 1. Parameters of regression plains R1, R2 and R3 and their evaluated accuracy.
Parameters of Regression PlainabcD
R1−0.011018−0.00511610
R2−0.017345−0.00487810
R3−0.011022−0.00511310
The accuracy of the regression plain parameters [m]
R11.6810 × 10−51.2756 × 10−511
R20.9783 × 10−50.7669 × 10−511
R31.5154 × 10−51.1416 × 10−511
Table 2. Vertical departures between individual time dimensions measures.
Vertical DeparturesΔ (m)Δ (cm)↓ Descent
↑ Ascent
ΔR1/R0 max0.006390.64plane ↑
ΔR1/R0 min−0.03274−3.27plane ↓
ΔR1/R0 avg−0.01219−1.22plane ↓
ΔR2/R0 max0.009230.92plane ↑
ΔR2/R0 min−0.02787−2.79plane ↓
ΔR2/R0 avg−0.00885−0.89plane ↓
ΔR3/R0 max0.005100.51plane ↑
ΔR3/R0 min−0.03124−3.12plane ↓
ΔR3/R0 avg−0.01083−1.08plane ↓
Note: ↓ represents negative displacement or descent of the plane and ↑ represents the ascent of the plane.
Publisher’s Note: MDPI stays neutral with regard to jurisdictional claims in published maps and institutional affiliations.

