Abstract
There is a vast amount of literature on relations between air transport activities and economic growth. The recognition that these are important relationships has aroused the interest of researchers, who have studied them with regard to remote towns. The empirical studies have concentrated more on developed areas, such as Europe, North America, and Australia. No empirical studies were found for Brazil, which holds most of the Amazon region. In this study, the Granger causality method was used to investigate for causal relationships between regular domestic air passenger transport links and the gross domestic product of small municipalities in this region. The results indicate short- and long-term, two-way causality in which gross domestic product has a stronger impact on air transport than vice versa.
1. Introduction
A number of researchers have studied causality between air transport and economic growth [1,2,3,4]. However, rarely has such causality been studied as regards remote towns in developing countries. This is the case with small towns in Brazil’s North region, comprising practically all of the Brazilian Amazon, which is, logistically, a void. Towns in the interior of the region are hard to access by any means except air, while the most common alternative to air transport is poor-quality river transport using wooden barges. The research field related to remote cities in the Amazon region includes the study of Ventura et al. [5], which focuses on the price–income elasticity of the demand regarding domestic passengers in air links from remote cities of the Brazilian Amazon. Different from Ventura et al. [5], this article seeks to understand causal relations between regional domestic aviation and the economies of towns in the interior of Brazil’s North region, which fall into the category of “remote” localities found in the literature. The initial hypothesis was that the regional domestic passenger air transport network is an important indicator of the development of remote localities. The circular effects that exist between air transport and economic development almost always pose the “chicken and egg” dilemma—which came first? Generally speaking, in an environment of industry deregulation, Brazilian airlines have preferred to establish links where they identify prospects of demand [6]. However, when supply is introduced, it stimulates the local economy, which in turn drives growth in demand. To a point, the retraction of regional aviation in Brazil in recent years indicates that airlines and government are unaware of the benefits that encouraging such activity can yield to society and business. This is evident in the conservative attitudes of both government and airlines, as reflected, in recent years, in the steady reduction in the number of regional airports operating with regular air transport in the Brazilian network.
The Brazilian North region, if it were a separate country, would be the seventh largest in the world in terms of territorial extension. Regular intra- and inter-regional domestic air passenger traffic involving its remote towns takes on complex features, calling for a better understanding of relations between these passenger flows and local economies. In this study, causal relations between air transport and economic growth were analysed, given considerable interest in the region and the lack of studies in this regard. The related literature review indicated that the most appropriate method for this purpose was Granger causality analysis. That analysis was made especially robust by a sample of origin-destination data for domestic regular aviation passengers made available by Brazil’s National Civil Aviation Agency (ANAC) and starting in 2011.
In examining in relations between regular passenger air transport and economic growth in the North region of Brazil, this article is intended not only to address the question of precedence or simultaneity, but also to establish level of impact. The intention is to inform business measures and policies of state for remote localities, taking the Brazilian Amazon as its case example. One special characteristic of this study is that it considers a period when Brazil’s economy was being deregulated and air transport, consequently, liberalised. Fageda et al. [2] reviewed studies in this field, showing that the policies Brazil applied were based solely on supporting improvements to non-state capital city airports, which failed to yield positive results in response to the nationwide decline in regional aviation. Accordingly, this article works with inter-airport origin and destination passenger flows, which is the prime objective of air transport in such localities.
The remainder of the paper is organised as follows: Section 2.1 sets out a brief review of the papers considered most important to specifying the analytical methodology of the study; Section 2.2 describes the stages of the research and the Granger causality procedure; Section 3.1 contextualises the case of Brazil’s North region, and describes its characteristics at selected points in the study period; Section 3.2 shows the data used in the study in the form of descriptive statistics; Section 4 offers the results of applying the analytical methodology and discusses those results; and, lastly, Section 5 concludes and gives suggestions for future research.
2. Materials and Methods
2.1. Literature Review
There is a considerable amount of literature reporting on research into causality between air transport and economic growth. One of the main analytical tools for this, the Granger causality, which was conceived by the 2003 Nobel laureate in Economics, Clive William John Granger, is widely used in a variety of research fields, such as economics and business finance [7,8,9], tourism [10], and geography and transportation [11,12,13]. However, studies addressing the issue of air traffic in remote areas and its relationship with the economic development of these regions are scarce.
In the field of air transportation research, the approach is usually to examine air traffic as a whole using, for example, movement at airports as the basis for analysis. The relations most examined are between airport passenger movement and employment and income, although there are studies on other issues. By and large, the studies of aviation and remote localities interlink with studies of regional aviation, on issues of subsidies: public service obligation (PSO), social services provided by state-owned airlines, and government essential air service (EAS) programmes. The studies are concentrated in specific areas of Asia, Australia, Europe, and North America. In these areas, the existing transport network is far more developed than in remote regions of Latin American countries. The literature review focuses on a set of articles selected to support the definition of the paper’s methodology. Among the studies reviewed, some examined below are more relevant to issues of the hinterlands of some of the regions mentioned.
Özcan [14] sought to show causality between passenger air transport and possible effects on the composition of local employment in 31 Turkish provinces. Two-way causality was addressed by using a two-stage, least-squares estimation, deploying two instrumental variables. Özcan concluded that a 10% per capita increase in air passenger traffic would produce 15,013 service-related job positions in the 31 provinces considered. He reported that, in 2010, only 5 airports in Turkey were profitable. Assessment of the airport system on the basis of such financial records can be misleading, though, because it can conceal economic benefits of the air transport system that are hard to quantify.
Mukkala and Tervo [15] endeavoured to determine the nature of the causality between air transport and the economy in peripheral portions of different types of regions of western Europe. Their analysis used annual data for 86 subnational regions in 13 countries from 1991 to 2010. Applying Granger causality analysis as their technical support, they obtained evidence of causality in those relations, suggesting that regional growth caused airport activity, while airport activity seemed to drive regional development. They reported that the same did not occur in the central regions, where airport activity did not cause regional growth, but regional growth did cause airport activity.
Özcan [16] examined the economic contribution made to small and remote communities by flights under the essential air service programme (EAS). His estimation method revealed the existence of a statistically significant relationship between air passenger movement on regular commercial flights at an airport belonging to the EAS and per capita income in the locality. He found that a 1% increase in movement at an airport with minimum annual traffic of 1000 passengers may generate a 0.12% rise in the per capita income of the community in the airport influence area.
Baker et al. [17] used the Granger methodology to examine empirically for catalytic impacts between regional air transport and economic growth in Australia. Their sample comprised annual passenger movement data from 88 airports and real aggregate taxable income. They found clear evidence of short- and long-term two-way Granger causality between these two variables. In the remote areas, they suggested that any public financial support to airports should be directed to themselves.
Van De Vijver et al. [4] analysed causal links between volume of air passengers transported and regional development expressed as number of jobs in Europe. They applied Granger causality analysis to a sample from 112 areas of 18 countries, from 2002 to 2011. They suggested that caution should be used in stimulating local economic growth by expanding supply of air transport services, because such investments do not always result in compatible increases in employment.
Fageda et al. [18] analysed the effect of prices and frequencies on air connectivity in remote regions under different public policies. They stressed that the possible positive effects of such policies should be balanced versus their costs, because they may entail very high public subsidies. They also noted that public policies need to play a substantial role in supporting air connectivity in remote communities.
The literature indicates that the relationship between air transport and regional economy differs in different regions of the world and that the Granger causality analytical methodology has proven suited to this kind of study. The lack of studies of Latin America, whose sub-regions display quite different conditions, leaves open the question of how this relationship works in Brazil’s North region, where the Brazilian Amazon is located. Fenley et al. [19] discussed models of development in the region and showed that air transport can play a fundamental role, particularly as regards sustainable development. However, they did not examine for causal relations nor their possible impact.
2.2. Methodology
The three-stage methodology entailed, first, organising, describing, and cleaning the available data in line with the study objective. At this stage, the study sample was specified. The second stage involved analysing the data in order to specify the causality modelling to be applied. The third stage was to calculate and analyse the short- and long-term causality indicators, which would reveal the levels of impact among the variables used.
Granger [20], who set out the fundaments of the analytical methodology selected for this study, maintained that simple correlation between historical series does not indicate causality. Soytas and Sari [21] argued that, by demonstrating the statistical precedence of one historical series over another, this methodology indicates causality in the historical period studied. Not only the indicators calculated by applying the methodology, but also the rational argument regarding the relationship between the series in question, are fundamental to accepting such causality. Since its original formulation, the methodology has undergone new developments several times and is well documented in the academic literature, e.g., in Hsiao [22] and Washington et al. [23]. The corresponding analytical procedures are now available in freeware and commercial software, including Eviews, Mathlab, and R. Accordingly, this paper uses the analytical sequence of the Granger causality methodology. This sequence involves analysing stationarity, cointegration, and causality between economic series and air passengers at remote towns in Brazil’s Amazon region. The dynamic impact among the variables is analysed by impulse response (IR) and variance decomposition (VDC) indicators of the causality modelling.
Stationarity is the first condition to be met in analysing the time series. If stationarity is not confirmed, the series must be transformed. The first transformation often used in such analyses is applying the natural logarithm to the series. The second is the differences in values from one period to another. Maddala and Wu [24] propose the Levin, Lin, and Chu and PP-Fisher tests to evaluate the number of differences necessary to make the non-stationary series, I(1), stationary, I(0).
In the second step, cointegration testing of the series determines whether they have a linear combination that is stationary. If the tests encounter cointegrating equations, then the hypothesis of long-run relations between the series is confirmed. The presence of cointegrating equations between the series recommends using the error correction model (ECM) as the instrument for analysing Granger causality [25,26]. Johansen [27,28] specified estimation of a p-order vector autoregressive (VAR) model as a suitable instrument for testing for cointegration between historical series. Equations (1) and (2) show a formulation used to examine for cointegration as proposed by Johansen.
where
is a k-vector of non-stationary variables I(1);
is a d-vector of deterministic variables;
is an innovation vector.
Engle and Granger [25] set out the bases for analysis on the Granger theorem, as in Equations (1) and (2), which identify the number of cointegration relations for each test proposed by Johansen [27,28]. The Johansen cointegration test considers two parameters in specifying each test: the first regarding trend (e.g., none, linear, quadratic) and the second, whether or not to use an intercept. The number of cointegration vectors is determined using likelihood ratio testing known as the trace statistic.
In the event the series are not cointegrated, the direction of causality can be determined by the F-standard test on the VAR. That is achieved by estimating the bivariate equations (Equations (3) and (4)):
for all possible pairs of the series (x, y) in the group. Thus, the Wald F-statistic test is used to detect whether Granger X causes Y (Hassapis et al. [29]; Toda and Phillips [30,31]) for the joint hypotheses (5).
As mentioned above, if cointegrating equations are identified for the series, the ECM should be used. This can be represented by Equations (6) and (7), whose coefficients and statistical significance tests indicate the short- and long-run relations between the series.
In Equations (6) and (7), λ is a constant and the lags considered for the series in the short-run analysis are represented by i and j. These lags must be sufficient for the disturbance term, , to be white noise. The estimated coefficients ’s of and ’s of with their statistical significance tests provide the bases for analysing the immediate impacts on the dependent variables, and , i.e., the short-run analysis. The coefficients of this analysis represent the expected short-term elasticities. is the cointegration vector (Equation (8)), whose coefficient, φ, gives the dimension of long-run speed of adjustment between the series. The long-run elasticity of Y with respect to X is estimated as of the cointegration vector (Equation (8)). In these analyses, the level of significance of each of the coefficients is given by t-statistic tests.
The appropriate number of lags is an issue in time series analysis. The causality methodology imposes constraints on the observed data because only a small proportion of the sample data can be used, i.e., only those data that satisfy all the conditions set. The larger the number of lags used in the analysis, the smaller the number of observations available will be. Several scholars point out methods to determine a model’s optimum lag length (Davidson and MacKinnon [32]; Hakim and Merkert [33]; Maddala [34]). The study period was 6 years and unbalanced panel data were used. The study sample does not allow an application of the methodologies to optimise the number of lags. Accordingly, analyses based on 1 lag and 2 lags were performed, which was considered appropriate to the sample data characteristics.
3. Results
3.1. Case Study
Brazil has 26 states and a nation’s capital district, distributed into 5 regions: North (N), Southeast (SE), Mid-West (MW), Northeast (NE), and South (S). In each state, one municipality holds the state capital. IBGE [35] shows that from the total of 5570 Brazilian municipalities, 309 had populations of more than 100,000 in 2016. Of those, only eight were in the North region. The North region, the largest of the five regions, covers an area of 3.9 million km2, equivalent to 45.25% of Brazil’s total territory. Its population was 17.7 million in 2016. The North region comprises seven states, which are Acre, Amazonas, Amapá, Pará, Rondônia, Roraima, and Tocantins. Its largest and most important cities are Belém and Manaus, the only cities with populations of more than 1 million. Other important centres in the region are Porto Velho, Macapá, Palmas, Rio Branco, and Boa Vista. The North region holds most of the Legal Amazon, an ecosystem widely acknowledged to be important to the planet. Brazil’s three largest municipalities in area are located in the North region (Altamira, Barcelos, and São Gabriel da Cachoeira), each covering more than 100,000 km2, larger than many countries. The North region has the wettest climate in Brazil—its rainy season is clearly defined and features large volumes of rain, flooding areas served by roadways and making access possible only by air. Appendix A (Figure A1) shows a map of the North region with the ICAO (International Civil Aviation Organization) acronym of the airports studied.
The networks and flows study conducted by IBGE [36] stresses that road transport predominates in Brazil, except in the Amazon region. In the North region, it is unevenly distributed, and some parts are often completely isolated. The study shows the uneven distribution of the transport logistics network between the North and other regions of Brazil. In the North region, passenger transport is predominantly by water and the distances between towns are large, entailing long travel times. In addition, it is relevant to highlight that the improvement of water transport in this region is as much challenging as the road transport because of the natural conditions of the Amazon regions, which entails different sizes of rivers, a complex hydrological cycle (which means that there can be periods of the day or of the year that the volume of rivers may be lower or higher in different parts of the region), geomorphology of the rivers, and other natural conditions that can be barriers for the improvement of water transport [37]. Therefore, the limited road system and difficulty to further improve water transport services leaves the region more dependent on air transport for its socioeconomic development.
In this study, the analyses assumed that the variations observed in the sample of the main municipalities served by airports in the interior of the North region of Brazil reflect the behaviour of the causality between air transport and remote towns’ economy, because neither passengers nor airlines are subsidised. Fageda et al. [2] wrote that “In Brazil, the federal government provides co-funding for projects for the improvement or expansion of capacity at small and/or unprofitable airports (managed by states/municipalities) through a specific program (Programa Federal de Auxílio a Aeroportos)”.
Table 1 shows change in the number of towns with regular domestic air transport, passengers embarked at the airports (PAX), and socioeconomic data for the sample in the study period. It can be seen from the table that PAX peaked in 2013, after which it went into decline, which was most marked in 2016, when Brazil entered an acute economic and political crisis. The number of towns served decreased over the years, thus reducing the population (POP) served by regular air transport. Accordingly, the decrease in passenger numbers reflects two effects, the first resulting from the economic crisis and diminishing gross domestic product (GDP) and the second, the reduction in service supply. Although there is a historical feeling in Brazil regarding the need for economic development in remote areas, there is a reduction of 11 remote towns served by regular air transport from 2011 to 2016, which substantially reduces the economic growth potential of these locations. Fenley et al. [19], discussing accessibility and mobility issues, argue that air transport is part of a sustainable development model for the Amazon region.

Table 1.
Passengers embarked on regular domestic air transport at remote localities in the North region of Brazil.
In this study, the term “regional” refers to airports and towns that are not state or national capitals; thus, “capital” refers to the latter cities as destinations. Table 2 shows seats sold in the sample in three specific years. The first was when data began to be available; the second, the year when the FIFA (Fédération Internationale de Football Association) championship was held in Brazil; and the third, the end of the study period, representing two years of recession in Brazil’s economy (2015 and 2016). Table 3 shows the percentage variation in the three years observed. In the tables, note that the links most affected in the study period were routes within the North region. From 2011 to 2014, there was growth in activities on origins and destinations (O-Ds) linking the North with the Northeast and Southeast regions; on others, the trend was downwards. In inter-regional movement involving the North region, airline passenger volume grew from a 30% to a 70% share in total movement, which indicates greater resilience in links with towns other than state capitals elsewhere in Brazil. Similarly, seats sold to state capital destinations grew from 36% to 45%, with continuous growth on such links to the Northeast region. These data confirm that movement out of the region is more resilient to economic crises than on intra-regional routes, which sometimes offer transport options more compatible with income in times of crisis. These statistics also show a tendency to strengthen the connections of remote towns in the Amazon region with the Southeast, Northeast, and South regions of the country, with a weakening of the flow with the capitals of the northern region.
Table 2.
Passengers embarked at the airports (PAX) in the sample for non-state-capital towns in the North region, by destination.
Table 3.
Change in PAX of the sample at non-state-capital towns in the North region, by destination.
3.2. Data
The air transport data used in the article were sourced from the ANAC micro-database [38], which shows the number of seats sold on each trip, i.e., from origin to destination, by month, for the period from 2011 to 2016. One first step in preparing the sample was to identify isolated towns and to transform the data into annual movement between O-Ds. Brazil-wide analysis revealed that towns in the North region displayed the characteristics “remote” and “isolated”. Therefore, the towns served by airports with regular domestic aviation in the North region were selected to form part of the sample. According to ANAC, these data represent about 50% of total movement in each year, because the database does not include tickets acquired through frequent flyer programmes and specific agreements between purchasers and airlines. The socioeconomic data, specifically gross domestic product (GDP) of the municipalities in the study area, were sourced from the Brazilian Institute of Geography and Statistics (IBGE). The period from 2011 to 2016 was selected because of the availability of data for this same period from the two sources used in this research.
The database is directional, i.e., it considers outward tickets from towns other than state capitals in the North region (N) to destinations within and outside the region. The data relate to 33 airports with 1372 O-Ds identified during the study period. Figure A1 (in Appendix A) shows a map of Brazilian regions with the location of the airports considered in the study, and Table A1 in Appendix B shows the airports’ ICAO codes; the towns served by each airport, identifying the name of the corresponding state; and the abbreviations of the seven states of the North region. Thus, there is an unbalanced data panel, because not all O-Ds are present throughout the analysed period.
The analytical model includes three proxies for analysis, one representing regular aviation and two representing the economy. The first is the natural logarithm of PAX from the town classified as remote or isolated to a domestic destination (LPAX), and the other two represent the economy by way of the natural logarithms of the GDPs of the municipalities of the towns of origin (LOGDP) and destination (LDGDP) served by the airports. Table 4 shows the model variables descriptive statistics.
Table 4.
Descriptive statistics.
It can be seen from Table 4 that the standard deviation of the variable “seats” is rather high, reflecting a significant variety of situations ranging from lower-density links to high-density links. Meanwhile, the standard deviation of the two economic variables is small, showing a concentration about the mean. It is relevant to highlight that Table 4 is based on existing records in the ANAC database and their correspondents in the IBGE database, which after being consolidated into annual data, presented the profile described in this section. As it is an unbalanced panel database, O-Ds do not necessarily present data for all years. If it were a balanced database there would be 8232 data, when actually there is 5231. Data exclusion is promoted by the application of ECM, which works with the first difference in the data and with lags. The absence of the possibility of calculating the first difference in the data and the lags used give the dimension of data exclusion.
The sample contains small, isolated localities that are tourist spots or of strategic interest to Brazil. One example is Parauapebas, in Pará State, where there is a large iron ore mine belonging to the Vale do Rio Doce company. Another example is Coari, an isolated locality in Amazonas State, in the Amazon forest, where there is significant production of natural gas. One example of an important tourist destination in Amazonia is the town of Parintins, where the Festa do Boi festival is internationally famous.
4. Discussion
This section examines causality between annual flows of passengers embarked at remote towns and those towns’ GDPs, in light of the change in the local economy from 2011 to 2016. The analysis considered passenger flow O-Ds from remote towns in the North region to destinations in towns in the same region and towns in other regions of Brazil. The analytical methodology considered the dynamics of changes observed since the year the ANAC began to record O-D micro-data (2011), through to the latest year for which the IBGE published municipal GDP figures (2016). Over that period, air passenger transport movement was observed to prosper from 2011 to 2014 and subsequently to decline in 2015 and 2016 (Table 1).
The first step in the analysis involved checking for the presence of I(1) series in the study. Table 5 shows that, whether for a common unit root process or an individual unit root process, the first difference of the variables rejects the hypothesis of I(1) series in the sample.
Table 5.
Panel unit root test.
The next step involves the cointegration analysis. Table 6 shows the Johansen cointegration test results for the study sample, which identified cointegration of variables in all the test types, with at least two cointegration equations. These results occur when one or two lags are considered, while the 1-lag tests resulted in three equations in all the cointegration equation types considered. The tests indicated the presence of variables’ long-term relationship. That result calls for an ECM to be used for analysing causality.
Table 6.
Johansen cointegration tests by selected models *.
Table 7 shows the results from the ECM estimates, considering the three study variables for the sample of remote towns. Two configurations are given: the first considers two lags and the second considers one lag. A historical series with six periods does not allow the use of robust tests to define the most appropriate number of lags, and thus we chose to carry out the experiments with one and two lags and analyse the consistency between the models. In both configurations, the cointegration equations returned significant t-statistics for the coefficients. The t-statistics of the cointegration equations (CointEq) showed that there is a long-term, two-way causality between LPAX and LOGDP for the remote towns. In the short term, t-statistics for the regression coefficients indicated a relationship from LPAX to LOGDP in both first and second lags. The inverse relationship, however, was observed only in the first lag. The relationship between the LOGDP of the destination town and both LPAX and LOGDP of the remote town proved significant in the first lag. These results show that air transport was important to the development of remote towns in the North region of Brazil, where the Brazilian Amazon is concentrated. As shown earlier in this study, Table 2 and Table 3 indicate that links out of the region were resilient to economic crises—movement declined less and even grew on links with capitals outside the region.
Table 7.
Error correction model estimates *.
The impulse response analysis given in Figure 1 shows the accumulated response of LPAX to LOGDP innovations at remote towns (and vice versa). LOGDP had a greater impact on LPAX than LPAX on LOGDP, although both impacts were found to be significant. There is supposed to be a symbiotic relationship between these variables. The one-lag model configuration indicated greater impact.
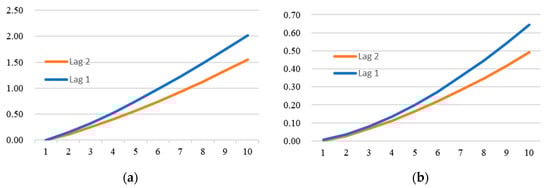
Figure 1.
Response to Cholesky 1 SD (df – degrees of freedom – adjusted) innovations: (a) accumulated response of natural logarithm of PAX from the town classified as remote or isolated to a domestic destination (LPAX) to natural logarithms of the GDPs of the municipalities of the towns of origin (LOGDP); (b) accumulated response of LOGDP to LPAX.
The variance decomposition analysis shown in Figure 2 confirmed the positive effects of one variable on the other. These two latter analyses showed a positive dynamic between air transport and economic growth of towns in remote localities in the Brazilian Amazon. Measuring that relationship in the North region of Brazil adds important knowledge to air transport planning in that region. That fact is important to raising the awareness of planners of developing economies such as Brazil’s, who need to have parameters for deciding where to invest their countries’ limited resources. Air transport is an activity that has always been connected with the generation of high-value-added services and attracts such services to the localities where it operates. The reduction in the number of airports offering regular air transport services in Brazil must be considered cause for concern, particularly as regards remote localities. In other words, as expressed in Fenley et al. [19], air transport can contribute effectively to a more sustainable model of development in the region.
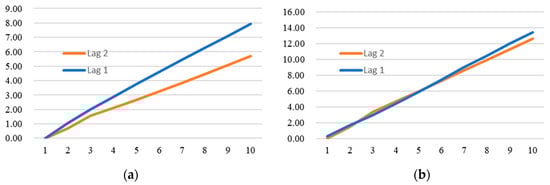
Figure 2.
Variance decomposition using Cholesky (df adjusted) factors: (a) percentage LPAX variance due to LOGDP; (b) percentage LOGDP variance due to LPAX.
5. Conclusions
This article analysed the causality between domestic air passenger transport and economy of remote towns in the North region of Brazil by using domestic passenger origins and destinations data, and remote town economy represented by the GDP of municipalities. However, it was limited by sample data availability—this restricted, on the one hand, the starting year and profile of ticket types sold and, on the other, the end year of the analysis (for which GDP data were available). Nevertheless, it must be remembered that the sample included the portions most sensitive to the economic changes that occurred in the period. The sample was not random, but rather a full sample of a profile of passengers of prime importance to airline planning, i.e., those customers who purchase an airline ticket at the market price at the time of purchase.
The results point to a dual effect, of the economy on air transport and of the latter on the economy of remote towns, in the short and long term. Once a link is set up between a remote town in the study and other towns, particularly state capitals, the GDP of the destination will leverage passenger demand, which in turn will have positive effects on the economy of the remote town. It is not a one-way process, however. The study showed cointegration between the economy and air transport, the error correction model returned significant coefficients reflecting both short- and long-term impacts on air transport and on the economies involved in the air links, both of which were positive. It is thus important to maintain the air links between Brazil’s developed towns and those that are remote, so as to harness the potential benefits to be obtained from these interactions and thus foster development of its more remote regions. Since 2016, the country has been managing a situation of economic crisis that resulted in the impeachment of the country’s president in the same year. Moreover, this situation has worsened with the occurrence of the pandemic in 2020, already in the second year of the mandate of the new president elected in 2018. The characteristics of the analysed period indicate that the results will be adequate for the prospect of ending the pandemic influence over the economy.
Future studies should involve the impact of the price on the demand for air transport in the connections with remote towns in order to guide the air transport operators in deciding the offer of connections and the government in the definition of policies. Furthermore, there is a need to understand the relationship between specific economic activities of remote towns and air transport.
Author Contributions
Conceptualisation, V.A.F., E.F. and R.R.P.; formal analysis, R.R.P., E.F., M.C., R.C., R.V.V. and V.A.F.; funding acquisition, E.F., R.R.P., M.C., R.C., R.V.V. and V.A.F.; investigation, E.F., R.R.P., M.C., R.C., R.V.V. and V.A.F.; project administration, V.A.F., M.C. and R.V.V.; writing—original draft, V.A.F., E.F., M.C., R.C., R.V.V. and R.R.P.; writing—review and editing, V.A.F., E.F., M.C., R.C., R.V.V. and R.R.P. All authors have read and agreed to the published version of the manuscript.
Funding
This research received no external funding.
Institutional Review Board Statement
Not applicable.
Informed Consent Statement
Not applicable.
Acknowledgments
The authors would like to thank the editor and anonymous reviewers for their insightful comments and suggestions.
Conflicts of Interest
The authors declare no conflict of interest.
Appendix A

Figure A1.
Location of airports with regular air transport the North region of Brazil during the study period.
Figure A1.
Location of airports with regular air transport the North region of Brazil during the study period.

Appendix B
Table A1.
Airports in each town, by state, and number of towns, in the North region—IDs relate to Figure A1.
Table A1.
Airports in each town, by state, and number of towns, in the North region—IDs relate to Figure A1.
| ICAO | Town/Municipality * | State | Number of Towns/Municipalities |
|---|---|---|---|
| SBCZ | Cruzeiro do Sul | Acre (AC) | 1 |
| SWBC | Barcelos | Amazonas (AM) | 14 |
| SWCA | Carauari | ||
| SWKO | Coari | ||
| SWEI | Eirunepé | ||
| SWOB | Fonte Boa | ||
| SWHT | Humaitá | ||
| SWLB | Lábrea | ||
| SBMY | Manicoré | ||
| SWPI | Parintins | ||
| SWTP | Santa Isabel do Rio Negro | ||
| SBUA | São Gabriel da Cachoeira | ||
| SDCG | São Paulo de Olivença | ||
| SBTT | Tabatinga | ||
| SBTF | Tefé | ||
| SBMD | Almeirim | Pará (PA) | 13 |
| SBHT | Altamira | ||
| SBAA | Conceição do Araguaia | ||
| SBIH | Itaituba | ||
| SBMA | Marabá | ||
| SNOX | Oriximiná | ||
| SDOW | Ourilândia do Norte | ||
| SBCJ | Parauapebas | ||
| SNDC | Redenção | ||
| SNKE | Santana do Araguaia | ||
| SBSN | Santarém | ||
| SNFX | São Félix do Xingu | ||
| SBTU | Tucuruí | ||
| SSKW | Cacoal | Rondônia (RO) | 3 |
| SBJI | Ji-Paraná | ||
| SBVH | Vilhena | ||
| SWGN | Araguaína | Tocantins (TO) | 2 |
| SWGI | Gurupi |
* In this study, the town that is the seat of municipal government has the same name as the municipality and the socioeconomic data refer to the municipality.
References
- Fageda, X.; Flores-Fillol, R. Air services on thin routes: Regional versus low-cost airlines. Reg. Sci. Urban Econ. 2012, 42, 702–714. [Google Scholar] [CrossRef]
- Fageda, X.; Suárez-Alemán, A.; Serebrisky, T.; Fioravanti, R. Air connectivity in remote regions: A comprehensive review of existing transport policies worldwide. J. Air Transp. Manag. 2018, 66, 65–75. [Google Scholar] [CrossRef]
- Gössling, S.; Fichert, F.; Forsyth, P. Subsidies in aviation. Sustainability 2017, 9, 1295. [Google Scholar] [CrossRef]
- Van De Vijver, E.; Derudder, B.; Witlox, F. Air passenger transport and regional development: Cause and effect in Europe. Promet–Traffic Transp. 2016, 28, 143–154. [Google Scholar] [CrossRef]
- Ventura, R.V.; Cabo, M.; Caixeta, R.; Fernandes, E.; Aprigliano Fernandes, V. Air transportation income and price elasticities in remote areas: The case of the Brazilian Amazon region. Sustainability 2020, 12, 6039. [Google Scholar] [CrossRef]
- Fernandes, V.A.; Pacheco, R.R.; Fernandes, E.; Silva, W.R. Regional change in the hierarchy of Brazilian airports 2007–2016. J. Transp. Geogr. 2019, 79, 102467. [Google Scholar] [CrossRef]
- Irandoust, M. House prices and unemployment: An empirical analysis of causality. Int. J. Hous. Mark. Anal. 2019, 12, 148–164. [Google Scholar] [CrossRef]
- Swamy, V.; Dharani, M. Thresholds of financial development in the Euro area. World Econ. 2019. [Google Scholar] [CrossRef]
- Wajda-Lichy, M.; Kawa, P.; Fijorek, K.; Denkowska, S. Trade openness and financial development in the new EU member States: Evidence from a granger panel bootstrap causality test. East. Eur. Econ. 2020, 58, 242–263. [Google Scholar] [CrossRef]
- Fernandes, E.; Pacheco, R.R.; Fernandes, V.A. Tourism openness, trade openness, and currency-purchasing power in Brazil: A causality analysis. Int. J. Tour. Res. 2019, 21, 197–205. [Google Scholar] [CrossRef]
- Pacheco, R.R.; Fernandes, E. International air passenger traffic, trade openness and exchange rate in Brazil: A Granger causality test. Transp. Res. Part A 2017, 101, 22–29. [Google Scholar] [CrossRef]
- Pradhan, R.P. Investigating the causal relationship between transportation infrastructure, financial penetration and economic growth in G-20 countries. Res. Transp. Econ. 2019, 78, 100766. [Google Scholar] [CrossRef]
- Tong, T.T.; Yu, T.E. Transportation and economic growth in China: A heterogeneous panel cointegration and causality analysis. J. Transp. Geogr. 2018, 73, 120–130. [Google Scholar] [CrossRef]
- Özcan, İ.Ç. Air passenger traffic and local employment: Evidence from Turkey. Eur. J. Transp. Infrastruct. Res. 2013, 130, 336–356. [Google Scholar]
- Mukkala, K.; Tervo, H. Air transportation and regional growth: Which way does the causality run? Environ. Plan. Econ. Space 2013, 45, 1508–1520. [Google Scholar] [CrossRef]
- Özcan, İ.Ç. Economic contribution of essential air service flights on small and remote communities. J. Air Transp. Manag. 2014, 34, 24–29. [Google Scholar] [CrossRef]
- Baker, D.; Merkert, R.; Kamruzzaman, M. Regional aviation and economic growth: Cointegration and causality analysis in Australia. J. Transp. Geogr. 2015, 43, 140–150. [Google Scholar] [CrossRef]
- Fageda, X.; Suárez-Alemán, A.; Serebrisky, T.; Fioravanti, R. Air transport connectivity of remote regions: The impacts of public policies. Reg. Stud. 2019, 53, 1161–1169. [Google Scholar] [CrossRef]
- Fenley, C.A.; Machado, W.V.; Fernandes, E. Air transport and sustainability: Lessons from Amazonas. Appl. Geogr. 2007, 27, 63–77. [Google Scholar] [CrossRef]
- Granger, C.W.J. Investigating Causal Relations by Econometric Models and Cross-spectral Methods. Econometrica 1969, 37, 424–438. [Google Scholar] [CrossRef]
- Soytas, U.; Sari, R. Energy consumption and GDP: Causality relationship in G-7 countries and emerging markets. Energy Econ. 2003, 25, 33–37. [Google Scholar] [CrossRef]
- Hsiao, C. Analysis of Panel Data; Cambridge University Press: New York, NY, USA, 2014. [Google Scholar]
- Washington, S.P.; Karlaftis, M.G.; Mannering, F.L. Statistical and Econometric Methods for Transportation Data Analysis; CRC Press—Taylor & Francis Group: Boca Raton, FL, USA, 2011. [Google Scholar]
- Maddala, G.S.; Wu, S. A comparative study of unit root tests with panel data and a new simple test. Oxf. Bull. Econ. Stat. 1999, 61, 631–652. [Google Scholar] [CrossRef]
- Engle, R.F.; Granger, C.W.J. Co-integration and error correction: Representation, estimation and testing. Econometrica 1987, 55, 251–276. [Google Scholar] [CrossRef]
- Granger, C.W.J. Causality, cointegration and control. J. Econ. Dyn. Control 1988, 12, 551–559. [Google Scholar] [CrossRef]
- Johansen, S. Estimation and hypothesis testing of cointegrating vectors in Gaussian vector autoregressive models. Econometrica 1991, 59, 1551–1580. [Google Scholar] [CrossRef]
- Johansen, S. Likelihood-Based Inference in Cointegrated Vector Autoregressive Models; Oxford University Press: Oxford, UK, 1995. [Google Scholar]
- Hassapis, C.; Pittis, N.; Prodromidis, K. Unit roots and Granger causality in the EMS interest rates: The German dominance hypothesis revisited. J. Int. Money Financ. 1999, 18, 47–73. [Google Scholar] [CrossRef]
- Toda, H.; Phillips, P.C.B. Vector autoregressions and causality. Econometrica 1993, 61, 1367–1394. [Google Scholar] [CrossRef]
- Toda, H.; Phillips, P.C.B. Vector autoregressions and causality: A theoretical overview and simulation study. Econom. Rev. 1994, 13, 259–285. [Google Scholar] [CrossRef]
- Davidson, R.; MacKinnon, J.G. Estimation and Inference in Econometrics; Oxford University Press: New York, NY, USA, 1993. [Google Scholar]
- Hakim, M.M.; Merkert, R. The causal relationship between air transport and economic growth: Empirical evidence from South Asia. J. Transp. Geogr. 2016, 56, 120–127. [Google Scholar] [CrossRef]
- Maddala, G. Introduction to Econometrics, 3rd ed.; McGraw-Hill: New York, NY, USA, 1992. [Google Scholar]
- IBGE (Brazilian Institute of Geography and Statistics). Banco de Tabelas Estatísticas. Divisão Regional do Brasil. Estimativas da População. 2017. Available online: http://sidra.ibge.gov.br/home/lspa/brasil (accessed on 18 March 2020).
- IBGE (Brazilian Institute of Geography and Statistics). Redes e Fluxos Geográficos–Logística de Transportes. Rio de Janeiro. 2019. Available online: https://www.ibge.gov.br/geociencias/organizacao-do-territorio/redes-e-fluxos-geograficos/15793-logistica-dos-transportes.html (accessed on 16 March 2020).
- Morgado, A.V.; Portugal, L.D.S.; Mello, A.J.R. Accessibility in the Amazon region through the water transportation. J. Transp. Lit. 2013, 7, 97–123. [Google Scholar] [CrossRef]
- ANAC, Dados Estatísticos. 2018. Available online: http://www.anac.gov.br/assuntos/dados-e-estatisticas/microdados-de-tarifas-aereas-comercializadas (accessed on 10 December 2018).
- MacKinnon, J.G.; Haug, A.A.; Michelis, L. Numerical distribution functions of likelihood ratio tests for cointegration. J. Appl. Econom. 1999, 14, 563–577. [Google Scholar] [CrossRef]


Publisher’s Note: MDPI stays neutral with regard to jurisdictional claims in published maps and institutional affiliations. |
© 2021 by the authors. Licensee MDPI, Basel, Switzerland. This article is an open access article distributed under the terms and conditions of the Creative Commons Attribution (CC BY) license (http://creativecommons.org/licenses/by/4.0/).