1. Introduction
Airports are complex structures with highly demanding management. Air traffic is only effective when it provides fast and safe transport of people and goods. This is achieved through the provision of highly efficient airport services, and modern and well-maintained airport infrastructure. Additionally, special attention needs to be paid to runways. Sustainable airport management requires a large amount of data about the structure and condition of airport facilities, airport operations, and the airport’s surroundings. This data must be up-to-date, accurate, and always available to management staff. Although it is possible to obtain this data manually, based on predefined protocols, to do so is a time-consuming activity which is also the source of human errors. Alternatively, data can also be obtained and processed using automatized procedures that are part of existing or developing information systems. The demands for such systems—namely, that they are up-to-date, accurate, and always available—encourages system development to enable automatized acquisition in real-time [
1,
2,
3].
Logistics systems only function effectively and successfully if all the corresponding elements function effectively and successfully. This means that if any element of this chain is not effective and successful, the logistics system will be inefficient and will not achieve its goals [
4]. The quality of logistics infrastructure—that is, the distribution of intermodal objects inside a country and logistics operators—is one of the most important means of strengthening international competition and broadening the market share of the companies [
5]. A systematic approach is needed to assure the quality of logistic infrastructure, i.e., to assure the quality of logistics services. Within the systemic approach, in addition to professional and technical criteria, their impact on the entire economic environment, including the impact on the environment, is taken into account. It is common knowledge for transport (logistics) services that their impact on the environment is not sustainable. That is why it is sensible and necessary in the processes of transport infrastructure management to do everything to minimize this negative impact.
In the civil engineering profession, sustainable development focuses primarily on environmental protection, recycling, energy efficiency of buildings, and reuse, i.e., on the object and not on the process and other changes that sustainable development brings to the profession. For this reason, process changes, stakeholders involved in the construction process, and their roles are overlooked. So civil engineering is becoming an increasingly interdisciplinary activity and requires the involvement of various disciplines in response to the multidimensionality of sustainable development.
At the term »sustainable development«, we mean multidimensional development that goes beyond environmental, economic, and social development and is realized at the global, national, and local levels. It is based on a consensus of development goals and a process of continuous learning, through which society begins to understand sustainable development and at the same time contributes to solving development problems [
6].
According to [
7], pursuing sustainable development goals requires compromises between: Spatial, social, economic, environmental, technical, and temporal goals, with transparency and comprehensibility of procedures, methods used, and bases for decision-making being of great importance. In the professional literature, there are differences regarding the dimensions of sustainable development according to different authors and according to the profession, but as a rule, they all include social, environmental, and economic aspects [
8,
9].
Taking transport logistics into consideration with special attention to airports, i.e., airport infrastructure it is essential to add the importance of traffic safety in addition to the previously mentioned aspects [
10].
Logistics systems are by definition open systems and thus are vulnerable and open to many global business threats. Accidents and political conflicts can, for example, cause market disruption. Additionally, limitations or blockades of infrastructure can prevent the basic goals of the logistics system from being achieved. Authors [
11] conclude, in their research, that inappropriate and insufficient logistics infrastructure is the second most important factor in inefficient logistics. Authors [
4] suggest a model of direction in the case of accidents or disruptions which limit the function of logistics infrastructure. Air traffic has an important role in the global economy (ICAO« [Safety Report 2018]) and is also a reason to provide appropriate maintenance of the airport infrastructure. This was proven directly by [
12], who emphasized that the improvement of airport infrastructure can reduce the costs of air transport up to 15%, which represents a significant portion of logistics costs, i.e., have an impact to sustainable development of airport infrastructure.
Air traffic systems operators use computer-aided decision support systems called Traffic Management Systems (TMS) for logistics transport systems management. The ATS (Air Transportation System) was developed in parallel due to the specialty of airports. Decision-makers use various technical and economic analyses which are implemented into the PMS (Pavement Management System) for adequate and timely maintenance of the road surface. The APMS (Airport Pavement Management System) is also used to design adequate strategies for runway maintenance, due to the special nature of the airports. This system includes procedures to assist the evaluation and search for adequate maintenance strategies [
13,
14]. Numerous airports globally use APMS [
15]. The usage of computer aided management systems is an essential part of the sustainable management process.
The development of PMS and APMS has been studied often [
16,
17,
18,
19]. The disadvantage of the APMS is that it is intended for larger and more frequently visited airports. In contrast, it is not intended for airports with relatively little traffic, such as the Maribor Edvard Rusjan Airport, which is dedicated to emergency flights, exhibitions, training, and school flights.
One of the most important parts of sustainable management development is a process of gaining data from the real environment. All professional decisions have to be based on real and in-time data. As a rule, different geodetic methods are used to obtain terrain data, which differ according to the ability to detect large amounts of data with appropriate accuracy. Geodetic methods are non-invasive and enable the accurate detection of on the surface data. D’Apuzzo et al [
20] concludes that accurate monitoring and prediction of runway conditions are the main elements of developing measurement models (terrestrial, Global Navigation Satellite System—GNSS methods, and Light Detection And Ranging—LiDAR technology and Synthetic Aperture Radar—SAR interferometry) for researching runway deformities (i.e., deformities on the surface) [
21,
22]. The usage of these approaches has not been researched sufficiently in the accessible literature. Existing models for monitoring the state of the runways are intended for the analysis of runways’ grip. Geodetic methods are excluded from previous research because they do not concern the detection of the deformities on runways. However, the application of geodetic methods enables the detection of the deformities on the surface of the runway.
The researches were focused on smaller regional airports which do not have developed automated model and management and runway maintenance information systems. The runway state is important, especially for the safety of passengers, cargo, aircraft, and the environment. The developed model is based on geodetic and geophysical measurements with which the unevenness is found. The problem of the unevenness is especially in the indentations, which present the problem in the shape of aquaplaning and potential water freezing in the indentations and bulges on which the cracks appear, and thus the invasion of meteor water and polluted particles in the substructure. The innovative model is an open-coded model in which various data can be inserted. The model, based on the algorithm, determines the level and place of damage. Damaged runways can cause a lot of problems. Since we focused on smaller airports which are intended especially for light and ultra-light aircraft, such runway damages can be very inconvenient. They can cause uneven contact of the tire with the surface, bouncing the aircraft from the surface, which can cause the aircraft to turn during flight, and cause suspension and electronic damage. These vibrations can also be inconvenient for passengers and cargo. Not renovated damages can cause the aircraft to slip from the runway, the ultra-light aircraft to overturn on the runway, the cargo to be shattered and the fuel to be spilt. Where the cracks appear, the insert of polluted particles in the underground layers is that much bigger [
23]. The consequences can be catastrophic for people, nature, and other life cycles. The events or trips from the runway when aircrafts land or take-off present the biggest part of the plane crashes and often exceed 25% of all plane crashes of commercial flights (»Safety Report 2018« [IATA], n. d.; »Runway excursion report 2004–2009« [IATA], n. d.; »Safety Report 2018« [ICAO], n. d.; »Global Aviation Safety Plan, 2017–2019« [ICAO], n. d.).
We ask research questions how the measurements on the airport without having to close the airport can be executed and in that way not cause-related financial losses, and how to establish a model which will allow us to fast and qualitatively determine the place and level of damage with the option of augmented reality AR. Finally, will this kind of model be useful for the sustainable and circular economy of the town and region and sustainable management of smaller regional airports?
The added value of this research to this community is a made prototype of the management and maintenance runway model with the option to determine the influences on the environment in the case of accidents.
2. Materials and Methods
The above overview of the accessible literature presents the research problem that was the basis for the ongoing research and preparation of the experiment. The core of this study is the establishment (or optimization of the existing) model of a logistics information system for timely detection of runway deformities based on the monitoring. The aim was to provide relatively fast and easy to obtain data about runway damage, and thus present a relevant foundation for more adequate and timely decision-making about the manner and range of maintenance or renovation. In this study, geodetic monitoring of a runway was executed, and the effectiveness of geodetic methods for monitoring and the development of a monitoring model was evaluated for smaller airports with less relatively low traffic.
This research was tested in a real environment. Execution of such an experiment at an airport is challenging due to strict regulations. By arrangement with the airport controller, the research was performed at the Maribor Edvard Rusjan Airport, which is a public international airport and the second-largest in Slovenia with a reference code 4D. The runway is 2.500 m long and 45 m wide, and it has a load capacity PCN 86/F/A/X/T. The airport and runway location are shown in
Figure 1.
Detecting deformities and determining their shape and dimensions are complex processes which demand an interdisciplinary approach [
24,
25,
26,
27]. Recently, automated acquisition and processing of spatial data about road and runway deformities has been the subject of numerous pieces of research [
28,
29,
30,
31,
32,
33,
34,
35,
36].
This research is particularly focused on the interpretation and analysis of road and runway recordings. The development of algorithms for automatic recognition or extraction of deformities from these recordings, and determination of the dimensions and classification of the deformities, are common to the previous studies [
34]. Research on the usage of geodetic measurement methods in determining vertical deviations and detecting deformities on the surface of runways, and the prediction of the formation of new deformities, has not been sufficiently conducted to date, or cannot be found, in the accessible literature.
In the current study, runway deformities were detected using geodetic methods. A vehicle on which the geodetic sensors were placed was established to detect the vertical deviations on the runway. The measurement was performed with a Robotic Total Station (RTS) Leica TS50 geodetic instrument, which observed a moving tow vehicle on which a 360° prism was placed. The accuracy of the RTS Leica TS50 follows ISO 17123-3 for measuring angles, i.e., 0.5”, and ISO 17123-4 for measuring lengths, i.e., 0.6 mm ± 1 ppm. All measurements were performed in the unified coordinate system. A GNSS receiver was also placed on the tow vehicle, with which the trajectory of the drive was measured, and large vertical deviations were noted. It is generally acknowledged that the GNSS method is not the most appropriate to observe dynamic processes and does not enable measurement of smaller vertical differences. Data from the RTS and GNSS were collected at a rate of 6–10 readings per second, that is, at a constant speed of 6 km/h, and the average measurement was 7800 trajectory points (
Figure 2).
The determination of the position of deformities was based on the established geodetic net, which presents a geometric basis. The relative positions of the trajectory were determined according to the geodetic (zero) net. The establishment of the geodetic net is a complex action, for which the rules of geodetic net planning must be followed. Data containment and processing must be controlled, corrections of measured quantities must be performed, and an appropriate levelling method must be used] [
37]. The geodetic net had to be established so that it enabled stability over a longer period and enabled optimal execution and repetition of multiple measurements. The runway is an area with a simple relief structure where no physical obstacles are present; therefore, the choice of points’ positions for the establishment of the geodetic (zero) net was not demanding. The points’ positions were chosen at the edge of the measurement area where stabilization of the points on the asphalt surface was enabled. Thus, the permanent and physical stability of the net over a longer period was ensured. Seven points—20001, 20002, 20003, 20004, 20005, 20006, and 20007—were permanently stabilized around the measuring area and, with the measurements, were connected to the geodetic (zero) net (
Figure 3). The stabilized points of the geodetic (zero) net established the local coordinate system which served as a geodetic basis to determine the position of the vertical deviations. The net made from these points was used for planar analysis.
3. Results
The algorithm to calculate vertical deviations and provide a graphic presentation of the results of the calculation was programmed in MATLAB R2019b software package. The algorithm »LetMB«, used for calculation of the regression plains and vertical deviations, and graphical display of the results, was created. The algorithm is performed in two steps. In the first step, with the application of the left pseudoinverse matrix or Moor–Penrose matrix inverse for each time measurement, the parameters of regression plains and the vertical deviations of these regression plains from the GRID are calculated. In the second step, individual time measurements are mutually compared and vertical shifts of regression plains between individual time measurements are calculated. The compared results are the minimal, maximal, and average vertical shifts between the time measurements. The compared results are shown in
Table 1.
The results were addressed in a unified coordinated system, which enabled easier processing and analysis of the measured values to establish the geo-information model of runway maintenance and a unified deformity analysis of the geodetic net.
Because it is physically impossible to obtain the same point every time, the runway was divided into zones, inside of which the points were measured and calculated in the plane. The difference between the relative point distance of the rectangular net and the individual plane represents a mutual vertical departure. The vertical departures between the time dimensions (ΔR1/R2, ΔR1/R3, and ΔR2/R3) were determined based on the difference of the rectangular net point distance measured in the first phase from the plane levelled through the points obtained in the first time dimension (R1), the plane levelled through the points obtained in the second time dimension (R2), and the plane levelled through the points obtained in the third time dimension (R3). The plane was adjusted to the points that were obtained in the individual time dimension. The non-coplanar points were determined by the equation of the plane with the use of the Moor–Penrose matric inverse, which returns the solution using the method of the smallest squares. Additionally, the method minimizes the vertical departures from the plane. The procedure for the calculation of the plane is described in [
38,
39,
40,
41,
42,
43,
44].
The distance of the rectangular net points Ti = (xi, yi, zi) from planes R1, R2 and R3 is equal to the length of the projection of the rectangular vector from the plane to the point (
) on the normal vector of the plane (
):
The average vertical departure between the individual dimensions Δ is:
where
and
are the average distances of the points of the rectangular net from planes Ri and Rj (R1, R2, and R3). The calculated values are shown in
Table 1.
The innovated model also enables the display of results or regions and areas with vertical deviations in graphical form. The graphical results are shown in
Figure 4. In
Figure 4, the contours and vertical deviations are displayed in 2D and 3D. The vertical deviations of individual regression plains from GRID are for the three measurements (R1, R2, R3) along the colored line displayed in meters.
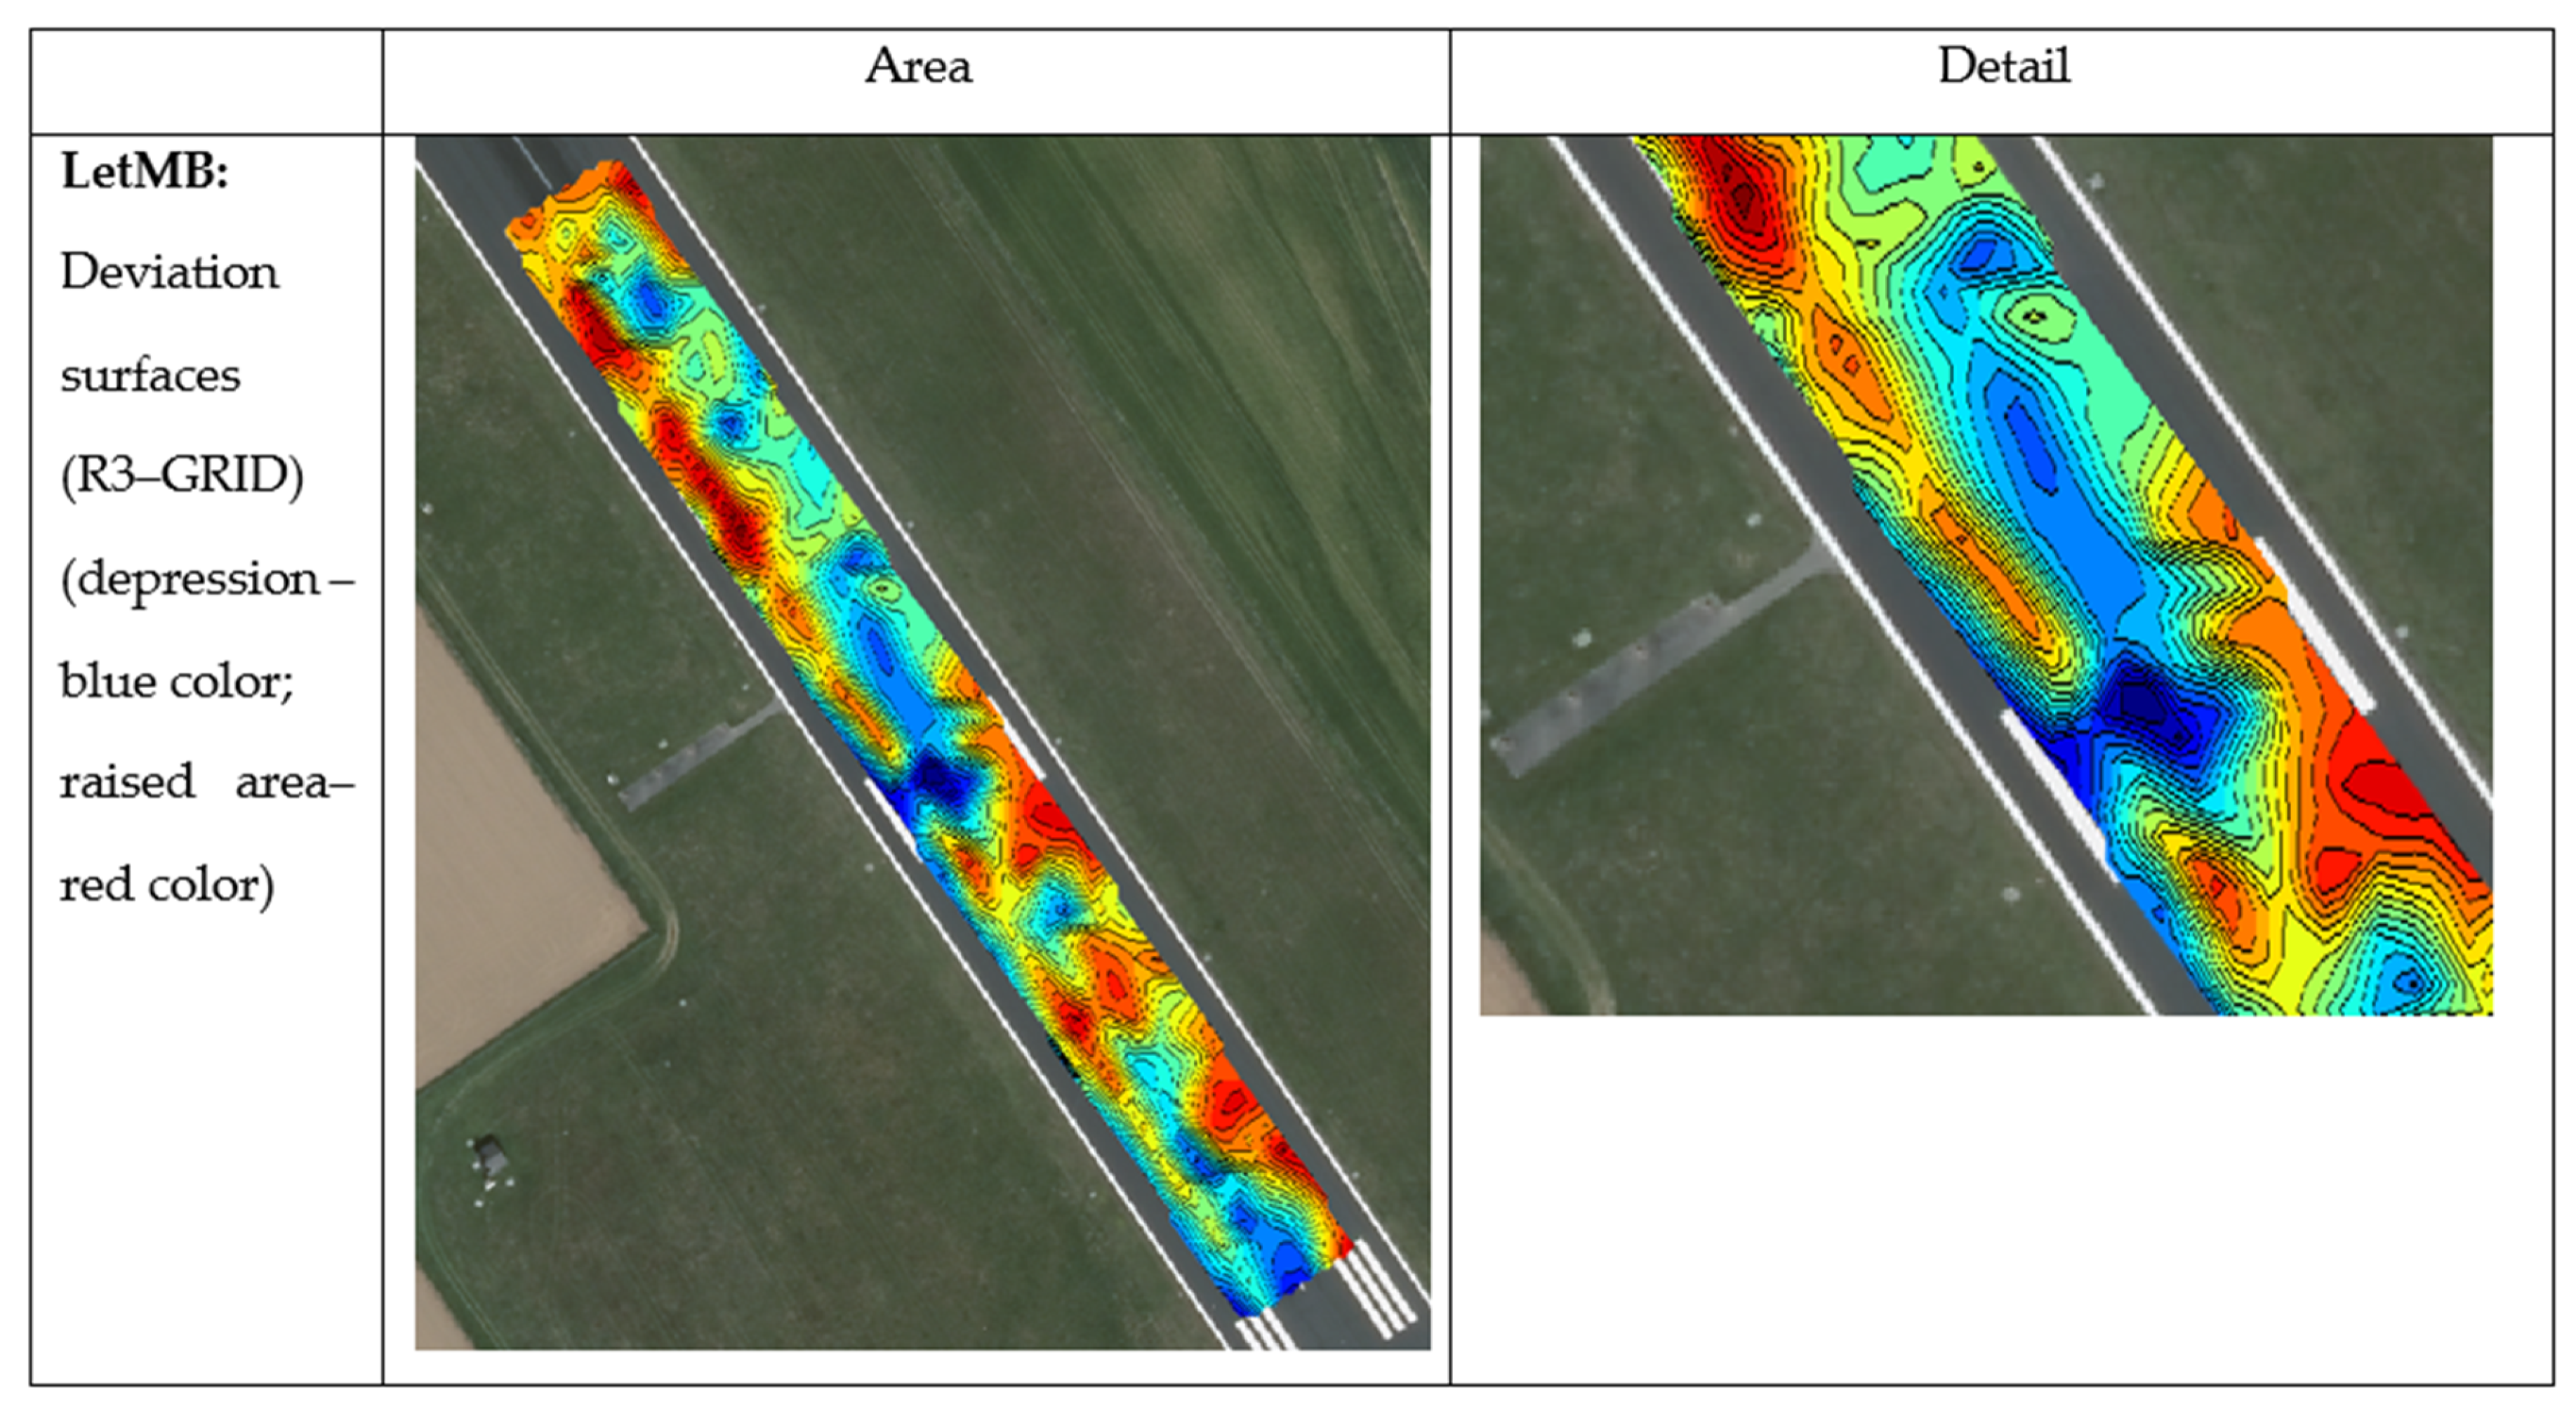
Then, the acquired results were compared with the results obtained with the »raster surfaces« method of the open-source program Quantum GIS (QGIS) to confirm the accuracy and applicability of the »LetMB« algorithm. The results of the third R3 measurement were used for the comparative analysis. The result obtained with the »LetMB« algorithm is displayed in
Figure 5. The plane of the contours and areas with vertical deviations in the total measurement area are displayed in the middle column; in the right column, the detail from the compared area is displayed.
3.1. Analysis of Changes in the Condition of the Runway after the »Raster Surfaces« Method
To test the applicability of the results of the assessment of the runway’s condition and the displayed calculation, the measured results were transferred into the open-source geographical information system, QGIS 3.10, which enables the production, analysis, and presentation of various spatial entities in the shape of so-called »raster surfaces«. Raster analysis, which is built into the information system, enables relatively fast, efficient, and accurate evaluation of any raster independent of its size in the performed analysis.
It should be noted that this comparison concerns the surface on which the extremes (distinct deviations from the initial state of the surface) in a relatively limited area can be expected to be found. The executed measurements provide measured values of the geodetical accuracy. It is expected that the qualitative comparison of both methods will show similar results, and that the two methods will help determine certain areas in which deviations from the initial state are the most distinct.
An example of the results of the analysis according to the »raster surface« method is shown in
Figure 6.
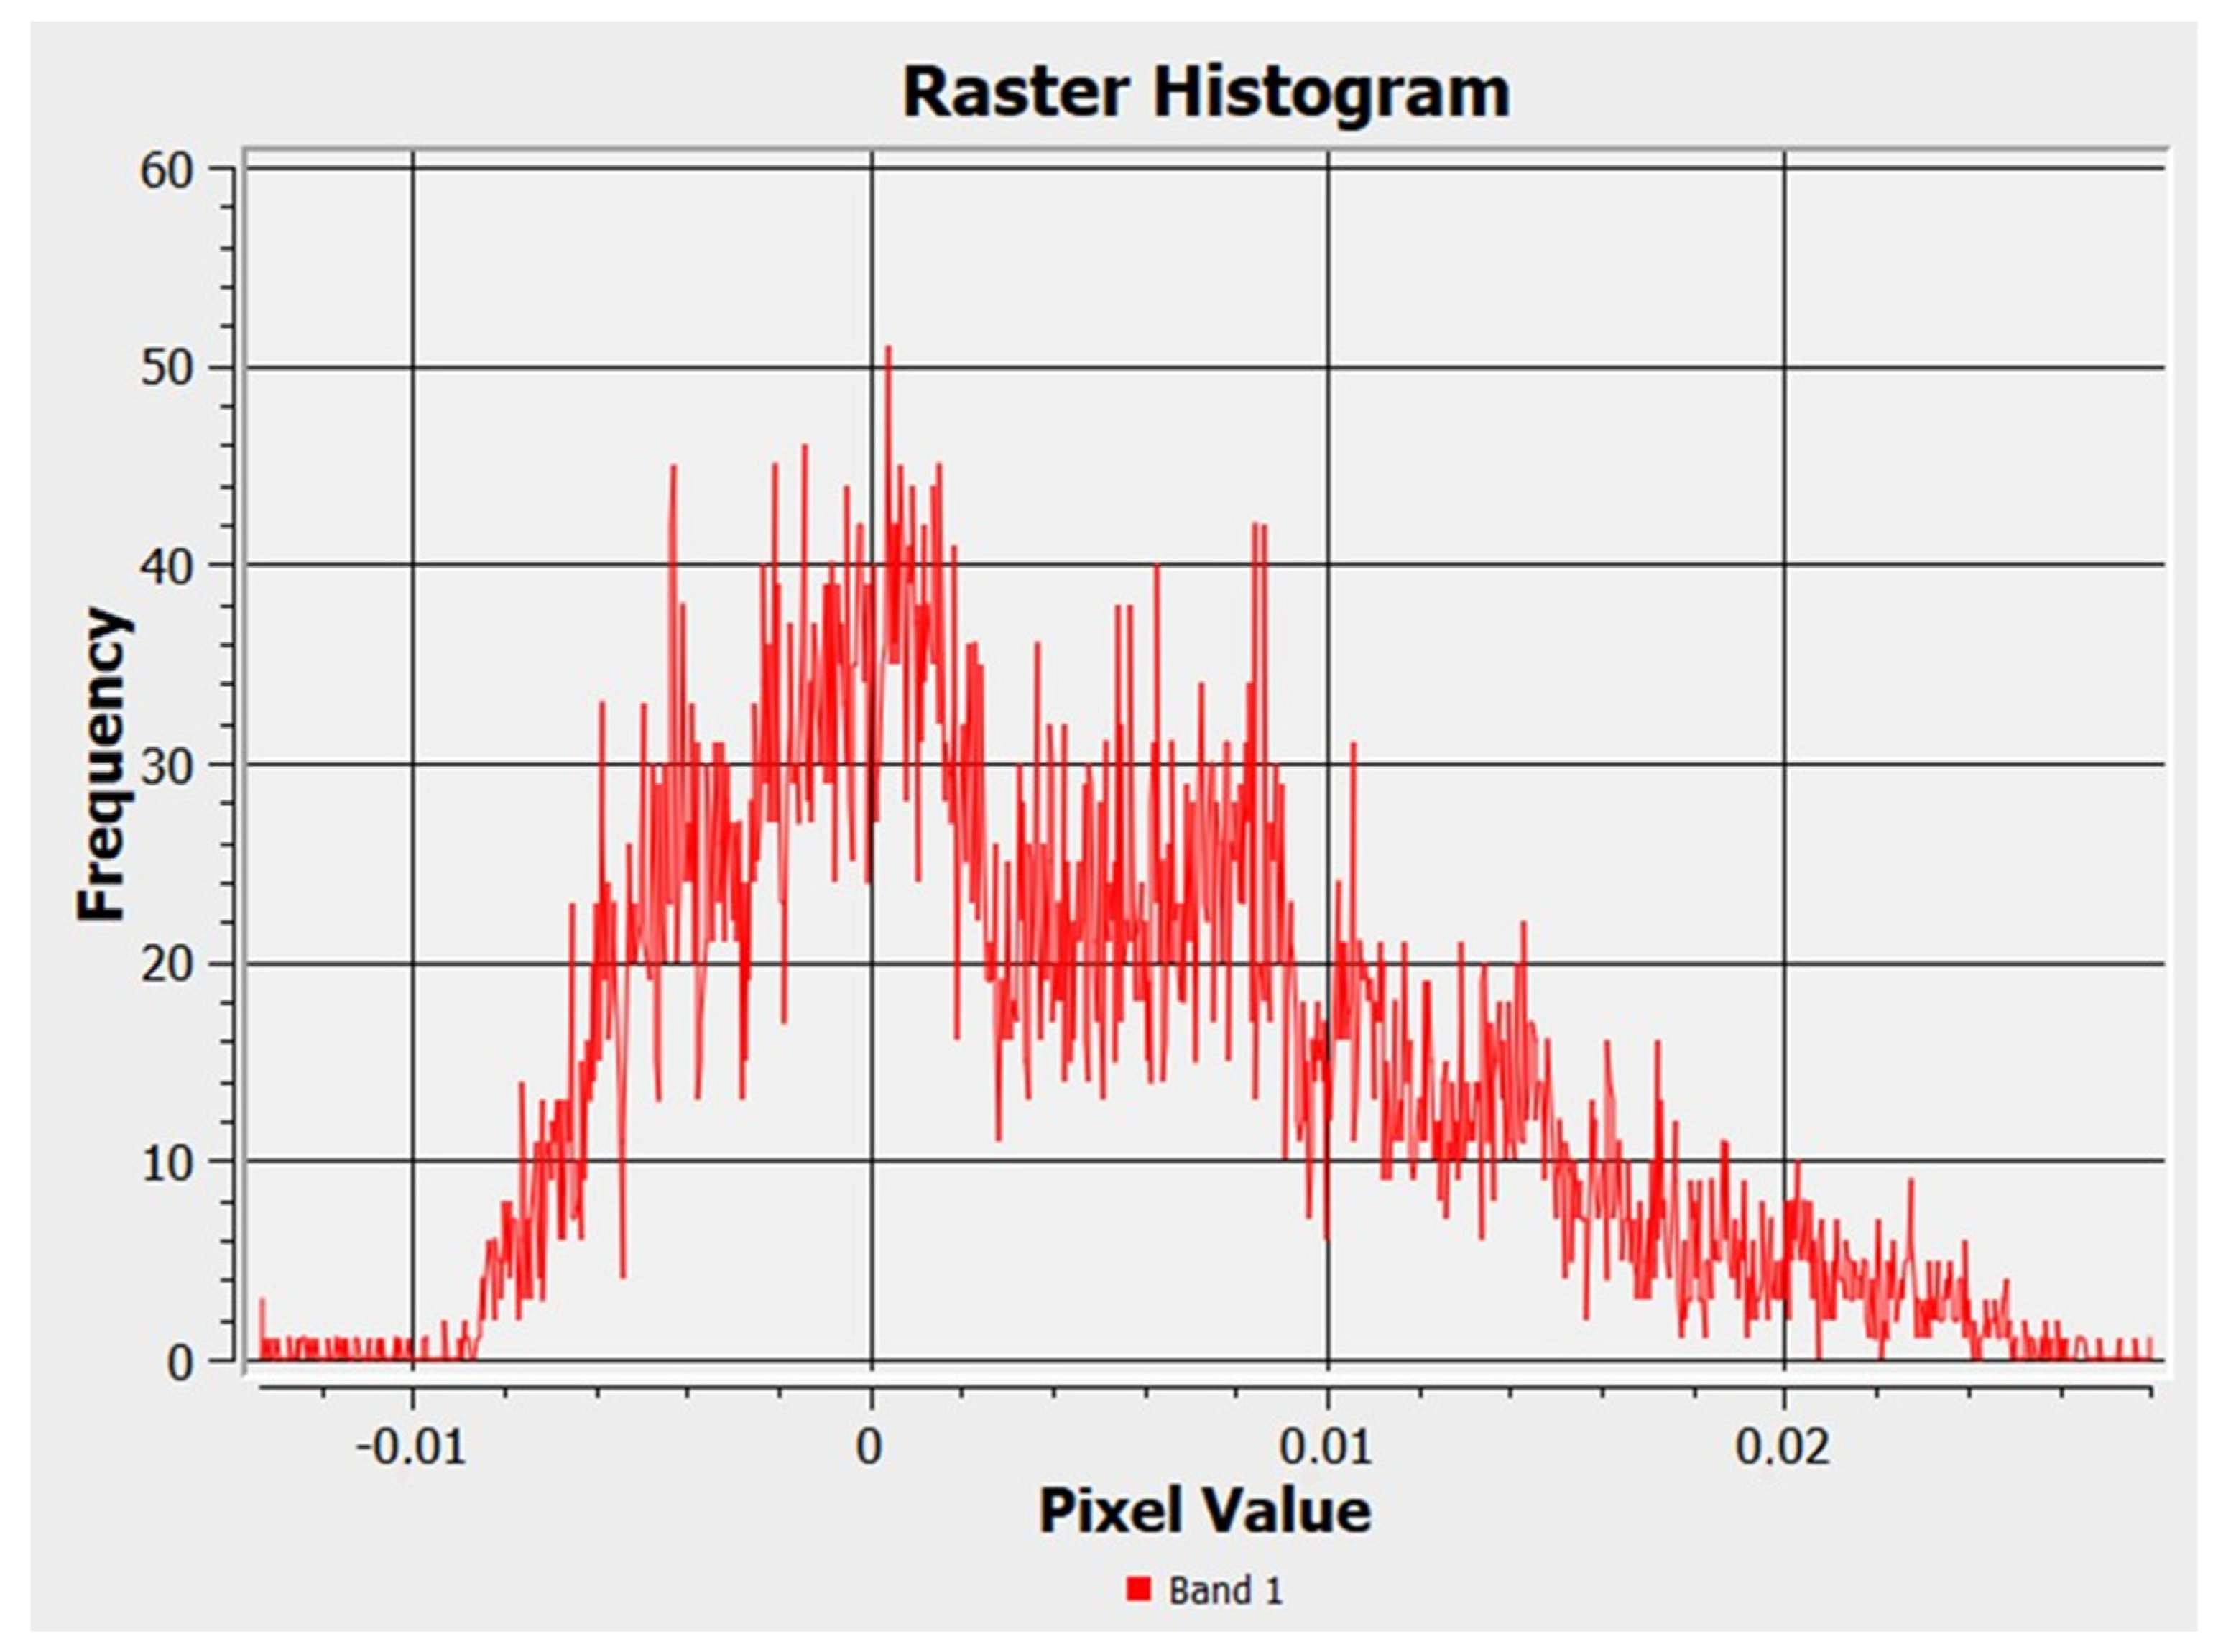
From the histogram shown in
Figure 7, it can be seen that deviations between the surface R3 and GRID (the shifts of the runway’s surface) on the interval between –0.0133 m (the lowest depression, as shown in blue in
Figure 6) and 0.02803 m (the highest raised area, as shown in red in
Figure 6). The average shift value is 0.00425 m, and the standard deviation is 0.0073 m. The biggest depression is detected on the spot where aircraft tend to touch down (see the detail of
Figure 6). The highest raised areas are detected on the runway’s edges.
The results of the complete analysis, executed according to the described methodology, are shown in
Table 2.
It can be seen from
Table 2 that the examined surface at the first measurement (in the winter) rose by an average of 0.01805 m. This increase in the level of the whole surface of the runway is due to the increased tensions in the soil under the runway during winter months. The measurements R2 and R3 provide more useful results. The biggest depressions are detected in the touchdown areas. This represents a basis for more accurate research of the detected areas in the procedures of the airport infrastructure governance.
3.2. The Analysis of Vertical Deviations with a Prototype of the Management Model
The aim is to create a logistics information system which will support processes on smaller airports. Therefore, it is necessary to establish an airport pavement management system (APMS), which will be used mainly on smaller airports and will enable collecting, storage, maintenance, execution of the analyses, and search of the correlations of certain types of the measuring data.
The maintenance model APMS-MB was developed for smaller airports which may have limited means. The APMS-MB maintenance into which model the monitoring model, that, along with the regular runway check-ups, includes the geodetic and supplementary measurements (Geophysical, Water protection, Environmental, Sustainable impacts, Laser scanning, GPR, ...). This innovative model is called the IMR model (Innovative Model of the Runway) and IMR_all model. Third part of the IMR_all model is shown in the figure in
Appendix A. The entire process of the IMR_all model is shown in [
43,
44].
The monitoring result (»IMR_all«) are determined areas of vertical deviations, which are a combination of findings based on the visual runway check-up, the results of used geodetic method, and the results of a supplementary method which is shown in
Figure 8 Areas of the deformities can be shown as 2D contours of the plane of deviations from the regression plane, as a 3D plane of deviations from the regression plane, or on a plate in a real space.
International organizations relating to aircraft, including the European Union Aviation Safety Agency in its Acceptable Means of Compliance (AMC) and Guidance Material (GM) to Authority, Organization and Operations Requirements for Aerodromes in Certification Specifications (CS) and Guidance Material (GM) for Aerodromes Design, and ICAO in Annex 14, prescribe tolerances for irregularities (dents and bumps) on the runway and other surfaces which are intended for aircraft to land. These state that, on the surface, there cannot be any unevenness in the shape of bumps higher than 1.25 cm, measured with a ruler 3 m long in any direction, and dents deeper than 3 mm, in which water can be held, measured with a ruler 3 m long in any direction.
The following conclusions can be reached with the consideration of these prescribed standards and comparison with results obtained in the current study. In
Figure 4 (R1-GRID, R2-GRID, R3-GRID) for the first, second, and third measurements, in the processing area, the vertical deviations from regression planes are shown. The maximal vertical deviations in the first measurement are exactly 4.5 cm, and in the second and third measurements are both 3.0 cm. The approximate distances between the areas with maximal vertical deviations are shown in
Figure 8a–c. The areas of the maximal vertical deviations in the first measurement are approximately 29 m apart, in the second measurement are approximately 31 m apart, and in the third measurement are approximately 29 m apart. With the blue color, on
Figure 8, the deviations from the expected height of the runway in the negative direction are marked downwards (indentations—the danger of aqua planning) and with the red, the deviations in the positive direction are marked upwards (bulges—the danger of cracks to appear).
3.3. The Use of the Prototype of the Model in the Circular Economy and Sustainable Building Industry with the Help of Augmented Reality—AR
From the very beginning of the research, we have asked the question how to display the results of the innovative model in a way which will present the results to the user from a different perspective and thus provide some kind of ambient experience. The AR technology allows the data overview in the real environment or allows the overview of the data in the interaction with the real environment.
Contours and surfaces of vertical deviations—2D on the processing area were displayed in the interaction with the real environment. On
Figure 9, it is shown how the user sees a real image of the runway, enriched with contours and areas of vertical deviations.
The graphic data on the unevenness areas, and especially their visual presentation in the interaction with the real world, is in our opinion key when making decisions about the way and extent of the execution of maintenance or renovation works. The visualization of graphic data with the use of progressive technologies provides the decision-makers with better data and the results of analysis presentation, and allows the overview and interpretation of these data in the real environment without the presence of other professionals (designers, constructers, geodesists, etc.). As it is shown in
Figure 9, the decision-makers or all who overview and analyze the data, overview them in a real environment or interaction with it.
With the help of AR technology and the results of our measurements, various simulations can be executed. As an appropriate method, our model has also proven the BIM technology, for the planning of the enlargement of the airport, building surrounding accompanying objects, sustainable economic development, and environmental monitoring [
39].
4. Discussion
The development, the detection, and the research of new facts are nowadays highly appreciated. A lot of means and time is dedicated to highly appreciated areas. Less attention and mostly fewer means are intended for the maintenance which presents an important part of each system. We are concluding that in the airport traffic, more attention is dedicated to the maintenance, since a well-maintained airport infrastructure is directly connected with the provision of traffic safety [
40]. All other aspects like social, environmental, and economic aspects are also taking into consideration. Provision of traffic safety is in the term of air logistics directly connected with the social aspect (passenger mobility), economic aspect (cargo mobility, logistical costs), and environmental aspect (sustainable management—sustainable maintenance).
International organizations on the aviation area normatively arrange and with recommendations direct the execution of the maintenance works on the airports. The sustainable maintenance is generally in good order on bigger airports where adequate financial means are intended for that as well. Smaller regional airports are »malnourished« in that area, and they concentrate on the maintenance as much as it is necessarily needed or as much as it is normatively regulated, and especially, they concentrate less on the maintenance support systems.
Extensive and long-lasting runway renovations cause closure or limited function of the airports. For the airport manager, this means the loss of outcomes from the core business, i.e., management and airport operation, the inhibiting of various commercial businesses on the airport, and the standstill of the whole airport infrastructure. The costs of airline companies, which are obligated to ground the aircraft or find a substitute location, are increased as well. The airport closure also causes problems in the sustainable development of the region and circular economy, which depends on the airport freight and passenger traffic. More building departments which take care for asphalt pavement surface, structure, dewater and damage restoration, are included in the restoration process.
Among the disorders which cause delays in the airport traffic are the undetected deformations on the runways. They cause the delays, which are in duration like those which are a consequence of the malfunction on the aircraft. Additionally, it is stated that in 2016 on the airports in the United States of America altogether, there were 59 million minutes of delays in the passenger airport transportations. A minute of the delay was assessed to 62.55%, which for 2016 amounted to 3.69 billion American dollars of incurred costs. The costs of incurred delays increase each year, and in 2018 amounted to 74.20 American dollars per minute (»U. S. Passenger Carrier Delay Costs« [Airlines for America] 2018).
In the present research, we have, with the help of a sustainable management approach and with newly established models for measuring and assessing the airport infrastructure and with the help of the made prototype for the runway sustainable management maintenance, examined the possibility to consider the already established and by the ICAO regulated safety demands. They are based on the physical testing of the runway state, and those demanded methods cannot be uniquely used in the computer environment. For this purpose, we suggest that the adapted information system for airport logistics infrastructure management is based on the following assumptions:
- -
The measurements of the runway unevenness need to be executed with modern geodetic equipment which allows the measuring in the unified coordinate system, high accuracy, and repeatability of the measurements,
- -
the unknown state of logistics infrastructure (SLI) is established, which is easily and uniquely determinable based on executed measurements with modern geodetic equipment,
- -
the airport logistics infrastructure strategy is determined based on the executed assessment of the state of airport logistics infrastructure.
The final product (sustainable traffic infrastructure management model) is in the shape of the prototype of the adapted information system for airport logistics infrastructure management, and it is made in the software environment Bizagi Modeler, version 3.6.0.044, and it was planned with the standard modelling technique BPMN (»Business Process Model and Notation (BPMN), version 2.0.2«), which is process-oriented and intended for software development [
41,
42]. A conceptual LetMB model was made in the shape of the high-level diagram of cooperation [
44]. The high-level diagram of cooperation is shown in
Appendix B.
To upgrade the obsolete evaluating system, it is suggested that, as the base to evaluate the runway state, the value of estimated vertical deviations is used, obtained based on the executed measurements and the analysis as it suggested with the adapted method for monitoring the runway state.
The airport logistics infrastructure maintenance strategy for smaller regional airports is determined as:
The execution of basic measurements (the zero-net establishment, the first time dimension), the establishment (upgrade) of the airport logistics infrastructure maintenance information system on smaller regional airports (IMR)—basic condition for the maintenance system to function;
evaluating the estimated vertical deviations and determining the variable state of airport logistics infrastructure (SLI) on the touch-down area:
SLI = »great«: No deepening larger than 1 mm and no risings of the runway surface larger than 1 cm are detected,
SLI = »good«: No deepening larger than 2 mm and no risings of the runway surface larger than 2 cm are detected, the SLI demand = »great is exceeded«;
SLI = »satisfactory«: No deepening larger than 3 mm and no risings of the runway surface larger than 3 cm are detected, the SLI demand = »good is exceeded«;
SLI = »bad«: No deepening larger than 4 mm and no risings of the runway surface larger than 5 cm are detected, the SLI demand = »satisfactory is exceeded«;
SLI = »very bad«: No deepening larger than 5 mm and no risings of the runway surface larger than 7 cm are detected, SLI demand = »bad is exceeded«;
SLI = »inappropriate«: Deepening larger than 5 mm and risings of the runway surface larger than 7 cm are detected,
the action based on evaluating the airport logistics infrastructure on smaller regional airports—
Figure 10.
Suggested measuring methods and airport runway management model for smaller, regional airports was tested on the concrete case of the Maribor Airport which, according to the extent of the infrastructure and the extent of traffic, belongs among smaller, regional airports.
To be able to claim and prove the validity of suggested measures, it would be necessary to test suggested methods also on other similar airports professionally and scientifically efficiently. Finally, suggested models with smaller adaptations could be used in examining the traffic infrastructure state in general, and especially there where the demands to provide evenness of the traffic surfaces have a significant effect on safety.
We suggest that the findings, presented in the article, are considered in the renovation, as it was concluded from the obsolete normative regulations.
5. Conclusions
Runway monitoring is an extremely important element of the analysis of airport construction and provides general insights into the effects of the construction, which is subject to numerous influences. Collected data and measured characteristics can be used for numerous forms of analysis and improvements, and thus prevent potential negative consequences. Such kinds of data are essential parts of sustainable management systems for all logistics infrastructure,
The main goal of our experiment was the optimization of the deformation monitoring process on the runways and the production of the sustainable model, which will help the decision-makers to determine the level of damage. This monitoring and damage evaluation are extremely important, particularly due to the safety of people, cargo, and aircraft. Detecting deformities must be executed rapidly and qualitatively without disruptions to airport traffic and prevent airport closures due to runway damage. We concluded that with geodetic methods we can fast and qualitatively measure the unevenness, and the model can transform the measured values into 2 or 3D image.
It can be concluded from the results of the current study that the described geodetic non-invasive method rapidly provides accurate data about vertical and horizontal deformities. Moreover, the required measurements can be performed at any time, without disturbing the functions of the airport.
The results were displayed also with augmented reality. In this way, the managers have real insight into the state, and the model allows the upgrade of visualization also for the needs of airport sustainable development with the BIM technology and an insight into the simulation of accidents and thus the negative influence on the environment. With the help of augmented reality, it is easier to imagine the expansion of the airport, the building of the accompanying objects, the determination of the effects on the environment, and at the end, on the airport sustainable development and region in general. Analysis of the results raises a question about further monitoring and the necessary procedure for repeated individual measurements. Data monitoring and measurement analysis should be undertaken under the authority of the airport maintenance service, which will also be the main user of this data and the source of information required by management to make maintenance decisions. Thus, it is necessary that monitoring be performed periodically. Furthermore, measurements of surface deformities must be performed more often. Finally, when larger deviations and deformities are detected, or deformities are detected on a new part of the runway, it is also necessary to perform geomechanical and geophysical measurements to determine their origin.
In our research, the innovative sustainable model was used also for the smaller airport, and with some modification, it would also be useable on the more frequent airport and other taxiway constructions. The model is open coded, which means that we can input various data which are important for the manager, maintenance, and restorations. The augmented reality offers an easy insight into the measured values and easier introduction into the airport sustainable development.


