Abstract
This study explores how people appraise the use of contact tracing apps during the novel coronavirus (COVID-19) pandemic in South Korea. Despite increasing attention paid to digital tracing for health disasters, few studies have empirically examined user appraisal, emotion, and their continuance intention to use contact tracing apps for disaster management during an infectious disease outbreak. A mixed-method approach combining qualitative and quantitative inquiries was employed. In the qualitative study, by conducting interviews with 25 people who have used mobile apps for contact tracing, the way users appraise contact tracing apps for COVID-19 was explored. In the quantitative study, using data collected from 506 users of the apps, the interplay among cognitive appraisal (threats and opportunities) and its association with user emotion, and continuance intention was examined. The findings indicate that once users experience loss emotions, such as anger, frustration, and disgust, they are not willing to continue using the apps. App designers should consider providing technological affordances that enable users to have a sense of control over the technology so that they do not experience loss emotions. Public policymakers should also consider developing measures that can balance public health and personal privacy.
1. Introduction
The novel coronavirus (COVID-19) outbreak that began in late 2019 has presented an unprecedented challenge to public health across the globe. COVID-19 is a viral respiratory disease caused by a coronavirus. It can cause a fever, cough, breathing difficulties, pneumonia, and even death, especially among older adults or people with underlying health conditions (e.g., chronic diseases and respiratory problems) [1]. As of 16 December 2020, the World Health Organization (WHO) reported that there were 71,581,532 confirmed cases of and 1,618,374 deaths from COVID-19 (https://COVID19.who.int/). Given the potential spread from asymptomatic patients, rapid testing and tracing for vulnerable populations is critical for the containment of the virus [2].
In South Korea, diverse mobile applications have been developed and are widely used by those who want to obtain information about the movement of infected people. To date, more than 10 mobile apps have been developed during the COVID-19 pandemic, and they provide information on infected people’s movements along with demographic information (e.g., gender and age) and send notifications regarding new cases. By using the apps, people are able to quickly recognize whether they might have had any contact with an infected person, which helps them decide whether to take preventive actions (e.g., virus screening or self-isolation). The Corona 100 m (Co100) app is one example of mobile apps that have been widely adopted in South Korea. This application provides users with information about coronavirus-confirmed individuals’ past movements and notifies them via an alarm when a location visited by a confirmed individual is within 100 m of the user. Although it has been reported that such contact tracing apps are beneficial for public health, the use of aggressive digital contact tracing based on global positioning system data from smartphones and credit cards has raised significant concerns regarding its potential to intrude on individuals’ privacy.
Despite increasing attention paid to the use of digital tracing using smartphone apps for COVID-19 [3], little is known about how individuals evaluate the use of contact tracing apps and how their appraisals influence their emotions and continuance intentions with regard to the use of the apps. To fill these gaps in research, drawing on cognitive appraisal theory [4,5], this study seeks to answer the following questions: (1) What are the threats and opportunities users perceive while using contact tracing apps during the COVID-19 pandemic?; (2) How do the users react emotionally toward the technology; and (3) How do the users’ appraisal and emotional reactions determine their continuance intention? The study contributes to the literature on public health disasters by:
- contextualizing user appraisals of an information technology (IT) event (i.e., the use of contact tracing apps) in a pandemic situation;
- verifying the role of emotions in determining their continuance intentions; and
- providing insights into implementing a technology that is controversial in terms of the opportunities and threats to public health and individuals’ civil liberties.
2. Theoretical Background
2.1. Information Technology for Disaster Management
The use of IT for disaster management is crucial because it enables the public to access timely and accurate information [6], thus helping control and prevent further damages and losses [2,7]. In particular, during an epidemic or pandemic, the use of IT that enables access to accurate information about the contagion [8] and the tracing of infected people to isolate them [9] are key to managing the health crisis [10]. For example, researchers found that during the severe acute respiratory syndrome-related coronavirus (SARS-CoV) epidemic in 2002–2003, geographic information systems that enabled the mapping of the spread of the disease and contact tracing were found to be effective in controlling the spread of the virus [11]. In contrast, some researchers have argued that digital tracing for COVID-19 has the potential to compromise individuals’ civil liberties [3], and it may exacerbate individuals’ incivility, aggravate social divide, and cause disruption [12]. While the role of IT is becoming increasingly important for public health disaster management [13,14], the question of how to balance public safety and individuals’ liberties has yet to be fully discussed.
During the COVID-19 pandemic, mobile applications for contact tracing have played an important role in tracking and controlling the pandemic [15,16]. By using these mobile applications, an individual can be notified when he or she is close to a place that has been visited by a person with a confirmed infection, while if an individual gets infected, his or her mobile apps can be used to trace past movements. These mobile applications are developed by the current localization or communication technologies (i.e., cellular networks, Wi-Fi, GPS, and Bluetooth), which enable smartphones to constantly trace the user’s location [16]. Currently, many countries have developed their mobile applications based on different technologies. For example, the “TraceTogether” in Singapore and the “COVIDSafe” in Australia rely on Bluetooth [17], whereas the “Kwarantanna domowa” in Poland and the “Live Corona Map” in South Korea use GPS [17,18]. These technologies show different abilities to track and trace. According to Hernández-Orallo et al. [16], most mobile applications rely on Bluetooth, but Bluetooth is only effective in detecting nearby devices of around 1–2 m away and that have the app installed. In contrast, although the precision of GPS can reach 10–15 m, the precision can be severely decreased when individuals are indoors [16]. Moreover, some people have concerns that the government would track them using GPS [17]. Therefore, it is important to take technology types (i.e., cellular networks, Wi-Fi, GPS, and Bluetooth) and human concerns into consideration when designing and developing mobile applications for contact tracing. Table 1 displays the role of IT during an epidemic or pandemic.

Table 1.
Research findings on the roles of IT during public health disasters.
2.2. Cognitive Appraisal Theory
Given that IT for disaster management enables people to stay informed about the potential damages or losses in their physical and social environments, a user’s appraisal of IT is associated with his or her emotional experiences while using the IT. Prior research has employed cognitive appraisal theory to explain how people evaluate the use of IT for disaster management (i.e., an IT event) and how people emotionally react to the event [20]. For example, the use of a contact tracing app during the COVID-19 pandemic might make people vigilant and cautious, and they may feel relieved because the information on the movements of infected people can help them quickly take the necessary actions to prevent infection. On the other hand, others might believe that such a digital tracing technology will ultimately have a detrimental impact on people’s lives because some personal information on the infected individuals can be revealed to the public. If the expected consequences of the use of the contact tracing apps are positive for the user, then the expected consequences can be categorized as opportunities, whereas if the consequences are deemed to be negative, they can be categorized as threats [24]. Given that an IT event is multifaceted, user appraisals contain positive and negative consequences depending on the event’s relevance and importance to the user [25].
Emotions in IT use reflect a user’s mental state and whether he or she is ready for action, which leads to certain behavioral responses to IT [26]. Understanding users’ emotional responses is important because emotions play a role as adaptive intermediaries between technological stimuli and behavioral outcomes [4]. In this sense, understanding how users emotionally respond to the use of contact tracing apps during COVID-19 helps researchers determine their continuance intention to use the apps.
Given the unusual research context (the use of contact tracing apps during the COVID-19 pandemic), we believed that either a qualitative or a quantitative method alone is insufficient to address our research questions. Accordingly, we adopted a mixed-method approach, combining a qualitative study, and subsequently, a quantitative study. In the qualitative study, we identified threats and opportunities that users perceive in the use of contact tracing apps and their emotional experiences to contextualize cognitive appraisal theory in the situation of the COVID-19 pandemic. In the quantitative study, (1) we operationalized major constructs based on the qualitative study, and (2) drawing on cognitive appraisal theory, we developed and tested a model that explores the interplay among perceived threat and opportunities, emotions, and continuance intention. Figure 1 represents the workflow of our study combining qualitative and quantitative approaches.
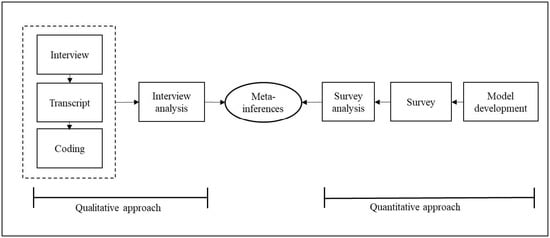
Figure 1.
Research procedure.
3. A Qualitative Approach
3.1. Research Setting
South Korea is among the countries that have adopted mobile applications for contact tracing to control the spread of infection. It has been known that South Korea has been relatively successful in controlling the spread of the virus due to the use of contact tracing apps [18]. Users receive notifications on the updated situation (e.g., a total number and a daily number of infected cases) and on confirmed cases’ movements. While the personal identity is anonymous, gender, age, and living area are disclosed. For example, an app called Coronavirus Map provides at-a-glance COVID-19-related information, such as quarantined places and the past movements of confirmed cases. The places that the confirmed cases have visited are marked and linked in a line to intuitively show the moving path of each case. Coronavirus Doctor (CoDoc) is an app that provides all information related to COVID-19 in one map. Most importantly, the location information of the confirmed cases as well as selected clinics and detention hospitals in each region are marked on the map. The app also provides a link to the webpage that contains the government’s official responses to COVID-19-related questions. The users can select a certain confirmed case and view past movements of the individual. Apart from these examples, more than 10 applications have been widely adopted and well received as a smart way to avoid COVID-19 in South Korea. Most contact tracing applications are based on GPS technology.
3.2. Research Methods
We conducted 25 open-ended interviews comprised of nine office workers, seven college students, six housewives, and three freelancers who had used contact tracing apps for COVID-19. We determined the optimal number of interviewees by confirming theoretical saturation, which indicates that no new codes will emerge from additional data collection and analysis [27]. After conducting five interviews, we analyzed the interview data based on the coding approach. Having conducted interviews with 25 subjects, we could no longer find new codes. The average age of the interviewees was 40.1 years old, and there were 14 male interviewees (56%) and 11 female interviewees (44%). The interviews were conducted one-on-one using Skype and lasted 25–30 minutes each. Interviewees were asked about (1) their overall experiences in the use of mobile apps for contact tracing, (2) what they thought could be negative/positive consequences of the use of the apps, (3) their emotions while using the apps, and (4) their intention to continue using the apps.
The interviews were audiotaped and transcribed verbatim by the authors. Data were put into a qualitative software data analysis program, ATLAS.ti (cleverbridge, Inc. Cologne, Germany). A total of 144 responses from 25 interviewees were retrieved, among which 77 responses were categorized into appraisal, 47 into emotion, and 21 into continuance intention. An initial coding system was prepared based on Beaudry and Pinsonneault’s [25] appraisal categories. Participants’ emotional responses were coded based on Beaudry and Pinsonneault’s [26] framework of emotions, which consists of four emotion classes (achievement, challenge, deterrence, and loss emotions). For the coding procedure, following Stein et al. [28], we grouped specific emotions into a category. For example, responses including emotions, such as satisfaction, enjoyment, and relief, were grouped into the class of achievement emotions. The final coding system consisted of four main categories (threats, opportunities, emotions, and continuance intention), which were further divided into 22 subcategories. The coding results were cross-checked with another researcher who holds a PhD degree in the management of information systems. The inter-rater agreement (IRA) scores were calculated. The IRA was 0.81, and Cohen’s κ scores [29] averaged 0.80. The first author reconciled disagreements in codes when disagreements appeared in the coding results.
3.3. Results and Analysis
Following the procedure of qualitative data coding proposed by Braun and Clarke [30], we first generated initial codes from the responses. Next, we collated the initial codes into a broader level of themes. The coding results showed that individuals’ appraisals of the use of contact tracing apps were mixed and often contradictory. People evaluated the use of contact tracing apps as either beneficial or detrimental, while some evaluated them as beneficial and detrimental simultaneously due to different aspects of the technology. Although people appraised the use of contact tracing apps as beneficial due to the expected positive consequences (e.g., speedy access to information, push notifications, public risk perception, prevention effectiveness), they also appraised them as detrimental due to the expected negative consequences (e.g., system quality, misinformation, privacy intrusion, mental distress). Speedy access to information was found to be most salient among the perceived opportunities, whereas privacy intrusion was found to be most salient among the perceived threats (see Figure 2).
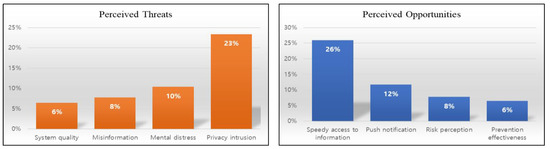
Figure 2.
Perceived threats and opportunities.
Diverse emotions were identified, such as anxiety, anger, worry, satisfaction, hope, interest, arousal, and disgust. All the identified emotions were grouped into four categories (i.e., achievement, challenge, deterrence, and loss emotions) based on the framework for classifying emotions proposed by Beaudry and Pinsonneault [26]. The results show that people experience positive emotions, such as achievement (e.g., relief) and challenge (e.g., hope); however, the results indicate that people also experience negative emotions, such as deterrence (e.g., fear) and loss (e.g., anger). Achievement and deterrence emotions were most pervasive and loss emotions were least pervasive (see Figure 3). Our coding results reveal that users’ emotional responses to the tracing apps were mixed. Some people have positive emotions and negative emotions simultaneously. As per intention to continue, 57% of responses were positive, whereas 43% were negative. Table 2 presents respondents’ sample quotes and their coding results.
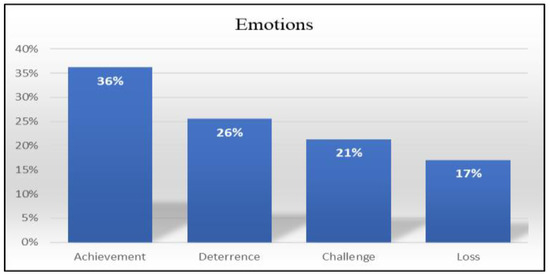
Figure 3.
Emotional responses toward the use of tracking apps.
Table 2.
Coding results.
4. A Quantitative Approach
4.1. Theoretical Framework
Our qualitative research reveals that individuals’ appraisals of the use of contact tracing apps for disaster management are mixed: some evaluate it as beneficial, while some view it as detrimental. It also indicates that users perceive threats and opportunities from different aspects of the technology, which results in mixed emotions. Some users experience positive emotions, and some negative, while some experience positive and negative emotions simultaneously. Thus, we propose that perceived threat and opportunity should not be conceptualized as two ends of a continuum, but rather as independent constructs. Furthermore, all classes of emotions should be examined simultaneously within a model. Figure 4 presents the research model we developed based on cognitive appraisal theory with the backdrop of our qualitative research.
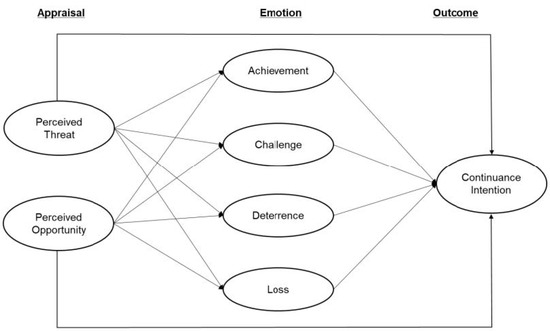
Figure 4.
Research model.
4.1.1. Appraisal and Emotion
Cognitive appraisal theory has been regarded as the theory of emotions, given that it explains how individuals’ emotions are elicited by appraisal [31]. Emotions are defined as “reactions to situational events that are appraised to be relevant to a person’s needs, goals or concerns” [28] (p.371). In the context of IT use, cognitive appraisal theory holds that emotions are elicited by a user’s appraisal of an IT event. That is, users experience certain emotions not because of the IT event itself but rather because of how they think about and assess the use of IT in a certain situation [32].
Diverse emotions have been classified in emotion frameworks, which apply to distinct contexts. Of these, our research draws on the emotion framework proposed by Beaudry and Pinsonneault [26]. The framework classifies IT users’ specific emotions into four categories: loss, deterrence, challenge, and achievement.
Loss is a class of emotions that includes anger, frustration, dissatisfaction, and disappointment [26]. Loss emotions arise when a user perceives IT as a threat and feels that he or she cannot control its consequences [26]. Our qualitative study revealed that some users experienced anger, frustration, and dissatisfaction when they saw people suffering from public criticism because their identities had been disclosed. Although the users themselves were not infected and used contact tracing apps to prevent infection, they were sympathetic to those who had been infected and consequently had their personal information shared with the public. In this case, these users appraised contact tracing apps as a potential source of social stigma, which is a threat, and they experienced loss emotions. On the other hand, some of these users appraised the same IT stimuli as beneficial because they could identify trends and examine the infection status infection of certain local areas, which helped them to take preventive actions. Accordingly, a user’s appraisal of contact tracing apps is ambivalent and it has a bi-directional influence on loss emotions. The greater a users’ perceived threat, the greater the user would experience loss emotions. In contrast, the greater the user’s perceived opportunity, the less the user would experience loss emotions. Hence, we propose the following hypotheses:
Hypothesis 1.
Perceived threat is positively associated with loss.
Hypothesis 2.
Perceived opportunity is negatively associated with loss.
Deterrence is a class of emotions that contains anxiety, worry, fear, and distress [26]. Such emotions arise when a user perceives an IT event as a threat but he or she feels that they have some control over the consequences. In general deterrence emotions have a negative valence due to the IT stimuli. In our research context, frequent notifications and warning messages can be the causes for deterrence emotions. In our qualitative study, users reported that they were anxious, distressed, and worried when the contact tracing app constantly sent notifications about the new cases and warning messages about the locations that infected people had visited. The same users appraised contact tracing apps as beneficial because they could be alerted to infection risks and avoid them by using the provided information. Accordingly, the users assessed contact tracing apps for infection prevention in oppositional ways, thus having a bi-directional influence on deterrence emotions. We propose the following hypotheses:
Hypothesis 3.
Perceived threat is positively associated with deterrence.
Hypothesis 4.
Perceived opportunity is negatively associated with deterrence.
Challenge is a class of emotions that contains excitement, hope, anticipation, arousal, and flow [26]. These emotions occur when a user appraises an IT event as an opportunity and feels that he or she has some control over its positive consequences. Our qualitative study found that some users were excited that contact tracing apps can potentially control the spread of the infection. They believed that IT use was key to managing public health disasters; however, some users considered IT for contact tracing a threat because it may stigmatize the infected people. Accordingly, we propose the following hypotheses:
Hypothesis 5.
Perceived threat is negatively associated with challenge.
Hypothesis 6.
Perceived opportunity is positively associated with challenge
Achievement is a class of emotions that includes happiness, satisfaction, enjoyment, and pleasure, and these emotions arise when a user appraises an IT event as an opportunity that generates positive outcomes [26]. In our qualitative study, although some users felt that they could not influence the pandemic and only received information on its spread via contact tracing apps, they were satisfied with their use of the apps. In contrast, users who appraise contact tracing apps as detrimental would be less satisfied with the apps, and the use of the apps would not be enjoyable. Therefore, we present the following hypotheses:
Hypothesis 7.
Perceived threat is negatively associated with achievement.
Hypothesis 8.
Perceived opportunity is positively associated with achievement.
4.1.2. Emotions and Continuance Intention
Cognitive appraisal theory holds that emotions are elicited by cognition and result in actions to achieve certain behavioral intentions [33]. Researchers have found that emotions can powerfully influence an individual’s behavioral intentions [34].
Elicited loss emotions have a negative valence, creating defensive mechanisms for users to avoid pressures and shift their attention away from a problem [35]. Researchers have empirically determined that loss emotions, such as disappointment, anger, regret, and dissatisfaction, are more likely to lead to negative IT outcomes, including complaints [36] and an unwillingness to continue to use [37]. As they trigger defensive mechanisms, loss emotions can also influence individuals to deemphasize the importance of IT [38]. It has also been found that users with loss emotions are more likely to avoid the negative affect by reducing or limiting the use of IT [39]. Accordingly, we propose the following hypothesis:
Hypothesis 9.
Loss is negatively associated with continuance intention.
Deterrence emotions are elicited when users anticipate negative outcomes from their IT use [38]. When people believe that they have some control over a situation, the negative valence caused by deterrence emotions results in constrained action tendencies. In the IT context, users who experience deterrence emotions are more likely to avoid or escape certain situations, thus leading to a decrease in IT engagement [26]. Accordingly, we put forward the following hypothesis:
Hypothesis 10.
Deterrence is negatively associated with continuance intention.
Challenge emotions are likely to encourage individuals to explore the new capabilities provided by IT and thus maximize its benefits [25]. Researchers have suggested that challenge emotions are positively associated with the attitudes toward IT [40] and the use of IT [39]. In the COVID-19 situation, users with challenge emotions would feel that contact tracing apps are instrumental in controlling the spread of the virus. Accordingly, we propose the following hypothesis:
Hypothesis 11.
Challenge is positively associated with continuance intention.
Achievement emotions arise when a user perceives beneficial outcomes from the use of IT with limited control over the consequences [41]. Given that individuals fulfill their needs by using IT, they are happy, satisfied, and pleased. However, they do not further explore the benefits of IT because they have little control over the consequences. For example, users of contact tracing apps are happy, satisfied, and pleased when they feel that their need for information is fulfilled. On the other hand, they might feel as though they only receive information and cannot change the situation itself. In this case, their emotions are positive in general, leading them to the state in which they feel pleased with their IT use. Such emotions have been found to be positively associated with attitudes toward IT use [42]. Based on this information, we propose the following hypothesis:
Hypothesis 12.
Achievement is positively associated with continuance intention.
4.1.3. The Direct Effect of Appraisal on Continuance Intention
The main tenet of cognitive appraisal theory is that an individual’s appraisal of an IT event elicits a certain emotional reaction. Researchers have argued that both consistent and contradictory appraisals of an IT event are possible [28], and our qualitative study supports the theory of mixed appraisals. Although a user may feel that contact tracing apps are beneficial for controlling the spread of infection, he or she can also appraise the use of such apps as detrimental because it encourages excessive government surveillance and causes significant privacy invasion. Thus, a user can appraise aspects of contact tracing in different ways. Therefore, because perceived threat and opportunity function as independent antecedents of continuance intention, we present the following hypotheses:
Hypothesis 13.
Perceived threat is negatively associated with continuance intention.
Hypothesis 14.
Perceived opportunity is positively associated with continuance intention.
4.2. Method
4.2.1. Data Collection
We used a survey to collect empirical data from individuals who had used smartphone apps for contact tracing during the COVID-19 pandemic. To conduct the survey, we commissioned an online research institution with the largest panel size in South Korea. The survey was conducted from 22 to 30 April 2020. Among the 1000 questionnaires initially distributed to the panel, 567 questionnaires were returned. After removing 59 questionnaires that were incomplete or imprecise regarding the names of the tracing apps used, we included 506 questionnaires in the final data analysis. Table 3 displays the demographic characteristics of the respondents.
Table 3.
The demographic characteristics of the respondents.
4.2.2. Measurement
To psychometrically assess perceived opportunity and threat, we adapted the scale developed by Bala and Venkatesh [43]. To measure user emotions, we adopted the classification of emotions proposed by Beaudry and Pinsonneault [26]. The respondents were asked to report the degree to which they felt each specific emotion. To measure the users’ continuance intentions, we incorporated the scale presented by Bhattacherjee [44]. A seven-point Likert scale was used for all psychometric measures. To establish the robustness of our structural model, we used age, gender, education, tracing-app usage frequency, and innovation traits as control variables. The measurement items, scales, and their sources are presented in Appendix A.
5. Results and Analysis
We tested our model with the partial least squares (PLS) method, a structural equation modeling (SEM) form that enables researchers to examine several factors affecting multiple dependent variables [45]. Researchers recommend using PLS when the phenomenon is in the early stages of theoretical development [46], which is the case in this study. We used the software SmartPLS 3.0 (SmartPLS GmbH, Bönningstedt, Germany) for data analysis.
5.1. Measurement Model
Drawing on the emotion framework [26], we placed diverse emotions into four classes: loss, deterrence, challenge, and achievement. To test the validity of the discrete emotion classes, we conducted a principal axis factoring analysis using the varimax method [47]. Of the 21 emotion items, 18 were loaded on each distinct factor, and the factor loadings for all items were greater than 0.7 except for three items: satisfaction (0.627) from the achievement class and playfulness (0.598) and excitement (0.577) from the challenge class. Given the nature of the apps, which were used to prevent infection, the users may not have experienced these emotions. Accordingly, we removed these three items from further analyses. The results of the factor analysis showed that all item loadings exceeded the recommended value of 0.7 and were thus statistically significant. Table 4 contains the factor and cross loadings for each item.
Table 4.
The results of the factor analysis.
Next, we tested the reliability and validity of our measurement model. Table 4 shows that all the criteria for convergent validity were met, with CA values ranging from 0.883 to 0.942, CR values ranging from 0.910 to 0.954, and AVE values ranging from 0.679 to 0.796. To assess discriminant validity, we examined the AVE values of all constructs. For the discriminant validity of our measurement model to be ensured, the square root of a construct’s AVE must exceed its correlation with every other construct [45]. As shown in Table 5, each construct’s square root of AVE is greater than its correlation with all the other constructs, confirming the discriminant validity of the measurement model.
Table 5.
Reliability, discriminant validity, and correlation of constructs.
As shown in Table 6, the users’ emotional reactions toward the use of contact tracing apps were mixed. At the specific emotion level, the users experienced relatively greater levels of relief (mean = 4.39), hope (mean = 4.20), and worry (mean = 4.20). At the emotion class level, the users experienced positive emotions mixed with negative emotions: achievement (mean = 4.01) and deterrence (mean = 3.85) were the most salient emotions, followed by challenge (mean = 3.81) and loss (mean = 3.14).
Table 6.
The emotional intensity of the respondents.
Finally, we used Harman’s one-factor analysis to examine whether data variance was due to the use of a common data source [48]. Common method bias (CMB), wherein a single factor accounts for most of the covariance in the research variables, can reduce the quality of a dataset. Therefore, we subjected all measures to a principal component analysis without factor rotation, and we determined that no single factor predominantly accounted for the variance in the data.
5.2. Structural Model
Figure 5 shows the results of the structural model test. The model accounted for 43% of the variance in continuance intention. The results indicated that perceived threat negatively influenced continuance intention (β = −0.129, p < 0.001), while perceived opportunity positively influenced continuance intention (β = 0.493, p < 0.001). In addition, the results showed that perceived threat significantly increased challenge (β = 0.133, p < 0.05), deterrence (β = 0.336, p < 0.001), and loss emotions (β = 0.366, p < 0.001). In contrast, perceived opportunity significantly increased achievement (β = 0.257, p < 0.001) and challenge emotions (β = 0.298, p < 0.001) and decreased loss emotions (β = −0.234, p < 0.001). The results also revealed that only two classes of emotions—challenge and loss—were significant factors that influenced continuance intention. Challenge increased continuance intention (β = 0.228, p < 0.001), whereas loss decreased continuance intention (β = −0.264, p < 0.001).
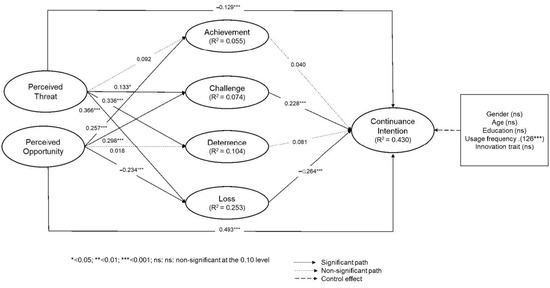
Figure 5.
The results of the hierarchical regression analysis.
6. Discussion
The results demonstrate that although the respondents considered their use of contact tracing apps to be beneficial in general, they also evaluated them as detrimental due to privacy issues, misinformation, mental distress, and poor system quality. Such negative appraisals impacted the respondents’ continuance intentions. The results also show that some users were more concerned about disclosing their personal information (e.g., past movements in detail by time slot) than becoming infected (see Table 2). Although specific personal identity information is not included in contact tracing apps, the public can potentially identify individuals based on the revealed information. If users are concerned about criticism from the public, they may be reluctant to be tested or hide the fact that they are infected. In this case, disclosing information on the confirmed individuals’ movements can hinder control of the infection.
The results also indicate that user emotions play a significant role in determining continuance intention. Of the discrete emotions, loss was found to be the most salient class of emotions that decreased continuance intention. These results imply that if a person experiences loss emotions (anger, frustration, dissatisfaction, disappointment, disgust), he or she will be unwilling to continue using contact tracing apps. Cognitive appraisal theory explains that people experience loss emotions when they evaluate the use of a technology as detrimental and feel that they have limited control over the expected consequences. Our qualitative study provides information on the factors that increase loss emotions: users are significantly threatened by intrusions to their privacy.
6.1. Implications for Research
This study makes several key academic contributions. First, it fills a gap in the disaster management literature by empirically examining users’ appraisals of technologies that rely on massive surveillance and tracing based on a centralized database. Such technologies are controversial due to the conflict between public safety and the invasion of privacy. This study explores the contradiction underlying user appraisals and emotions, which jointly determine users’ continuance intentions. Our conceptualization of perceived threats and opportunities can help researchers develop, test, and revise models that consider the interplay between users’ appraisals and their emotional responses to IT during a public health disaster.
Second, this study contextualizes users’ perceived threats and opportunities while using contact tracing apps during the COVID-19 pandemic when rapid testing, tracing, and treating are crucial for preventing the spread of the virus. Although the public agrees that digital tracing is necessary during this public health crisis [3], our study emphasizes that individual users appraise the use of contact tracing as detrimental due to the expected harmful effects on their lives.
Studies examining the role of emotion in IT use are rare, despite calls to pay more explicit attention to this topic [28,49]. Our work contributes to emotion classification by empirically testing the utility of the emotion framework proposed by Beaudry and Pinsonneault [26]. Although other studies have previously adopted this framework, most represented each class with a single specific emotion. Few studies have examined the full range of emotions related to IT use. By successfully grouping specific emotions into different classes, this study provides a more comprehensive and nuanced understanding of the role of emotion in one’s continuance intention for IT use.
6.2. Implications for Practice
Although information use is essential in a disaster response [9], our results indicate that it can be a double-edged sword for individuals during a crisis. IT artifacts that enable excessive information disclosure without providing users with control over the consequences of their technology use may cause loss emotions, such as anger, frustration, and disgust. Such emotions discourage users from continuing to use the technology. Therefore, app designers should create functions that give users a sense of control over their technology use. Designers of IT artifacts or tracing-app functions must avoid the excessive disclosure of personal information. Public policymakers should also consider developing measures that protect privacy.
6.3. Limitations and Future Research Directions
The contributions of our study should be interpreted in light of its limitations, which point to future research directions. First, the current study employed a cross-sectional survey method to collect data from tracing app users during the COVID-19 pandemic. Users’ emotions and their continuance intention might have been influenced by the severity of infection in a specific period of time. Although our study focuses on the relationship between emotions and continuance intention, future studies might benefit from collecting data from multiple periods of time to ensure the generalizability of the findings. Second, our data were collected from a single source, and all research constructs were measured by respondent perceptions. Although our data analyses revealed that the CMB was not a serious concern for the current study, we encourage future studies to use objective data, such as usage data or log data, in the use of specific functions to better address the CMB issue.
7. Conclusions
Recent IT research has highlighted the role of IT in disaster management. Our model developed based on cognitive appraisal theory recognizes that contact tracing apps for infection prevention provide users with unique socio-technological environments that feature dual effects of IT artifacts that engender perceived threats and opportunities. Our study emphasizes that the way users assess contact tracing apps determines their emotional experience, by which their continuance intentions are influenced. Therefore, to sustain a user’s engagement with contact tracing apps, proper campaigns for the use of technology and public policy that alleviate public concerns in relation to tracing technology should be developed.
Author Contributions
A.S. conducted the investigations and mainly wrote the manuscript. M.L. revised the manuscript and contributed to data presentation. All authors have read and agreed to the published version of the manuscript.
Funding
This research received no external funding.
Institutional Review Board Statement
The study was conducted according to the guidelines of the Declaration of Helsinki.
Informed Consent Statement
Informed consent was obtained from all subjects involved in the study.
Data Availability Statement
The data presented in this study are available on request from the corresponding author.
Conflicts of Interest
The authors declare no conflict of interest.
Appendix A
Table A1.
Measurement items.
Table A1.
Measurement items.
| Category | Construct | Items |
|---|---|---|
| Appraisal | To what extent do you agree with the following statements? Seven-point Likert scale: 1 = strongly disagree; 7 = strongly agree | |
| Perceived threat [43] | 1. I think that using the contact tracing app will have a negative effect on me. 2. The contact tracing app will have harmful (or bad) consequences for me. 3. I feel that the contact tracing app might actually have a detrimental effect on my life. | |
| Perceived opportunity [43] | 1. I am confident that using the contact tracing app has been a positive experience for me. 2. I feel that the contact tracing app adds new value to public health. 3. The contact tracing app provides opportunities for me to control the virus. 4. The contact tracing app is beneficial for society because it increases the public’s risk perceptions. | |
| Emotion | To what extent have you experienced the following emotions while using the contact tracing app? Seven-point Likert scale: 1 = not at all; 7 = to a very large extent | |
| Challenge [26] | 1. Excitement * 2. Hope 3. Anticipation 4. Arousal 5. Playfulness * 6. Flow | |
| Achievement [26] | 1. Happiness 2. Satisfaction * 3. Pleasure 4. Relief 5. Enjoyment | |
| Loss [26] | 1. Anger 2. Dissatisfaction 3. Disappointment 4. Annoyance 5. Frustration 6. Disgust | |
| Deterrence [26] | 1. Anxiety 2. Fear 3. Worry 4. Distress | |
| Behavioral intention | To what extent do you agree with the following statements? Seven-point Likert scale: 1 = strongly disagree; 7 = strongly agree | |
| Continuance intention [44] | 1. I plan to use the contact tracing app in the future. 2. I intend to continue using the contact tracing app in the future. 3. I expect my use of the contact tracing app to continue in the future. 4. If I could, I would like to continue my use of the contact tracing app in the future. | |
* Deleted in the final analysis due to low loading scores.
References
- Anderez, D.O.; Kanjo, E.; Pogrebna, G.; Kaiwartya, O.; Johnson, S.D.; Hunt, J.A. A Covid-19-based modified epidemiological model and technological approaches to help vulnerable individuals emerge from the lockdown in the UK. Sensors 2020, 20, 4967. [Google Scholar] [CrossRef]
- Grange, E.S.; Neil, E.J.; Stoffel, M.; Singh, A.P.; Tseng, E.; Resco-Summers, K.; Fellner, B.J.; Lynch, J.B.; Mathias, P.C.; Mauritz-Miller, K. Responding to Covid-19: The UW medicine information technology services experience. Appl. Clin. Inform. 2020, 11, 265–275. [Google Scholar] [CrossRef]
- Cohen, I.G.; Gostin, L.O.; Weitzner, D.J. Digital smartphone tracking for COVID-19: Public health and civil liberties in tension. JAMA 2020, 323, 2371–2372. [Google Scholar] [CrossRef]
- Lazarus, R.S. Emotion and Adaptation; Oxford University Press Demand: New York, NY, USA, 1991. [Google Scholar]
- Lazarus, R.S. Relational Meaning and Discrete Emotions; Oxford University Press: New York, NY, USA, 2001. [Google Scholar]
- Chan, T.C.; Killeen, J.; Griswold, W.; Lenert, L. Information technology and emergency medical care during disasters. Acad. Emerg. Med. 2004, 11, 1229–1236. [Google Scholar] [CrossRef] [PubMed]
- Sakurai, M.; Murayama, Y. Information technologies and disaster management–Benefits and issues. Prog. Disaster Sci. 2019, 2. [Google Scholar] [CrossRef]
- Callaway, D.W.; Peabody, C.R.; Hoffman, A.; Cote, E.; Moulton, S.; Baez, A.A.; Nathanson, L. Disaster mobile health technology: Lessons from Haiti. Prehospital Disaster Med. 2012, 27, 148–152. [Google Scholar] [CrossRef] [PubMed]
- Pan, X.-B. Application of personal-oriented digital technology in preventing transmission of COVID-19, China. Ir. J. Med Sci. 2020, 1–2. [Google Scholar] [CrossRef] [PubMed]
- Tambo, E.; Kazienga, A.; Talla, M.; Chengho, C.; Fotsing, C. Digital technology and mobile applications impact on Zika and Ebola epidemics data sharing and emergency response. J. Health Med. Inform. 2017, 8, 1–7. [Google Scholar]
- Boulos, M.N.K.; Geraghty, E.M. Geographical tracking and mapping of coronavirus disease COVID-19/severe acute respiratory syndrome coronavirus 2 (SARS-CoV-2) epidemic and associated events around the world: How 21st century GIS technologies are supporting the global fight against outbreaks and epidemics. Int. J. Health Geogr. 2020, 19, 1–12. [Google Scholar]
- Kim, B. Effects of social grooming on incivility in COVID-19. Cyberpsychol. Behav. Soc. Netw. 2020, 23, 519–525. [Google Scholar] [CrossRef]
- Brownstein, J.S.; Freifeld, C.C.; Chan, E.H.; Keller, M.; Sonricker, A.L.; Mekaru, S.R.; Buckeridge, D.L. Information technology and global surveillance of cases of 2009 H1N1 influenza. N. Engl. J. Med. 2010, 362, 1731–1735. [Google Scholar] [CrossRef] [PubMed]
- Huang, C.-M.; Chan, E.; Hyder, A.A. Web 2.0 and Internet social networking: A new tool for disaster management?-Lessons from Taiwan. BMC Med. Inform. Decis. Mak. 2010, 10, 1–5. [Google Scholar] [CrossRef] [PubMed]
- Hernández-Orallo, E.; Calafate, C.T.; Cano, J.-C.; Manzoni, P. Evaluating the effectiveness of Covid-19 bluetooth-based smartphone contact tracing applications. Appl. Sci. 2020, 10, 1–19. [Google Scholar] [CrossRef]
- Hernández-Orallo, E.; Manzoni, P.; Calafate, C.T.; Cano, J.-C. Evaluating How Smartphone Contact Tracing Technology Can Reduce the Spread of Infectious Diseases: The Case of COVID-19; IEEE Access: New York, NY, USA, 2020; Volume 8, pp. 1–15. [Google Scholar]
- Abrahams, N.; Flockhart, F.; Cramer, S.; Cwalina, C.; Evans, M.; Gamvros, A.; Himo, J.; Hobson, T.; Kessler, D.; Ritzer, C. Contact Tracing Apps: A New World for Data Privacy. 2020. Available online: https://www.nortonrosefulbright.com/en-hk/knowledge/publications/d7a9a296/contact-tracing-apps-a-new-world-for-data-privacy#South%20Africa (accessed on 27 December 2020).
- Lee, D.; Lee, J. Testing on the Move South Korea’s rapid response to the COVID-19 pandemic. Transp. Res. Interdiscip. Perspect. 2020, 5, 1–9. [Google Scholar] [CrossRef]
- Chunara, R.; Freifeld, C.C.; Brownstein, J.S. New technologies for reporting real-time emergent infections. Parasitology 2012, 139, 1843–1851. [Google Scholar] [CrossRef][Green Version]
- Oh, S.-H.; Lee, S.Y.; Han, C. The effects of social media use on preventive behaviors during infectious disease outbreaks: The mediating role of self-relevant emotions and public risk perception. Health Commun. 2020. [Google Scholar] [CrossRef]
- Guo, J.; Liu, N.; Wu, Y.; Zhang, C. Why do citizens participate on government social media accounts during crises? A civic voluntarism perspective. Inf. Manag. 2020, 58, 1–12. [Google Scholar] [CrossRef]
- Sacks, J.A.; Zehe, E.; Redick, C.; Bah, A.; Cowger, K.; Camara, M.; Diallo, A.; Gigo, A.N.I.; Dhillon, R.S.; Liu, A. Introduction of mobile health tools to support Ebola surveillance and contact tracing in Guinea. Glob. Health: Sci. Pract. 2015, 3, 646–659. [Google Scholar] [CrossRef]
- Yang, G.-Z.; Nelson, B.J.; Murphy, R.R.; Choset, H.; Christensen, H.; Collins, S.H.; Dario, P.; Goldberg, K.; Ikuta, K.; Jacobstein, N. Combating Covid-19—The Role of Robotics in Managing Public Health and Infectious Diseases; Science Robotics: Washington, DC, USA, 2020. [Google Scholar]
- Chattopadhyay, P.; Glick, W.H.; Huber, G.P. Organizational actions in response to threats and opportunities. Acad. Manag. J. 2001, 44, 937–955. [Google Scholar]
- Beaudry, A.; Pinsonneault, A. Understanding user responses to information technology: A coping model of user adaptation. MIS Q. 2005, 29, 493–524. [Google Scholar] [CrossRef]
- Beaudry, A.; Pinsonneault, A. The other side of acceptance: Studying the direct and indirect effects of emotions on information technology use. MIS Q. 2010, 34, 689–710. [Google Scholar] [CrossRef]
- Strauss, A.; Corbin, J. Basics of Qualitative Research; Sage Publications: New York, NY, USA, 1990. [Google Scholar]
- Stein, M.-K.; Newell, S.; Wagner, E.L.; Galliers, R.D. Coping with information technology: Mixed emotions, vacillation, and nonconforming use patterns. MIS Q. 2015, 39, 367–392. [Google Scholar] [CrossRef]
- Cohen, S.; Underwood, L.G.; Gottlieb, B.H. Social Support Measurement and Intervention: A Guide for Health and Social Scientists; Oxford University Press: New York, NY, USA, 2000. [Google Scholar]
- Braun, V.; Clarke, V. Using thematic analysis in psychology. Qual. Res. Psychol. 2006, 3, 77–101. [Google Scholar] [CrossRef]
- Myrick, J.G. The role of emotions and social cognitive variables in online health information seeking processes and effects. Comput. Hum. Behav. 2017, 68, 422–433. [Google Scholar] [CrossRef]
- Lee, Y.; Kwon, O. Intimacy, familiarity and continuance intention: An extended expectation–confirmation model in web-based services. Electron. Commer. Res. Appl. 2011, 10, 342–357. [Google Scholar] [CrossRef]
- Kessler, S.H.; Schmidt-Weitmann, S. Diseases and emotions: An automated content analysis of health narratives in inquiries to an online health consultation service. Health Commun. 2019, 36, 226–235. [Google Scholar] [CrossRef]
- Wen-Hai, C.; Yuan, C.Y.; Liu, M.T.; Fang, J.F. The effects of outward and inward negative emotions on consumers’ desire for revenge and negative word of mouth. Online Inf. Rev. 2019, 43, 818–841. [Google Scholar] [CrossRef]
- Liang, H.; Xue, Y.; Pinsonneault, A.; Wu, Y. What users do besides problem-focused coping when facing it security threats: An emotion-focused coping perspective. MIS Q. 2019, 43, 373–394. [Google Scholar] [CrossRef]
- Zeelenberg, M.; Pieters, R. Beyond valence in customer dissatisfaction: A review and new findings on behavioral responses to regret and disappointment in failed services. J. Bus. Res. 2004, 57, 445–455. [Google Scholar] [CrossRef]
- Bougie, R.; Pieters, R.; Zeelenberg, M. Angry customers don’t come back. they get back: The experience and behavioral implications of anger and dissatisfaction in services. J. Acad. Mark. Sci. 2003, 31, 377–393. [Google Scholar] [CrossRef]
- Han, S.; Lerner, J.S.; Keltner, D. Feelings and consumer decision making: The appraisal-tendency framework. J. Consum. Psychol. 2007, 17, 158–168. [Google Scholar] [CrossRef]
- Guo, A.; Shao, L.; Zuo, Z. Influence of employees’ emotions on their use of new information technology. In Proceedings of the PICMET’12: Technology Management for Emerging Technologies 2012, Vancouver, BC, Canada, 29 July–2 August 2012; IEEE: New York, NY, USA, 2012; pp. 2221–2226. [Google Scholar]
- Agarwal, R.; Karahanna, E. Time flies when you are having fun: Cognitive absorption and beliefs about information technology usage. MIS Q. 2000, 24, 665–694. [Google Scholar] [CrossRef]
- Nesse, R.M.; Ellsworth, P.C. Evolution. emotions, and emotional disorders. Am. Psychol. 2009, 64, 129–139. [Google Scholar] [CrossRef] [PubMed]
- Kim, H.-W.; Chan, H.; Chan, Y.; Gupta, S. Understanding the balanced effects of belief and feeling on information systems continuance. In Proceedings of the 25th International Conference on Information Systems (ICIS), Washington, DC, USA, 12–15 December 2004; AIS Electronic Library: Milan, Italy, 2004. [Google Scholar]
- Bala, H.; Venkatesh, V. Adaptation to information technology: A holistic nomological network from implementation to job outcomes. Manag. Sci. 2016, 62, 156–179. [Google Scholar] [CrossRef]
- Bhattacherjee, A. Understanding information systems continuance: An expectation-confirmation model. MIS Q. 2001, 25, 351–370. [Google Scholar] [CrossRef]
- Fornell, C.; Larcker, D.F. Structural Equation Models with Unobservable Variables and Measurement Error: Algebra and Statistics; Sage Publications Sage CA: Los Angeles, CA, USA, 1981. [Google Scholar]
- Chin, W.W. The partial least squares approach to structural equation modeling. Mod. Methods Bus. Res. 1998, 295, 295–336. [Google Scholar]
- Hair, J.F.; Black, W.C.; Babin, B.J.; Anderson, R.E.; Tatham, R.L. Multivariate Data Analysis; Prentice Hall: Upper Saddle River, NJ, USA, 1998. [Google Scholar]
- Podsakoff, P.M.; Organ, D.W. Self-reports in organizational research: Problems and prospects. J. Manag. 1986, 12, 531–544. [Google Scholar] [CrossRef]
- Mcgrath, K. Affection not affliction: The role of emotions in information systems and organizational change. Inf. Organ. 2006, 16, 277–303. [Google Scholar] [CrossRef]


Publisher’s Note: MDPI stays neutral with regard to jurisdictional claims in published maps and institutional affiliations. |
© 2021 by the authors. Licensee MDPI, Basel, Switzerland. This article is an open access article distributed under the terms and conditions of the Creative Commons Attribution (CC BY) license (http://creativecommons.org/licenses/by/4.0/).