Abstract
In this paper, the multifractal detrended fluctuation analysis (MF-DFA) method is used to identify the multifractal structure of in the Chicago Board of Trade (CBOT) soybean futures and quantitatively describe the inefficiency and nonlinearity of the market. The data is the daily price of CBOT soybean futures from 3 January 2000 to 20 December 2019, with a total of 5025 trading days. The empirical results also show that the perspective based on MF-DFA can explain the market’s nonlinear, long-range correlation, predictability and other financial anomalies. At the same time, the prediction of price change direction and risk degree of the market are further studied. It is pointed out that multifractal characteristics are generated under the joint action of fat-tail distribution and long-range correlation. Investors can make use of these market characteristics to make arbitrage possible. Finally, based on the empirical results, some policy suggestions are put forward: strengthening rational investment education, strengthening supervision, reducing information asymmetry and other measures to improve market efficiency.
1. Introduction
The efficient market hypothesis (EMH) is a cornerstone of financial economics. The pioneering work of Fama [1] came up with a classic definition: a market that “fully reflects all available information” is information-efficient. As an inevitable result of the efficient market hypothesis, people cannot accept the existence of long-range dependence in financial time series, because its existence will allow a risk-free and profitable trading strategy. If the market is information-efficient, arbitrage can prevent this strategy from occurring [2,3,4]. However, many scholars have questioned the EMH through empirical studies. They found that stock markets, exchange rates, gold and other financial markets did not fully follow the EMH, and found many financial anomalies: long-term correlation [5,6], higher peak and fat tail [7,8,9], and multifractal [10,11,12,13], and so on. Fractal market hypothesis [FMH] theory [14] studies and analyzes the basic problems in the financial system from a new perspective and revises the linear model of mainstream financial economics from a nonlinear perspective, which can effectively explain many financial anomalies. Therefore, it has been highly concerned by the practical and theoretical circles.
The efficiency of the financial market is a very important topic in the existing literature and has been studied by many scholars. As far as we know, there are many methods to estimate market efficiency, including linear unit root test [15,16] and co-integration [17,18], which are based on the efficient market hypothesis. However, from the fractal market hypothesis perspective, Edgar [19] demonstrated the monofractal characteristics of several financial markets through R/S analysis. Further, many scholars believe that if the fractal structure is not uniform, the monofractal cannot well describe the fractal structure of the market [20,21], and the multifractal detrended fluctuation analysis (MF-DFA) can overcome this weakness [22]. MF-DFA is a main method to study nonlinear structure, which not only can determine the structure of multifractal market and its causes but also can extract market efficiency effectively. Obiyathulla [23] pointed out that developed markets rank relatively high in short-term efficiency but low in long-term efficiency; Mensi [24] estimated the weak formal efficiency of the stock index of 10 sectors of the Islamic stock market based on the method of MF-DFA; Shahzad [25] investigated the relative efficiency of the credit market and the stock market by means of MF-DFA, and showed that the credit market was less efficient than the equity market; Bouoiyour [26] found that the efficiency of Islamic stock markets is time varying, both the developed and the emerging Islamic stock markets seem to include some inefficient forms in the short-run; Al-Yahyaee [27] found that the long-memory feature and multifractality of the Bitcoin market was stronger, therefore Bitcoin was more inefficient than the gold, stock and currency markets; Kumar [28] employed the MF-DFA based on the generalized Hurst exponents to compare the relative efficiency between short- and long-run horizons and small and large fluctuations, and the findings show that most markets are more efficient in the long-term than in the short-term. Thus, the method of MF-DFA is widely used in financial literatures [29,30,31,32,33].
Agricultural products, especially soybean and other bulk agricultural products, are the earliest futures varieties in the world. Up to now, soybean futures are still one of the most actively traded futures contracts of agricultural products. Therefore, soybean futures are still the most important contract varieties in the futures market. Due to the significant development of trading volume in the Chicago Board of Trade (CBOT) soybean futures market in recent years, market dynamics may show some unique characteristics, such as multifractals and other nonlinear complex features. Some literatures have studied the non-linear and multifractal market of agricultural products: Ruan [34] found that there exists multifractality in the soybean, soymeal and soyoil futures return series of Chinese market using the MF-DFA method; Chatrath [35] conducted tests for the presence of low-dimensional chaotic structure in the futures prices of four important agricultural commodities, and found there are strong evidences of non-linear dependence; Corazza [36] pointed that the fractal structure and the existence of long-term dependence were detected in six agricultural futures. However, few literatures used the MF-DFA method to conduct in-depth research on the efficiency of the CBOT soybean futures market and find out the reasons for market inefficiency.
Therefore, the main contributions of this paper are as follows: (1) to use the MF-DFA method to study the inefficiency of CBOT soybean futures market (The inefficiency of financial product is one of the most important issues addressed in the existing literature. Thus, the present paper attempts to discuss the inefficiency of CBOT soybean futures market, in an attempt to fill the gap in this hot spot); and (2) to further study the causes of inefficiency in this market and give policy suggestions to improve the efficiency of the market.
This paper will be divided into two parts for analysis. In the first part, MF-DFA is used to analyze the multifractal characteristics of soybean futures price and to extract practical information such as market inefficiency from the multifractal spectrum in order to guide financial practice. The second part analyzes the source of market inefficiency and gives policy suggestions to improve market efficiency.
The paper is organized as follows. In the Section 2, the theoretical framework and research methods are proposed; data description is introduced in the Section 3; Section 4 presents and analyzes the empirical results and analysis; the conclusion and economic implications are outlined in the Section 5.
2. Theoretical Framework and Research Methods
Multifractal Detrended Fluctuation Analysis (MF-DFA) is one of the major analytical methods for studying the multi-fractal structure of nonlinear dynamic complex systems. This method is widely used in the field of economy and finance.
2.1. Multifractal Detrended Fluctuation Analysis (MF-DFA) Method
The MF-DFA method proposed by Kantelhardt [37], which was improved by Thompson [38], can verify the existence of multifractal structures and can also distinguish the causes of multifractal characteristics caused by long-term correlation or fat-tail distribution by comparing with the original time series and the sequence obtained after shuffled (or the sequence obtained after phase-randomized). The degree of the multifractal can also be calculated by the multifractal spectrum. The method mainly has the following steps:
Suppose the sample time series has length N.
Step 1: Construct the profile ., where .
Step 2: Divide into nonoverlapping equally spaced subintervals, where is the length of the subinterval. Where is the largest integer not greater than . In order to fully cover the information contained in {} on the side, the subinterval was divided from the end of { on the side in the same way. Then, we achieve a total of subintervals.
Step 3: Use the OLS (optimal least squares) method to fit the sequence in each segment to obtain the local trend of each segment.
Step 4: Determine the mean square difference .
Step 5: Calculate the -order wave function corresponding to the segmentation length of different subintervals. Its expression is as follows:
The relation between wave function and subinterval length and fractal structure order is studied. For a given value, the images of and are drawn, and then a set of sequences are obtained according to different values. If the sequence is related to the long-range power law, then the generalized Hurst exponent can be defined as . When the sequence is multifractal, is significantly dependent on . If the sequence is singly fractal, then should always be the same no matter the value—in particular, when = 2, is the classical Hurst exponent in the traditional method. If , the trend change is positive and continuous (the value in the future period changes in the same direction as the past), which also means that we can predict the futures price based on the past price information. If , it is anti-persistent; if , it corresponds to a random walk process. represents a risk measure of price willingness. The greater the value of , the greater the market risk. When the value is greater than 0.5, it indicates a high market risk.
2.2. Multifractal Spectrum Analysis Method
In addition, scaling index is defined as: . By Legendre transformation can be singular index and multifractal spectrum . The difference between max and min is called the multifractal width. In this paper, we follow Zunino [39] and set ; the higher the value of , the higher the multifractal degree, and therefore the lower the market efficiency. is greater than 0, indicating that the probability of the sample being at the top is greater than the probability of it being at the bottom, and vice versa.
2.3. Causes of the Formation of Multifractal
In order to further study its potential nonlinear dynamics, there are two possible reasons for the multifractal of time series: the long-range correlation of large and small fluctuations and the characteristics of the fat-tailed distribution [40]. The causes can be distinguished by the shuffled or phase-randomized sequence and by comparing the multifractal characteristics with the original sequence.
3. Data Description
This paper adopts the daily price of CBOT soybean futures from 3 January 2000 to 20 December 2019, a total of 5025 trading days. The data source is Wind. For convenience, the time series of each data set is expressed as t, and the corresponding price series is expressed as p(t), where t = 1, 2, …, 5025. Figure 1 shows the time series of soybean futures prices from 3 January 2000 to 20 December 2019, including 5025 data. The x-coordinate represents the time and the y-coordinate represents the soybean futures price. Figure 1 shows that the price of CBOT soybean futures rose from the lowest price of $456.5 to the highest price of $1769.2, with an increase of 287.5%, and then dropped from the highest price to $927.75 on 20 December 2019, with a decrease of 47.5%. This indicates that the price of CBOT soybean futures fluctuated greatly. Specifically, it experienced two bull markets: from 3 January 2000 to 3 March 2008, and from 5 December 2008 to 30 August 2012, the price went from $456.50 to $1544.5 and from $783 to $1769.2, respectively. At the same time, we also experienced two bear markets. From 4 March 2008 to 4 December 2008, the first bear market saw a precipitous drop in prices from $1544.5 to $783, a drop of 50%, which was mainly related to the 2008 global financial crisis. The second bear market was from 31 August 2012 to 20 December 2019, with prices falling and bottoming out.
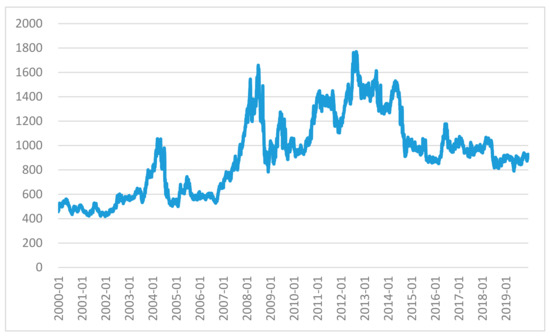
Figure 1.
Historical price trend chart of CBOT soybean futures.
4. Empirical Results and Analysis
4.1. The Multifractal of the Time Series of CBOT Soybean Futures Price
In the MF-DFA model, we chose m = 1; q-order is between −5 and 5; 8 is set as the minimum interval length, and 23 is the maximum interval length [41,42]. Figure 2 shows the generalized Hurst index and multifractal spectrum of soybean futures prices, where “price”, “” and “” respectively represent the original time series, the rearrangement of the original time series and the phase randomization series of the CBOT soybean futures price. The solid line in Figure 2A is a generalized Hurst index H(q) of soybean futures price. As can be seen from the figure, when q = −5, H(q) is 0.9, greater than 0.5; when q value rises between −5 and 5, H(q) decreases steadily. It indicates that the value of H(q) is obviously dependent on the value of q, indicating that the futures price sequence of CBOT soybean has significant multifractal characteristics.
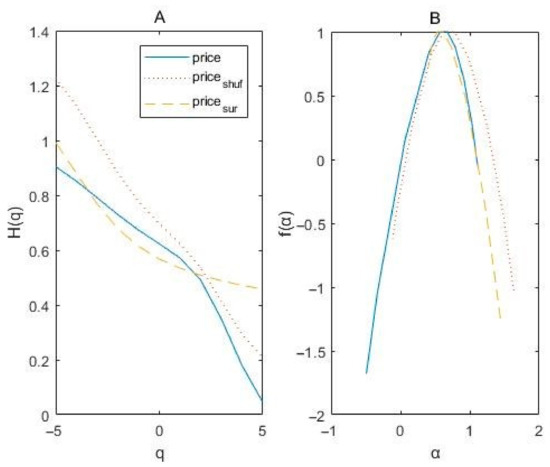
Figure 2.
The Generalized Hurst index and multifractal spectrum of CBOT soybean futures from 3 January 2000 to 20 December 2019. (Notes: (A) stands for generalized hurst exponent and (B) represents multifractal spectrum; represents the original return series, while the shuffled series and the surrogated series are named
and , respectively).
As can be seen from Table 1, H(2) = 0.57 > 0.5, which indicates that the time series of CBOT soybean futures price shows a weak positive persistence, that is, the price of CBOT soybean futures will change in the same direction as the past price in a period of time in the future, showing the persistence of the market fluctuation. This also means that the CBOT soybean futures price is predictable for a period of time in the future. , indicating a high risk in the CBOT soybean futures market and reminding investors to be cautious when investing. Meanwhile, government regulators should comprehensively supervise risks to avoid market collapse and financial crisis.

Table 1.
Multifractal analysis of soybean futures market.
4.2. Multifractal Spectrum Analysis of CBOT Soybean Futures Price Time Series
By observing the multifractal spectrum of CBOT soybean futures prices, the solid line in Figure 2B provides more information about the multifractal characteristics. The shape of the multifractal spectrum has a long left tail, indicating that the futures price of CBOT soybean has a multifractal structure, which is sensitive to large local fluctuations, but not sensitive to small local fluctuations. That is, compared with smaller events, the CBOT soybean futures price is more dominated by the impact of larger events.
As can be seen from Table 2, the width of the multifractal spectrum is , and the multifractal degree is 1.60. The greater the value of is, the more uneven the local fluctuation of the CBOT soybean futures price sequence will be, which means that the CBOT soybean futures price market is inefficient.
Table 2.
Multifractal spectrum analysis of CBOT soybean futures Market.
, less than 0, indicating that the probability of soybean futures price being at the bottom is greater than the probability of it being at the top. has a further directional predictive significance: the operator of the financial market is always thinking that if the price of a financial product is always high, it will strongly stimulate people’s desire to trade and further increase the trading volume, leading to a further rise in the price. On the contrary, if the price of financial products is always low, most people will remain in a wait-and-see or hovering state, thus reducing the willingness to trade, which will lead to further price falls. This also is what we often say “chase after rise to kill drop”. That said, if is greater than 0, the price will continue to rise; when is less than 0, the price drops. Therefore, we can predict the direction of price fluctuation through (here indicating that the price of CBOT soybean futures falls), which is of practical significance for preventing or controlling risks.
To summarize, the above results verify that the futures price of CBOT soybean has multifractal characteristics, and the market is inefficient and has positive persistence. This means that the market does not conform to the efficient market hypothesis (EMH), and the value in the future period of time will change in the same direction as in the past. We can predict the futures price based on the past price information. At the same time, it also indicates the high risk of the market, reminding investors to be cautious when investing, and regulators should fully regulate the risk to avoid market collapse and financial crisis. All these characteristics will provide good judgment for investment decision makers, risk control managers and government regulators.
4.3. Causes of the Formation of Multifractal Characteristics
and are respectively named the shuffled and the phase-randomized sequences of CBOT soybean futures price. Figure 2A is obtained through further analysis of MF-DFA method. The top curve from the left represents , and the middle curve is . As can be seen from Figure 2A, a generalized Hurst index of and shows essentially similar properties. The value of H(q) of the shuffled sequence and the phase-randomized sequence both depend on the order q, and both decrease with the increase of q, indicating that both the shuffled sequence and the phase-randomized sequence have the characteristics of multifractal structure. The generalized Hurst index H(q) of the sequence obtained after the shuffled is steeper than that of the original sequence H(q), and it is always larger than that of the original sequence H(q), indicating that the shuffled results destroy the long-term correlation of the original sequence. On the other hand, the generalized Hurst exponent H(q) of the phase-randomized sequence is flatter than that of the original sequence and smaller than that of the original sequence H(q) in a certain interval, which fully indicates that the phase-randomization result destroys the fat-tailed distribution of the original sequence relatively well.
In combination with Figure 2B and Table 3, it can be seen that for the original sequence of CBOT soybean futures price, the width of the multifractal spectrum of the rearranged sequence is larger than that of the original sequence, indicating that the multifractal characteristics of the sequence after the rearranged transformation are significantly enhanced and the fractal degree is increased. The width of the multifractal spectrum of the sequence after phase-randomization is smaller than that of the original sequence, indicating that the multifractal characteristics of the sequence after phase-randomization are weakened and the degree of fractal is reduced. This fully indicates that the time series of CBOT soybean futures price has multi-fractal characteristics because of both the long-range correlation of the original series and the fat-tailed distribution, and the fat-tail distribution plays a dominant role. In Figure 2B, the dotted line at the top from the right represents , and the dotted line in the middle represents .
Table 3.
Comparative analysis of the multiplicative spectral widths between the sequence after rearrangement and phase randomization and the original sequence.
The fat-tail distribution characteristic of CBOT soybean futures price is a dominant reason for the formation of multifractal, which indicates that the probability of large fluctuation in CBOT soybean futures market is not nearly zero as described in the efficient market investment theory, nor is it a behavior that describes the single scale completely similar to the large fluctuation and small fluctuation. The speculative atmosphere in the CBOT soybean futures market is more intense, and investors chase and suppress the market, leading to frequent price fluctuations. Therefore, the rational investment education for investors should be strengthened; the composition of market investors should be improved; the leading role of investment funds should be brought into play; and the healthy, long-term and stable development of futures markets should be promoted. The long-term correlation of CBOT soybean futures price series is another reason for the formation of multifractal, which indicates that the whole CBOT soybean futures market is not a random process. In fact, the long-term correlation affects future price changes. In a certain period of time, technical analysis plays a certain role in predicting the market trend, and the impact of policies on the market has a lag. In order to solve this situation, financial regulators should pay attention to the confidentiality of information before the release of major policies; strengthen the supervision of information disclosure; and reduce the asymmetry of information. Therefore, investors can timely and accurately grasp the actual situation of the market, make better investment decisions and constantly improve the effectiveness of the market. In short, the time series of CBOT soybean futures price has a multi-fractal structure, indicating that the market has nonlinear characteristics, so we should investigate and study the market from a nonlinear perspective. Because the market is an inefficient one, in particular, because of its positive persistence, further nonlinear predictions are possible.
5. Conclusions and Economic Significance
This paper applies MF-DFA analysis method to empirically study the nonlinearity and inefficiency of the soybean futures market. From the perspective of multifractal, the financial anomalies such as market nonlinearity, long-range correlation and predictability are explained. The price discovery and risk of CBOT soybean futures market were further studied by discussing the multifractal spectrum parameters and the causes of the multifractal structure. This provides a theoretical basis for market price forecast, market regulation, asset pricing and risk management. Through the analysis of this paper, the following enlightenments are drawn:
(1) The above conclusions indicate that the CBOT soybean futures market has the characteristics of multifractal nonlinear dynamics, which is contrary to the efficient market hypothesis theory in traditional financial theories. It also shows that investors can make use of the multifractal and long-term correlation of the market to predict and analyze to some extent, and the feasibility of this analysis makes the market investment arbitrage possible. However, investment arbitrage opportunities may attract international speculative capital, thus increasing the risk in the soybean futures market. Government departments and investors should design hedging strategies for the soybean futures market to effectively manage the risk of soybean futures market.
(2) Financial regulatory institutions should actively support the listing of bulk agricultural futures, optimize the product structure of soybean futures, expand the scale of the soybean futures market, improve and standardize the trading system and strive to increase the market liquidity. At the same time, measures like system construction and mechanism reform should be taken to effectively manage the internal risks in the soybean futures market, reduce the impact of external shocks and increase the effectiveness of the soybean futures market.
(3) Based on the long-term correlation of CBOT soybean futures price series, the impact of the policy on the market has a lag. Therefore, financial regulatory authorities must pay attention to the confidentiality of major policy information before disclosure, strengthen the supervision of agricultural futures and spot information disclosure, reduce information asymmetry and enable investors to grasp the timely and accurate real situation.
(4) Based on the fat-tail distribution characteristics of CBOT soybean futures price, it is likely to have large fluctuations. Therefore, the financial regulatory authorities should strengthen the rational investment education for investors, optimize the market investor structure, give play to the leading role of rational investment funds and the role of “ballast”, maintain the stable development of agricultural futures market and promote its healthy and long-term development. These measures will eventually help to create a stable and sustainable environment for the futures market of soybean products, which is conducive to the benign development of the futures market. In turn, the healthy development of the soybean futures market will directly promote the sustainable development of soybean spot market.
Although the multifractal (inefficient) characteristics and their causes in the soybean futures market are studied in this paper, the microscopic mechanism of the soybean futures market still needs further study and explanation. Therefore, in the future, we will further take investors’ trading behavior and psychological conditions into consideration and further describe the micromarket structure of the market with theoretical models.
Author Contributions
Conceptualization, T.Y. and Y.W.; methodology, T.Y. and Y.W.; software, T.Y.; validation, T.Y. and Y.W.; formal analysis, T.Y.; investigation, T.Y.; resources, T.Y.; data curation, T.Y.; writing—original draft preparation, T.Y.; writing—review and editing, T.Y. and Y.W.; visualization, T.Y.; supervision, Y.W.; project administration, T.Y. and Y.W.; funding acquisition, Y.W. All authors have read and agreed to the published version of the manuscript.
Funding
This research is funded by the National Social Science Fund youth project “research on nonlinear asset pricing model based on deep learning theory under the background of big data Project” (fund number 18CJY057).
Institutional Review Board Statement
Not applicable.
Informed Consent Statement
Not applicable.
Data Availability Statement
The data presented in this study are available on request from the corresponding author.
Conflicts of Interest
The authors declare no conflict of interest.
References
- Fama, E.F. Foundations of Finance: Portfolio Decisions and Securities Prices; Basic Books: New York, NY, USA, 1976. [Google Scholar]
- Eero, I. Simple agent-based dynamical system models for efficient financial markets: Theory and examples. J. Math. Econ. 2017, 69, 38–53. [Google Scholar]
- Timmermann, A.; Granger, C.W.J. Efficient market hypothesis and forecasting. Int. J. Forecast. 2004, 20, 15–27. [Google Scholar] [CrossRef]
- Shmilovici, A.; Alon-Brimer, Y.; Hauser, S. Using a stochastic complexity measure to check the efficient market hypothesis. Comput. Econ. 2003, 22, 273–284. [Google Scholar] [CrossRef]
- Queiros, S.M.D. On non-gaussianity and dependence in financial time series: A nonextensive approach. Quant. Financ. 2005, 5, 475–487. [Google Scholar] [CrossRef]
- Alvarez-Ramirez, J.; Alvarez, J.; Rodriguez, E. Short-Term predictability of crude oil markets: A detrended fluctuation analysis approach. Energy Econ. 2008, 30, 2645–2656. [Google Scholar] [CrossRef]
- Wang, Y.; Wu, C. Energy prices and exchange rates of the U.S. dollar: Further evidence from linear and nonlinear causality analysis. Econ. Model. 2012, 29, 2289–2297. [Google Scholar] [CrossRef]
- Gopikrishnan, P.; Plerou, V.; Gabaix, X.; Amaral, L.A.N.; Stanley, H.E. Price fluctuations and market activity. Phys. Stat. Mech. Appl. 2001, 299, 137–143. [Google Scholar] [CrossRef]
- Wang, Y.; Liu, L. Is WTI crude oil market becoming weakly efficient over time?: New evidence from multiscale analysis based on detrended fluctuation analysis. Energy Econ. 2010, 32, 987–992. [Google Scholar] [CrossRef]
- Shrestha, K. Multifractal detrended fluctuation analysis of return on bitcoin. Int. Rev. Financ. 2019. [Google Scholar] [CrossRef]
- Liu, R.; Demirer, R.; Gupta, R.; Wohar, M. Volatility forecasting with bivariate multifractal models. J. Forecast. 2019, 39. [Google Scholar] [CrossRef]
- Ftiti, Z.; Jawadi, F.; Louhichi, W.; Madani, M.A. On the relationship between energy returns and trading volume: A multifractal analysis. Appl. Econ. 2019, 51, 3122–3136. [Google Scholar] [CrossRef]
- Alaoui, M.E.; Bouri, E.; Roubaud, D. Bitcoin price-volume: A multifractal cross-correlation approach. Financ. Res. Lett. 2019. [Google Scholar] [CrossRef]
- Peters, E. Fractal Market. Analysis: Applying Chaos Theory to Investment and Economics; John Wiley & Sons: New York, NY, USA, 1994. [Google Scholar]
- Giannellis, N.; Papadopoulos, A.P. Testing for efficiency in selected developing foreign exchange markets: An equilibrium-based approach. Econ. Model. 2009, 26, 155–166. [Google Scholar] [CrossRef]
- Lak, F.; Afshari, M.; Gholizadeh, B. An efficiency bayesian unit root test in unobserved-arch models. Commun. Stat. 2017, 46, 4841–4850. [Google Scholar] [CrossRef]
- Layton, A.; Tan, A. Multivariate cointegration testing of the efficiency of Australia’s spot forex market. Account. Financ. 1992, 32, 63–70. [Google Scholar] [CrossRef]
- McNown, R.; Wallace, M. Co-Integration tests for long run equilibrium in the monetary exchange rate model. Econ. Lett. 1989, 31, 263–267. [Google Scholar] [CrossRef]
- Edgar, P. Chaos and Order in the Capital markets, A New View of Cycles, Prices and Market. Volatility; John Wiley Sons, Inc.: New York, NY, USA, 1991; pp. 1–240. [Google Scholar]
- Barabási, A.-L.; Vicsek, T. Multifractality of self-affine fractals. Phys. Rev. 1991, 44, 2730. [Google Scholar] [CrossRef]
- Lopes, R.; Betrouni, N. Fractal and multifractal analysis: A review. Med. Image Anal. 2009, 13, 634–649. [Google Scholar] [CrossRef]
- Minhyuk, L.; Wook, S.J.; Sondo, K.; Woojin, C. Asymmetric market efficiency using the index-based asymmetric-MFDFA. Phys. A Stat. Mech. Appl. 2018, 512, 1278–1294. [Google Scholar]
- Rizvi, S.A.R.; Dewandaru, G.; Bacha, O.I.; Masih, M. An analysis of stock market efficiency: Developed vs Islamic stock markets using MF-DFA. Phys. A Stat. Mech. Appl. 2014, 407, 86–99. [Google Scholar] [CrossRef]
- Mensi, W.; Tiwari, A.K.; Yoon, S.-M. Global financial crisis and weak-form efficiency of Islamic sectoral stock markets: An MF-DFA analysis. Phys. Stat. Mech. Appl. 2017, 471, 135–146. [Google Scholar] [CrossRef]
- Shahzad, S.J.H.; Nor, S.M.; Mensi, W.; Kumar, R.R. Examining the efficiency and interdependence of US credit and stock markets through MF-DFA and MF-DXA approaches. Phys. Stat. Mech. Appl. 2017, 471, 351–363. [Google Scholar] [CrossRef]
- Bouoiyour, J.; Selmi, R.; Wohar, M.E. Are islamic stock markets efficient? A multifractal detrended fluctuation analysis. Financ. Res. Lett. 2018, 26, 100–105. [Google Scholar] [CrossRef]
- Al-Yahyaee, K.H.; Mensi, W.; Yoon, S.-M. Efficiency, multifractality, and the long-memory property of the bitcoin market: A comparative analysis with stock, currency, and gold markets. Financ. Res. Lett. 2018. [Google Scholar] [CrossRef]
- Tiwari, K.A.; Aye, G.C.; Gupta, R. Stock market efficiency analysis using long spans of data: A multifractal detrended fluctuation approach. Financ. Res. Lett. 2018. [Google Scholar] [CrossRef]
- Cao, G.; Cao, J.; Xu, L. Asymmetric multifractal scaling behavior in the chinese stock market: Based on asymmetric MF-DFA. Phys. Stat. Mech. Appl. 2013, 392, 797–807. [Google Scholar] [CrossRef]
- Engelen, S.; Norouzzadeh, P.; Dullaert, W.; Rahmani, B. Multifractal features of spot rates in the liquid petroleum gas shipping market—Sciencedirect. Energy Econ. 2011, 33, 88–98. [Google Scholar] [CrossRef]
- Mensi, W.; Hamdi, A.; Shahzad, S.J.H.; Shafiullah, M.; Al-Yahyaee, K.H. Modeling cross-correlations and efficiency of Islamic and conventional banks from Saudi Arabia: Evidence from MF-DFA and MF-DXA approaches. Phys. Stat. Mech. Appl. 2018, 502, 576–589. [Google Scholar] [CrossRef]
- Lee, Y.J.; Kim, N.W.; Choi, K.H.; Yoon, S.M. Analysis of the Informational Efficiency of the EU Carbon Emission Trading Market: Asymmetric MF-DFA Approach. Energies 2020, 13, 2171. [Google Scholar] [CrossRef]
- Lee, M.; Song, J.W.; Park, J.H.; Chang, W. Asymmetric multi-fractality in the U.S. stock indices using index-based model of A-MFDFA. Chaos Solitons Fractals 2017. [Google Scholar] [CrossRef]
- Ruan, Q.; Cui, H.; Fan, L. China’s soybean crush spread: Nonlinear analysis based on mf-dcca. Phys. Stat. Mech. Appl. 2020, 554, 123899. [Google Scholar] [CrossRef]
- Chatrath, A.; Adrangi, B.; Dhanda, K. Are commodity prices chaotic? Evidence from futures markets are commodity prices chaotic. Agric. Econ. 2002, 27, 123–137. [Google Scholar] [CrossRef]
- Corazza, M.; Malliaris, A.G.; Nardelli, C. Searching for fractal structure in agricultural futures markets. J. Futures Mark. 1997, 17, 433–473. [Google Scholar] [CrossRef]
- Kantelhardt, J.W.; Zschiegner, S.A.; Koscielny-Bunde, E.; Havlin, S.; Bunde, A.; Stanley, H.E. Multifractal detrended fluctuation analysis of nonstationary time series. Phys. Stat. Mech. Appl. 2002, 316, 87–114. [Google Scholar] [CrossRef]
- Thompson, J.R.; Wilson, J.R. Multifractal detrended fluctuation analysis: Practical applications to financial time series. Math. Comput. Simul. 2016, 126, 63–88. [Google Scholar] [CrossRef]
- Zunino, L.; Tabak, B.M.; Figliola, A.; Pérez, D.G.; Garavaglia, M.; Rosso, O.A. A multifractal approach for stock market inefficiency. Phys. Stat. Mech. Appl. 2008, 387, 6558–6566. [Google Scholar] [CrossRef]
- Zhou, W.-X. The components of empirical multifractality in financial returns. Europhys. Lett. 2009, 88, 28004. [Google Scholar] [CrossRef]
- Lashermes, B.; Abry, P.; Chainais, P. New insights into the estimation of scaling exponents. Int. J. Wavelets Multiresolut. Inf. Process. 2004, 2, 497–523. [Google Scholar] [CrossRef]
- Ihlen, E.A.F. Introduction to multifractal detrended fluctuation analysis in Matlab. Front. Physiol. 2012. [Google Scholar] [CrossRef]


Publisher’s Note: MDPI stays neutral with regard to jurisdictional claims in published maps and institutional affiliations. |
© 2021 by the authors. Licensee MDPI, Basel, Switzerland. This article is an open access article distributed under the terms and conditions of the Creative Commons Attribution (CC BY) license (http://creativecommons.org/licenses/by/4.0/).