1. Introduction
Bicycle sharing system has gained global popularity in recent years and users across cities in North America, Europe, and Asia are increasingly using shared bicycles as alternative transport modes for short-distance trips or connection to transit [
1]. Its environmental friendliness and flexible mobility are well-accepted benefits [
2,
3]. Hence, bicycle sharing trips began to substitute trips previously made by public transit, walking, and even private cars [
4,
5].
As a new transportation mode, the bicycle sharing system also brings challenges in transportation planning, especially in the context of established guides such as the European standards, US standards, and Chinese standards [
4]. For cities which were originally not designed for cycling or did not have sufficient public cycling infrastructure, existing transport infrastructures cannot satisfy the demand of bicycle sharing trips. Bicycling accessibility is significantly affected by the availability of shared-bike infrastructures [
6]. In addition, public bicycle infrastructures should be deployed with proper guidance or codes of practice, for example, where to locate potential self-service docking stations, depot, and how to plan for or design dedicated cycling paths. Without a proper planning of cycling infrastructures, the safety and efficiency of bicycle trips could be compromised. If urban and transport planners have the means to better estimate public bicycle usage during the planning stage (especially cycling trip distribution and duration when the bicycles are loaned), decision-makers can take precautions to address issues related to safety, service efficiency, and meeting demand with proper supply planning.
Past researchers have attempted to predict public bicycle demand for transportation planning purposes using information related to the built environment, weather, population density, etc. The majority of these models tend to be focused on trip generation, trip attraction, and destination choice, while few tried to include the trip distribution and trip duration, which is important in terms of establishing infrastructure provision standards and optimization of public bicycle operations. In addition, built environment factors tend to be complex and while many of these factors were studied in the literature, few actually considered such factors in detail [
7,
8,
9,
10,
11,
12,
13]. It must be noted that POI (point of interest) data are derived from modern digital maps and they provide geographical location and category of an urban facility (such as school, restaurant, hospital, etc.) [
14]. This makes it possible for researchers to categorize land use and the built environment in greater detail and to utilize such data for predicting public bicycle trip characteristics.
As such, this paper aims to estimate public bicycle trip characteristics such as trip generation, trip attraction, trip distribution, and duration with detailed POI and smart card data in Nanjing, China. In particular, the scope of this study is focused on examining the influence of various built environment factors on public bicycle trips, and this can offer planners a perspective to better estimate public bicycle usage. The findings from this study are expected to be valuable to planners as well as related operators to provide reliable or tangible standards for a public bicycle system. The remainder of the paper is structured as follows. First, an overview of the existing literature on shared bicycle demand models is presented. Second, we present our approach in developing trip generation, trip distribution, and trip duration models for the public bicycle system through an illustrative case study of a Nanjing, China. This includes a discussion on our study area, data collection efforts, and modeling methodology. Third, a set of negative binomial regression models is developed for trip generation, trip distribution, and trip duration, and key factors that could affect them are discussed. Finally, conclusions are drawn, and the limitations and future research recommendations are discussed.
2. Literature Review
In order to estimate the public bicycle usage for transportation planning purposes, various data resources such as GPS data [
15], live point data [
16], and journey data were employed in the literature. In particular, access to public bicycle journey data has offered opportunities to estimate the bicycle usage in the station level [
7,
8,
9,
10,
11,
12,
13,
17,
18,
19,
20,
21,
22,
23,
24,
25]. Based on these data, numerous studies in the literature had been conducted to determine the influential factors affecting public bicycle usage. In particular, built environment [
7,
8,
9,
10,
11,
12,
13,
25], demographics [
17,
18,
19,
20], and weather [
21,
22,
23,
24] are among the most extensively studied factors. For example, Rixey et al. [
10] first explored the impact of university, park, bikeways, and bus stops on public bicycle usage in three different U.S. cities. Thereafter, the effect of nearby businesses and jobs of the bicycle station [
9] and land use percentage [
8] on public bicycle usage were also investigated. Recently, Zhang et al. [
7] developed multiple linear regression models to understand how the public transport facilities and land use characteristics can influence weekday, weekend, and peak hour bicycle trip generation. Macioszek et al. [
25] analyzed the impact of home and workplace on shared bicycle usage in Warsaw, Poland, using bivariate ordered probit models. Faghih-Imani et al. also studied how the number of restaurants and grocery stores can affect bicycle use in Montreal [
11], Chicago [
12], and New York [
13]. Besides land use characteristics, other nearby bicycle stations and amenities are also found to be influential to the usage and attractiveness of shared bicycles [
26].
Compared to past studies on bicycle trip generation, there are fewer studies on bicycle trip distribution and duration in the literature. González et al. [
27] developed a destination choice model considering route length, socioeconomic characteristics, and presence of metro stations. El-Assi et al. [
21] added the consideration of available parking lots in the station into the destination choice model. However, such data is not possible to obtain during the transportation planning stage and as such, these models can only serve as short-term prediction of trip destination choice post-construction or implementation. Caulfield et al. [
28] further studied the duration of bicycle trips in medium sized cities and found that frequent users tend to have shorter trip durations. Gebhart and Noland [
23] also attempted to investigate the effect of weather and proximity to metro station on trip duration. It is noted that these studies do not really consider the urban fabric or the built environment, including whether there are restaurants, schools, or other POIs that reflect the activities that drive travel demand.
It is well recognized that POIs offer specific services that meet peoples’ various requirements [
29], which can reflect the attractiveness of the built environment on transport demand. Traditional data collection methods on built environment characteristics are costly, time-consuming, and often with a low sampling rate. Today, POI data can be automatically retrieved from web mapping services via API (Application Programming Interface) and numerous researchers have introduced POI data into the analysis of transportation systems [
14,
29]. Nevertheless, there are few transport studies on this aspect focusing on public bicycle usage. This includes Hampshire et al. [
30], who added POI data from Tele Atlas to explain the bicycle trip generation and attraction in Barcelona and Seville, Spain, and Zhao et al. [
31], who adopted POI data to analyze the shared bicycle reallocation demand in Nanjing, China.
It can be seen from the literature that although past researchers have explored the effect of various built environment factors on trip generation and distribution, there is still a lack of a comprehensive approach to include all possible factors and at the same time, consider the major bicycle trip characteristics (i.e., generation, attraction, distribution, and duration).
3. Data Collection
Our study area is located in Hexi District of Nanjing, China. Hexi District has an independent public bicycle system and it does not share its public bicycles with the other districts in Nanjing. All the public bicycle renting transactions are achieved through the use of a smart card. By charging 300 CNY (around 45.96 USD) as a deposit and usage fee, the operator offers each user a unique smart card for renting the bicycle. For the first 2 h, users can ride for free and thereafter, users are charged 1 CNY (around 0.15 USD) per hour within 3 h and charged 3 CNY (around 0.46 USD) per hour after 3 h [
32]. Since the public bicycle system began operations in the district in January 2013, 267 fixed docking stations were set up and nearly 10 thousand bikes came into service.
There are two main types of datasets used in this research: smart card data (journey data) and POI data. Other data, such as station attributes and weather, are obtained through public bicycle operators and public-domain meteorological websites, respectively. Smart card data is one type of journey data, which is only available for a few cities [
17]. A month of smart card data (November 2015) from the public bicycle operator in Hexi District was collected for this study. The dataset records detailed information on each public bicycle trip: card number, rented bicycle number, starting station, ending station, starting time, ending time, etc. Through simple data query methods, we can derive the number of trips generated by or attracted to each station, the origin-destination (OD) matrix, and the duration of each trip. It is worth noting that trips with extremely short durations (within 1 min) are highly likely to be operator or technical errors [
16,
33] and are removed from our dataset. The major OD pair distribution is presented in
Figure 1a, and it can be observed from the figure that most public bicycle trips are somewhat connected to metro lines.
POI data are retrieved from Baidu Map API [
34]. Fifteen most relevant POI types are selected for analysis and they include residence, employment, entertainment, restaurant, bus stop, amenity, shopping, attractions, hotel, school, park, metro station, sports, and hospital. The heat map of all the POIs is shown in
Figure 1b. It can be clearly seen from the figure that there are three gathering places of POIs, two of which are near metro stations. This indicates a high spatial correlation between urban built environment and public bicycle trips.
4. Methodology
4.1. Dependent Variables and Model Choice
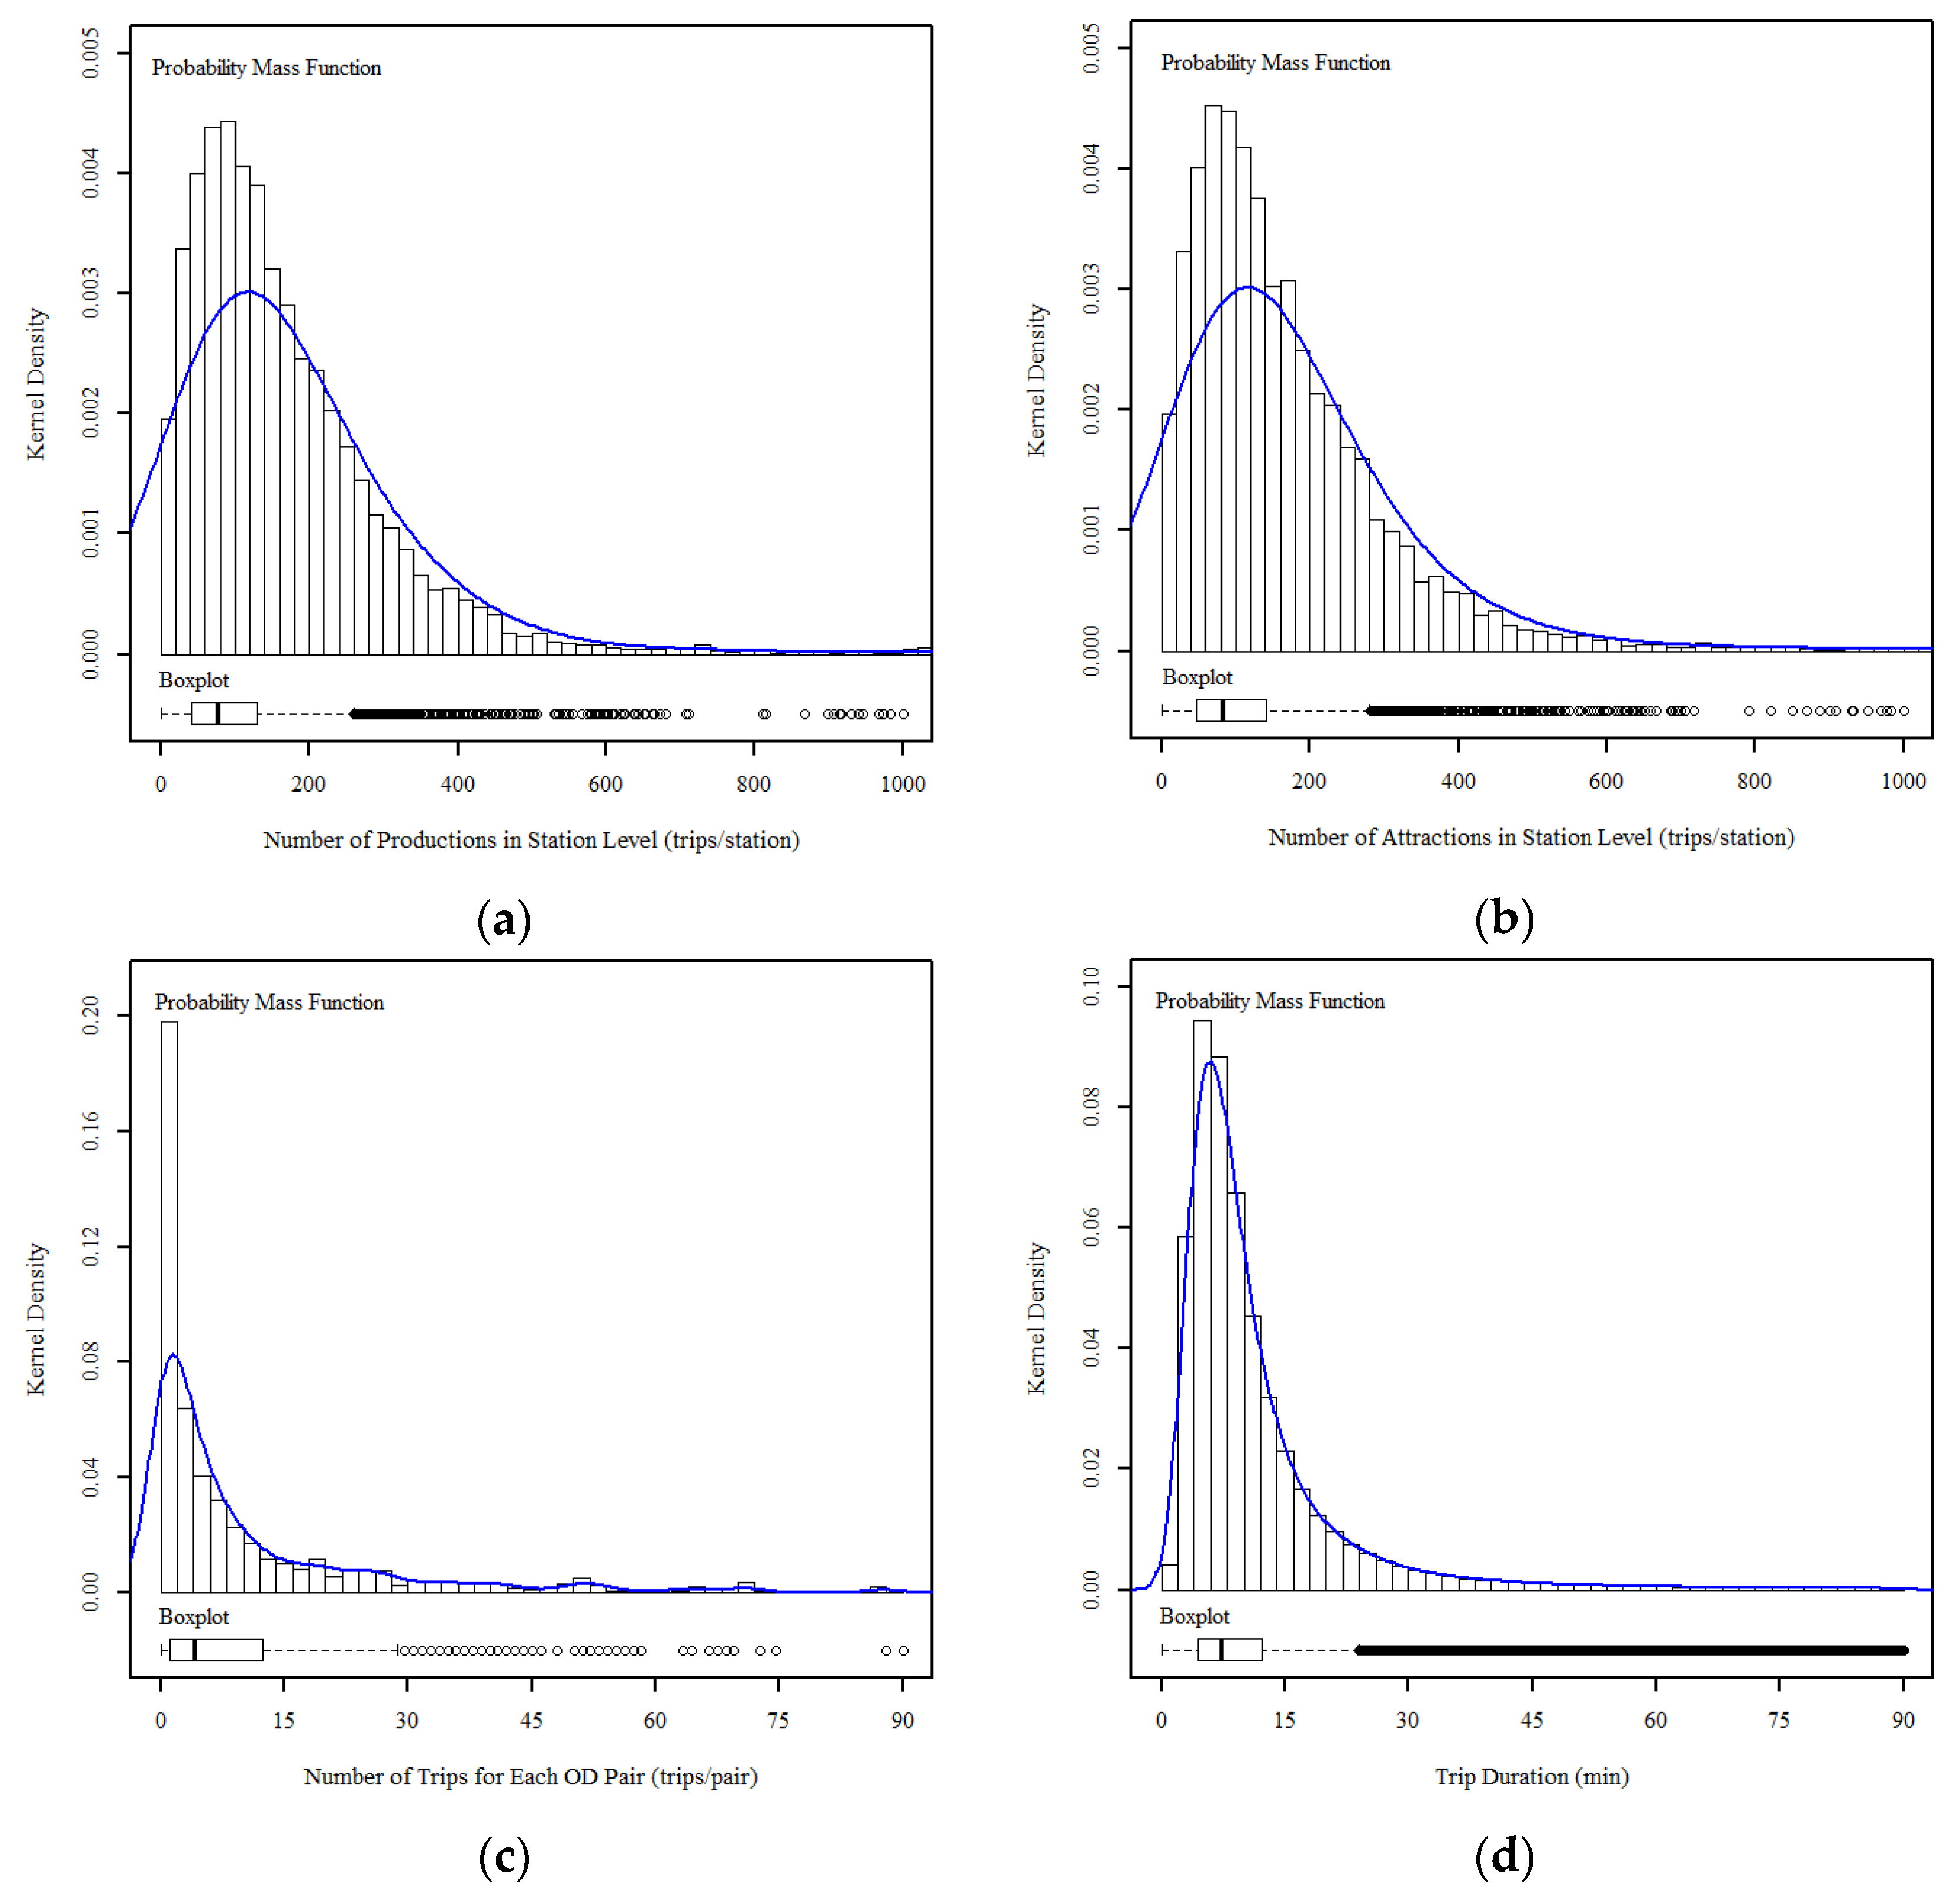
Four dependent variables are considered in this study, namely: trip generation, trip attraction, trip distribution, and trip duration, since they are fundamental for establishing infrastructure provision standards and optimization of public bicycle operations. For example, trip generation and attraction could help to determine the capacity of bicycle infrastructure, while trip distribution and trip duration could affect bicycle reallocation amount and frequency. They are respectively characterized as daily departures for each station, daily arrivals for each station, the number of daily trips between two stations, and the duration of each trip. The histograms of these four dependent variables are shown in
Figure 2. A total of 1,427,770 public bicycle trips occurred in our study period and 57,119 rows of invalid data were removed (where trip duration is less than 1 min and accounting for 3.8% of the entire database).
As shown in
Figure 2, none of the dependent variables conform to a normal distribution, indicating that the ordinary least squares (OLS) method could not be directly applied. Since trip generation, attraction, distribution, and duration can be regarded as count data, Poisson and negative binomial regressions are appropriate to fit them. However, over-dispersion occurred when we conducted the Poisson dispersion test in all the four datasets. This leads us to use negative binomial regression finally to estimate the count model.
In the negative binomial regression model, the probability that dependent variable
Y equals non-negative integer
y conditioning on independent variables
xi is as follows:
where,
λ is the mean of
y and the variance of
y is
under the model assumption. Maximum likelihood estimation (MLE) is used to estimate the coefficients
τ,
β0, and
βi in the following model:
4.2. Selection of Independent Variables
Two groups of independent variables were generated to explore their influences on trip generation, attraction, distribution, and duration, as
Table 1 shows. A great variety of POI data can be derived from Baidu Map and we chose a total of 15 most relevant types to investigate. Their specific contents can be found in the third column of
Table 1. According to the previous studies in other cities [
7,
12] and Nanjing planning standard [
35], we set a 300 m radius as the walkable distance for public bicycle trips. Therefore, the number of POIs in the 300 m buffer is used to capture the influence of POI. Since attractions, hotel, school, park, metro station, sports, and hospital are sparsely scattered in the map, we use dummy variables instead for them.
Weather and station attribute data include mean temperature, rain or not, station capacity, other stations in the 300 m buffer, weekday or not, and trip distance. These variables are used to complement POI data in order to better explain the dependent variables. In particular, the trip distance is measured by the shortest path, which is an appropriate indicator for actual trip distance, though they may not be the same [
12].
5. Results
The results of the four negative binomial regression models are shown in
Table 2,
Table 3,
Table 4,
Table 5,
Table 6 and
Table 7. In linear regression models, researchers use R-squared to measure the proportion of explained deviance. The counterpart for generalized linear models is pseudo R-squared. Although not an exactly equivalent statistic to the adjusted R-square of the linear regression model, pseudo R-squared can evaluate the goodness of fit, also ranging from 0 to 1. There are several pseudo R-squares and we chose Nagelkerke Pseudo R-squared [
19,
28] and Cox-Snell Pseudo R-squared [
9], which have been used in a previous study of public bicycle usage. We also checked the significance of the likelihood ratio chi-square for each model and estimated the elasticities (or elasticities at the mean).
5.1. Generations and Attractions Model
Table 2 shows the results of the negative binomial regression that measured the public bicycle trips’ generation and attraction. Most of the independent variables were statistically significant and the majority of regression coefficients showed the expected signs. Although, the Cox-Snell pseudo R-squared is 0.52, not as good as Wang et al.’s research [
9], but still with great significance, which is also confirmed by the likelihood ratio chi-square significant at a 0.0001 level.
As expected, both residence and employment have a positive effect on public bicycle usage. The coefficient of residence in the generation model is significantly bigger than that in the attraction model, which indicates that more people tend to depart from stations near residence (home) than arriving to such stations. While, the coefficients of employment and entertainment are just the opposite. Such trip preference inevitably leads to the imbalance of public bicycles spatially.
Trip activities were higher in bicycle stations with metro stations as well as bus stops in the 300 m catchment, indicating that many users take public bicycle as a first/last mile feeder mode to transit stations [
19,
21,
30]. Both generations and attractions increase when there are higher numbers of restaurants or amenities such as bank, post office, library, repair, etc., in the 300 m buffer of the station. However, the unanticipated negative coefficient of attractions and park means that people rarely ride public bicycles to attractions or parks. This is probably because the public bicycle of Nanjing can only be rented by deposit smart card, which is not so friendly to visitors. Likewise, shopping, sports, and hospital also have negative effects on public bicycle usage. It is reasonable for users not cycling when they are full of purchases or rackets or they are ill.
This study also confirms results of previous studies. As can be seen in
Table 2, rainy weather decreases both the generations and the attractions of public bicycles [
21,
23]. The elasticity of station capacity shows that an increase of 1% in the station capacity leads to a 0.46% and 0.5% increase in the trip generation and attraction, respectively. The public bicycle usage in Nanjing is much more frequent on weekdays than weekends, similar to annual members in New York [
13]. The negative sign for other stations coefficient confirms that an increase of other bike stations within the 300 m buffer will lower the demand generated at this station [
7,
12].
Table 2.
Regression coefficients for trips’ generation and attraction model.
Table 2.
Regression coefficients for trips’ generation and attraction model.
| | Generation Model | Attraction Model |
|---|
| Variable | Coefficient | Z Value | Coefficient | Z Value |
|---|
| (constant) | 1.937 | 16.43 *** | 1.846 | 15.56 *** |
| Ln (Residence) | 0.084 | 8.68 *** | 0.067 | 7.00 *** |
| Ln (Employment) | 0.042 | 4.29 *** | 0.066 | 6.81 *** |
| Ln (Entertainment) | 0.042 | 2.65 ** | 0.057 | 3.56 *** |
| Ln (Restaurant) | 0.040 | 3.28 ** | 0.045 | 3.68 *** |
| Ln (Bus stop) | 0.186 | 10.38 *** | 0.193 | 10.75 *** |
| Ln (Amenity) | 0.258 | 13.87 *** | 0.226 | 12.10 *** |
| Ln (Shopping) | −0.062 | −5.82 *** | −0.072 | −6.73 *** |
| Attractions | −0.303 | −19.81 *** | −0.301 | −19.60 *** |
| School | 0.086 | 4.91 *** | 0.075 | 4.22 *** |
| Park | −0.473 | −12.15 *** | −0.476 | −12.17 *** |
| Metro station | 0.622 | 27.40 *** | 0.573 | 25.09 *** |
| Sports | −0.114 | −7.47 *** | −0.104 | −6.79 *** |
| Hospital | −0.124 | −7.25 *** | −0.129 | −7.51 *** |
| Ln (Station capacity) | 0.463 | 14.85 *** | 0.504 | 16.05 *** |
| Other stations | −0.082 | −29.40 *** | −0.085 | −30.17 *** |
| Bike lane | 0.175 | 11.15 *** | 0.156 | 9.85 *** |
| Temperature | 0.034 | 21.85 *** | 0.034 | 21.61 *** |
| Rain | −0.352 | −23.65 *** | −0.353 | −23.56 *** |
| Weekday | 0.194 | 12.64 *** | 0.195 | 12.63 *** |
| Likelihood ratio chi-square | 4376 *** | 4247.2 *** |
| Pseudo R2 (Cox-Snell) | 0.52 | 0.51 |
| Pseudo R2 (Nagelkerke) | 0.63 | 0.61 |
| Degree of Freedom (DF) | 7690 | 7690 |
Table 3.
Elasticity of generation and attraction model.
Table 3.
Elasticity of generation and attraction model.
| Variable | Elasticity | Variable | Elasticity at Mean |
|---|
| Generation Model | Attraction Model | Generation Model | Attraction Model |
|---|
| Residence | 0.084 | 0.067 | Attractions | −0.138 | −0.137 |
| Employment | 0.042 | 0.066 | School | 0.019 | 0.016 |
| Entertainment | 0.042 | 0.057 | Park | −0.018 | −0.019 |
| Restaurant | 0.040 | 0.045 | Metro station | 0.077 | 0.071 |
| Bus stop | 0.186 | 0.193 | Sports | −0.060 | −0.055 |
| Amenity | 0.258 | 0.226 | Hospital | −0.068 | −0.071 |
| Shopping | −0.062 | −0.072 | Other stations | −0.276 | −0.285 |
| Station capacity | 0.463 | 0.504 | Bike lane | 0.082 | 0.073 |
| | | | Temperature | 0.402 | 0.400 |
| | | | Rain | −0.165 | −0.165 |
| | | | Weekday | 0.136 | 0.136 |
5.2. Distribution and Duration Model
Trip distribution (OD) and duration are influenced by attributes of both origin station and destination station. Therefore, all the independent variables of origin station and destination station as well as trip distance have been examined. Besides, to isolate the impact of abnormally long duration trip, we removed these outliers from the dataset. Outliers in this research refer to any trip duration data that falls more than 3 times the interquartile range above the third quartile, accounting for 3.7% of the total data.
Table 4 shows the regression coefficients for the distribution (OD) model. The Cox-Snell pseudo R-squared and Nagelkerke pseudo R-squared are 0.46 and 0.69 respectively, and the likelihood ratio chi-square is significant at a 0.0001 level, indicating a good fit. All the estimated coefficients were statistically significant and with the expected signs. To avoid overestimating trips between two bike stations that both have proximity to metros, we added another variable “metro station × metro station” to the model, which is calculated as product of “metro station” in both origin and destination.
The negative coefficient of “metro station × metro station” means that users are less likely to ride a public bicycle from one metro coverage to another metro coverage. Apparently, distance is the most influential factor of trip OD. The elasticity shows that an increase of 1% in the trip distance leads to a 2.36% decrease in the OD trips. Analogous to the generation or attraction model, both start station capacity and end station capacity were positively correlated with OD trips. The elasticity for other stations at the mean value is −0.19, implying that a 1% increase in the number of other nearby stations can result in a 0.19% reduction in the OD trips. In both the origin station and destination station 300 m catchment, the number of residence POIs and employment POIs had a positive correlation with OD trips, as expected.
Table 4.
Regression coefficients for distribution model.
Table 4.
Regression coefficients for distribution model.
| | Variable | Coefficient | Z Value |
|---|
| | (constant) | −3.328 | −76.85 *** |
| | Ln (Distance) | −2.355 | −844.65 *** |
| | Metro station × metro station | −0.959 | −64.27 *** |
| | Rain | −0.374 | −96.40 *** |
| | Weekday | 0.225 | 55.49 *** |
| | Temperature | 0.036 | 88.69 *** |
| Origin Station |
| | Ln (Residence) | 0.079 | 39.71 *** |
| | Ln (Employment) | 0.092 | 47.77 *** |
| | Ln (Station capacity) | 0.438 | 54.45 *** |
| | Other stations | −0.055 | −80.22 *** |
| | Metro station | 0.686 | 124.50 *** |
| Destination Station |
| | Ln (Residence) | 0.049 | 23.91 *** |
| | Ln (Employment) | 0.106 | 56.25 *** |
| | Ln (Station capacity) | 0.498 | 60.11 *** |
| | Other stations | −0.056 | −80.64 *** |
| | Metro station | 0.636 | 114.78 *** |
| | Likelihood ratio chi-square | 733,485 *** |
| | Pseudo R2 (Cox-Snell) | 0.46 |
| | Pseudo R2 (Nagelkerke) | 0.69 |
| | df | 1,957,124 |
Table 5.
Elasticity of distribution model.
Table 5.
Elasticity of distribution model.
| | Variable | Elasticity | Variable | Elasticity at Mean |
|---|
| | Distance | −2.355 | Metro station × metro station | −0.014 |
| | | | Rain | −0.174 |
| | | | Weekday | 0.158 |
| | | | Temperature | 0.429 |
| Origin Station |
| | Residence | 0.079 | Other stations | −0.186 |
| Employment | 0.092 | Metro station | 0.085 |
| Station capacity | 0.438 | | |
| Destination Station |
| | Residence | 0.049 | Other stations | −0.187 |
| Employment | 0.106 | Metro station | 0.079 |
| Station capacity | 0.498 | | |
The results of regression coefficients for trips’ duration are presented in
Table 6. The pseudo R-squared and the significant likelihood ratio chi-square also suggest a good fit. Unsurprisingly, the trip distance is also positively related to the trip duration [
28]. As the most remarkable factor, a 1% increase in the trip distance tends to raise 0.54% of the trip duration.
Compared with trips at the weekend, the expected trip duration is shorter on weekdays [
28]. Users could take their time riding a public bicycle at the weekend, without worrying about lateness for work or school. As one would expect, trips involving metro stations have a negative impact on the trip duration. This is because public bicycle trips access to or egress from metro stations imply the “first mile” or “last mile” connection to metro trips, which is usually short as one part of a big trip chain. However, trips starting from or ending at home (residence) are likely to have longer travel times.
Interestingly, the elasticity shows that large station capacity, especially in the destination station, tends to decrease the trip duration greatly. That is probably because larger station capacity may reduce the likelihood of no-bike-to-rent or no-slot-to-return situations. The dedicated bike lane in the destination station has a significantly negative impact on trip duration. This perhaps suggests that a dedicated bike lane can improve riding efficiency.
Table 6.
Regression coefficients for the duration model.
Table 6.
Regression coefficients for the duration model.
| | Variable | Coefficient | Z Value |
|---|
| | (constant) | 6.702 | 639.73 *** |
| | Ln (Distance) | 0.537 | 815.95 *** |
| | Weekday | −0.061 | −63.08 *** |
| Origin Station |
| | Ln (Residence) | 0.016 | 35.03 *** |
| | Ln (Station capacity) | −0.065 | −32.75 *** |
| | Metro station | −0.025 | −23.34 *** |
| Destination Station |
| | Ln (Residence) | 0.032 | 71.17 *** |
| | Ln (Station capacity) | −0.094 | −47.34 *** |
| | Metro station | −0.078 | −70.26 *** |
| | Bike lane | −0.018 | −19.74 *** |
| | Likelihood ratio chi-square | 673,116 *** |
| | Pseudo R2 (Cox-Snell) | 0.50 |
| | Pseudo R2 (Nagelkerke) | 0.61 |
| | df | 1,261,752 |
Table 7.
Elasticity of the duration model.
Table 7.
Elasticity of the duration model.
| | Variable | Elasticity | Variable | Elasticity at Mean |
|---|
| | Distance | 0.537 | Weekday | −0.046 |
| Origin Station | | | | |
| | Residence | 0.016 | Metro station | −0.006 |
| Station capacity | −0.065 | | |
| Destination Station |
| | Residence | 0.032 | Metro station | −0.017 |
| Station capacity | −0.094 | Bike lane | −0.010 |
6. Conclusions
Previous research efforts have attempted to find out the relationship between the public bicycle trip generation, attraction, and factors such as built environment, weather, population density, etc. However, they have neglected to include the trip distribution and duration as a whole and not investigated the built environment in detail, especially in China. This study developed negative binomial regression models to fill the research gap based on POI data in Nanjing. All the four developed models, including Generation Model, Attraction Model, Distribution Model, and Duration Model, showed a good fit in terms of pseudo R-squared and likelihood ratio chi-square. A number of interesting findings were also revealed in this study.
Firstly, our findings of generation and attraction models showed that 300 m buffer POIs of residence, employment, entertainment, restaurant, bus stop, metro station, amenity, and school have significantly positive effects on public bicycle generation and attraction, while, counterintuitively, 300 m-buffer POIs of shopping, parks, attractions, sports, and hospital have significantly negative effects. The negative effect is probably owing to the visitor-unfriendly smart card renting system and inconvenience resulting from handfuls of purchases or illness. The model also confirms the previous studies’ results that large station capacity as well as warm temperature could attract more public bicycle trips and inversely, other nearby stations and rainy weather could decrease the public bicycle usage in the station.
Secondly, the distribution model confirmed the positive effect of residence and employment POIs on the public bicycle usage. Moreover, the findings suggest that “metro station × metro station” and trip distance have a negative impact on OD trips. Specifically, an increase of 1% in the trip distance leads to a 2.36% decrease in the OD trips. “Metro station × metro station” is a necessary factor to avoid overestimating trips between metro coverages. We also found that a 1% increase in the number of other nearby stations can help reduce 0.19% of the OD trips. It is useful for operators to know the influence quantitatively, when they try to alleviate the imbalance issue by adjusting other nearby stations.
Thirdly, the duration model revealed that a 1% increase in the trip distance tended to raise 0.54% of the trip duration. Trips involving metro stations are usually short, while trips starting from or ending at home (residence) are prone to be long. Besides, the results suggest that larger station capacity and dedicated bike lanes can significantly shorten users’ trip duration. It is meaningful for operators or decision-makers to realize this effect in order to improve the level of service.
Taken together, this study contributes to the literature by providing quantitative results about how built environments affect the public bicycle usage. Specifically, valuable insights gained from this research may help operators and decision-makers understand how various types of POIs influence the whole process of public bicycle trips: generation, attraction, distribution, and duration. The findings of this study point to key factors for consideration in the planning stage to alleviate the reallocation burden in operation. For example, bus stops and amenities could attract more bicycle usage, and bicycle stations near them need bigger capacity. While bicycle stations near attractions and other bicycle stations are just the opposite since they showed significantly negative effects on the bicycle usage.
It is noteworthy that we only investigated public bicycles in this study and all the findings are fit for public bicycles. As for private bicycles, the trip characteristics could be different because the users usually have to pick up their private bicycles when they start a new trip. Thus, a visiting point with available bicycle parking lots are prone to be chosen. The POI may not play an important role in the private bicycle usage.
Although necessary measures have been taken, there are still several limitations in this study. One limitation of this research is that only one-month smart card data were gained to train the regression model and various weather conditions cannot be investigated in detail. Another limitation we encountered is that there are no free-access population and job data accurate to the block scale in Nanjing, so we used the residence and employment POIs instead. Nevertheless, the explanatory power is still weakened. Besides, the model coefficients from one case city (Nanjing, China) may not be directly transferable when applied to other cities since each city has its own trip characteristics. As a future research line, we suggest researchers obtain enriched data with much longer spans and adapt the analytical method proposed in this paper to other cities.
Author Contributions
Conceptualization, D.Z. and G.P.O.; methodology, D.Z.; software, D.Z.; validation, D.Z.; formal analysis, D.Z.; investigation, D.Z.; resources, D.Z.; data curation, D.Z.; writing—original draft preparation, D.Z.; writing—review and editing, D.Z., G.P.O., W.W. and W.Z.; visualization, D.Z.; supervision, D.Z. and G.P.O.; project administration, D.Z. and G.P.O.; funding acquisition, D.Z. and W.W. All authors have read and agreed to the published version of the manuscript.
Funding
This research was funded by National Key Research and Development Program of China, grant number 2018YFE0102700, National Natural Science Foundation of China, grant number 71701047, and Singapore Ministry of Education Academic Research Fund (Tier 1), grant number R-302-000-215-114.
Institutional Review Board Statement
Not applicable.
Informed Consent Statement
Not applicable.
Data Availability Statement
The data presented in this study are available on request from the corresponding author. The data are not publicly available due to privacy.
Acknowledgments
Authors are also grateful to the Nanjing Public Bicycle Company for facilitating smart card data for the research.
Conflicts of Interest
The authors declare no conflict of interest. The funders had no role in the design of the study; in the collection, analyses, or interpretation of data; in the writing of the manuscript, or in the decision to publish the results.
References
- Chen, Q.; Sun, T. A model for the layout of bike stations in public bike-sharing systems. J. Adv. Transp. 2015, 49, 884–900. [Google Scholar] [CrossRef]
- Fishman, E.; Washington, S.; Haworth, N. Barriers and facilitators to public bicycle scheme use: A qualitative approach. Transp. Res. Part F Traffic Psychol. Behav. 2012, 15, 686–698. [Google Scholar] [CrossRef]
- Wang, J.; Huang, J.; Dunford, M. Rethinking the Utility of Public Bicycles: The Development and Challenges of Station-Less Bike Sharing in China. Sustainability 2019, 11, 1539. [Google Scholar] [CrossRef]
- Fishman, E. Bikeshare: A Review of Recent Literature. Transp. Rev. 2015, 36, 92–113. [Google Scholar] [CrossRef]
- Yao, Y.; Zhang, Y.; Tian, L.; Zhou, N.; Li, Z.; Wang, M. Analysis of Network Structure of Urban Bike-Sharing System: A Case Study Based on Real-Time Data of a Public Bicycle System. Sustainability 2019, 11, 5425. [Google Scholar] [CrossRef]
- Song, M.; Wang, K.; Zhang, Y.; Li, M.; Qi, H.; Zhang, Y. Impact Evaluation of Bike-Sharing on Bicycling Accessibility. Sustainability 2020, 12, 6124. [Google Scholar] [CrossRef]
- Zhang, Y.; Thomas, T.; Brussel, M.; van Maarseveen, M. Exploring the impact of built environment factors on the use of public bikes at bike stations: Case study in Zhongshan, China. J. Transp. Geogr. 2017, 58, 59–70. [Google Scholar] [CrossRef]
- Noland, R.B.; Smart, M.J.; Guo, Z. Bikeshare trip generation in New York City. Transp. Res. Part A Policy Pract. 2016, 94, 164–181. [Google Scholar] [CrossRef]
- Wang, X.; Lindsey, G.; Schoner, J.E.; Harrison, A. Modeling Bike Share Station Activity: Effects of Nearby Businesses and Jobs on Trips to and from Stations. J. Urban Plan. Dev. 2016, 142, 04015001. [Google Scholar] [CrossRef]
- Rixey, R. Station-Level Forecasting of Bikesharing Ridership. Transp. Res. Rec. J. Transp. Res. Board 2013, 2387, 46–55. [Google Scholar] [CrossRef]
- Faghih-Imani, A.; Eluru, N.; El-Geneidy, A.M.; Rabbat, M.; Haq, U. How land-use and urban form impact bicycle flows: Evidence from the bicycle-sharing system (BIXI) in Montreal. J. Transp. Geogr. 2014, 41, 306–314. [Google Scholar] [CrossRef]
- Faghih-Imani, A.; Eluru, N. Analysing bicycle-sharing system user destination choice preferences: Chicago’s Divvy system. J. Transp. Geogr. 2015, 44, 53–64. [Google Scholar] [CrossRef]
- Faghih-Imani, A.; Eluru, N. Incorporating the impact of spatio-temporal interactions on bicycle sharing system demand: A case study of New York CitiBike system. J. Transp. Geogr. 2016, 54, 218–227. [Google Scholar] [CrossRef]
- Bakillah, M.; Liang, S.; Mobasheri, A.; Jokar Arsanjani, J.; Zipf, A. Fine-resolution population mapping using OpenStreetMap points-of-interest. Int. J. Geogr. Inf. Sci. 2014, 28, 1940–1963. [Google Scholar] [CrossRef]
- Joo, S.; Oh, C.; Jeong, E.; Lee, G. Categorizing bicycling environments using GPS-based public bicycle speed data. Transp. Res. Part C Emerg. Technol. 2015, 56, 239–250. [Google Scholar] [CrossRef]
- Sarkar, A.; Lathia, N.; Mascolo, C. Comparing cities’ cycling patterns using online shared bicycle maps. Transportation 2015, 42, 541–559. [Google Scholar] [CrossRef]
- Médard de Chardon, C.; Caruso, G. Estimating bike-share trips using station level data. Transp. Res. Part B Methodol. 2015, 78, 260–279. [Google Scholar] [CrossRef]
- Fishman, E.; Washington, S.; Haworth, N.; Watson, A. Factors influencing bike share membership: An analysis of Melbourne and Brisbane. Transp. Res. Part A Policy Pract. 2015, 71, 17–30. [Google Scholar] [CrossRef]
- Bachand-Marleau, J.; Lee, B.; El-Geneidy, A. Better Understanding of Factors Influencing Likelihood of Using Shared Bicycle Systems and Frequency of Use. Transp. Res. Rec. J. Transp. Res. Board 2012, 2314, 66–71. [Google Scholar] [CrossRef]
- Campbell, A.A.; Cherry, C.R.; Ryerson, M.S.; Yang, X. Factors influencing the choice of shared bicycles and shared electric bikes in Beijing. Transp. Res. Part C Emerg. Technol. 2016, 67, 399–414. [Google Scholar] [CrossRef]
- El-Assi, W.; Salah Mahmoud, M.; Nurul Habib, K. Effects of built environment and weather on bike sharing demand: A station level analysis of commercial bike sharing in Toronto. Transportation 2017, 44, 589–613. [Google Scholar] [CrossRef]
- Corcoran, J.; Li, T.; Rohde, D.; Charles-Edwards, E.; Mateo-Babiano, D. Spatio-temporal patterns of a Public Bicycle Sharing Program: The effect of weather and calendar events. J. Transp. Geogr. 2014, 41, 292–305. [Google Scholar] [CrossRef]
- Gebhart, K.; Noland, R.B. The impact of weather conditions on bikeshare trips in Washington, DC. Transportation 2014, 41, 1205–1225. [Google Scholar] [CrossRef]
- Zhou, J.; Jing, C.; Hong, X.; Wu, T. Winter Sabotage: The Three-Way Interactive Effect of Gender, Age, and Season on Public Bikesharing Usage. Sustainability 2019, 11, 3217. [Google Scholar] [CrossRef]
- Macioszek, E.; Świerk, P.; Kurek, A. The Bike-Sharing System as an Element of Enhancing Sustainable Mobility—A Case Study based on a City in Poland. Sustainability 2020, 12, 3285. [Google Scholar] [CrossRef]
- Nogal, M.; Jiménez, P. Attractiveness of Bike-Sharing Stations from a Multi-Modal Perspective: The Role of Objective and Subjective Features. Sustainability 2020, 12, 9062. [Google Scholar] [CrossRef]
- González, F.; Melo-Riquelme, C.; de Grange, L. A combined destination and route choice model for a bicycle sharing system. Transportation 2015, 43, 407–423. [Google Scholar] [CrossRef]
- Caulfield, B.; O‘Mahony, M.; Brazil, W.; Weldon, P. Examining usage patterns of a bike-sharing scheme in a medium sized city. Transp. Res. Part A Policy Pract. 2017, 100, 152–161. [Google Scholar] [CrossRef]
- Lu, E.H.-C.; Chen, H.-S.; Tseng, V.S. An Efficient Framework for Multirequest Route Planning in Urban Environments. IEEE Trans. Intell. Transp. Syst. 2017, 18, 869–879. [Google Scholar] [CrossRef]
- Hampshire, R.C.; Marla, L. An Analysis of Bike Sharing Usage: Explaining Trip Generation and Attraction from Observed Demand. In Transportation Research Board; SAGE Publications: Washington, DC, USA, 2012. [Google Scholar]
- Zhao, D.; Ong, G.P.; Wang, W.; Hu, X.J. Effect of built environment on shared bicycle reallocation: A case study on Nanjing, China. Transp. Res. Part A Policy Pract. 2019, 128, 73–88. [Google Scholar] [CrossRef]
- Yang, M.; Liu, X.; Wang, W.; Li, Z.; Zhao, J. Empirical Analysis of a Mode Shift to Using Public Bicycles to Access the Suburban Metro: Survey of Nanjing, China. J. Urban Plan. Dev. 2016, 142, 05015011. [Google Scholar] [CrossRef]
- Fishman, E.; Washington, S.; Haworth, N. Bike share’s impact on car use: Evidence from the United States, Great Britain, and Australia. Transp. Res. Part D Transp. Environ. 2014, 31, 13–20. [Google Scholar] [CrossRef]
- BaiduMap. Available online: http://lbsyun.baidu.com (accessed on 20 November 2017).
- Nanjing Government. Planning Standards for Public Facilities; Nanjing Government: Nanjing, China, 2015.
| Publisher’s Note: MDPI stays neutral with regard to jurisdictional claims in published maps and institutional affiliations. |
© 2021 by the authors. Licensee MDPI, Basel, Switzerland. This article is an open access article distributed under the terms and conditions of the Creative Commons Attribution (CC BY) license (http://creativecommons.org/licenses/by/4.0/).


