Article

Exploring Impact of Surrounding Service Facilities on Urban Vibrancy Using Tencent Location-Aware Data: A Case of Guangzhou

1
School of Geography and Planning, Sun Yat-sen University, Guangzhou 510275, China
2
Department of Geography, College of Science, Swansea University, Swansea SA2 8PP, UK
3
State Key Laboratory of Resources and Environmental Information System, Institute of Geographical Sciences and Natural Resources Research, CAS, Beijing 100101, China
4
University of Chinese Academy of Sciences, Beijing 100049, China
*
Author to whom correspondence should be addressed.
Sustainability 2021, 13(2), 444; https://doi.org/10.3390/su13020444
Submission received: 2 December 2020 / Revised: 19 December 2020 / Accepted: 22 December 2020 / Published: 6 January 2021

Abstract

:
Urban vibrancy contributes towards a successful city and high-quality life for people as one of its vital elements. Therefore, the association between service facilities and vibrancy is crucial for urban managers to understand and improve city construction. Moreover, the rapid development of information and communications technology (ICT) allows researchers to easily and quickly collect a large volume of real-time data generated by people in daily life. In this study, against the background of emerging multi-source big data, we utilized Tencent location data as a proxy for 24-h vibrancy and adopted point-of-interest (POI) data to represent service facilities. An analysis framework integrated with ordinary least squares (OLS) and geographically and temporally weighted regression (GTWR) models is proposed to explore the spatiotemporal relationships between urban vibrancy and POI-based variables. Empirical results show that (1) spatiotemporal variations exist in the impact of service facilities on urban vibrancy across Guangzhou, China; and (2) GTWR models exhibit a higher degree of explanatory capacity on vibrancy than the OLS models. In addition, our results can assist urban planners to understand spatiotemporal patterns of urban vibrancy in a refined resolution, and to optimize the resource allocation and functional configuration of the city.

1. Introduction

Broadly speaking, urban vibrancy represents the attraction and accessibility in a place. From another perspective, urban vibrancy can also describe the degree of interaction between people and the environment. Urban vibrancy is associated with urban development and quality of life [1]. Therefore, in order to develop reasonable and desirable policies for the sustainable development of a city, policy makers and urban planners must improve the understanding of urban vibrancy that quantify the attraction and diversity of the city. When the use of infrastructure and resources is not effective or efficient, the city is likely to lose vitality and thereby be at risk of degenerating into a ghost town [2,3]. To reduce or even avoid urban decay risk, many researchers have studied urban vibrancy, from definition to influence mechanism. Urban vibrancy not only quantifies attraction and accessibility of the city but also reflects human’s activity patterns and their interaction with space entities [4]. Moreover, urban vibrancy has three significant influence factors: urban morphology, urban socio-economic characteristics, and urban function [5]. It offers researchers three different perspectives to study urban vibrancy, and also allows policy makers and urban planners to consider improvement of city by different ways.
Meanwhile, many researchers have studied how to enhance urban vitality by optimizing urban structure and abridging the gap between provision and demand in resource allocation. Moreover, many existing literatures have attempted to reveal the relationship between land-use and urban vibrancy [4,6]. The findings of these studies show that some land-use categories (e.g., commercial, residential, and green land) attracting different types of activities have a significant impact on urban vibrancy, since vibrancy can be viewed as a proxy of human activity, and the different categories of land-use can attract the people who have different travel intentions [7]. Therefore, the studies of the relationship between land-use categories and urban vitality are crucial for improving city structure, constructing a healthy and sustainable living environment, as well as enhancing the life quality of people at a city scale. However, many existing studies focus on the influence mechanism of urban vitality in regard to conventional parcel- or area-level land-use classifications (e.g., commercial land and residential land) that include a variety of points-of-interest (POIs), while few literature take consideration into the influence mechanism regarding finer granularity of land-use classifications (e.g., entertainment, food, and education). Furthermore, refining functional area classification can provide greater assistance for urban planning [8]. To abridge this research gap, we attempted to explore the impact of fine-grained land-use categories on urban vitality reflecting human mobility. However, there are two significant issues needed to be resolved before the beginning of study. On the one hand, a suitable quantified proxy of urban vibrancy is needed to be selected. On the other hand, how to precisely explore the underlying mechanism between urban vibrancy and fine-grained land-use categories is extremely crucial.
In the past, the majority of studies regarding human mobility patterns were investigated through the household survey. Although the survey-based approach can provide detailed, high-quality, and high-dimensional data, it is high-cost, time-consuming, and low-quantity. The rapid development of information and communications technology (ICT) allows researchers to easily and quickly collect a large amount of real-time data generated by people in daily life, and provides more opportunities for studying issues that is not settled due to the lack of relevant data. Furthermore, the accessibility of low-cost data enables researchers to contribute to different fields such as identification of city center [9], exploration of travel patterns [10,11], modeling human preference [12], and classifying land-use [7,13]. Meanwhile, benefiting from the development of ICT, many researchers collected mobile phone data [14,15], small catering business data [6,16], night-time light data [6,17], and social media data [18,19] as a main proxy of urban vibrancy. Meanwhile, the spatial, temporal, and dynamic characteristics of these data render them superior over conventional demographic data [20]. In these types of data, everyone plays a role of sensor to sense the human daily activities in different locations and times [21,22]. However, each of the data sources mentioned above has some limitations. The small catering business data only represent certain categories of human activities, it lacks the indication of diversity of urban vitality, the analytical results obtained from this data source will therefore cause representative bias. Furthermore, small catering business data cannot reflect the temporal features of the urban vitality. Same as small catering business data, social media data such as check-in data also has the representative bias. The social media platforms such as Foursquare, Facebook, Twitter, and Weibo are popular for researchers to collect analytical data related to human activity trajectory. The check-in data obtained from these social media platforms are under-represented by elderly people, since the majority of the contributors are young people. Moreover, check-in data has a heavy tailed distribution, since a small proportion of active users generated the majority of check-in data [23]. Although mobile phone data has neither the representative bias on age group nor trajectory incompleteness, location tracking of mobile phone data is based on signal transmitting base station. Therefore, the locational accuracy of mobile phone data is inferior to that of social media data relying on global navigation satellite system (GNSS) positioning. In this study, we utilize ‘location-aware big data’ of Tencent, a Chinese giant of technology corporation, as the proxy of urban vibrancy. This data source includes location requests generated by WeChat, QQ, and other location-based services offered by Tencent, wherein QQ and WeChat (they are widely used by people in China to communicate with friends, family members, and colleagues) are the most popular instant messaging applications. Moreover, WeChat also offers a tool called ‘WeChat Pay’, one of the most popular online mobile payment tools, which is being used almost everywhere in China. This means the Tencent location-aware big data decreases the limitation of age group bias to some extent and consequently enables researchers to obtain the more convincing analytical results.
Methodologically, a number of models have contributed to the exploration of relationship between urban vitality and explanatory variables reflecting city configuration and function. The local indicators of spatial association (LISA), a method proposed by Anselin [24], is adopted to explore urban vitality from different perspectives such as land-use intensity and condition [6]. However, only one of the perspectives can be analyzed and verified in each exploration by this method, which greatly hinders the urban planning that requires a combination of different perspectives. Linear regression such ordinary least squares (OLS) regression and geographically weighted regression [25] can be adopted to respond to this issue. However, human activity not only exhibits spatial characteristics but also reflects temporal features, since the travel purpose of people may change with the different time to meet different demands of activity [4,26]. Therefore, in this study, we attempted to adopt the OLS regression model to obtain overall results in the whole city of Guangzhou, while being prepared for the model confirmation of geographically and temporally weighted regression (GTWR) in the main districts of Guangzhou. The adoption of GTWR can explore spatiotemporally varying relationship between land-use and urban vibrancy to gain deeper insight into the underlying influence mechanism of urban vibrancy.
The remainder of this study is organized as follow: Section 2 reviews the previous related works. Section 3 introduces the study area and the data sources. Section 4 presents the analysis framework used in the study. Section 5 presents the analysis results gained from model. Finally, the paper presents the conclusions and future work.

2. Literature Review

2.1. Urban Vibrancy

Urban vibrancy as the name implies can represent the active degree of human in a city. In fact, urban vibrancy is associated with economic, built environment, accessibility, safety as well as convenience in the scale of city, street, or even smaller grid. Jacobs [27] illustrated that urban vibrancy stems from the interaction between citizens and built environment in daily life, which also explains the feasibility of exploring urban vibrancy in relation to human behavior and built environment. Some researchers investigated the pedestrian vitality calculated in terms of pedestrians’ photos in central areas and commercial streets by considering the directly impacted factors, that can directly support or obstacle people’s activities, such as the number of stores and parked cars as well as the available area for pedestrian’s movement [28]. However, the measurement of pedestrian vibrancy limits the application of this method, as the approach of measurement is high-cost and time-consuming. Moreover, Meng and Xing [29] utilized review data as urban vibrancy to explore the influence mechanism mainly based on indirectly impacted factors (e.g., physical landscape characteristics and built environmental configuration) that can indirectly reflect the function and extent of prosperity. Likewise, Wu, et al. [30] collected 24-h GNSS-trajectories of some voluntary residents with wearable tracking devices to examine mechanism of urban vibrancy under the indirectly impacted factors (e.g., inner physical configuration in block). Although, the indirectly impacted factor is a novel perspective to investigate and define urban vibrancy, it is difficult to explain the urban vibrancy perfectly. Furthermore, in the two studies mentioned above, the ways to capture urban vibrancy also limit the large-scale applications of their models due to lack of dynamic measurement of urban vibrancy or high-cost collection. In addition, many studies still exist deficiencies in collecting analytical data and selecting influence factors. Therefore, it is necessary to propose a framework to quickly and effectively investigate urban vibrancy for assistance of urban planners at the low-cost level.

2.2. Land Use and Urban Vibrancy

Geo-tagged user-generated data, such as social media data, phone signaling data, and GNSS-trajectory data of taxi, contribute greatly to large-scale and low-cost collection of high-dynamic analytical data as well as facilitate people devoted to improving their life quality by sensing urban environment from perspective of social sensing [4,31]. Therefore, the geo-tagged data can be treated as a significant dataset for efficiently quantifying urban vitality.
Although the relationship between land use and urban vibrancy is not a new field of investigation, it still is a popular topic worthy of exploration. The urban vibrancy was initially defined by Jacobs [27] who demonstrated the association between people life of city and mixed land use. After that, Lynch [5] concluded that the three main factors of morphology, socio-economic characteristics, and function have significant impact on urban vibrancy. The factor of function actually refers to land use that describes different use purposes of various lands. Lamb [32] found mixed land-use area characterized by mix of commercial and residential structure can attract more population. Moreover, some studies illustrate that people who live and work in mixed land-use area are likely to have a lifestyle free of car due to a high level of walking accessibility to various services [33,34], which means that people from single functional areas will be attracted to the mixed land-use area due to facility accessibility. Montgomery [1] described that increasing urban vitality could be achieved in the place where the diversity of primary land uses is sufficiently ensured. Based on these works, Sharkova and Sanchez [35] proposed a model to investigate the impact of neighborhood type, land use, socio-economic characteristics, and urban accessibility on urban vibrancy by using the OLS model. Previous studies certificate that land use has a significant effect on urban vibrancy.
With the popularity of location-based social network (LBSN), big data generated by LBSN is utilized to explore the correlation of land-use configuration and urban vibrancy. The strong correlation is proved by a series of studies again [4,6,36]. Xia et al. [6] explored the relationship of urban vibrancy and land-use, and measured urban daytime and night-time vibrancy using small catering business and night-time light data, respectively. They discovered that the urban vibrancy changes over time and urban vibrancy is not only representation of catering business vibrancy. Furthermore, Yue et al. [36] proposed an approach to measure of mixed land use and explored its impact on vibrancy based on phone data. Wu et al. [4] utilized Weibo check-in data to increase the understanding of impact of land use on urban vibrancy. However, the locational accuracy of phone data is inferior to that of social media data as well as the Weibo check-in data which have a high level of age representativeness deviation. As the most popular forms of big data, phone data and social media data both have inherent disadvantages. It is important to search for a new form of big data which can better balance the trade-off between locational accuracy and user representativeness existing in the current popular forms of big data, like phone data and social media data. As an emerging form of social media data, Tencent location-aware big data appears to better balance the trade-off as it has a higher level of locational accuracy than phone data and a higher level of user representativeness than Weibo check-in data [37,38].
Therefore, in this study, we attempted to use Tencent location-aware big data, to enhance the understanding of land-use effects on urban vibrancy. Moreover, we attempted to use point-of-interest (POI) data instead of land-use data to refine land-use categories, and thus to gain deeper insight into the underlying mechanism of land-use effects on urban vibrancy.

3. Study Area and Data

3.1. Study Area

The study area is located at the city of Guangzhou, the core city of pearl river delta which is one of the biggest economic zones in China, with a population of 14.9 million by the end of 2018. However, the rapid development of Guangzhou relies not only on its location, local policy, and urban planning, but also the crucial factors for the achievement. Guangzhou consists of 11 districts (Conghua, Huadu, Zengcheng, Baiyun, Huangpu, Tianhe, Yuexiu, Liwan, Haizhu, Panyu, Nansha) shown in Figure 1a. Moreover, many previous studies chose areal units constituted by conventional boundaries of blocks, streets and traffic analysis zones as the study unit, which are usually too large to obtain fine-grained results. Therefore, we choose the 1 km × 1 km grid as the unit of this study to measure urban vibrancy at a finer scale because: (1) Tencent location-aware data are gridded data after aggregating location requests of users and (2) a 1 × 1 km grid is spatially finer than the areal units used in the previous studies.

3.2. Data Collection
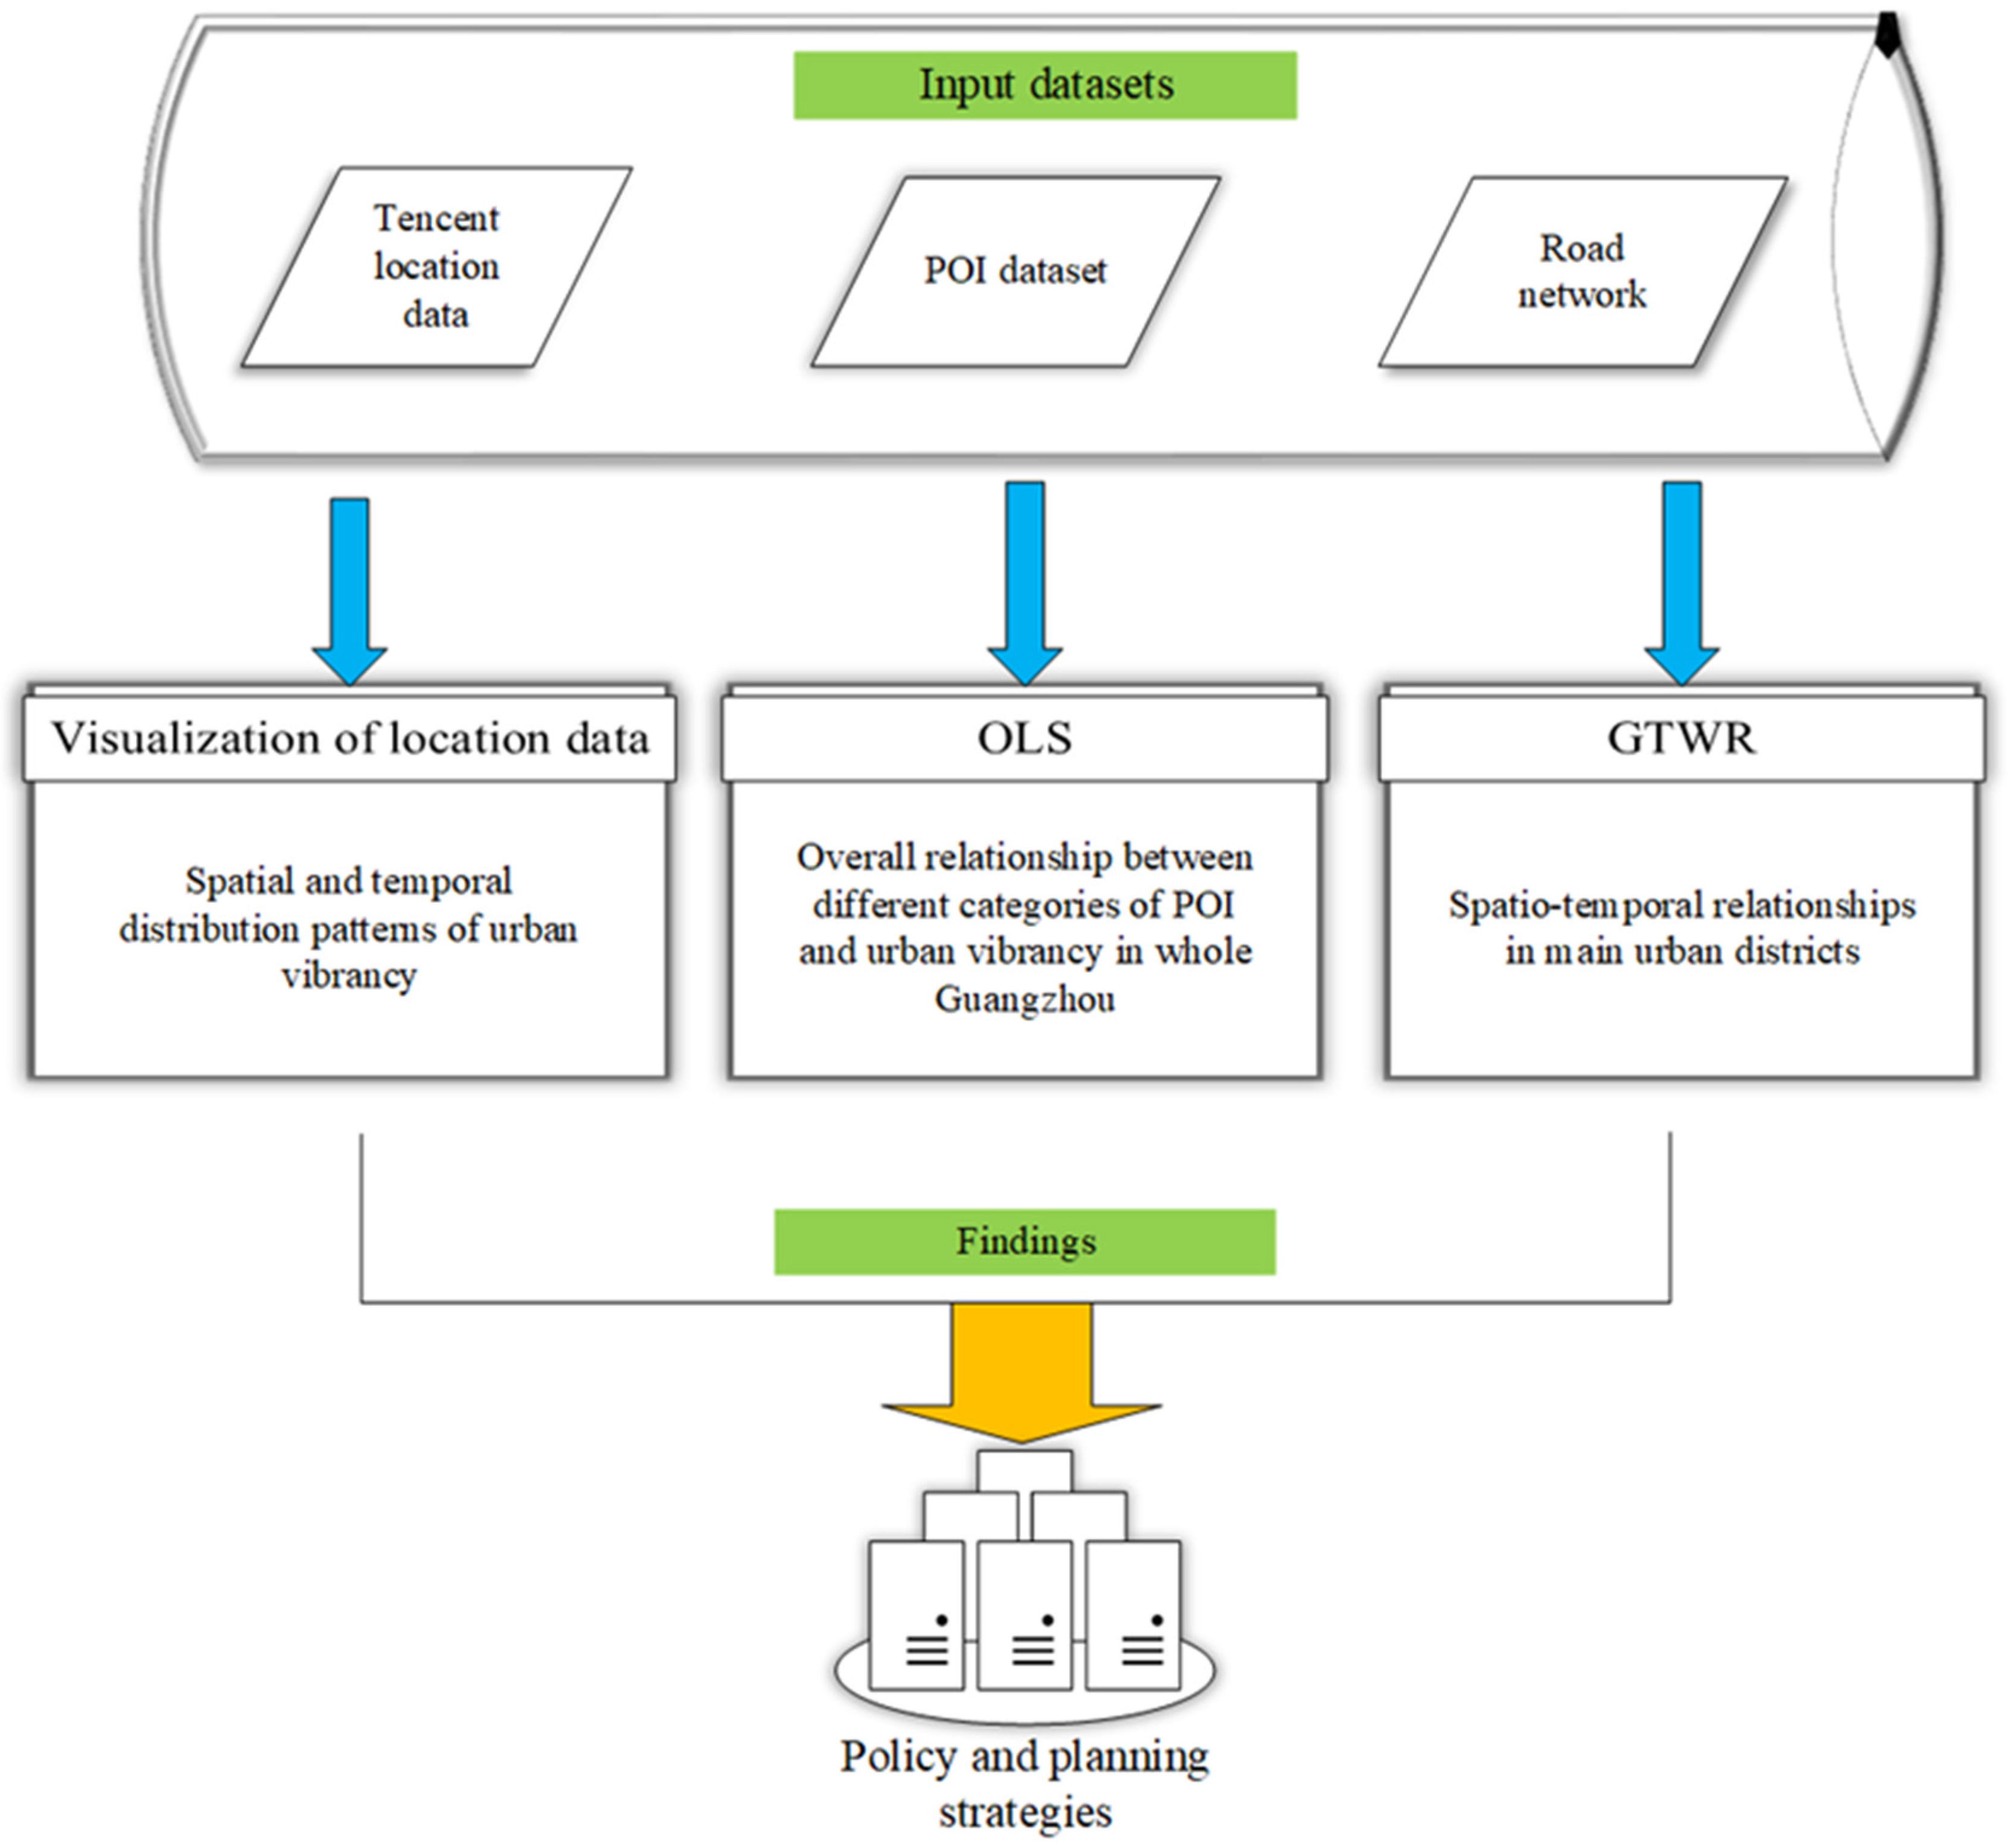
The interaction of people between communities is built on the basis of the road network that reflects the accessibility and traffic convenience of the community. The dataset of road network gathered from OpenStreetMap has a detailed classification scheme composed of 23 road categories. For simplicity, we merged the 23 categories into two road types: external road (e.g., primary road, secondary road, and tertiary road) and internal road (e.g., footway, pedestrian, and living street), due to their distinct functions and impact on people’s travel. The external road is basically used for car, while the internal road is mainly used for pedestrians and bicycles. As shown in Figure 1b, the distribution of POIs is associated with the density of road network.
The amount of human activities is likely associated with the category of POI, as the POI can represent a place to undertake a certain human activity. In order to portray this correlation, we collected the POI dataset from Baidu Map, the most popular map service in China. The Guangzhou POI dataset, which contains different POIs of about 1 million, is available via application programing interface (API) of Baidu Map. The detail of POI dataset is exhibited as Figure 2.
The Tencent location big data collected from big data platform of Tencent (https://heat.qq.com) recorded the number of location requests provided by location-based services (LBSs) of Tencent, which involve the fields of social network, game, online shopping, communication and travel. The number of location requests sent to LBSs is used as the proxy of urban vibrancy in this study, as the number of location requests can be used to represent the number of collective human activities. It has a spatial resolution of 1 km × 1 km and a temporal resolution of 1 h. The dataset has excellent group representativeness in studies of dynamic urban vibrancy. Therefore, we attempted to use the number of location requests as proxy to explore urban vibrancy of working and non-working days for a more representative result. In order to reduce sampling bias and increase representativeness, we collected the dataset generated from 10th to 28th November 2018, during which there are no national holidays, to obtain average value for representing two-day patterns of working and non-working days. In order to accurately investigate typical patterns of working and non-working days, we selected, after a preliminary experiment, the average urban vibrancy of all Wednesdays and Saturdays during this collection period to represent the typical urban vibrancy of working and non-working days respectively.
The POI data is of high quality as it was downloaded from Baidu Map which is the leading navigation service provider in China. According to a study [39], in Chinses cities, although 71% of the OpenStreetMap (OSM) data was less detailed than the Baidu datasets, but on average 66% of OSM data was accurate. The road network data downloaded from OSM is reliable. According to a recent study [37], the number of location requests of Tencent location-aware data is positively correlated with the daily number of tourists in 11 tourist attractions of China over a ~60-day period as shown by the Pearson correlation coefficients, which range from 0.718 to 0.915 (p-value < 0.001 for all) with an average of 0.821. Moreover, there is high correlation coefficient of 0.9 between Tencent location data and residential population [40]. This indicates that Tencent location-aware dataset could be used as a proxy of the collective geo-tagged human activities at a short-time scale [37]. Furthermore, these three datasets have been used in many studies and achieve a series of reliable experimental results [41,42,43,44]. All the above demonstrate that the datasets used in this study are reliable.

4. Methodology

In order to explore the underlying correlation mechanism of urban vibrancy and POI-based land-use configuration, we proposed an analysis framework to investigate urban vibrancy from the perspective of multi-source social sensing. The framework shown in Figure 3 illustrates the progressive exploration of urban vibrancy in Guangzhou. First of all, the visualization of Tencent location-aware data of whole day on working and non-working days after data fusion was conducted to investigate the spatial and temporal patterns of collective human activities and verify the feasibility of viewing Tencent location-aware data as proxy for urban vibrancy. Subsequently, we attempted to utilize an OLS model to illustrate the overall relationship between vibrancy and POI-based variables in the whole city of Guangzhou. Finally, the relationship is explored in detail using GTWR models that take into consideration the spatial and temporal heterogeneity in the main districts. The exhibition of following sections is the detail of model used in this study.

4.1. Geographically and Temporally Weighted Regression

In this study, GTWR extended from geographically weighted regression [45] by incorporating temporal dimension is applied to explore spatiotemporally varying influence mechanism between urban vibrancy and POI-based and transport accessibility-related variables in the main districts of Guangzhou. GTWR has been used in a variety of fields such as modeling variation in house price [46] and estimating concentration of PM2.5 [47]. The model of GTWR can be described as Equation (1).
Y i = β 0 ( u i , v i , t i ) + k β k ( u i , v i , t i ) X i k + ε i
where Y i denotes the vibrancy in the grid i as the dependent variable of the model. β 0 ( u i , v i , t i ) represents the intercept value, wherein u i , v i and t i denotes the coordinates and time respectively. X i k refers to the k-th explanatory variables (independent variables) in location i. ε i is residual error. β k ( u i , v i , t i ) denotes the parameters of each explanatory variables in space-time location i. In addition, the estimation of β k ( u i , v i , t i ) is essential for the model in capturing spatiotemporal heterogeneous, it can be described as Equation (2).
β k ^ ( u i , v i , t i ) = [ X T W ( u i , v i , t i ) X ] 1 X T W ( u i , v i , t i ) Y
where X denotes the matrix of independent variables, and Y refers to the matrix of observation (i.e., urban vibrancy). Moreover, W ( u i , v i , t i ) is a n × n weighting matrix conposed of diagonal matrix. W ( u i , v i , t i ) = d i a g ( W i 1 , W i 2 , , W i n ) and n is the number of observations. The calculation of W ( u i , v i , t i ) is a crucial step for quantifying spatiotemporal relationship between sample i and other sample, which is also the discrimination from general regression model. The Gauss kernel function can achieve a great efficiency and result in quantifying the spatiotemporal correlation [4], and it can be expressed as Equation (3).
W i j = exp ( d i j 2 / h 2 )
where h is bandwidth, which produces the decay of influence with distance between location i and location j. Cross-validation (CV) can provide the guidance for selecting optimal parameter h. Suppose y i is actual value and y i ^ ( h ) denotes predicted value. Therefore, the value of CV can be described as sum of the squared error between y i and y i ^ ( h ) .
C V ( h ) = i ( y i y i ^ ( h ) ) 2
According to Huang, Wu and Barry [46], d i j can be calculated as Equation (5).
d i j = γ [ ( u i u j ) 2 + ( v i v j ) 2 ] + μ ( t i t j ) 2
where d i j is a crucial element for capturing spatiotemporal heterogeneous between grid i and j.

4.2. Explanatory Variables

In this article, we made use of the original classification scheme of POIs instead of the combined classification scheme used in the data downloaded (e.g., mixing shopping, food and entertainment to represent the type of commercial) to better classify POIs. In addition to POI-related explanatory variables, we also took account of transport accessibility based on road density. Table 1 lists the explanatory variables and their descriptive statistics. In order to weaken the collinearity and transform data to normal distribution, we conducted normalized transformation of explanatory variables. Moreover, we combined shopping POIs and leisure POIs into entertainment POIs as they have similar functions that meet the demand of human activities and have similar impact on temporal variations in urban vibrancy. Similarly, commercial accommodation POIs (e.g., hotels) and residential POIs are integrated into housing POIs, while bus stations and subway stations are united to transportation POIs. According to the previous findings [36,48], the capability of land-use entropy indicators based on conventionally land use parcel data is weak in accurate measures of land use mix. Therefore, this study selected richness of POIs to represent fine-grained land-use diversity [36].

5. Results

In this section, empirical results are shown. First of all, we mapped the spatial distribution of urban vibrancy during different hours of day on weekday as well as on weekend. Lately, we examined dynamic impact of service facilities on urban vibrancy by estimating GTWR models. Particularly, we focused on the associations of three POI categories (i.e., food, housing, and transport) and urban vibrancy as these three POI categories are highly related to sustainable development as well as the pursuit of socioeconomic vibrancy and well-being of residents in the post-industrial era. More specifically, we firstly examined purely temporal variations in the impact of the three variables, and subsequently examined spatiotemporal variations in the impact of the three variables to derive some findings.

5.1. The Spatial Distribution of Vibrancy

We firstly mapped the distribution of vibrancy to explore the spatial patterns of collective human activities during different hours of day on the working day and on the non-working day in the study area. The visualization of result is exhibited as Figure 4 with a spatial resolution of 1 × 1   km . The result of resident’s activity distribution reveal that the concentration of human activities exists in central city districts, Guangzhou north railway station, Guangzhou south railway station and Baiyun international airport, which illustrates the spatial nonstationarity of vibrancy in the study area.
In terms of temporal distribution features, as the presentation of Figure 4a, the lower frequency of human activities happens in sleeping time, and the higher agglomeration quickly takes place in central area after the time when people need to start working until off work. After work, people begin to gradually leave the central districts and return to residential areas located at sub-central districts like Baiyun and Huangpu, which is evident in Figure 4a. Unlike the time of on duty and off duty has become the obvious dividing line between gathering in and dispersion from central areas on the working day, there is not any obvious dividing line on the non-working day. As shown in Figure 4b, there is not any obvious gathering of vibrancy at 9:00 in central areas on the non-working day, and the degree of agglomeration, after obvious gathering takes place, is lower on the non-working day than that on the working day. This can reveal that residents may prefer to stay at home or travel to suburbs on the non-working day as there is no demand to work in city center. Furthermore, the degree of nighttime gathering on the non-working day is slightly higher than that of daytime gathering on working day, which illustrates that people are likely to be more active at night on the non-working day than during the day on the working day. This is probably because November is one of the best times for nightlife in Guangzhou as Guangzhou usually experiences a sunny, cool, and dry weather, with an average temperature of 20 °C in November. These findings potentially assist urban managers to develop some cyclical management policy to reasonably allocate resource.

5.2. Overall Impact Mechanism of Service Facilities and Vibrancy

In order to assess the overall relationship between urban vibrancy and POI-based variables in a 1 × 1   km grid, the ordinary least squares regression is conducted. However, it is prerequisite to calculate the variance inflation factors (VIFs) to avoid multicollinearity that refers to the existence of high-degree intercorrelations between explanatory variables within the line regression model, and finally confirm the suitable explanatory variables with a VIF value below 10 for constituting the regression model [4,14]. Consequently, the independent variable ‘living service POI’ is removed from the model due to a high VIF value of 18.9. Subsequently, an OLS model is estimated to explore the overall influence of explanatory variables on vibrancy during each hour on the working day and non-working days respectively. In total, there are 48 (24 × 2) OLS models estimated. The results are shown as Table 2 and Table 3. All the OLS models achieved a high-degree explanatory capacity with an overall R2 of above 0.8, which illustrates that our models can greatly explain the vibrancy during any time period.
As the show of Table 2, the explanatory variables i.e., ‘number of food POIs’, ‘number of company POIs’, ‘number of transportation POIs’, ‘internal road density’, and ‘POI richness’, have a significantly positive impact on vibrancy throughout all the hours of working day. Furthermore, the high attraction of food POIs can be traced back to the long-lasting Cantonese culture making restaurant one of the most important social activity venues, which illustrates the reason why restaurants greatly attract people in Guangzhou. The company POIs’ positive influence is partly attributable to the concentration of companies in city center with a variety of service facilities. Unlike ‘number of company POIs’, ‘number of financial & insurance POIs’ and ‘external road density’ have significant positive impact during only regular working hours (e.g., from 09:00 to 17:00). In addition, ‘number of education and culture POIs’ has a positive impact from 7:00 to 21:00 that coincide with class time, and ‘number of housing POI’ has a significantly positive influence throughout the whole day except sleeping time.
Table 3 shows that, on the non-working day, the biggest difference takes place between the entertainment POIs and financial & insurance POIs. ‘Number of financial & insurance POIs’ has a significantly negative impact throughout most of the day and have no statistical significance during some hours of the day. The cause of this phenomenon is that financial and insurance POIs are usually close on the non-working day. Meanwhile, ‘number of entertainment POIs’ has a significantly positive impact throughout the whole day on the non-working day; whilst it even has a negative impact during some hours on the working day. Surprisingly, attraction of tourism POIs is unlikely to differ from working days to non-working days. In addition, the public transportation explanatory variable still has a significant impact throughout the whole day on the non-working day.

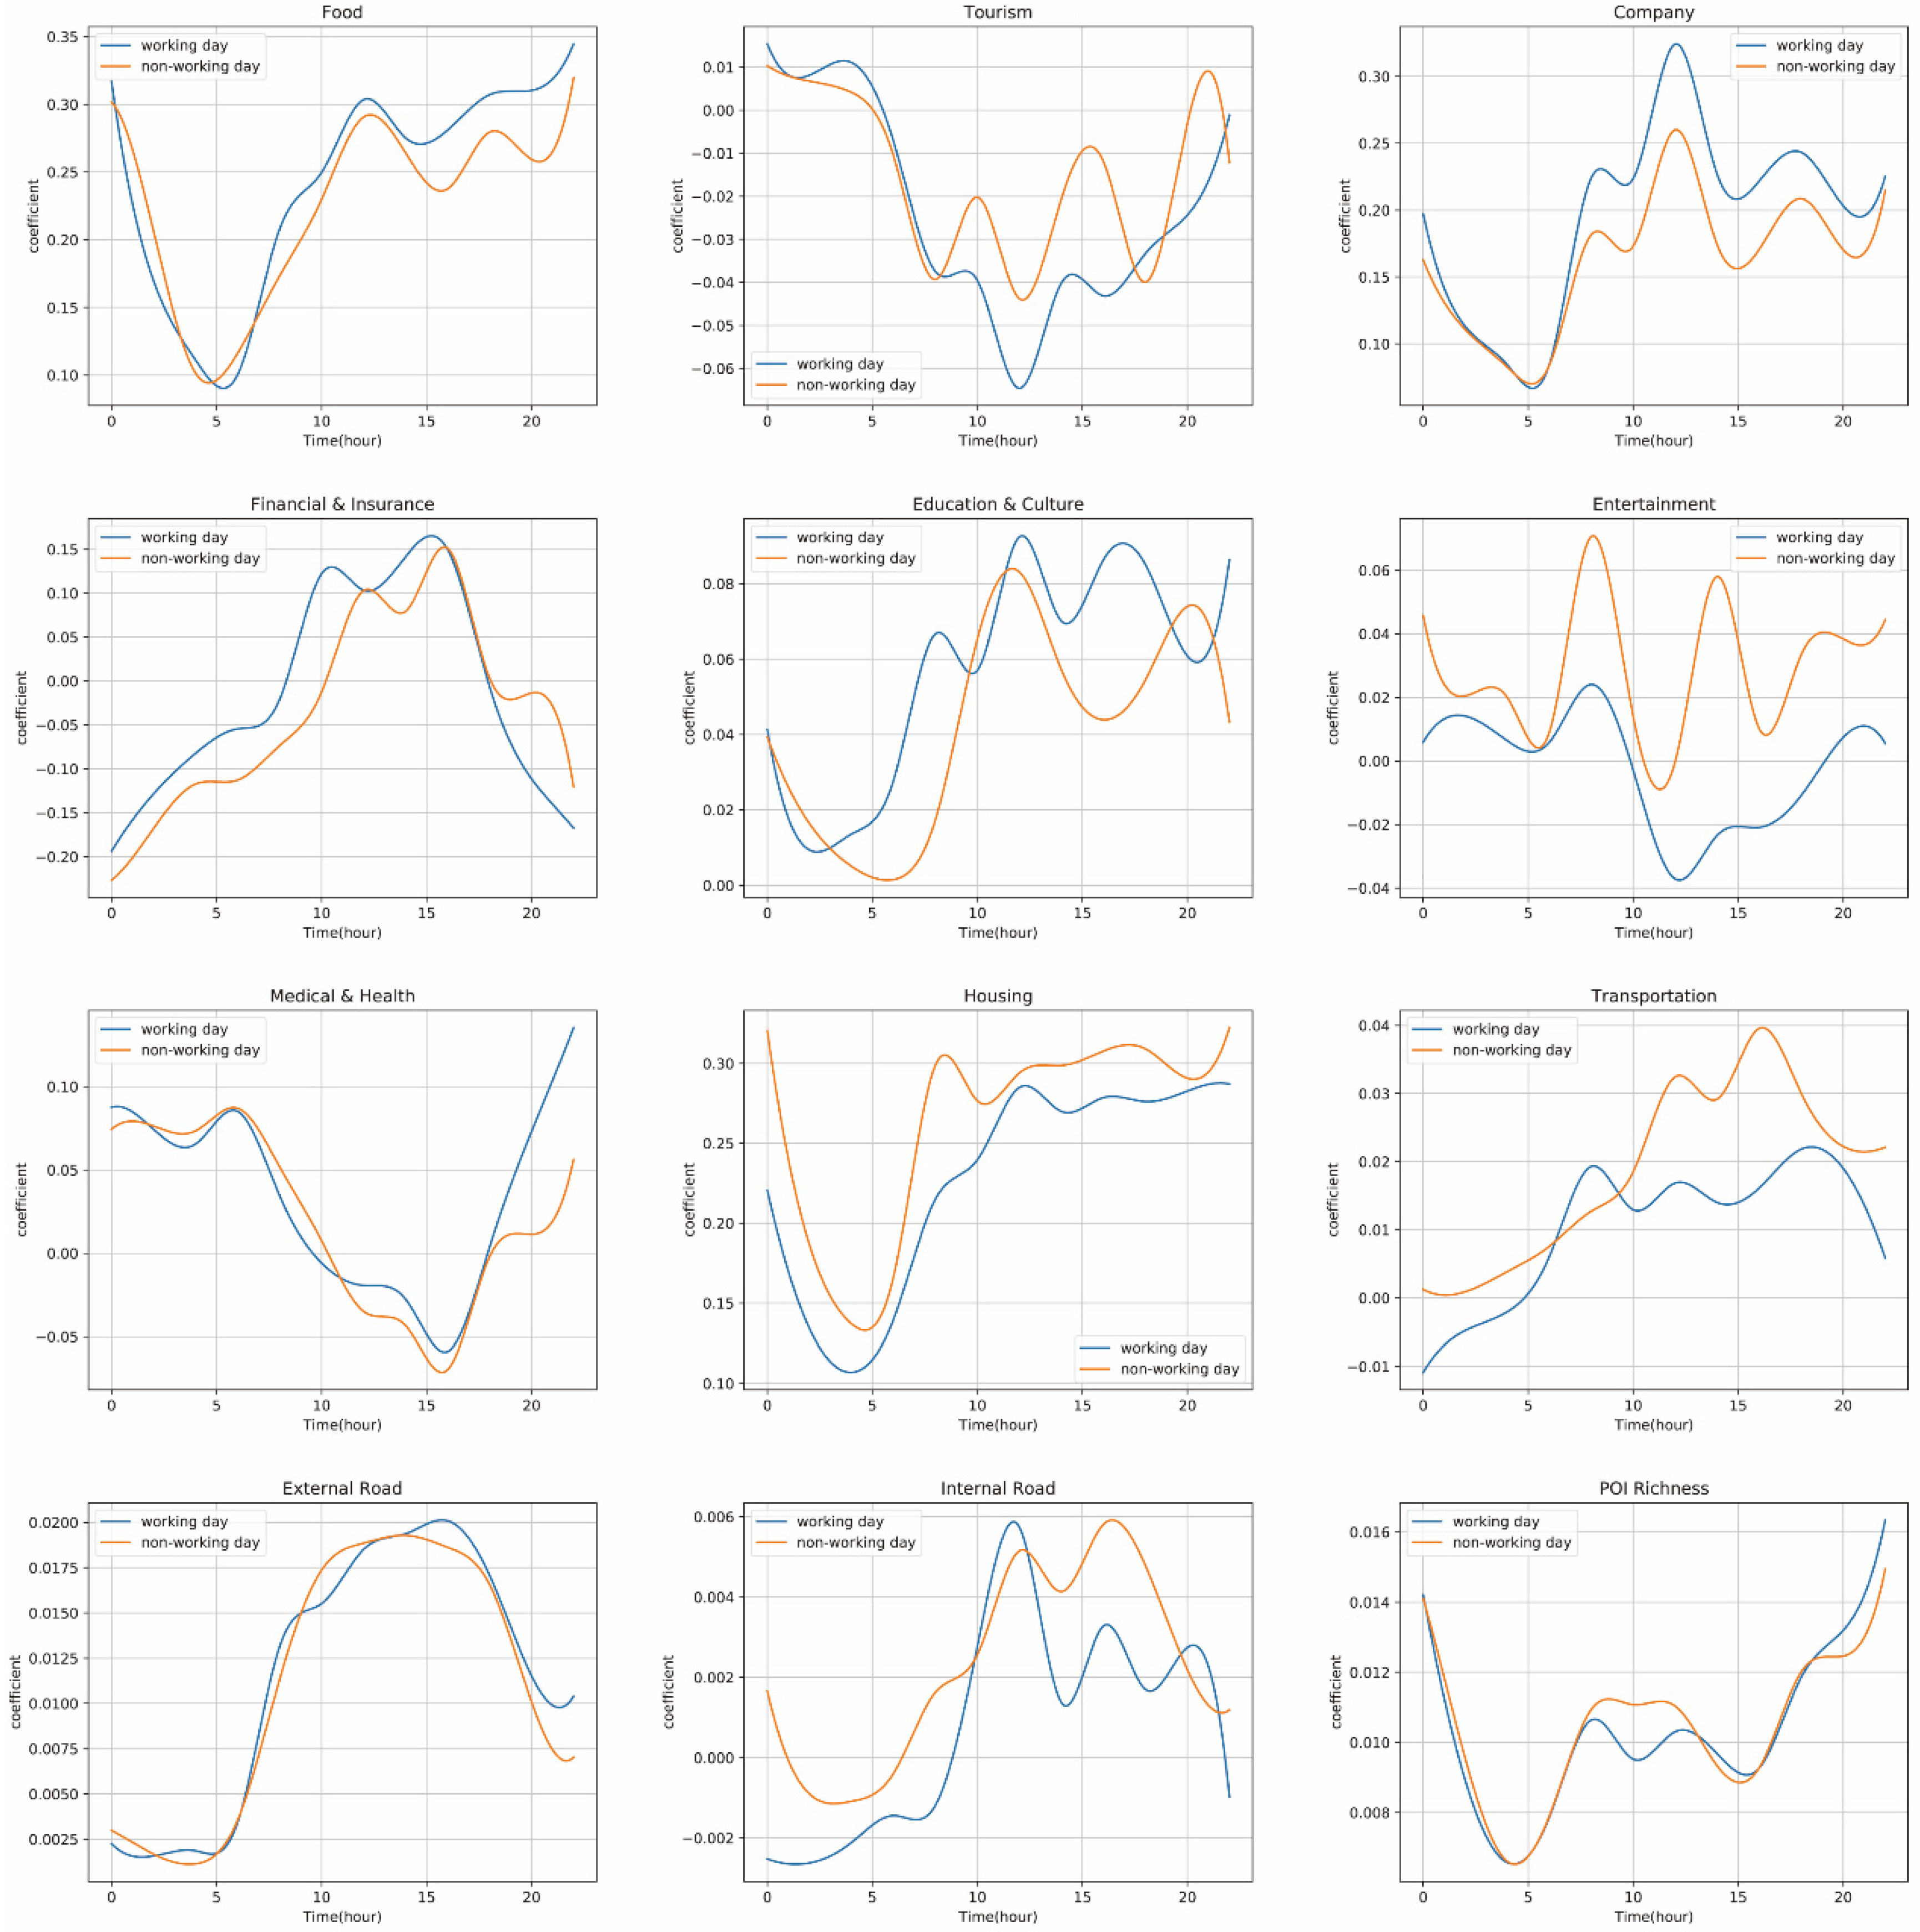
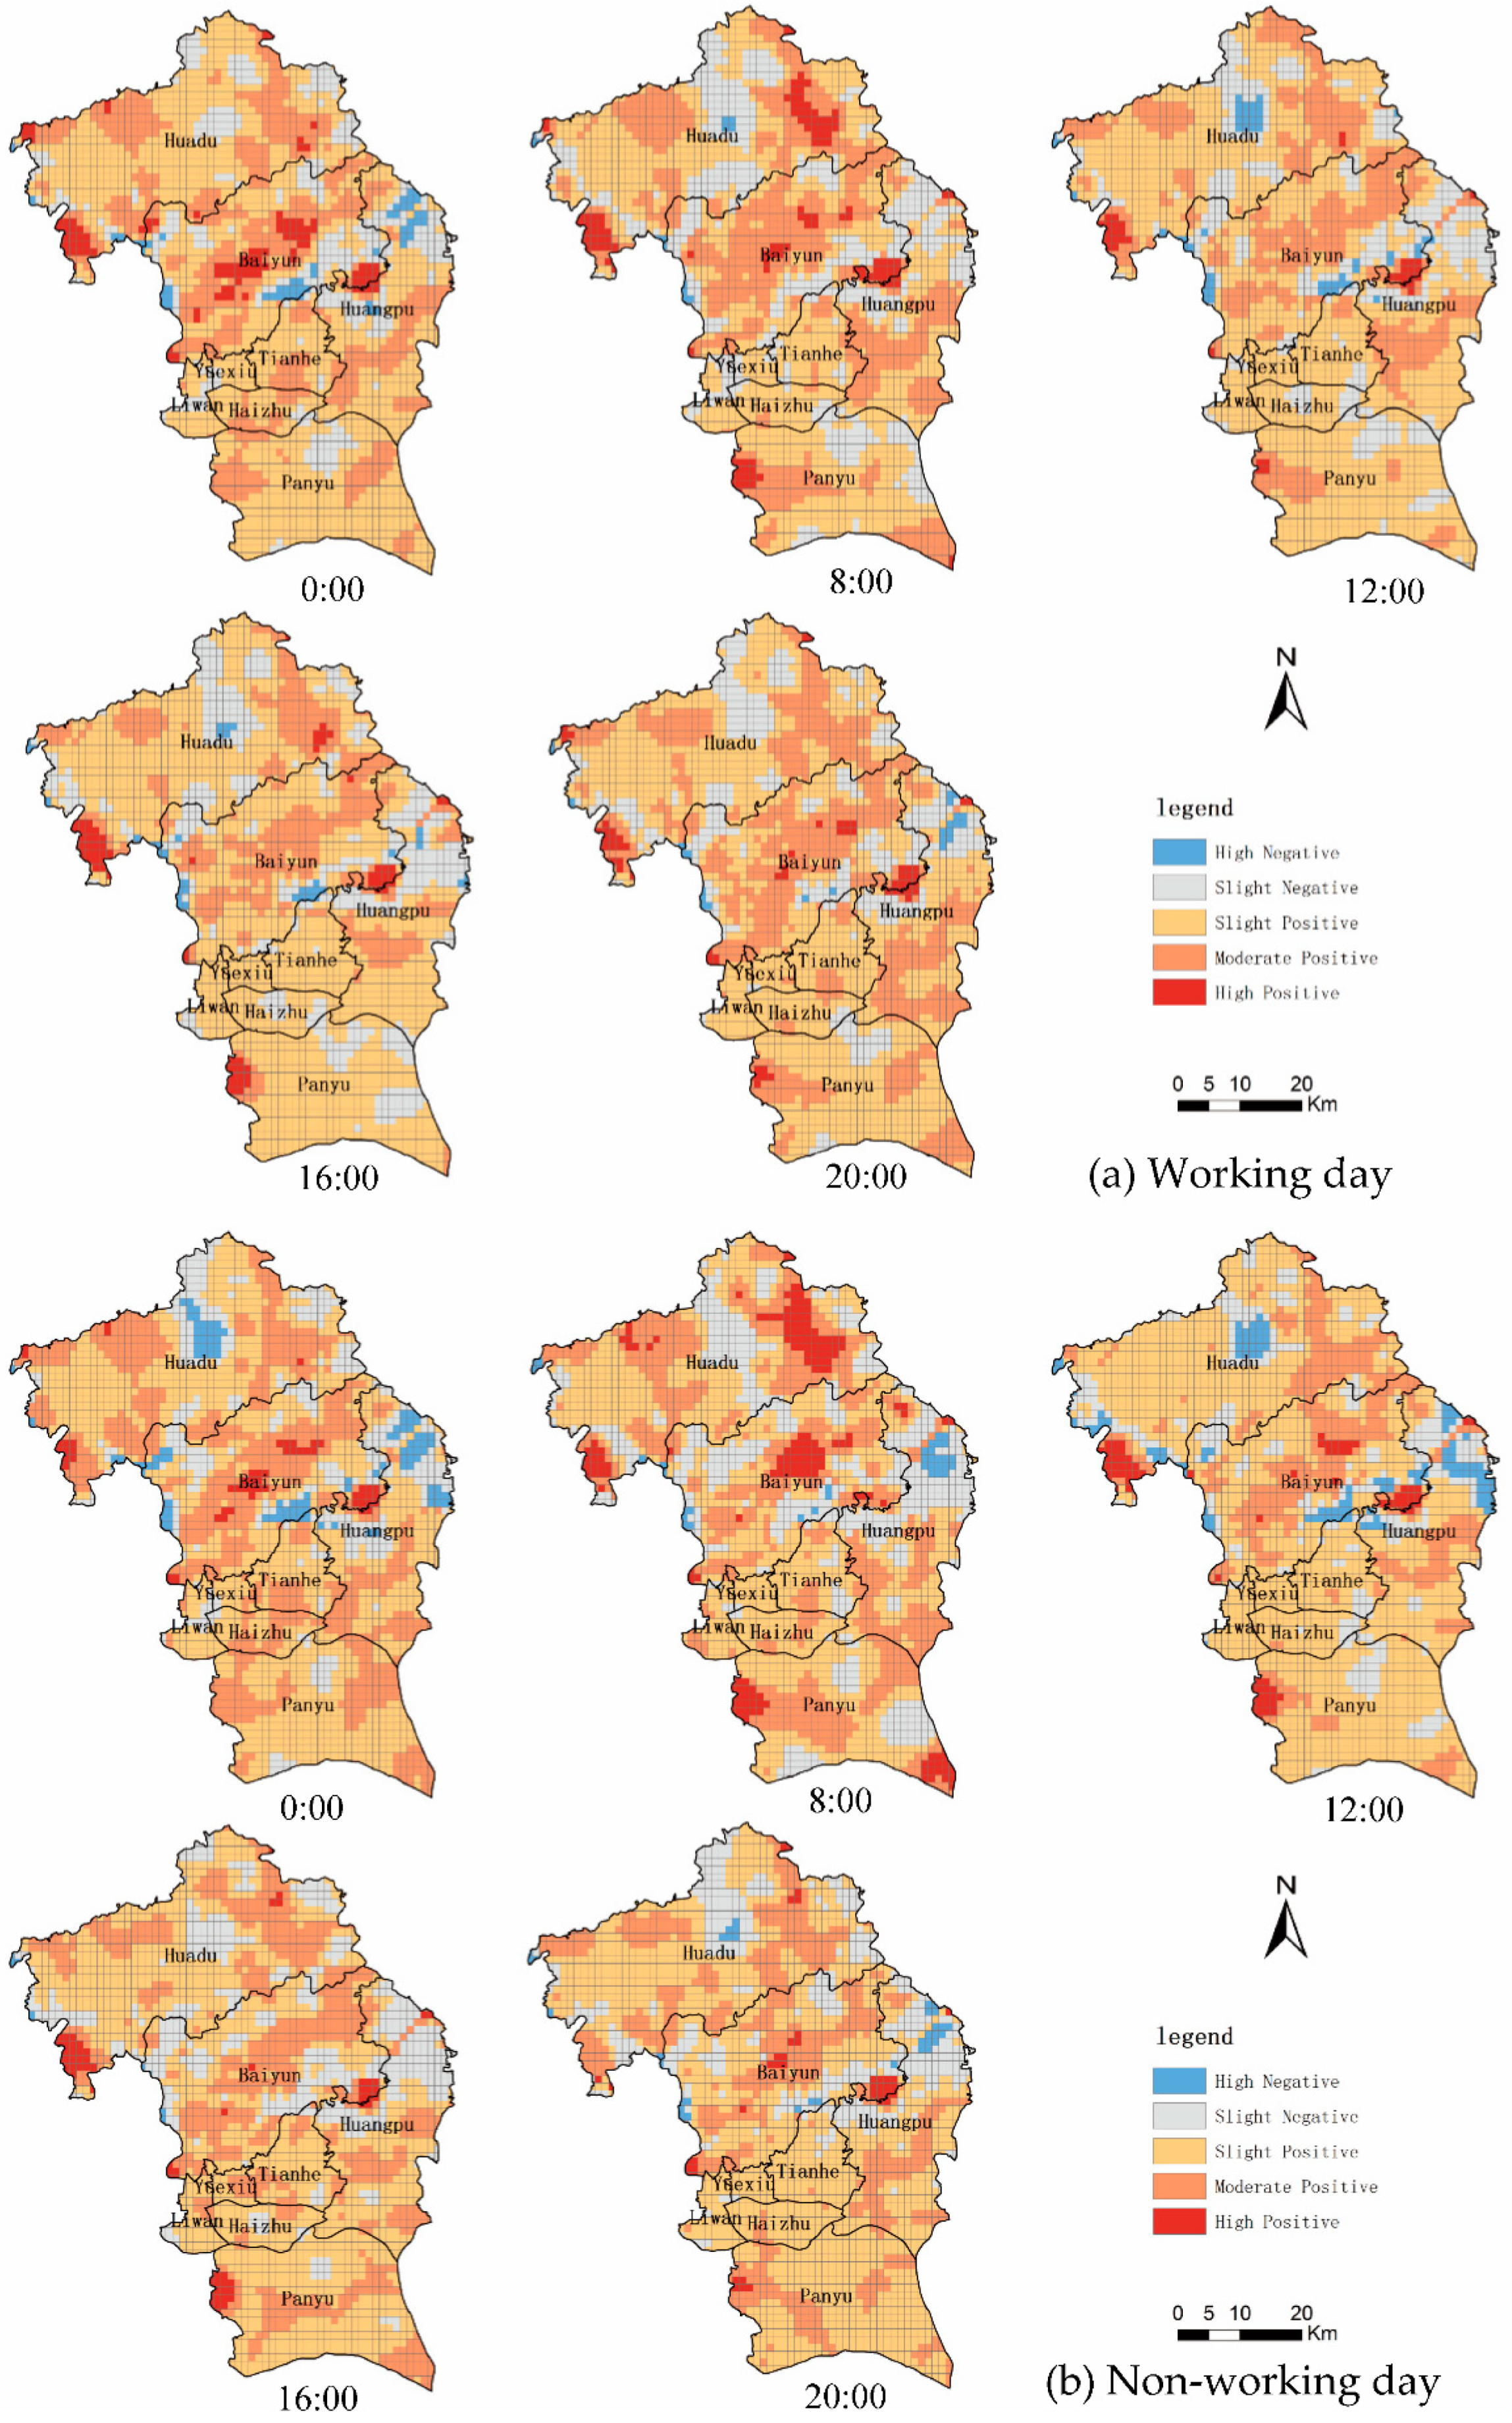
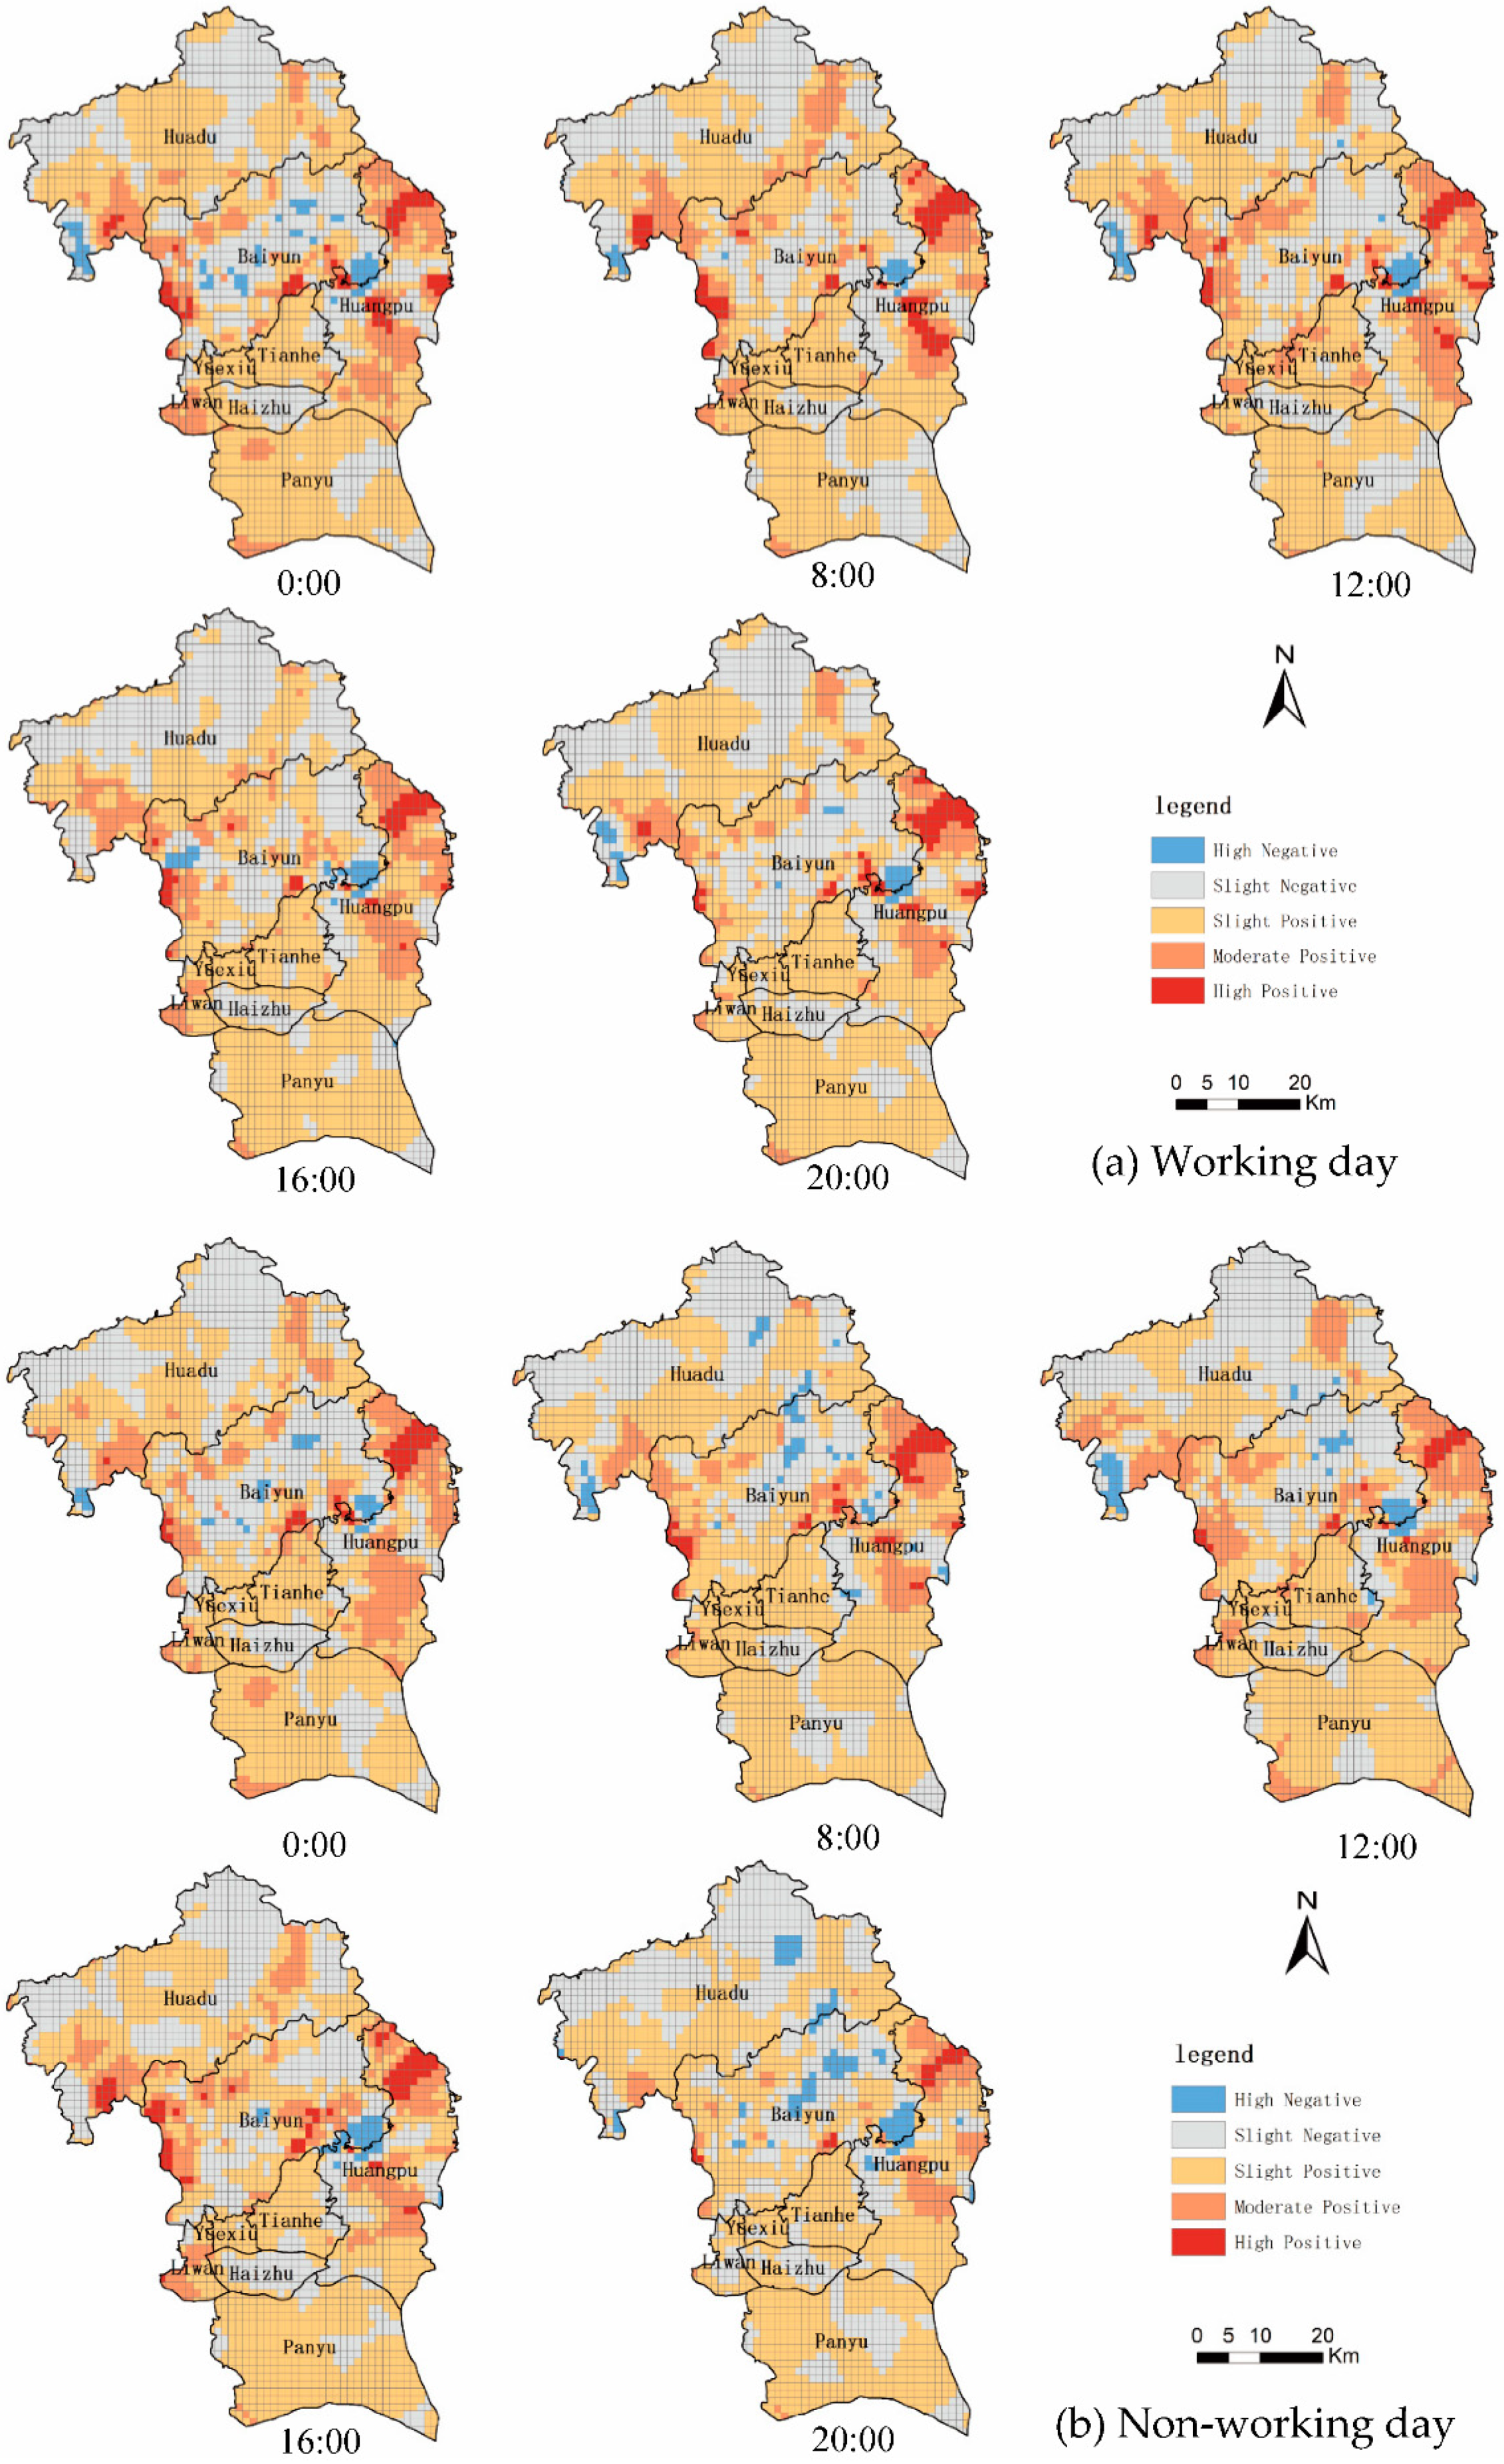
5.3. Spatiotemporally Varying Impact of Service Facilities on Vibrancy

In the discussion above, we gained an understanding of temporal variations in the overall impact of POI-based explanatory variables on urban vibrancy around whole city of Guangzhou. In order to further understand spatial and temporal variations simultaneously in the impact of service facilities on vibrancy, we selected the main districts (Huadu, Baiyun, Huangpu, Tianhe, Haizhu, Yuexiu, Liwan, and Panyu) for further exploration due to data sparsity in the suburb districts of Guangzhou. In this study, the GTWR model was adopted to examine spatiotemporal variations in the impact of service facilities on urban vibrancy. Two GTWR models were estimated based on 2806 observations (2806 grids). The results of GTWR model estimates for working day and non-working day are shown in Table 4 and Table 5 respectively. All selected variables’ corresponding p-values are below 0.001 except ‘V2′ (number of tourism POIs). Furthermore, the R2 achieve high values of 0.991 and 0.988, which represents that the selected explanatory variables can explain 99.1% and 98.8% of spatiotemporal variations in vibrancy on working day and non-working day with optimal bandwidth of 0.119 and 0.121, respectively. As Table 4 and Table 5 show, spatiotemporal variations exist in the coefficients of explanatory variables. The higher the local coefficient, the more attractive the POIs during that one-hour period or within that one-grid area. The detail of influence mechanism is illustrated in the following.
(1)
Purely temporal variations in the impact of service facilities on urban vibrancy
We firstly examined purely temporal variations in the impact of explanatory variables on urban vibrancy on both weekday and weekend. As the exhibition of Figure 5, generally, all POI categories have temporally varying coefficients on both weekday and weekend. Typically, ‘number of company POIs’ and ‘number of financial & insurance POIs’ have higher coefficients at all hours on the working day than on the non-working day; whilst ‘number of entertainment POIs’ and ‘number of housing POIs’ have lower coefficients at all hours on the working day than on the non-working day. This indicates company POIs and financial & insurance POIs are more attractive at all hours on weekday than on weekend; whist entertainment POIs and housing POIs are less attractive at all hours on weekday than on weekend. This is consistent with the expectation that residents are more likely to stay at home or go to entertainment facilities on the weekend, whilst they are more likely to stay in workplaces like companies or financial & insurance sites on weekdays.
We further take a closer look at the temporal variations in coefficients of explanatory variables on weekday and on weekend. Specifically, we take three explanatory variables (i.e., ‘number of housing POIs’, ‘number of food POIs’, and ‘number of transportation POIs’) as example because these three POI categories are highly related to sustainable development as well as the pursuit of socioeconomic vibrancy and well-being of residents in the post-industrial era. Firstly, the coefficients of ‘number of housing POIs’ are positive during the working and non-working day, and have similar trends between weekday and weekend. The main difference of coefficients of ‘number of housing POIs’ between working and non-working day is evident in the morning. This illustrates that many residents are likely to rest at home in the morning of non-working day after five days of hard working. Moreover, the bottom on both working and non-working day appears at approximately 4:00, because few people use the Tencent location’s LBS at that time.
Secondly, temporal variations in the coefficients of ‘food POIs’ on weekday exhibit a similar tendency with those on weekend. The first peak of the coefficients of ‘food POIs’ takes place at 12:00 when people go to have lunch, and subsequently the trend goes down, followed by next slight peak at supper time. The attraction of food POIs still increases after 20:00 due to the popularity of night snack culture in Guangzhou.
Thirdly, temporally varying coefficients of ‘number of transportation POIs’ on weekday and on weekend both have two peaks. Moreover, the trend of temporally varying coefficients of ‘number of transportation POIs’ during working day is in line with the typical working time (the high value take place at 8:00 and 18:00), and the highest attractions of transportation POIs during non-working day appear at approximately 11:30 and 16:00 when is close to the time of lunch and supper. This presumably indicates that on weekend residents prefer to eat out with friends or relatives by public transport. Meanwhile, our finding on the attraction of transport POIs is different from the finding of Wu et al. [4] in which people in Shenzhen presumably prefer to rest at home and keep away from the noisy environment with transportation during non-working day.
Moreover, land use mix is a commonly used indicator for quantifying urban vibrancy in previous studies [14,36], which indicate the importance of mixed land use on urban vibrancy. In this study, we used ‘POI richness’ to measure fine-grained land use mix. As shown of Figure 5, the coefficient of ‘POI richness’ is positive during the whole working day and the whole non-working day. In other words, to some extent, urban vibrancy can be effectively increased from enhancement of the degree of POI richness. Furthermore, the trend of POI richness indicates that nighttime activities are more diverse than daytime activities in Guangzhou.
Apart from mixed land use, transport accessibility has a significantly positive impact on vibrancy due to the positive coefficients of transportation POIs, external and internal road shown in Figure 5. Wherein the positive effects of external road and transportation both are high throughout the whole day except sleeping time.
(2)
Spatiotemporal variations in the impact of service facilities on urban vibrancy
Many previous studies have not yet examined spatial and temporal variations in the impact of explanatory variables on urban vibrancy simultaneously [4,14]. In order to gain more meaningful and helpful findings, we select three variables to further take closer look (i.e., food, housing, and transportation) as these three POI categories are highly related to sustainable development as well as the pursuit of socioeconomic vibrancy and well-being of residents in the post-industrial era. In this study, we focus on the impact of the three selected variables and fused spatial and temporal dimensions to scrutiny the impact mechanism on urban vibrancy from the perspective of dynamic variations, which can better assist policy makers to reasonably develop certain feasible and flexible policies for public resource allocation. Figure 6, Figure 7 and Figure 8 map the spatiotemporally varying coefficients of the three explanatory variables respectively. Here, we applied natural breakpoint for grouping influence parameters, and we also manually set zero to distinguish the negative and positive impact on vibrancy. In Figure 6, Figure 7 and Figure 8, blue and grey colours mean negative local coefficients; whilst red, orange, and yellow colours mean negative local coefficients. The high the local coefficient is, the attractive the POIs are during that hour of day and within that grid. For simplicity, we derived some findings independent of hour of day or type of day. More specifically, the findings on spatial patterns of local coefficients of explanatory variables are fixed and stable, which are not influenced by hour of day or type of day. In other words, spatial patterns exist during any hour of the day on weekdays as well as on the weekend.
As the show of Figure 6a, the high popularity food POIs are located mainly located at Baiyun District and parts of Huadu District and Huangpu District instead of the center of city (e.g., Tianhe District and Haizhu District) irrespective of hour of day or type of day. This finding can assist the development of food tourism and stimulation of consumption by promoting these areas’ Cantonese food to attract tourist and the people who like food, and simultaneously this promotion way can help to relieve the traffic pressure in city center to some extent. Moreover, the effects of food POIs on vibrancy are mostly positive across the study area, which illustrates optimizing the layout of food POIs is a feasible way to effectively enhance city vibrancy in this study area. From the perspective of temporal variation, spatially varying coefficients of food POIs do not differ largely from one time to another during the day. However, according to the Figure 6a,b, we found that the number of grids with positive coefficients of food POIs at 8:00 of non-working day is smaller than that at 8:00 of working day. In other word, expansion of the grids with positive coefficients in the morning of non-working day occurs later than that of working day, which is in line with the phenomenon that many residents prefer to rest at home in the morning of non-working day.
As Figure 7 shows, the housing POIs of Tianhe and Yuexiu, the new and old urban centres of Guangzhou, have the positive effects on urban vibrancy. However, high-popularity housing POIs are located mainly at Huangpu district instead of the center of city irrespective of hour of day or type of day. Huangpu district, full of woodlands, has a better greening condition than city center, and thus offers better living environment than city center. Therefore, it is probably one cause for phenomenon of high-popularity housing POIs being located at Huangpu district. Moreover, spatiotemporal varying coefficients of housing POIs do not differ largely from one time to another during the day. As the exhibition of Figure 7a,b, we found that the number of grids with positive coefficients at 20:00 of working day is more than that at 20:00 of non-working day. In other words, housing POIs’ attraction at 20:00 of working day is higher than that at 20:00 of non-working day. The potentially cause is that people prefer to come back home after work at working day, while during non-working day residents’ nightlife activities will be more abundant.
As the presentation of Figure 8, high-popularity transport POIs are mainly in suburban areas instead of central areas, which is consistent with the findings of Wu, Ye, Ren and Du [4]. The cause of this finding in this study might be different from the mentions of Miles and Song [49] and Wu et al. [30] in which the convenient traffic environment, including transportation of bus and metro, can facilitate people to take the long-distance travel and thus leading to the low degree of vibrancy. One possible reason for this is that commuters are likely to use Tencent’s location-based services (LBS) when waiting for public transport services, leading commuters to use location-based services more frequently before getting on than after getting off bus, subway, or train. The areas with a high density of residents who need to commute to central areas regularly are likely to have high values of local coefficients of transport POIs as residents in these areas are likely to use LBS when waiting for public transport services in support of daily commuting. From the temporal varying perspective, at working day, spatiotemporally varying impact of transport POIs on vibrancy surges at 8:00 when commuters need to commute to workplace (see Figure 7a). However, such a surge, the grids with highly positive effects are expanded at 8:00 of working day, is not evident at 8:00 of non-working day. Similarly, grids with highly positive impact of transport POIs on vibrancy at 16:00 (the time some residents leave workplaces) on working day are more than those on non-working day (see Figure 7a,b). This finding can assist policy makers in developing reasonable allocation measures of transportation resource according to the spatiotemporal variations in coefficients of transport POIs.

6. Discussion

The spatiotemporal distribution of urban vibrancy shows a different pattern between working and non-working day. Whereas the time of on duty and off duty has become the obvious dividing line between gathering in and dispersion from central areas on the working day, there is not any obvious dividing line on the non-working day. It means that the quickly gathering is common in the working day. However, the many public safety incidents will be caused by quickly gathering of people, so this regular pattern of distribution should be paid more attention by urban managers.
Experimental result shows that there is strong relationship between urban vibrancy and POI- and road- based variables. The POI variables of food, housing and company show higher positive attractive to urban vibrancy. This probably demonstrates that these three types of service facility are more easily to attract people for enhancing urban vibrancy. From a temporal perspective, all POI categories have temporally varying coefficients on both weekday and weekend. Specifically, the categories of housing and transportation exhibit a different pattern, that matches the regular activities of residents, between working and non-working day. In the morning of working days, residents are more likely to take the public transportation for working rather than staying at home for resting. In contrast, more residents are likely to rest at home rather than taking the public transportation in the morning of non-working day. Moreover, according to the temporal variation of transportation POIs, urban managers can accurately and effectively optimize the timetable of public transportation.
From the spatial perspective, the effects of food POIs on urban vibrancy are mostly positive across the study area, which illustrates the strong attraction of food to human activity. For urban managers, the food is probably a feasible and effective way to enhance urban vibrancy in short term. Moreover, the most popular housing POIs are located in Huangpu district which has a better greening condition and higher living environment, which illustrates that the living environment has become a more important factor for selecting residential locations with the improvement of people’s living standards. The finding that high-popularity transport POIs are located at suburban can better assist urban managers to optimize the public transport allocation.
The proposed analytical framework successfully describes the impact mechanisms of POI- and road- based service facilities on urban vibrancy. The proposed analysis framework aims to meet the demand of increasing interest in using quantitative method to understand urban vibrancy from the high-resolution and high-dynamic perspectives. Furthermore, the results of our work can assist city planners and policy makers to better understand urban vibrancy in a finer resolution. Moreover, our results can effectively help policy makers to improve public transport services and local function configuration by considering the demand of residents. The findings also can be applied by people to plan their trips and choose a better place that is suitable for their activity. Moreover, our analysis framework can be referenced for researchers’ adoption in similar studies, and our results also can help researchers to learn certain influence factors of interest in detail for further and deeper studies.

7. Conclusions

In the current study, we proposed an analysis framework using multi-source data to explore the spatial and temporal variations in the impact mechanism of urban vibrancy and POI- and road-based variables. In our framework, we firstly explored the spatial and temporal patterns of collective human activities by taking advantage of geographic information systems (GIS) technology. Subsequently, an OLS regression model was estimated to scrutiny the overall influence mechanism between explanatory variables and urban vibrancy in the whole city of Guangzhou. Finally, a GTWR model considering spatiotemporal nonstationary was adopted to explain the phenomena of people aggregation in the main districts of Guangzhou, and achieved a significantly high explanatory capacity of approximately 99% that exceeds previously similar studies. In our analysis of spatiotemporal patterns, the temporal variations in the impact of explanatory variables on vibrancy during 24 h were explored. Moreover, we took into consideration both the results of temporal variation trends and the characteristic of the POIs to select three variables for further investigating the impact mechanism of vibrancy by fusing both spatial and temporal dimensions.
In current study, we utilized the Tencent location-aware big data as the proxy of urban vibrancy. Hence the result is more representative in terms of people groups than the results from check-in data. Meanwhile, according to a more representative result, planners can better develop policies for improving the construction of the city. Moreover, we selected POI characteristics instead of land-use characteristics as the explanatory variables to represent the function of the land more accurately, which can assist city managers to develop policies that target specific places. In the exploration of spatiotemporal patterns of urban vibrancy, previous studies used GTWR models to explore either spatial or temporal patterns. However, we fused both spatial and temporal dimensions to probe the spatiotemporal patterns by using GTWR models. It will be easier to observe the spatiotemporal variation tendencies of influence coefficients.
However, there are some limitations of this study, which are probably feasible improvement directions. First of all, in fusing temporal and spatial dimensions to probe urban vibrancy, we only selected three explanatory variables. More explanatory variables can be selected in the future study to obtain more valuable findings in support of urban development. Moreover, the main date considered in the study is the working and non-working day, while national holidays have not been considered. Therefore, national holidays can be considered in the future to explore the spatiotemporal patterns of urban vibrancy on holidays in support of tourism development.

Author Contributions

Conceptualization, X.Z., Y.S., T.O.C., Y.H., A.Z., and Z.L.; methodology, X.Z., Y.S.; formal analysis and investigation, X.Z., Validation and visualization, Y.S., T.O.C., Y.H., and A.Z..; writing—original draft preparation, X.Z. and Y.S.; writing—review and editing, T.O.C., Y.H., A.Z., and Z.L; funding acquisition, Y.S., T.O.C., and Y.H.; supervision, Y.S. and T.O.C.; resources, Y.S. and T.O.C.; data curation, Z.L. All authors have read and agreed to the published version of the manuscript.

Funding

This work is supported by the Youth Program of National Natural Science Foundation of China (Grant No. 37000-41031458) and the Fundamental Research Funds for the Central Universities (Grant No. 37000-31610445 and 37000-31610453), China.

Institutional Review Board Statement

Not applicable.

Informed Consent Statement

Not applicable.

Data Availability Statement

Data of present study, will be available on request from corresponding author.

Acknowledgments

We are thankful to the anonymous reviewers for their valuable comments.

Conflicts of Interest

The authors declare no conflict of interest.

References

  1. Montgomery, J. Making a city: Urbanity, vitality and urban design. J. Urban Des. 1998, 3, 93–116. [Google Scholar] [CrossRef]
  2. Jin, X.; Long, Y.; Sun, W.; Lu, Y.; Yang, X.; Tang, J. Evaluating cities’ vitality and identifying ghost cities in China with emerging geographical data. Cities 2017, 63, 98–109. [Google Scholar] [CrossRef]
  3. Lu, S.; Shi, C.; Yang, X. Impacts of Built Environment on Urban Vitality: Regression Analyses of Beijing and Chengdu, China. Int. J. Environ. Res. Public Health 2019, 16, 4592. [Google Scholar] [CrossRef] [PubMed] [Green Version]
  4. Wu, C.; Ye, X.; Ren, F.; Du, Q. Check-in behaviour and spatio-temporal vibrancy: An exploratory analysis in Shenzhen, China. Cities 2018, 77, 104–116. [Google Scholar] [CrossRef]
  5. Lynch, K. Good City Form; MIT Press: Cambridge, MA, USA, 1984. [Google Scholar]
  6. Xia, C.; Yeh, A.G.-O.; Zhang, A. Analyzing spatial relationships between urban land use intensity and urban vitality at street block level: A case study of five Chinese megacities. Landsc. Urban Plan. 2020, 193, 103669. [Google Scholar] [CrossRef]
  7. Zhang, X.; Sun, Y.; Zheng, A.; Wang, Y. A New Approach to Refining Land Use Types: Predicting Point-of-Interest Categories Using Weibo Check-in Data. ISPRS Int. J. Geo-Inf. 2020, 9, 124. [Google Scholar] [CrossRef] [Green Version]
  8. Long, Y.; Liu, X. Featured Graphic. How Mixed is Beijing, China? A Visual Exploration of Mixed Land Use. Environ. Plan. A Econ. Space 2013, 45, 2797–2798. [Google Scholar] [CrossRef]
  9. Sun, Y.; Fan, H.; Li, M.; Zipf, A. Identifying the city center using human travel flows generated from location-based social networking data. Environ. Plan. B Plan. Des. 2015, 43, 480–498. [Google Scholar] [CrossRef]
  10. Vu, H.Q.; Li, G.; Law, R.; Ye, B.H. Exploring the travel behaviors of inbound tourists to Hong Kong using geotagged photos. Tour. Manag. 2015, 46, 222–232. [Google Scholar] [CrossRef]
  11. Sun, Y.; Fan, H.; Bakillah, M.; Zipf, A. Road-based travel recommendation using geo-tagged images. Comput. Environ. Urban Syst. 2015, 53, 110–122. [Google Scholar] [CrossRef]
  12. Yang, D.; Zhang, D.; Zheng, V.W.; Yu, Z. Modeling User Activity Preference by Leveraging User Spatial Temporal Characteristics in LBSNs. IEEE Trans. Syst. Man Cybern. Syst. 2015, 45, 129–142. [Google Scholar] [CrossRef]
  13. Liu, X.; He, J.; Yao, Y.; Zhang, J.; Liang, H.; Wang, H.; Hong, Y. Classifying urban land use by integrating remote sensing and social media data. Int. J. Geogr. Inf. Sci. 2017, 31, 1675–1696. [Google Scholar] [CrossRef]
  14. Tang, L.; Lin, Y.; Li, S.; Li, S.; Li, J.; Ren, F.; Wu, C. Exploring the Influence of Urban Form on Urban Vibrancy in Shenzhen Based on Mobile Phone Data. Sustainability 2018, 10, 4565. [Google Scholar] [CrossRef] [Green Version]
  15. Jia, C.; Du, Y.; Wang, S.; Bai, T.; Fei, T. Measuring the vibrancy of urban neighborhoods using mobile phone data with an improved PageRank algorithm. Trans. GIS 2019, 23, 241–258. [Google Scholar] [CrossRef]
  16. Ye, Y.; Li, D.; Liu, X. How block density and typology affect urban vitality: An exploratory analysis in Shenzhen, China. Urban Geogr. 2018, 39, 631–652. [Google Scholar] [CrossRef]
  17. Mellander, C.; Lobo, J.; Stolarick, K.; Matheson, Z. Night-Time Light Data: A Good Proxy Measure for Economic Activity? PLoS ONE 2015, 10, e0139779. [Google Scholar] [CrossRef] [Green Version]
  18. Chen, T.; Hui, E.C.; Wu, J.; Lang, W.; Li, X. Identifying urban spatial structure and urban vibrancy in highly dense cities using georeferenced social media data. Habitat Int. 2019, 89, 102005. [Google Scholar] [CrossRef]
  19. Lu, S.; Huang, Y.; Shi, C.; Yang, X. Exploring the Associations Between Urban Form and Neighborhood Vibrancy: A Case Study of Chengdu, China. ISPRS Int. J. Geo-Inf. 2019, 8, 165. [Google Scholar] [CrossRef] [Green Version]
  20. Shaw, S.-L.; Tsou, M.-H.; Ye, X. Editorial: Human dynamics in the mobile and big data era. Int. J. Geogr. Inf. Sci. 2016, 30, 1687–1693. [Google Scholar] [CrossRef]
  21. Goodchild, M.F. Citizens as sensors: The world of volunteered geography. GeoJournal 2007, 69, 211–221. [Google Scholar] [CrossRef] [Green Version]
  22. He, Q.S.; He, W.S.; Song, Y.; Wu, J.Y.; Yin, C.H.; Mou, Y.C. The impact of urban growth patterns on urban vitality in newly built-up areas based on an association rules analysis using geographical “big data”. Land Use Policy 2018, 78, 726–738. [Google Scholar] [CrossRef]
  23. Li, M.; Sagl, G.; Mburu, L.W.; Fan, H. A contextualized and personalized model to predict user interest using location-based social networks. Comput. Environ. Urban Syst. 2016, 58, 97–106. [Google Scholar] [CrossRef]
  24. Anselin, L. Local Indicators of Spatial Association-LISA. Geogr. Anal. 1995, 27, 93–115. [Google Scholar] [CrossRef]
  25. Fotheringham, A.S.; Brunsdon, C.; Charlton, M. Geographically Weighted Regression: The Analysis of Spatially Varying Relationships; John Wiley & Sons: Hoboken, NJ, USA, 2003. [Google Scholar]
  26. Wu, L.; Zhi, Y.; Sui, Z.W.; Liu, Y. Intra-Urban Human Mobility and Activity Transition: Evidence from Social Media Check-In Data. PLoS ONE 2014, 9, 13. [Google Scholar] [CrossRef] [PubMed] [Green Version]
  27. Jacobs, J. The Death and Life of Great American Cities; Vintage: New York, NY, USA, 1961. [Google Scholar]
  28. Park, D.; Nakagawa, D.; Matsunaka, R.; Oba, T. Structural relationship about pedestrian vibrancy and street environment in central areas of Kyoto, Seoul, Beijing and Florence. Int. J. Urban Sci. 2012, 16, 187–202. [Google Scholar] [CrossRef]
  29. Meng, Y.; Xing, H. Exploring the relationship between landscape characteristics and urban vibrancy: A case study using morphology and review data. Cities 2019, 95, 102389. [Google Scholar] [CrossRef]
  30. Wu, J.; Ta, N.; Song, Y.; Lin, J.; Chai, Y. Urban form breeds neighborhood vibrancy: A case study using a GPS-based activity survey in suburban Beijing. Cities 2018, 74, 100–108. [Google Scholar] [CrossRef]
  31. Liu, Y.; Liu, X.; Gao, S.; Gong, L.; Kang, C.; Zhi, Y.; Chi, G.; Shi, L. Social Sensing: A New Approach to Understanding Our Socioeconomic Environments. Ann. Assoc. Am. Geogr. 2015, 105, 512–530. [Google Scholar] [CrossRef]
  32. Lamb, R.F. The Morphology and Vitality of Business Districts in Upstate New York Villages. Prof. Geogr. 1985, 37, 162–172. [Google Scholar] [CrossRef]
  33. Frank, L.D. Land Use and Transportation Interaction. J. Plan. Educ. Res. 2000, 20, 6–22. [Google Scholar] [CrossRef]
  34. Kenworthy, J.R.; Laube, F.B. Automobile dependence in cities: An international comparison of urban transport and land use patterns with implications for sustainability. Environ. Impact Assess. Rev. 1996, 16, 279–308. [Google Scholar] [CrossRef]
  35. Sharkova, I.V.; Sanchez, T.W. An Analysis of Neighborhood Vitality: The Role of Local Civic Organizations. Available online: https://pdxscholar.library.pdx.edu/cgi/viewcontent.cgi?article=1013&context=cus_pubs (accessed on 10 August 2016).
  36. Yue, Y.; Zhuang, Y.; Yeh, A.G.-O.; Xie, J.-Y.; Ma, C.-L.; Li, Q.-Q. Measurements of POI-based mixed use and their relationships with neighbourhood vibrancy. Int. J. Geogr. Inf. Sci. 2016, 31, 658–675. [Google Scholar] [CrossRef] [Green Version]
  37. Liu, Z.; Du, Y.; Yi, J.; Liang, F.; Ma, T.; Pei, T. Quantitative estimates of collective geo-tagged human activities in response to typhoon Hato using location-aware big data. Int. J. Digit. Earth 2020, 13, 1072–1092. [Google Scholar] [CrossRef]
  38. Liu, Z.; Du, Y.; Liang, F.; Ma, T.; Pei, T. Quantitative Association between Nighttime Lights and Geo-Tagged Human Activity Dynamics during Typhoon Mangkhut. Remote Sens. 2019, 11, 2091. [Google Scholar] [CrossRef] [Green Version]
  39. Zheng, S.; Zheng, J. Assessing the Completeness and Positional Accuracy of OpenStreetMap in China. In Thematic Cartography for the Society; Bandrova, T., Konecny, M., Zlatanova, S., Eds.; Springer International Publishing: Cham, Switzerland, 2014; pp. 171–189. [Google Scholar]
  40. Liu, Z.; Qian, J.; Du, Y.; Wang, N.; Yi, J.; Sun, Y.; Ma, T.; Pei, T.; Zhou, C. Multi-level Spatial Distribution Estimation Model of the Inter-regional Migrant Population Using Multi-source Spatio-temporal Big Data: A Case Study of Migrants from Wuhan during the Spread of COVID-19. J. Geo-Inf. Sci. 2020, 22, 147–160. [Google Scholar]
  41. Gong, P.; Chen, B.; Li, X.; Liu, H.; Wang, J.; Bai, Y.; Chen, J.; Chen, X.; Fang, L.; Feng, S.; et al. Mapping essential urban land use categories in China (EULUC-China): Preliminary results for 2018. Sci. Bull. 2020, 65, 182–187. [Google Scholar] [CrossRef] [Green Version]
  42. He, J.; Li, X.; Liu, P.; Wu, X.; Zhang, J.; Zhang, D.; Liu, X.; Yao, Y. Accurate Estimation of the Proportion of Mixed Land Use at the Street-Block Level by Integrating High Spatial Resolution Images and Geospatial Big Data. IEEE Trans. Geosci. Remote Sens. 2020, 10, 1–14. [Google Scholar] [CrossRef]
  43. Su, M.; Guo, R.; Chen, B.; Hong, W.; Wang, J.; Feng, Y.; Xu, B. Sampling Strategy for Detailed Urban Land Use Classification: A Systematic Analysis in Shenzhen. Remote Sens. 2020, 12, 1497. [Google Scholar] [CrossRef]
  44. Zong, L.; He, S.; Lian, J.; Bie, Q.; Wang, X.; Dong, J.; Xie, Y. Detailed Mapping of Urban Land Use Based on Multi-Source Data: A Case Study of Lanzhou. Remote Sens. 2020, 12, 1987. [Google Scholar] [CrossRef]
  45. Brunsdon, C.; Fotheringham, A.S.; Charlton, M.E. Geographically Weighted Regression: A Method for Exploring Spatial Nonstationarity. Geogr. Anal. 1996, 28, 281–298. [Google Scholar] [CrossRef]
  46. Huang, B.; Wu, B.; Barry, M. Geographically and temporally weighted regression for modeling spatio-temporal variation in house prices. Int. J. Geogr. Inf. Sci. 2010, 24, 383–401. [Google Scholar] [CrossRef]
  47. Guo, Y.; Tang, Q.; Gong, D.-Y.; Zhang, Z. Estimating ground-level PM2.5 concentrations in Beijing using a satellite-based geographically and temporally weighted regression model. Remote Sens. Environ. 2017, 198, 140–149. [Google Scholar] [CrossRef]
  48. Manaugh, K.; Kreider, T. What is mixed use? Presenting an interaction method for measuring land use mix. J. Transp. Land Use 2013, 6, 63–72. [Google Scholar] [CrossRef]
  49. Miles, R.; Song, Y. “Good” Neighborhoods in Portland, Oregon: Focus on Both Social and Physical Environments. J. Urban Aff. 2009, 31, 491–509. [Google Scholar] [CrossRef]
Figure 1. Study area and part of data. (a) District map of Guangzhou; (b) The distribution of road and part of POIs.
Sustainability 13 00444 g001
Figure 2. Quantities of various categories.
Sustainability 13 00444 g002
Figure 3. Framework for studying urban vibrancy.
Sustainability 13 00444 g003
Figure 4. The spatiotemporal distribution of vibrancy in Guangzhou. (a) The vibrancy distribution during working day; (b) The vibrancy distribution during non-working day.
Sustainability 13 00444 g004
Figure 5. Temporal variations in the coefficients estimated for explanatory variables.
Sustainability 13 00444 g005
Figure 6. Spatially varying coefficients of ‘food POIs’ in different periods.
Sustainability 13 00444 g006
Figure 7. Spatially varying coefficients of ‘housing POIs’ in different periods.
Sustainability 13 00444 g007
Figure 8. Spatially varying coefficients of ‘transportation POIs’ in different periods.
Sustainability 13 00444 g008
Table 1. Definition and descriptive statistics of explanatory variables.
CodeVariableMeanStandard Deviation
V1Number of food POIs0.01750.0649
V2Number of tourism POIs0.00540.0313
V3Number of company POIs0.01660.0598
V4Number of financial and insurance POIs0.00470.0264
V5Number of education and culture POIs0.0130.0547
V6Number of life service POIs0.01970.0735
V7Number of entertainment POIs0.02080.0751
V8Number of medical and health POIs0.00830.0334
V9Number of housing POIs0.00720.0301
V10Number of transportation POIs0.02410.0786
V11External road density0.06140.0943
V12Internal road density0.04020.0849
V13Richness of POIs0.23480.2923
Table 2. The results of OLS on working day.
PeriodR2Adjusted R2Explanatory Variables
InterceptV1V2V3V4V5V7V8V9V10V11V12V13
H00.8530.852−6.8 × 10(−4) **0.438 ***−0.02 **0.227 ***−0.473 ***−0.0130.024 ***0.083 ***0.061 ***0.019 ***−0.0070.019 ***0.016 ***
H10.8440843−3.1 × 10(−4)0.329 ***−0.012 *0.177 ***−0.358 ***−0.0060.024 ***0.067 ***0.0170.011 **−0.006 *0.012 ***0.011 ***
H20.8360.835−1.6 × 10(−4)0.241 ***−0.008 *0.132 ***−0.266 ***−0.009 **0.02 ***0.061 ***0.0090.012 ***−0.005 *0.006 ***0.008 ***
H30.8260.826−1.3 × 10(−4)0.181 ***−0.0060.105 ***−0.217 ***−0.008 **0.017 ***0.059 ***0.010.01 ***−0.004 *0.005 **0.007 ***
H40.8280.827−1.1 × 10(−4)0.154 ***−0.007 *0.087 ***−0.183 ***−0.01 ***0.014 ***0.064 ***0.0080.012 ***−0.003 *0.003 **0.006 ***
H50.8310.831−1.3 × 10(−4)0.124 ***−0.006 *0.077 ***−0.161 ***−0.008 **0.013 ***0.071 ***0.01 *0.012 ***−0.0020.003 **0.006 ***
H60.8540.853−1.8 × 10(−4)0.134 ***−0.0050.08 ***−0.175 ***−0.0040.013 ***0.092 ***0.016 ***0.023 ***−0.0020.004 **0.009 ***
H70.8870.887−4.3 × 10(−4) **0.182 ***−0.0060.117 ***−0.219 ***0.011 **0.0060.128 ***0.035 ***0.051 ***0.0020.006 ***0.011 ***
H80.9080.9076.3 × 10(−4) ***0.215 ***−0.011 *0.182 ***−0.139 ***0.048 ***−0.014 ***0.12 ***0.058 ***0.08 ***0.013 ***0.009 ***0.009 ***
H90.9290.929−5.7 × 10(−4) **0.201 ***−0.0020.225 ***0.059 ***0.054 ***−0.01 **0.086 ***0.065 ***0.078 ***0.013 ***0.012 ***0.008 ***
H100.9310.931−5.7 × 10(−4) **0.219 ***0.0030.205 ***0.165 ***0.052 ***0.009 *0.07 ***0.058 ***0.072 ***0.016 ***0.015 ***0.007 ***
H110.930.93−3.2 × 10(−4)0.298 ***0.0020.261 ***0.228 ***0.091 ***0.0020.036 **0.05 ***0.63 ***0.02 ***0.012 ***0.003 ***
H120.9310.931−6 × 10(−4) *0.289 ***−0.0060.302 ***0.284 ***0.07 ***−0.0040.066 ***0.077 ***0.074 ***0.018 ***0.02 ***0.008 ***
H130.9240.923−4 × 10(−4)0.316 ***0.0010.273 ***0.129 ***0.07 ***0.042 ***0.041 ***0.046 ***0.063 ***0.017 ***0.018 ***0.005 ***
H140.9190.919−5.2 × 10(−4) *0.285 ***0.023 ***0.24 ***0.18 ***0.051 ***0.047 ***0.0170.044 ***0.064 ***0.024 ***0.017 ***0.003 ***
H150.9260.926−2.2 × 10(−4) *0.251 ***0.024 ***0.244 ***0.208 ***0.047 ***0.041 ***0.042 ***0.056 ***0.073 ***0.024 ***0.018 ***0.002 **
H160.9280.928−5.3 × 10(−4) *0.262 ***0.019 ***0.236 ***0.156 ***0.065 ***0.033 ***0.062 ***0.058 ***0.069 ***0.025 ***0.019 ***0.03 ***
H170.9270.927−5.9 × 10(−4) **0.295 ***0.0050.237 ***0.142 ***0.068 ***0.024 ***0.078 ***0.045 ***0.062 ***0.025 ***0.018 ***0.004 ***
H180.9270.927−5.7 × 10(−4) *0.319 ***−0.019 **0.255 ***0.064 ***0.08 ***0.021 ***0.094 ***0.059 ***0.063 ***0.017 ***0.013 ***0.009 ***
H190.9150.914−5.9 × 10(−4) **0.364 ***−0.016 **0.208 ***−0.022 *0.051 ***0.0040.068 ***0.034 ***0.059 ***0.015 ***0.011 ***0.01 ***
H200.9110.91−4.6 × 10(−4) *0.39 ***−0.027 ***0.177 ***−0.177 ***0.024 ***−0.0020.084 ***0.051 ***0.066 ***0.0050.011 ***0.012 ***
H210.8990.899−6.5 × 10(−4) **0.405 ***−0.022 ***0.17 ***−0.271 ***0.022 ***0.014 **0.093 ***0.049 ***0.064 ***0.0040.011 ***0.016 ***
H220.8840.883−9 × 10(−4) ***0.443 ***−0.018 **0.192 ***−0.371 ***0.0010.014 *0.12 ***0.074 ***0.055 ***0.0030.015 ***0.02 ***
H230.8650.864−9 × 10(−4) **0.444 ***−0.025 **0.236 ***−0.496 ***0.0020.016 *0.133 ***0.081 ***0.042 ***−0.0030.019 ***0.019 ***
Note: *, **, *** denote corresponding p-value are below 0.05, 0.01, and 0.001 respectively.
Table 3. The results of OLS on non-working day.
PeriodR2Adjusted R2Explanatory Variables
InterceptV1V2V3V4V5V7V8V9V10V11V12V13
H00.8610.861−6.1 × 10(−4) *0.45 ***−0.022 **0.222 ***−0.45 ***−0.0030.021 ***0.078 ***0.049 ***0.02 ***−0.0050.016 ***0.016 ***
H10.8520851−3.1 × 10(−4)0.368 ***−0.019 ***0.179 ***−0.376 ***−0.0040.024 ***0.051 ***0.021 *0.019 ***−0.008 **0.012 ***0.012 ***
H20.8410.841−2.1 × 10(−4)0.279 ***−0.012 *0.143 ***−0.306 ***−0.0050.018 ***0.068 ***0.0080.014 ***−0.005 *0.006 **0.009 ***
H30.8320.832−1.1 × 10(−4)0.196 ***−0.008 *0.104 ***−0.221 ***−0.0060.021 ***0.056 ***0.0040.014 ***−0.004 *0.003 *0.007 ***
H40.8310.83−1.1 × 10(−4)0.16 ***−0.006 *0.089 ***−0.193 ***−0.01 ***0.013 ***0.061 ***0.0090.012 ***−0.003 *0.003 *0.007 ***
H50.8290.829−1.1 × 10(−4)0.135 ***−0.0050.081 ***−0.174 ***−0.007 **0.013 ***0.066 ***0.01 *0.015 ***−0.003 *0.002 *0.007 ***
H60.8470.847−2.1 × 10(−4)0.137 ***−0.007 *0.083 ***−0.187 ***−0.007 *0.015 ***0.085 ***0.014 **0.024 ***−0.00010.003 *0.009 ***
H70.8750.874−4.3 × 10(−4) **0.172 ***−0.012 **0.1 ***−0.218 ***0.0040.014 ***0.11 ***0.035 ***0.039 ***0.0020.005 **0.013 ***
H80.9030.9021.5 × 10(−4) ***0.21 ***−0.014 **0.135 ***−0.232 ***0.026 ***0.018 ***0.119 ***0.058 ***0.054 ***0.008 ***0.009 ***0.012 ***
H90.9170.917−1.7 × 10(−4) **0.216 ***−0.0040.162 ***−0.213 ***0.044 ***0.03 ***0.113 ***0.056 ***0.085 ***0.011 ***0.01 ***0.01 ***
H100.9230.923−1.8 × 10(−4) **0.26 ***0.00040.168 ***−0.171 ***0.071 ***0.038 ***0.096 ***0.057 ***0.077 ***0.016 ***0.011 ***0.008 ***
H110.9270.926−3.2 × 10(−4)0.338 ***0.0060.186 ***−0.06 ***0.073 ***0.027 ***0.068 **0.053 ***0.088 ***0.018 ***0.013 ***0.005 ***
H120.9270.926−5 × 10(−4) *0.354 ***−0.00070.235 ***−0.104 ***0.077 ***0.034 ***0.074 ***0.059 ***0.084 ***0.02 ***0.019 ***0.007 ***
H130.9230.922−2.2 × 10(−4) *0.31 ***0.0110.221 ***−0.081 ***0.05 ***0.042 ***0.137 ***0.049 ***0.08 ***0.015 ***0.022 ***0.007 ***
H140.9150.915−4.3 × 10(−4)0.32 ***0.015 **0.18 ***−0.0120.043 ***0.068 ***0.038 ***0.025 ***0.082 ***0.021 ***0.019 ***0.004 ***
H150.9160.916−2.1 × 10(−4)0.295 ***0.031 ***0.164 ***−0.0170.045 ***0.054 ***0.053 ***0.042 ***0.084 ***0.022 ***0.015 ***0.002 **
H160.9150.915−4.9 × 10(−4) *0.306 ***0.026 ***0.18 ***−0.0060.038 ***0.045 ***0.081 ***0.03 ***0.07 ***0.022 ***0.019 ***0.004 ***
H170.9240.924−2.1 × 10(−4)0.343 ***0.025 ***0.158 ***0.0090.062 ***0.053 ***0.01660.048 ***0.082 ***0.017 ***0.016 ***0.004 ***
H180.9230.923−2.1 × 10(−4) ***0.354 ***−0.015 **0.2 ***−0.122 ***0.04 ***0.037 ***0.061 ***0.049 ***0.072 ***0.018 ***0.019 ***0.01 ***
H190.9240.924−4.9 × 10(−4) *0.418 ***−0.0090.163 ***−0.166 *0.015 ***0.018 ***0.0010.081 ***0.067 ***0.009 ***0.014 ***0.011 ***
H200.9080.908−4.6 × 10(−4) *0.37 ***−0.0090.144 ***−0.211 ***0.0070.028 ***0.09 ***0.053 ***0.046 ***0.0050.009 ***0.015 ***
H210.9010.901−2.1 × 10(−4) *0.423 ***−0.016 ***0.125 ***−0.257 ***0.0040.014 **0.093 ***0.049 ***0.064 ***0.0040.011 ***0.016 ***
H220.8850.885−2.5 × 10(−4) **0.42 ***−0.023 **0.172 ***−0.373 ***−0.0080.025 ***0.125 ***0.085 ***0.056 ***0.00050.014 ***0.02 ***
H230.8680.868−2.8 × 10(−4) **0.457 ***−0.037 ***0.206 ***−0.44 ***−0.010.025 *0.122 ***0.081 ***0.039 ***−0.008 *0.015 ***0.02 ***
Note: *, **, *** denote corresponding p-value are below 0.05, 0.01, and 0.001 respectively.
Table 4. The summary results of estimated coefficients on working day.
VariableMinFirst QuartileMedianThird QuartileMaxSDp-Value
V1−5.7670.0380.2030.42310.7150.5050.000 ***
V2−4.158−0.102−0.0080.0614.1880.3950.019 *
V3−10.5150.0430.1690.3363.7620.4220.000 ***
V4−16.377−0.486−0.0630.29428.8381.3740.000 ***
V5−4.502−0.0730.0390.2022.6960.3660.000 ***
V7−21.389−0.1060.0150.15114.1160.8920.000 ***
V8−7.801−0.1550.0720.2876.2120.6040.000 ***
V9−27.114−0.1060.1310.49417.9560.9630.000 ***
V10−2.677−0.0430.0030.0631.7910.1420.000 ***
V11−0.653−0.0010.0070.0230.5010.050.000 ***
V12−0.462−0.0090.0010.0110.4560.0440.000 ***
V13−0.1360.0010.0060.0160.2270.0180.000 ***
Note: *, **, *** denote corresponding p-value are below 0.05, 0.01, and 0.001 respectively. R2 = 0.991 Bandwidth = 0.119 Residual sum of squares = 1.244.
Table 5. The summary results of estimated coefficients on non-working day.
VariableMinFirst QuartileMedianThird QuartileMaxSDp-Value
V1−6.70.0390.2080.4188.5070.4810.000 ***
V2−4.07−0.105−0.0090.0663.9190.3860.015 *
V3−7.2830.020.1380.2926.5070.3850.000 ***
V4−9.930−0.531−0.0730.28323.8981.3870.000 ***
V5−5.316−0.0940.0240.1853.1330.3780.000 ***
V7−13.846−0.0940.0250.17210.9090.7290.000 ***
V8−9.848−0.170.0740.2914.2380.6320.000 ***
V9−20.474−0.1090.1260.51219.310.9550.000 ***
V10−3.0−0.0390.0080.0724.0830.1590.000 ***
V11−0.681−0.0010.0070.0230.5470.0510.000 ***
V12−0.427−0.0070.0010.0130.4160.0430.000 ***
V13−0.1670.0010.0060.0150.2280.0180.000 ***
Note: *, **, *** denote corresponding p-value are below 0.05, 0.01, and 0.001 respectively. R2 = 0.988 Bandwidth = 0.121 Residual sum of squares = 1.349.
Publisher’s Note: MDPI stays neutral with regard to jurisdictional claims in published maps and institutional affiliations.

