Article

Localizing Indicators of SDG11 for an Integrated Assessment of Urban Sustainability—A Case Study of Hainan Province

1
Jiangsu Key Laboratory of Marine Bioresources and Environment, Jiangsu Ocean University, Lianyungang 222005, China
2
School of Marine Technology and Geomatics, Jiangsu Ocean University, Lianyungang 222005, China
3
International Research Center of Big Data for Sustainable Development Goals, Beijing 100094, China
4
Aerospace Information Research Institute, Chinese Academy of Sciences, Beijing 100094, China
5
Key Laboratory for Earth Observation of Hainan Province, Sanya 572000, China
*
Authors to whom correspondence should be addressed.
Sustainability 2021, 13(19), 11092; https://doi.org/10.3390/su131911092
Submission received: 3 September 2021 / Revised: 29 September 2021 / Accepted: 4 October 2021 / Published: 7 October 2021

Abstract

:
Rapid urbanization has brought many problems, including housing shortages, traffic congestion, air pollution, and lack of public space. To solve these problems, the United Nations proposed “The 2030 Agenda for Sustainable Development”, which contains 17 Sustainable Development Goals covering three dimensions: economy, society, and environment. Among them, Sustainable Development Goal 11 (SDG11), “Make cities and human settlements inclusive, safe, resilient and sustainable”, can be measured at the city level. So far SDG11 still lacks three-quarters of the data required to accurately assess progress towards the goal. In this paper, we localized the indicators of SDG11 and collected Earth observation data, statistical data, and monitoring data at the city and county levels to build a better urban sustainable development assessment framework. Overall, we found that Haikou and Sanya were close to achieving sustainable development goals, while other cities were still some distance away. In Hainan Province, there was a spatial distribution pattern of high development levels in the north and south, but low levels in the middle and west. Through the Moran’s I Index of Hainan Province, we found that the sustainable development of Hainan Province did not yet form part of integrated development planning. The sustainable development assessment framework and localization methods proposed in this paper at the city and county levels provide references for the sustainable development of Hainan. At the same time, it also provides a reference for the evaluation of county-level sustainable development goals in cities in China and even the world.

1. Introduction

Over the past few decades, the world has been in the process of rapid urbanization. In 1950, only 30% of the world’s population lived in cities. By 2018, this proportion had increased to 55% and is expected to increase to 68% by 2050 [1]. Although urban areas account for less than 1% of the global land cover, they contribute 75% of global GDP, consume 60–80% of energy, and produce 75% of the global waste [2]. Rapid urbanization has brought many challenges, including insufficient housing, traffic congestion, environmental pollution, and insufficient public space.
In order to measure, monitor, and report on the sustainable development of cities, the United Nations proposed 17 Sustainable Development Goals (SDGs) covering the three dimensions of economy, society, and environment. In the 2030 Agenda for Sustainable Development announced in 2015 [1], Sustainable Development Goal 11 (SDG11), “Building inclusive, safe, resilient, and sustainable cities and human settlements”, is critical to achieving all the other SDGs [3]. The SDGs can be broken down into 169 indicators, and SDG11 includes seven technical targets and three policy targets, with a total of 15 measurable indicators of progress towards those targets. As of 29 March 2021, ten of those indicators presented problems to do with missing data in monitoring and evaluation, and one indicator was temporarily removed with no suitable substitute. In addition, SDG11 is linked to at least 11 other SDGs, and about one-third of the more than 230 SDG indicators can be measured at the city level [4,5,6,7]. China is the largest developing country in the world and has always insisted that development is the priority [8]. In 2016, China formulated the National Plan for the Implementation of the 2030 Agenda for Sustainable Development [9], and issued the Plan for the Construction of Innovation Demonstration Zones for the Implementation of the 2030 Agenda [10].
At present, the monitoring, comprehensive evaluation, and application of the United Nations’ SDG indicators have become an international research frontier. The United Nations, national government departments, international organizations, and research institutes in China and elsewhere have carried out monitoring and comprehensive assessments of urban sustainable development indicators using statistical data. For example, experts from the Sustainable Development Solution Network (SDSN) carried out a comprehensive urban sustainability assessment for 45 European capital cities and 105 large American cities [11,12]. Based on statistical data, China’s experts have also made sustainable development assessments of China’s national, provincial, and municipal levels [13,14,15]. The recent studies did not use geospatial data, so it was difficult for them to effectively reflect the nation’s spatial pattern and its variation in the SDG indicators. With the rapid development of satellite earth observation, some researchers have attempted to conduct evaluation and monitoring of SDGs combining statistics and geographic data [16,17,18,19,20]. However, in general, they are still at the stage of conceptual design, method discussion, and single indicator evaluation of small-scale pilot projects, and there has not yet been a comprehensive evaluation report of a complete administrative region [21,22,23].
Hainan Province is the newest province in China, and its urbanization development started relatively late, so it is easier to discover the impact of urbanization on sustainable development. In 2018, the Chinese government proposed the construction of the Hainan Free Trade Port, and released an overall plan for construction in 2020. Therefore, it is of great research significance to comprehensively assess urban sustainable development within the context of SDG11 in Hainan Province, and it is also a national strategic demand. The increasing urban population in Hainan brings many difficulties to the planning of urban public space, especially in the replanning of the old city. Therefore, in the context of provincial urbanization, unplanned urban expansion makes the urban ecological environment relatively fragile, and the ecological security situation is very grim [24,25,26]. Hainan Province has four cities and fifteen counties. Among them, 15 cities/counties have scarce statistical data, which cannot satisfy the sustainable development assessment of cities in Hainan Province.
Therefore, this paper takes Hainan Province as the study area, using Earth observation, statistics, and other data sources to carry out: (1) the construction of a localization system of SDG11 indicators in Hainan Province; and (2) quantitative and systematic monitoring and comprehensive assessment of SDG11 indicators at the municipal and county level of Hainan Province from 2010 to 2018. Our research can provide approaches and solutions for other provinces and regions to implement the SDGs.

2. Study Area and Data
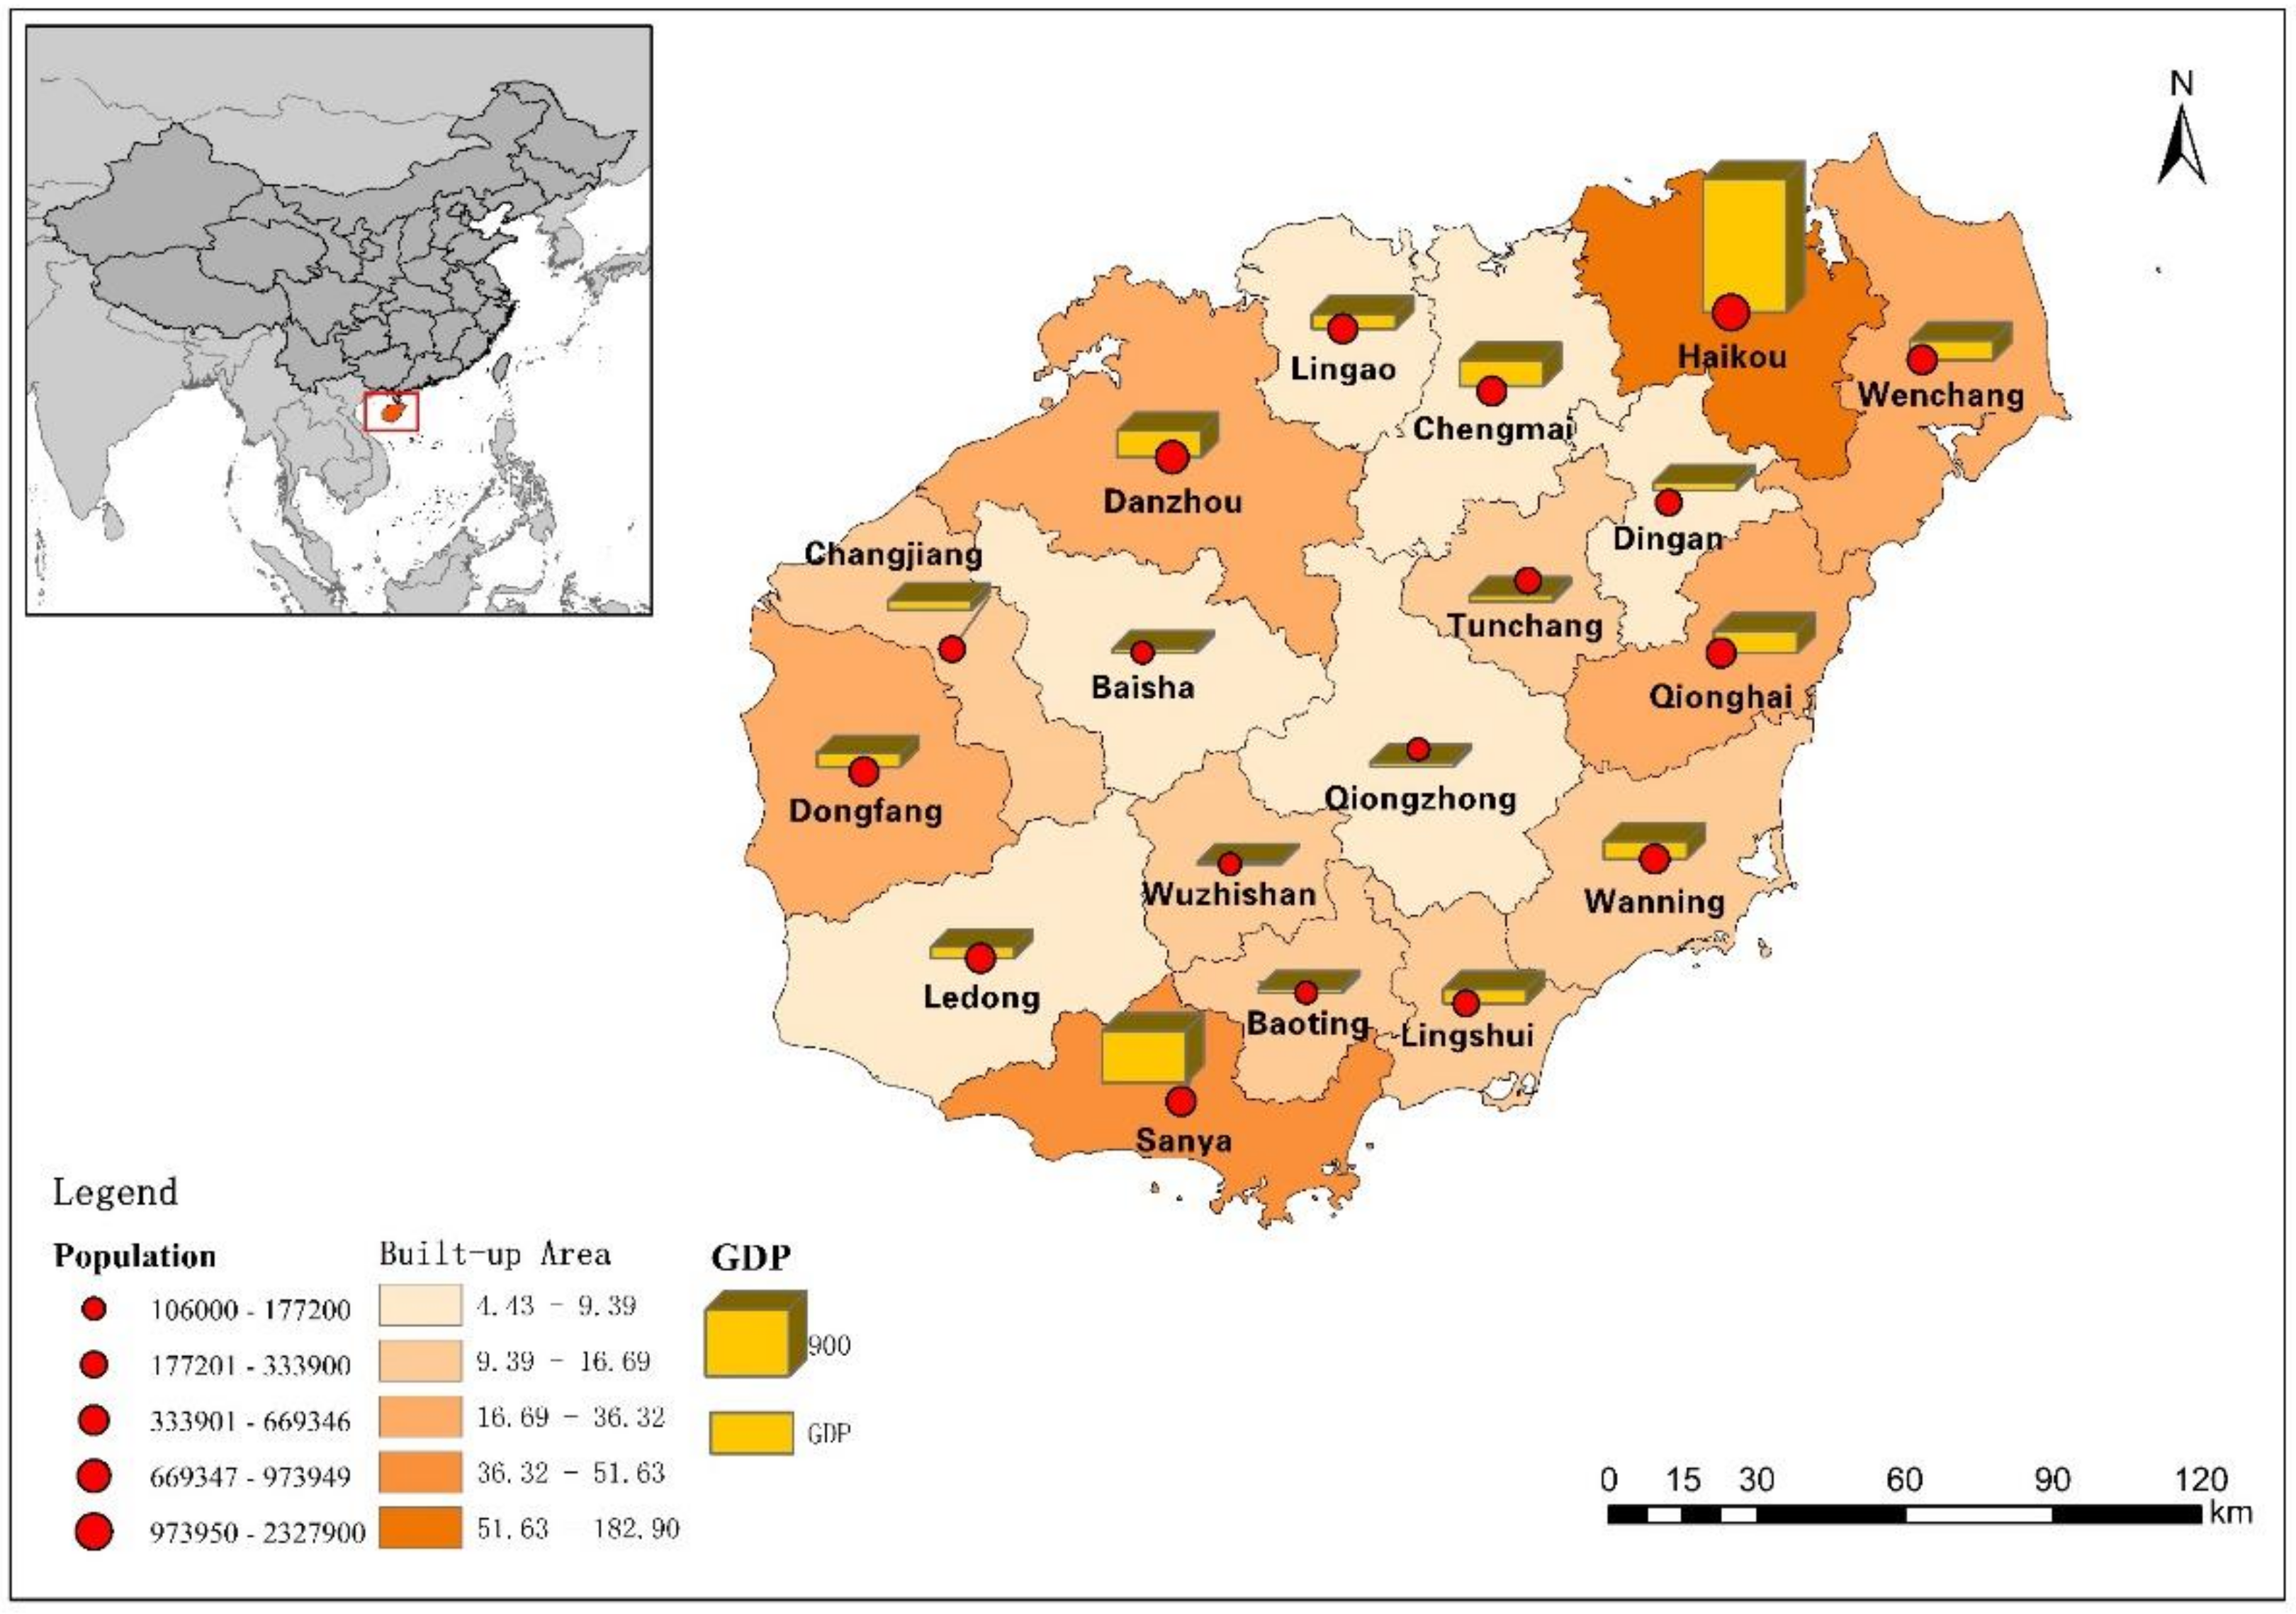
2.1. Study Area

Hainan Province is located in the southernmost part of China, in a Special Economic Zone and Pilot Free Trade Zone. This research area includes three prefecture-level cities, five county-level cities, four counties, and six ethnic minority autonomous counties in Hainan Province, but excludes Sansha City, for a total of 18 cities and counties (Figure 1).

2.2. Obtaining Data on SDG11 in Hainan

SDG11, “Sustainable Cities and Communities”, includes 10 specific targets and 15 indicators according to the United Nations Statistical Commission in the 2030 Agenda for Sustainable Development. The technical targets are related to housing, transportation, land use efficiency, heritage protection, urban disasters, and public open space [3]. Considering the actual situation of Hainan Province, however, the quantity of relevant data and the evaluation method cannot match these indicators completely. Therefore, it is necessary to adopt reliable, high-quality data applicable to the local situation of Hainan Province to localize the SDG11 indicators. This study mainly adopts statistics, Earth observation, and ground observation data, and the time scale is from 2010 to 2018 (Table 1).

3. Construction and Research Method of the Index System

3.1. Remote Sensing Data Preprocessing

In this study, the remote sensing data used were obtained from Google Earth Engine and the Atmospheric Composition Analysis Group [30,31]. From these sources, the urban built-up area was obtained based on the same definition of urban agglomeration area [33].
The standardized built-up area was converted from the impervious surface (ISA) data, which were obtained from the time series of Sentinel-1A/2 data in ascending/descending orbits [34]. First, the areas of urban patches were linked to form a continuous main urban area. After the small polygons and holes were removed, the built-up area was obtained through visual interpretation of the images on Google Earth Engine following the definition of the United Nations. For more details, please refer to the study by Jiang et al. [35].

3.2. Urban Sustainable Development Index System Based on SDG11

Given that SDGs are monitored based on country-level assessments, it is not possible to fully reflect the specific situation of different regions and local-scale administrative areas. Therefore, SDG indicators cannot be directly applied to a designated research area [36,37]. According to the regional characteristics of Hainan Province, the actual significance and use of each indicator of SDGs should be analyzed and improved to build a localized SDG indicator system [38]. Due to different administrative levels in the study area, some data cannot be used directly. Therefore, data need to be collated and processed to be applicable to all cities and counties and match SDG indicators. The data processing method is shown in Table 2.

3.3. Methods

In order to better identify the development degree of a single indicator of a city, a dashboard like a traffic light is introduced using green, yellow, orange, and red to give the scores of the indicators [41]. Its purpose is to highlight the need of each city to pay special attention to the indicators with poor performance, remind relevant departments to prioritize their optimization, and improvement measures for the indicators. The comprehensive assessment of urban sustainable development mainly includes three steps: (I) screen data extremes and obtain a single index score through normalization; (II) build a dashboard for each indicator with its trend; and (III) calculate the city’s comprehensive sustainable development score.

3.3.1. Single Indicator Score

Due to different city levels, some data are different in orders of magnitude. To ensure the comparability of these data, the largest or smallest outliers of each indicator are excluded. The maximum and minimum thresholds are obtained from the three largest and smallest data scores, respectively. After normalizing the data, each data score is 0–100, where 0 represents the lowest level of sustainable development, and 100 represents the best level of sustainable development.
The single index scoring method, namely normalization method is described below:
x = x x m i n x m a x x m i n × 100
where x is the original data, x m a x / x m i n represent the upper and lower bounds of the data, respectively, and x represents the normalized value after scaling the single index score.
If the larger indicator means low sustainability, the normalized Equation (2) is used to get the score:
x = 100 x x m i n x m a x x m i n × 100
where x is the original data, x m a x / x m i n represent the upper and lower bounds of the data, respectively, and x represents the normalized value after scaling the single index score.

3.3.2. Single Indicator Trend

In order to better show the long-term trend of a single indicator, we introduced the same method as used to derive the score of a single indicator to calculate the trend of a single indicator.
Specifically, we calculated the growth rate of each index. If the large index means high sustainability, then the growth rate formula (3) can be used to obtain the growth rate:
X G R = ( x x n ) 1 n 1 × 100 %
where X G R is the growth rate, x is the data value of this year, and x n is the data value of n years ago.
If the high index means low sustainability, then Equation (4) is used to obtain the growth rate:
X G R = ( x n x ) 1 n 1 × 100 %
If the denominator is 0 in the calculation of the trend index, the trend index value is determined in three cases: if the numerator is positive, the trend index value is 3; if the numerator is 0, the trend index value is 0; and if the numerator is negative the trend index is −1.
In consultation with experts, the indicators were divided into four levels, as shown in Table 3 [42,43].

3.3.3. Comprehensive Evaluation Method

The sustainable development level of a city cannot be shown by the evaluation of a single index, so it is necessary to construct a comprehensive urban score to evaluate the relative sustainable development level of a city. We averaged all the indicators for each city in each year with equal weights to get a comprehensive score for the city:
X = i n x i n
where n is the total number of indicators and x i is the score of a single indicator.

4. Results and Analysis

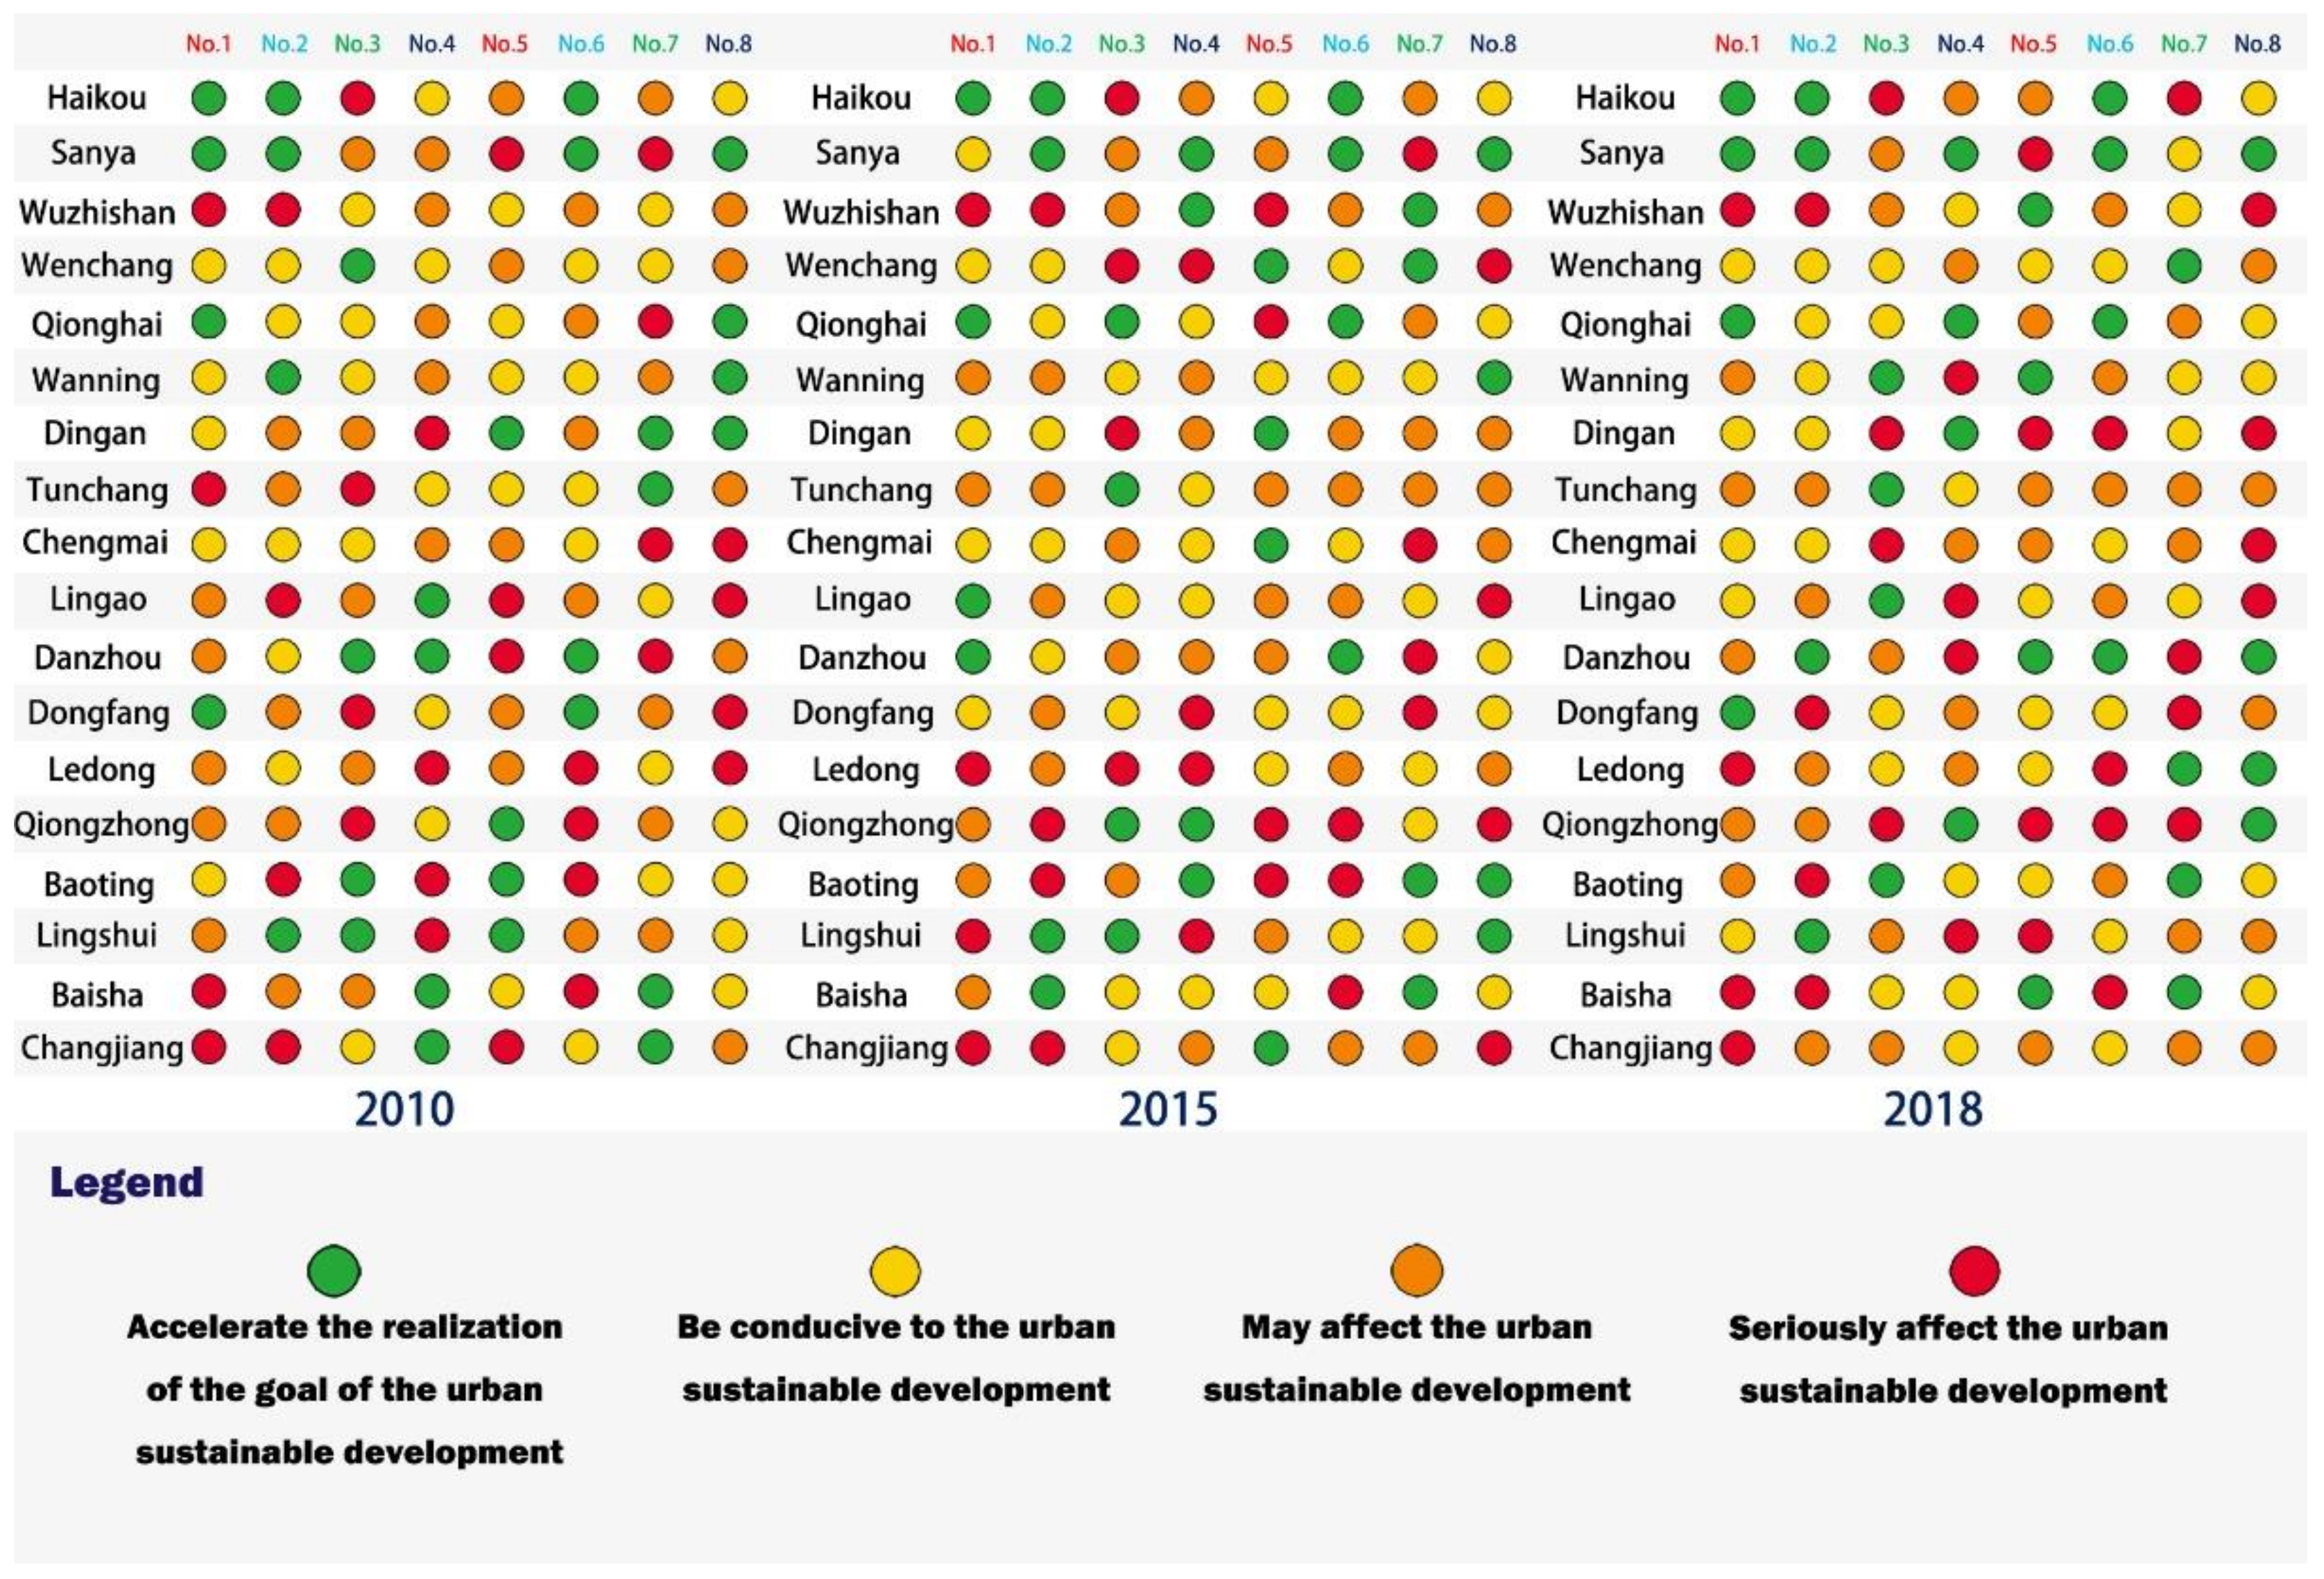
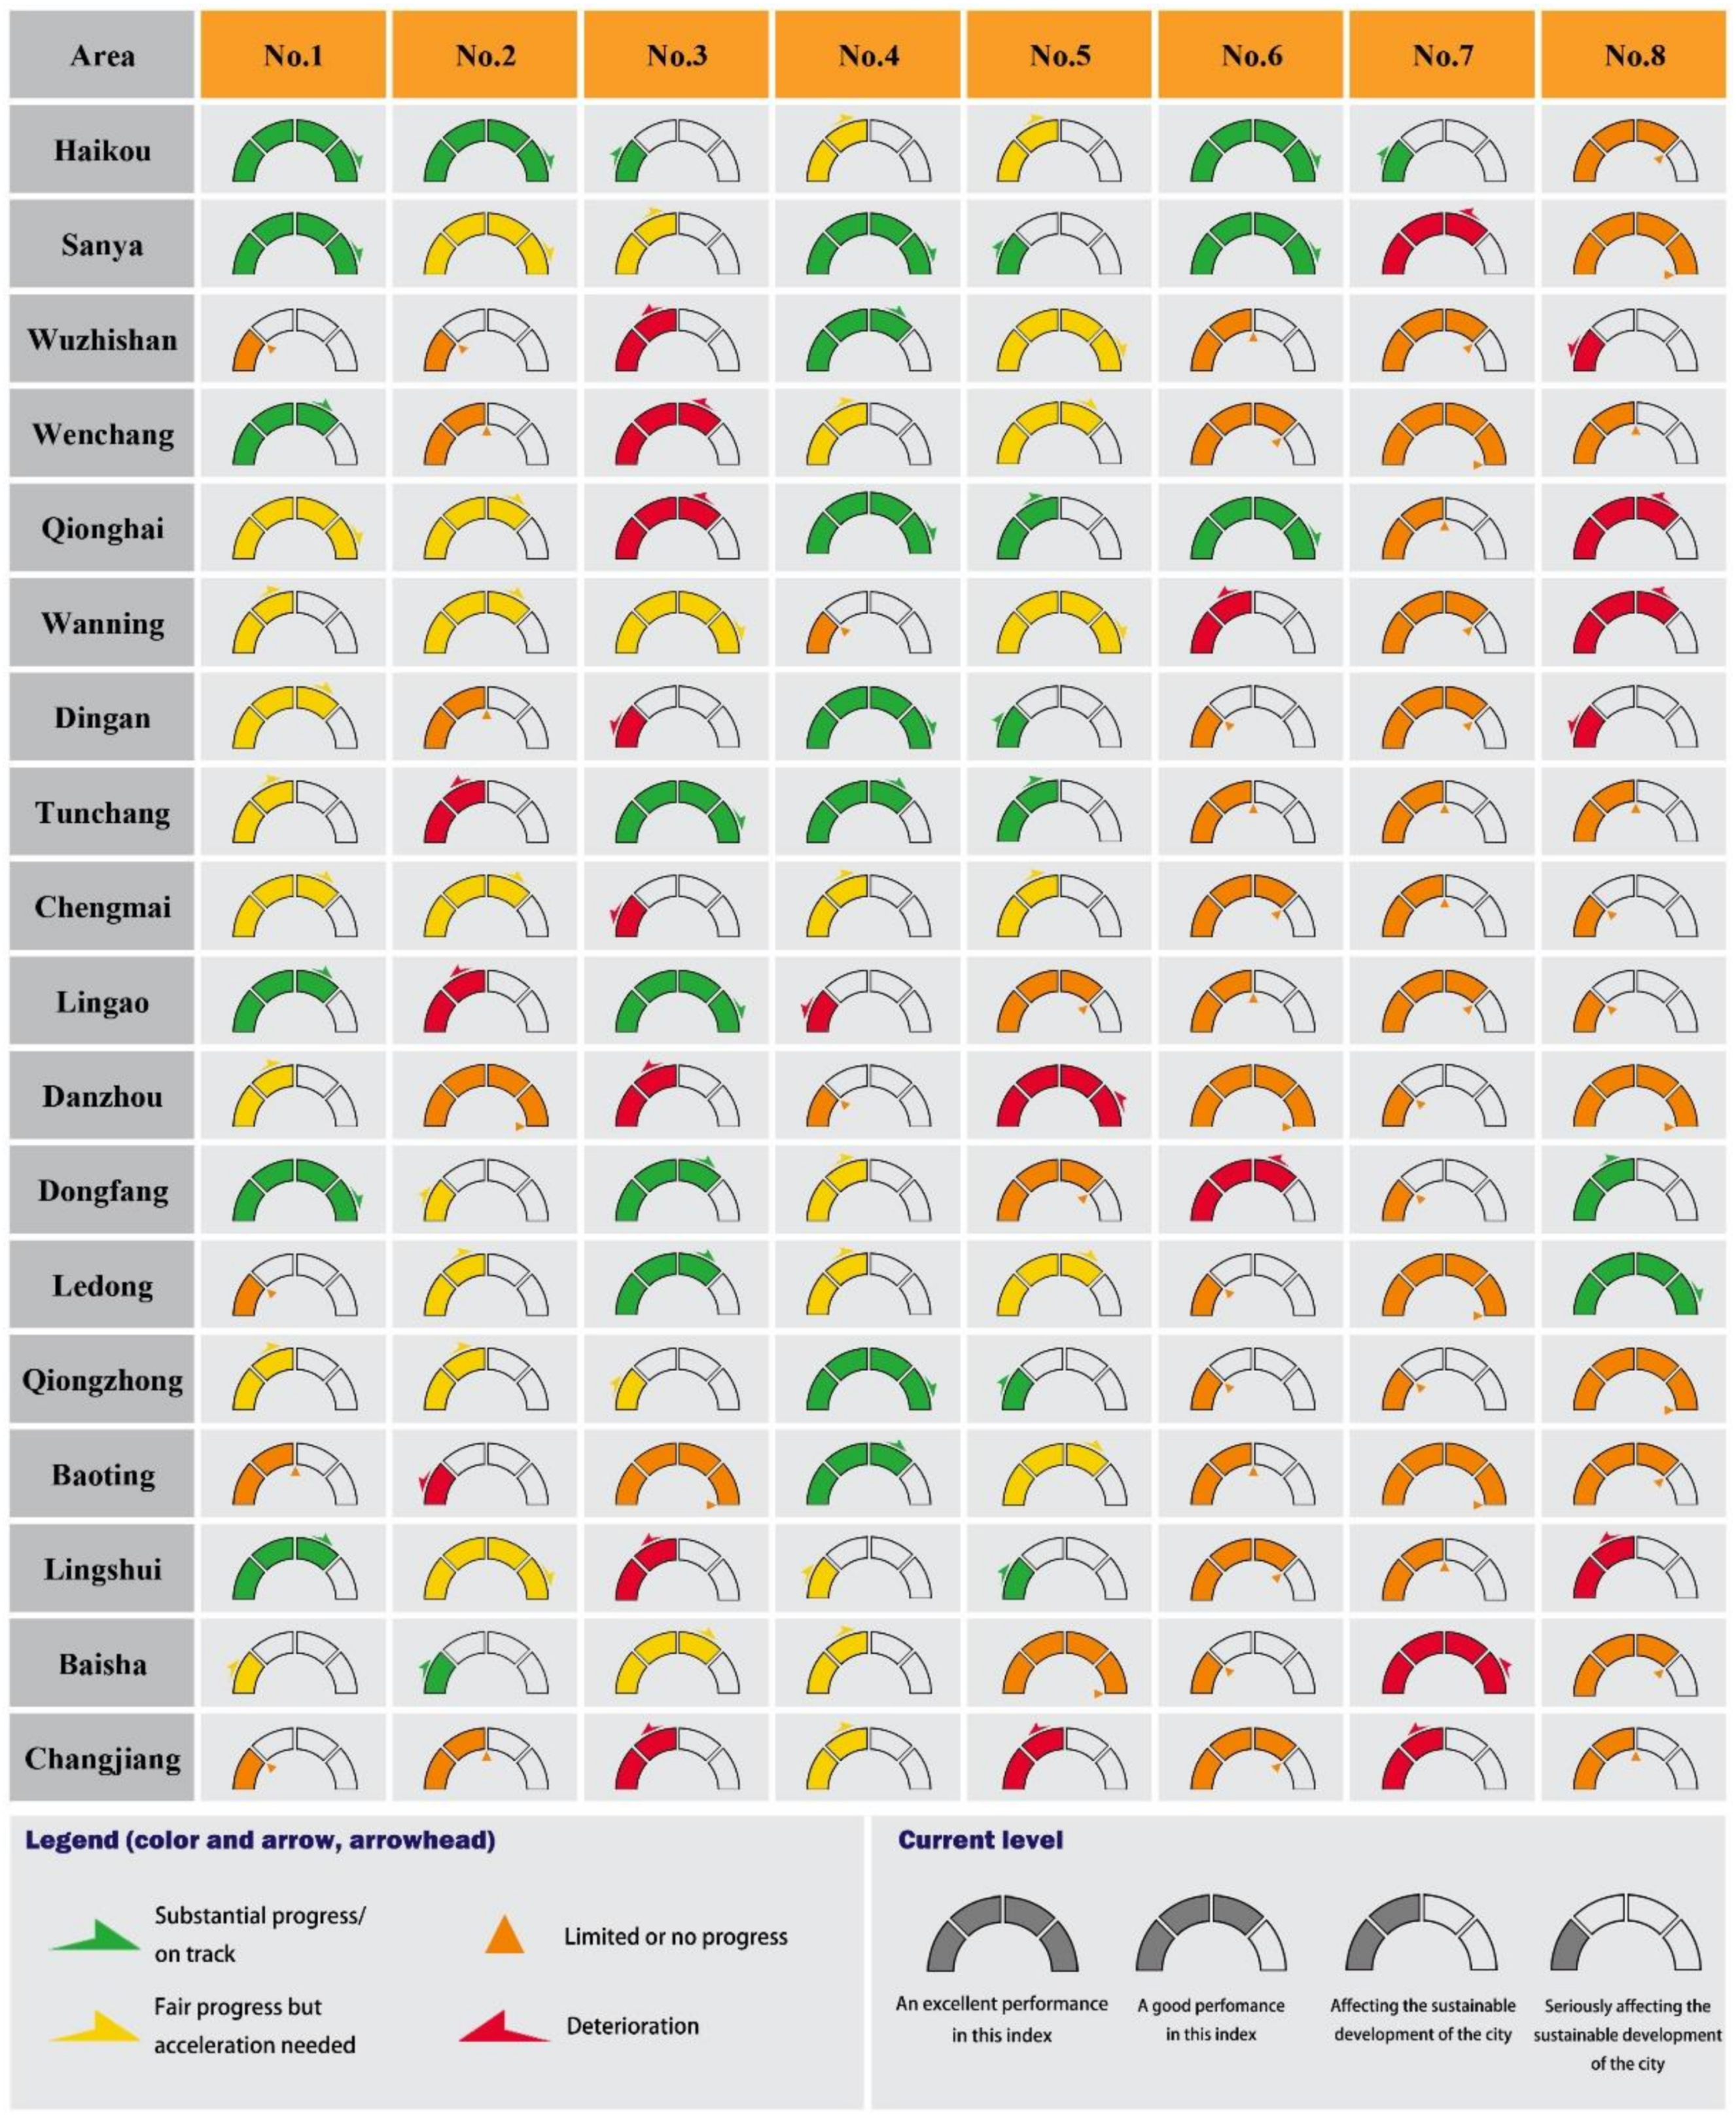
4.1. Single Index Ranking and Change Trend Analysis

Sanya had the largest number of “green indicators”, with household garbage and per capita green area scores leading those of most cities and counties every year. Haikou had a stable ranking in each index, with rates of subsistence allowance, passenger volume, and solid waste leading those of most cities and counties. Changjiang and Ledong counties had the highest number of “red indicators” in 2010, Qiongzhong County had the highest number in 2015, and Ding’an and Qiongzhong counties had the highest number in 2018 (Figure 2).
From the city-level perspective, the change trends of Hainan’s main indicators are mainly as follows (Figure 3). (1) Haikou and Sanya are in the middle stage of sustainable development. Rapid urbanization drives the development of various industries, such as transportation and industry. As pilot cities of national environment programs and tourism, Haikou and Sanya are still maintaining the development of environmental indicators while developing their economies. (2) The cities and counties, led by Lingao County, are in the early stage of sustainable development, and all the indicators show an upward trend except the environmental indicators. (3) Wanning City and Danzhou City are leading the cities and counties in the middle and early stages of sustainable development, and the development trend of each index fluctuates greatly. In general, after the 13th Five-Year Plan, the development trend of all indicators has improved, especially the environmental indicators, including air quality, per capita park green space area, and gas emissions, which are closer to the sustainable development goals.
From the index level, with the introduction and implementation of China’s “poverty alleviation” policies in 2013, all cities and counties showed a good trend in the proportion of people enjoying subsistence allowances from 2010 to 2018. From 2010 to 2018, the disaster risk of Hainan Province and its cities and counties showed an obvious trend of reduction, especially since the 13th Five-Year Plan. During the rapid urbanization process of most cities and counties in Hainan Province, environmental protection was ignored, and the air quality index and per capita green area index were on a stagnant trend. After the 13th Five-Year Plan of Hainan Province, Hainan adhered to green development principles and focused on building “national ecological civilization demonstration zones”. Therefore, Hainan’s future air quality index and per capita green area index might be closer to the direction of sustainable development. The development of other indicators is relatively stable, showing a steady upward trend.

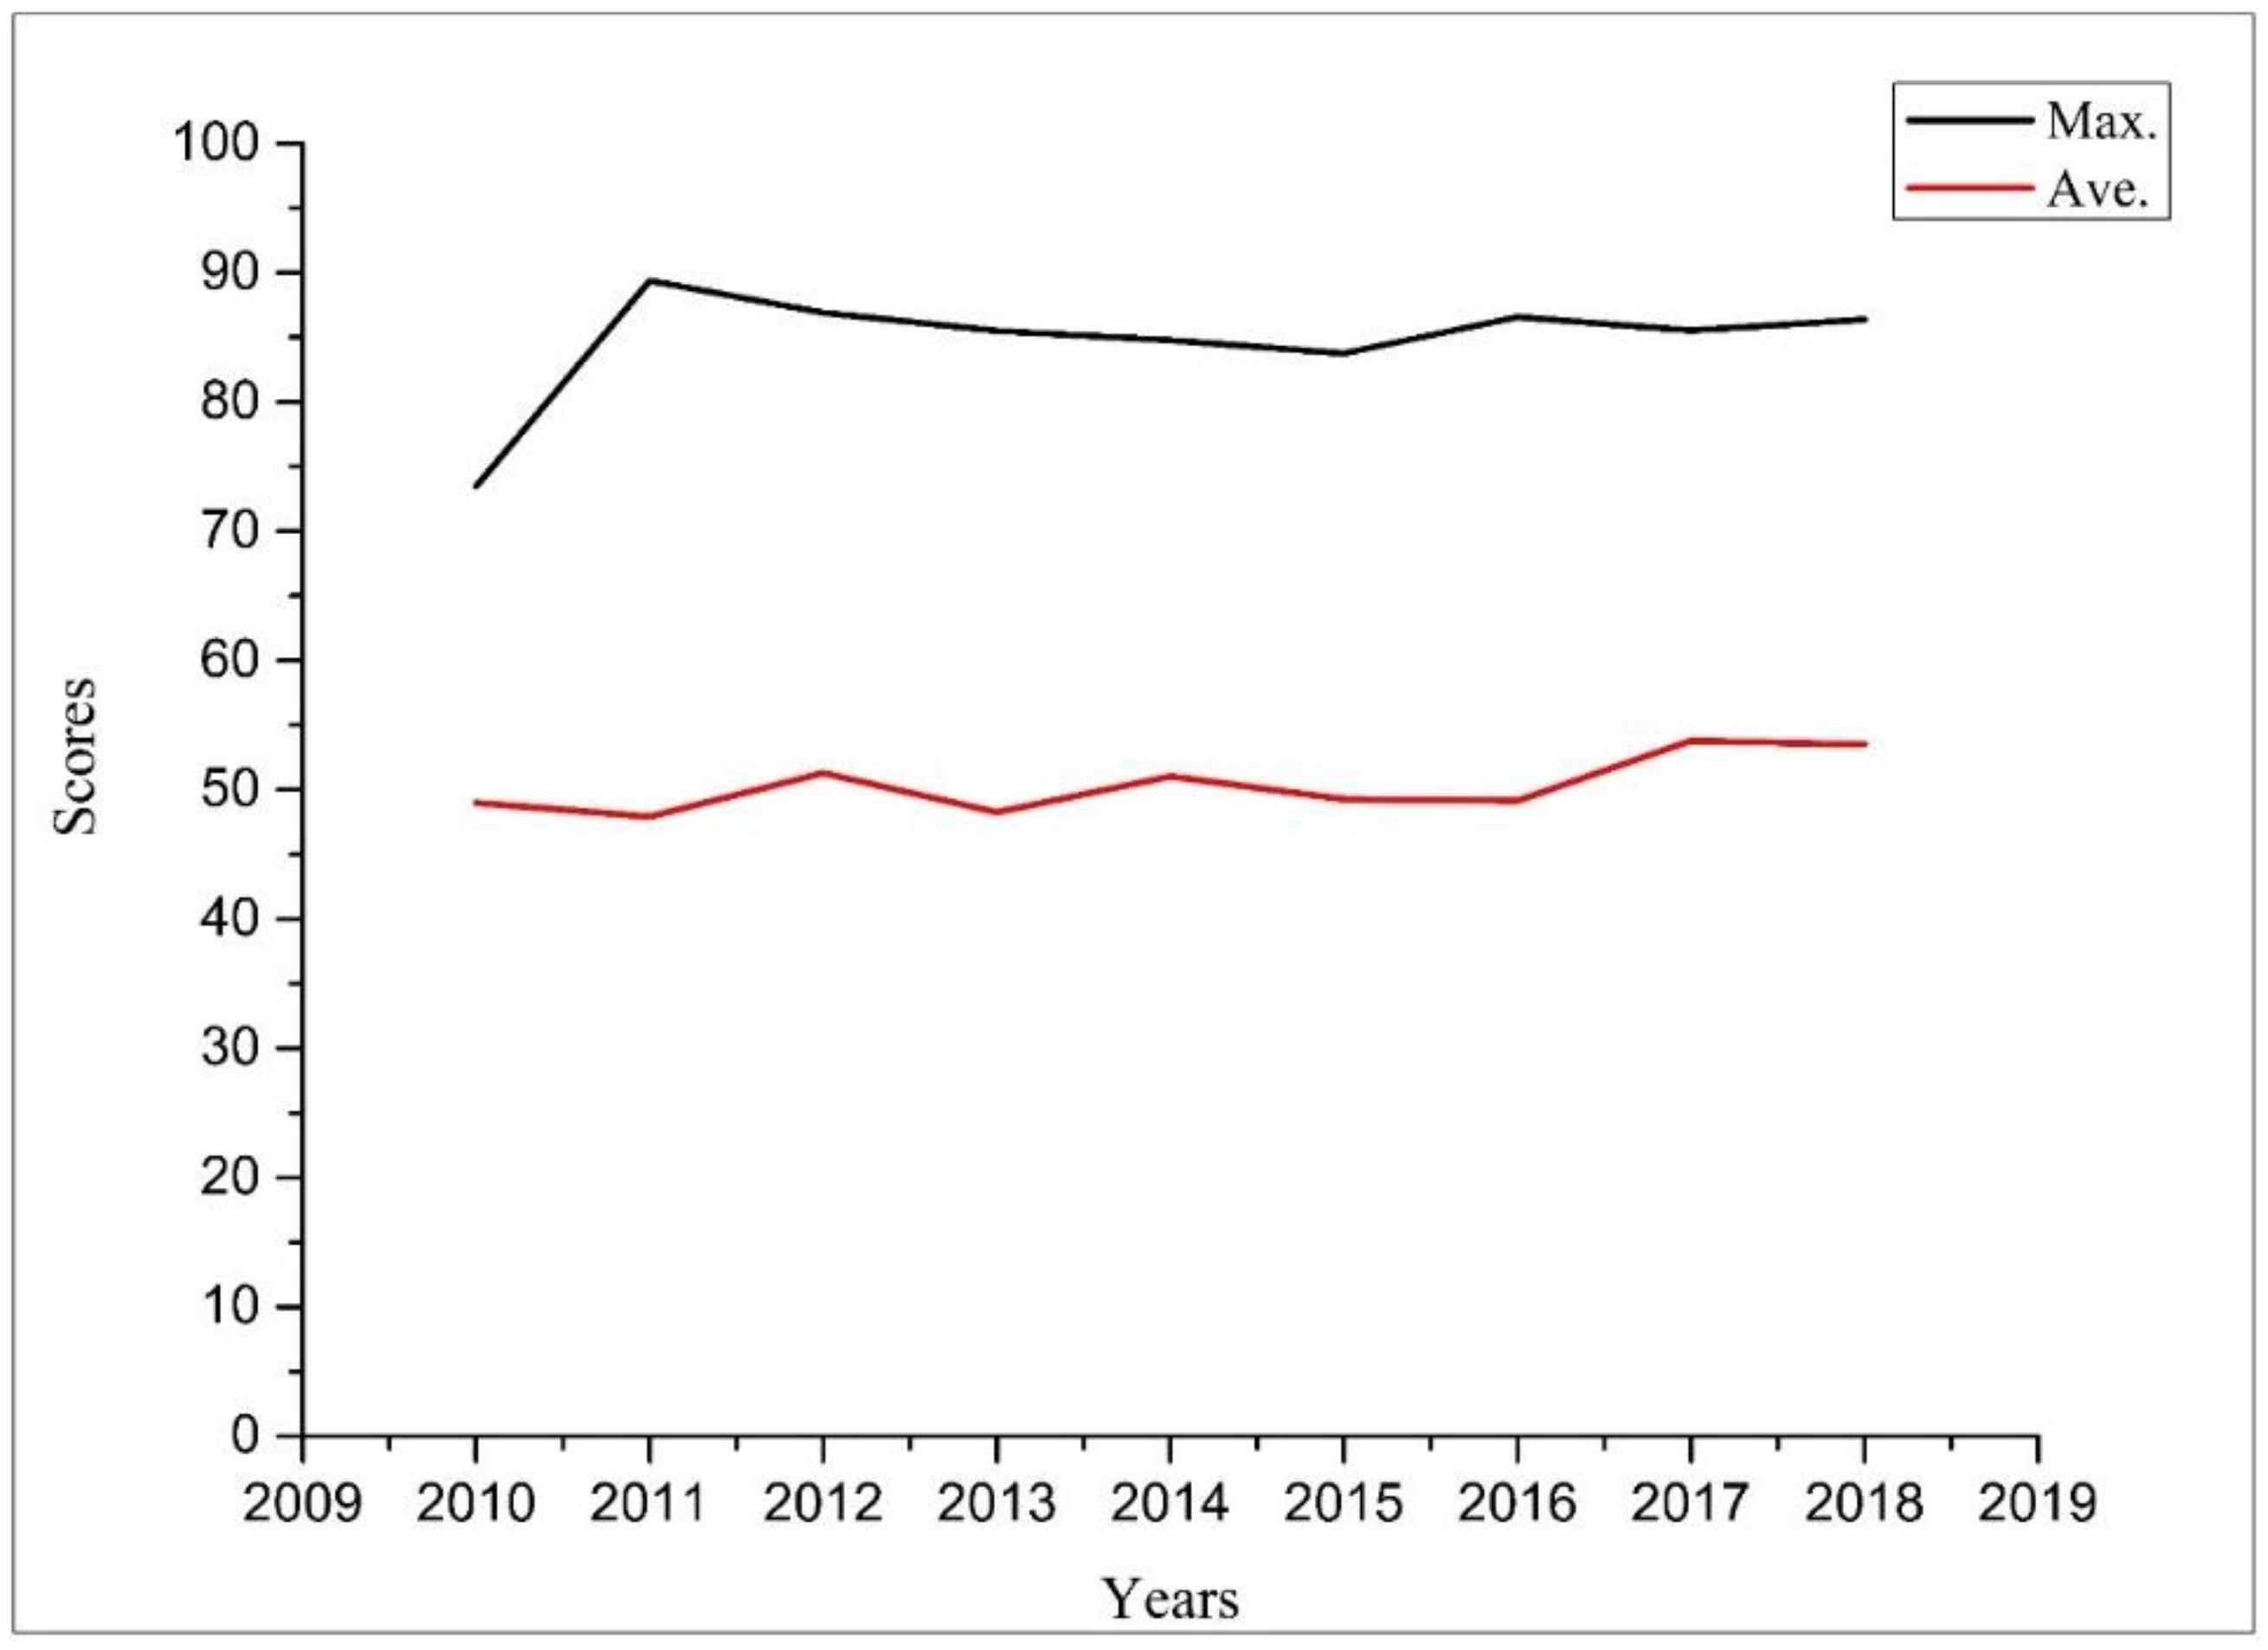
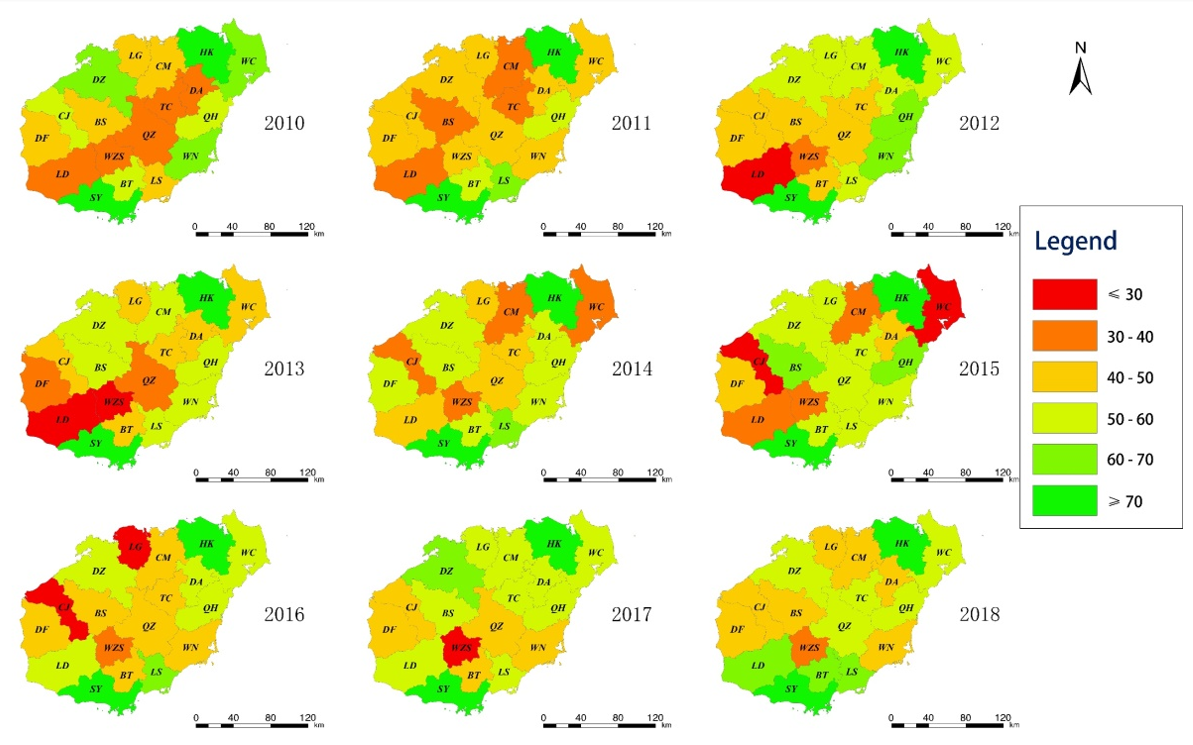
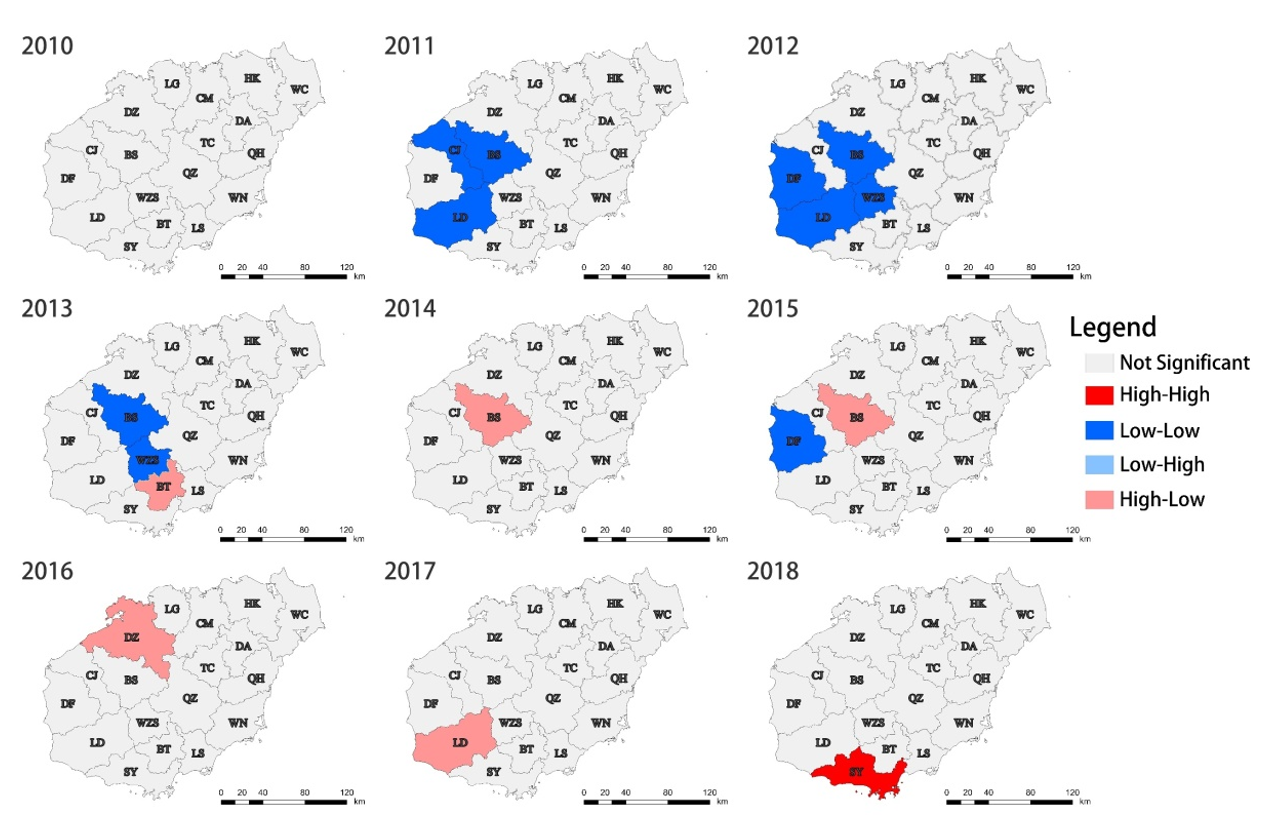
4.2. Analysis of Temporal Evolution and Spatial Patterns

The cities’ highest score increased from 72.72 points in 2010 to 81.34 points in 2018. The average score for cities rose to 53.79 from 49.93 in 2010. From 2010 to 2015, the comprehensive index of sustainable development of 18 cities and counties in Hainan fluctuated unsteadily every year, and the comprehensive index of sustainable development increased rapidly after 2015 (Figure 4).
The top two cities in 2010, 2015, and 2018 were Haikou and Sanya, while other cities and counties had a large gap in their scores. The scores of other cities were basically around 60 (Figure 5). Due to the rapid urbanization of Changjiang County, Wenchang County, and Ledong County in 2015, they neglected the impact of public space and the environment, resulting in a low total score. Wuzhishan City was the city with the lowest score for sustainable development.
As shown in Figure 6, Hainan’s development was unevenly distributed, mainly high in the north and south while low in the central and western regions. Haikou, the administrative center of Hainan Province, and Sanya, an important tourist city in China, had the highest level of sustainable development, with annual comprehensive scores of more than 70 points. Ledong County and Wuzhishan City in the southwest performed poorly in the sustainable development indicators. After 2015, influenced by Sanya City, the sustainable development level of Ledong County rose rapidly to third place in the province in 2018. In Danzhou City, Dongfang City, Chengmai County and Changjiang County, the main heavy industry bases in Hainan Province, the overall sustainable development index performance was poor, although the urban sustainable development index performed well in some years. The central inland region had a low urbanization rate, poor urban modernization, and the lowest level of sustainable urban development. In 2018, the city with the best sustainable development level in the province was Sanya City (81.34 points), followed by Haikou City (73.60 points). In the same year, Wuzhishan City only scored 31.93 points, while other cities scored between 45 and 60 points.

4.3. Spatiotemporal Clustering Analysis

By the local spatial autocorrelation analysis of Moran’s I from 2010 to 2018 (Figure 7, Table 4), it was found that the overall Moran’s I of Hainan Province was low and the sustainable development efforts did not have a comprehensive effect. Most cities developed independently along their own lines, not directly benefiting neighboring cities. From 2011 to 2013, the urban agglomerations in Hainan Province, led by Ledong County, Baisha County, and Wuzhishan City, showed low–low clusters and high–low clusters, which indicated that these cities had a negative impact on the surrounding areas. High–high clusters appeared in Sanya City in 2018. The development of Sanya City drove the development of surrounding counties and cities, but an integrated development did not form. Obviously, the sustainable development of cities was influenced by the combined effects of nature, economics, and culture and was not determined by any single aspect.

5. Discussion

In contrast with previous studies, Ma et al. used four SDG11 indicators to obtain the conclusion that the level of sustainable urbanization in Jilin Province fluctuated and the development trend was increasing year by year [15]. We have also reached similar conclusions that the level of sustainable urbanization in Hainan Province has been increasing year by year, based on twelve SDG11 indicators. Research by Xu et al. found that cities in the Yangtze River Delta have not formed an integrated development model [14]. Similarly, our research found that cities and counties in Hainan Province have not formed an integrated development model yet, indicating that large cities in Hainan, such as Haikou and Sanya, have not prompted the development of surrounding cities. This is possibly due to the fact that the cities in Hainan basically focus on a single tourism economy structure originating from their own environment and cultural characteristics, and lack of high-tech industries [44]. It will be necessary to adjust the urban development model gradually to promote integrated development through cooperation between cities to improve sustainability [45,46].
Judging from our comprehensive assessment, the cities and counties of Hainan Province initially achieved sustainable development, but the degree of development of each city is different. High-scoring indicators should be maintained in the current development path and sustained; low-scoring indicators, such as disaster indicators, should be viewed as warnings. From 2010 to 2018, Ding’an’s per capita green area indicator scores were low and still in a downward trend. The government should introduce relevant policies to increase the per capita green area. The air quality indicators of Hainan Province are in a good and stable state. The municipal and county governments in Hainan should continue to adhere to green development and maintain this state.
Similar studies mainly focused on a larger spatial scale (for example at city level) and most of them used statistical data [11,12,15,16]. Our method can be applied at finer county-level scale due to the introduction of earth observation data, and provide a demonstration of evaluating sustainable development at the county level. Compared with the study of Ma et al., which used city-related indicators, our study focused on SDG11, which may have some limitations regarding indicator numbers [15]. Some spatial-related indicators still came from statistics. In the future, we will attempt to use more earth observation data instead of traditional statistics with more city-related indicators.

6. Conclusions

The conclusions of this paper are as follows. (1) From 2010 to 2015, the overall sustainable development score of all cities and counties in Hainan fluctuated greatly. After 2015, with the promotion of the 13th Five-Year Plan of Hainan Province, the overall sustainable development level of Hainan increased rapidly. (2) From 2010 to 2018, the level of sustainable development in Hainan Province had a spatial distribution pattern showing that development was high in the north and south, but low in the central and western regions. Haikou as the administrative center and Sanya as the tourism center had the highest levels of sustainable development. The overall sustainable development level of Wuzhishan City needs to be strengthened. (3) From 2010 to 2018, the Moran’s I index of Hainan Province has been low, indicating that the development of cities in Hainan Province has not significantly affescted the surrounding development.
Combining earth observation and statistical data is proposed to solve the problem of insufficient data for assessing the sustainable development status of cities/counties in Hainan Province, China. This evaluation system and method can also be used in other administrative regions with various scales.

Author Contributions

Conceptualization and methodology, Z.S., Q.X. and C.Z.; validation, J.S., Z.S. and Q.X.; investigation, T.X. and H.Y.; resources, data curation, and writing—original draft preparation, C.Z.; writing—review and editing, Q.X.; visualization, C.Z.; supervision and project administration, Z.S. All authors have read and agreed to the published version of the manuscript.

Funding

This research was funded by the Key R&D Program Projects in Hainan Province (grant number ZDYF2020192), National Natural Science Foundation of China (grant number 42171291), and the Strategic Priority Research Program of the Chinese Academy of Sciences (grant number XDA19030104/XDA19030121).

Data Availability Statement

The data used to support the findings of this study will be available from the corresponding authors upon request.

Acknowledgments

The authors would like to thank the anonymous reviewers and the editor for their constructive comments and suggestions for this paper.

Conflicts of Interest

The authors declare no conflict of interest.

References

  1. United Nations General Assembly. Transforming Our World; The 2030 Agenda for Sustainable Development; United Nations: New York, NY, USA, 2015; Available online: https://sustainabledevelopment.un.org/post2015/transformingourworld (accessed on 20 April 2020).
  2. Elmqvist, T.; Andersson, E.; Frantzeskaki, N.; McPhearson, T.; Olsson, P.; Gaffney, O.; Takeuchi, K.; Folke, C. Sustainability and Resilience for Transformation in the Urban Century. Nat. Sustain. 2019, 2, 267–273. [Google Scholar] [CrossRef]
  3. Acuto, M.; Parnell, S.; Seto, K.C. Building a Global Urban Science. Nat. Sustain. 2018, 1, 2–4. [Google Scholar] [CrossRef]
  4. UN-Habitat. A Guide to Assist National and Local Governments to Monitor and Report on SDG Goal 11+ Indicators, Online Edition. Available online: https://www.local2030.org/library/60/SDG-Goal-11-Monitoring-Framework-A-Guide-to-Assist-National-and-Local-Governments-to-Monitor-and-Report-on-SDG-Goal-11-indicators.Pdf (accessed on 10 January 2021).
  5. Habitat III. The New Urban Agenda. Available online: https://uploads.habitat3.org/hb3/NUA-English.Pdf (accessed on 17 June 2016).
  6. Messerli, P.; Murniningtyas, E. Global Sustainable Development Report 2019: The Future Is Now Science for Achieving Sustainable Development; United Nations: New York, NY, USA, 2019. [Google Scholar]
  7. Sachs, J.D.; Schmidt-Traub, G.; Mazzucato, M.; Messner, D.; Nakicenovic, N.; Rockström, J. Six Transformations to Achieve the Sustainable Development Goals. Nat. Sustain. 2019, 2, 805–814. [Google Scholar] [CrossRef]
  8. Ministry of Foreign Affairs of the People’s Republic of China. China’s Position Paper on Implementing the 2030 Agenda for Sustainable Development. Available online: https://www.fmprc.gov.cn/web/ziliao_674904/zt_674979/dnzt_674981/qtzt/2030kcxfzyc_686343/t1357699.Shtml (accessed on 10 January 2021).
  9. Ministry of Foreign Affairs of the People’s Republic of China. The National Plan to Implement the 2030 Agenda for Sustain-Able Development. Available online: https://www.fmprc.gov.cn/web/ziliao_674904/zt_674979/dnzt_674981/qtzt/2030kcxfzyc_686343/P020161012715836816237.Pdf (accessed on 10 January 2021).
  10. The State Council of the People’s Republic of China. The Plan for the Construction of Innovation Demonstration Zones for the Implementation of the 2030 Agenda. Available online: http://www.gov.cn/zhengce/content/2016-12/13/content_5147412.Htm (accessed on 10 January 2021).
  11. Lynch, A.; LoPresti, A.; Fox, C. The 2019 US Cities Sustainable Development Report. 2019. Available online: https://s3.amazonaws.com/sustainabledevelopment.report/2019/2019USCitiesReport.Pdf (accessed on 10 January 2021).
  12. Lafortune, G.; Zoeteman, K.; Fuller, G.; Mulder, R.; Dagevos, J.; Schmidt, G. The 2019 SDG Index and Dashboards Report for European Cities. 2019. Available online: https://s3.amazonaws.com/sustainabledevelopment.report/2019/2019USCitiesReport.Pdf (accessed on 10 January 2018).
  13. Xu, Z.; Chau, S.N.; Chen, X.; Zhang, J.; Li, Y.; Dietz, T.; Wang, J.; Winkler, J.A.; Fan, F.; Huang, B.; et al. Assessing Progress towards Sustainable Development over Space and Time. Nat. Cell Biol. 2020, 577, 74–78. [Google Scholar] [CrossRef]
  14. Xu, X.; Gao, J.; Zhang, Z.; Fu, J. An Assessment of Chinese Pathways to Implement the UN Sustainable Development Goal-11 (SDG-11)—A Case Study of the Yangtze River Delta Urban Agglomeration. Int. J. Environ. Res. Public Health 2019, 16, 2288. [Google Scholar] [CrossRef] [Green Version]
  15. Ma, Y.; Ai, X. Evaluation of Sustainable Urbanization Development in Jilin Province Based on the 2030 Sustainable Development Goals. Sci. Geogr. Sin. 2019, 39, 487–495. [Google Scholar] [CrossRef]
  16. Guo, H.; Chen, F.; Sun, Z.; Liu, J.; Liang, D. Big Earth Data: A Practice of Sustainability Science to Achieve the Sustainable Development Goals. Sci. Bull. 2021, 66, 1050–1053. [Google Scholar] [CrossRef]
  17. Guo, H. Big Earth Data in Support of the Sustainable Development Goals. 2019. Available online: https://www.fmprc.gov.cn/mfa_eng/topics_665678/2030kcxfzyc/P020200927650108183958.Pdf (accessed on 25 April 2021).
  18. Geng, W.; Chen, J.; Zhang, H.P.; Xu, K. Task and Progress of Iaeg-Sdgs: Wggi in Monitoring Sdgs through a ‘Geographic Location’ Lens. ISPRS Int. Arch. Photogramm. Remote Sens. Spat. Inf. Sci. 2018, XLII-3, 385–390. [Google Scholar] [CrossRef] [Green Version]
  19. Anderson, K.; Ryan, B.; Sonntag, W.; Kavvada, A.; Friedl, L. Earth observation in service of the 2030 Agenda for Sustainable Development. Geo-Spat. Inf. Sci. 2017, 20, 77–96. [Google Scholar] [CrossRef]
  20. Chen, J.; Peng, S.; Zhao, X.; Ge, Y.; Li, Z. Measuring regional progress towards SDGs by combining geospatial and statistical information. Acta Geod. Cartogr. Sin. 2019, 48, 473–479. [Google Scholar] [CrossRef]
  21. Xiao, W.; Mills, J.; Guidi, G.; Rodríguez-Gonzálvez, P.; Barsanti, S.G.; González-Aguilera, D. Geoinformatics for the Conservation and Promotion of Cultural Heritage in Support of the UN Sustainable Development Goals. ISPRS J. Photogramm. Remote Sens. 2018, 142, 389–406. [Google Scholar] [CrossRef]
  22. Kuffer, M.; Wang, J.; Nagenborg, M.; Pfeffer, K.; Kohli, D.; Sliuzas, R.; Persello, C. The Scope of Earth-Observation to Improve the Consistency of the SDG Slum Indicator. ISPRS Int. J. Geo-Inf. 2018, 7, 428. [Google Scholar] [CrossRef] [Green Version]
  23. Giezen, M.; Balikci, S.; Arundel, R. Using Remote Sensing to Analyse Net Land-Use Change from Conflicting Sustainability Pol-Icies: The Case of Amsterdam. ISPRS Int. J. Geo-Inf. 2018, 7, 381. [Google Scholar] [CrossRef] [Green Version]
  24. HPBS (Hainan Provincial Bureau of Statistics). Hainan Statistical Yearbook 2019. Available online: https://www.hainan.gov.cn/ (accessed on 25 April 2021).
  25. Liang, Y. Correlations Between Health-Related Quality of Life and Interpersonal Trust: Comparisons between Two Generations of Chinese Rural-to-Urban Migrants. Soc. Indic. Res. 2014, 123, 677–700. [Google Scholar] [CrossRef]
  26. Shi, G.; Chen, Z.; Bi, C.; Wang, L.; Teng, J.; Li, Y.; Xu, S. A Comparative Study of Health Risk of Potentially Toxic Metals in Urban and Suburban Road Dust in the Most Populated City of China. Atmos. Environ. 2011, 45, 764–771. [Google Scholar] [CrossRef]
  27. The People’s Government of Hainan Province. Statistical Yearbook. Available online: https://www.hainan.gov.cn/hainan/zfsj/xsj.Shtml (accessed on 25 April 2021).
  28. United Nations Statistics Division. SDG Indicators Metadata Repository. Available online: https://unstats.un.org/sdgs/metadata/files/SDG-Indicator-metadata.zip (accessed on 10 April 2021).
  29. Hainan Provincial Bureau of Statistics. Statistical Data. Available online: http://stats.hainan.gov.cn/Tjj/ (accessed on 25 April 2021).
  30. Google Earth Engine. Dataset. Available online: https://developers.google.com/earth-engine/datasets/ (accessed on 21 December 2019).
  31. Atmospheric Composition Analysis Group. China Regional Estimates (V4.CH.03). Available online: http://fizz.phys.dal.ca/~atmos/martin/?Page_id=140 (accessed on 25 April 2021).
  32. Chen, J.; Gao, M.; Cheng, S.; Hou, W.; Song, M.; Liu, X.; Liu, Y.; Shan, Y. County-Level CO2 Emissions and Sequestration in China During 1997–2017. Sci. Data 2020, 7, 1–12. [Google Scholar] [CrossRef]
  33. UN. United Nations Population Division World Urbanization Prospects: The 2018 Revision. Available online: https://population.un.org/wup/ (accessed on 9 May 2020).
  34. Sun, Z.; Xu, R.; Du, W.; Wang, L.; Lu, D. High-Resolution Urban Land Mapping in China from Sentinel 1A/2 Imagery Based on Google Earth Engine. Remote Sens. 2019, 11, 752. [Google Scholar] [CrossRef] [Green Version]
  35. Jiang, H.; Sun, Z.; Guo, H.; Xing, Q.; Du, W.; Cai, G. A Standardized Dataset of Built-up Areas of China’s Cities with Populations over 300,000 for the Period 1990–2015. Big Earth Data 2021, 1–24. [Google Scholar] [CrossRef]
  36. Rosenstock, T.S.; Lamanna, C.; Chesterman, S.; Hammond, J.; Kadiyala, S.; Luedeling, E.; Shepherd, K.; DeRenzi, B.; Van Wijk, M.T. When Less Is More: Innovations for Tracking Progress Toward Global Targets. Curr. Opin. Environ. Sustain. 2017, 26–27, 54–61. [Google Scholar] [CrossRef]
  37. Allen, C.; Nejdawi, R.; El-Baba, J.; Hamati, K.; Metternicht, G.; Wiedmann, T. Indicator-Based Assessments of Progress towards the Sustainable Development Goals (SDGs): A Case Study from the Arab Region. Sustain. Sci. 2017, 12, 975–989. [Google Scholar] [CrossRef]
  38. Chen, J.; Gao, M.; Ma, K.; Song, M. Different Effects of Technological Progress on China’s Carbon Emissions Based on Sustainable Development. Bus. Strat. Environ. 2020, 29, 481–492. [Google Scholar] [CrossRef]
  39. United Nations Statistics Division. The Complete Set of Metadata for Indicators. Available online: https://unstats.un.org/sdgs/metadata/files/SDG-Indicator-metadata.Zip (accessed on 10 June 2021).
  40. Jiang, H.; Sun, Z.; Guo, H.; Weng, Q.; Du, W.; Xing, Q.; Cai, G. An Assessment of Urbanization Sustainability in China Between 1990 and 2015 Using Land Use Efficiency Indicators. NPJ Urban Sustain. 2021, 1, 1–13. [Google Scholar] [CrossRef]
  41. Sachs, J.; Schmidt-Traub, G.; Kroll, C.; Lafortune, G.; Fuller, G. Sustainable Development Report 2019; Bertelsmann Stiftung and Sustainable Development Solutions Network: New York, NY, USA, 2019; Available online: https://s3.amazonaws.com/sustainabledevelopment.report/2019/2019_sustainable_development_report.pdf (accessed on 10 June 2021).
  42. United Nations Statistics Division. Sustainable Development Goals Progress Chart 2021. Available online: https://unstats.un.org/sdgs/report/2021/progress-Chart-2021.Pdf (accessed on 10 June 2021).
  43. United Nations Statistics Division. Sustainable Development Goals Progress Chart 2020. Available online: https://unstats.un.org/sdgs/report/2020/progress-Chart-2020.Pdf (accessed on 10 June 2021).
  44. Dong, H.; Li, P.; Feng, Z.; Yang, Y.; You, Z.; Li, Q. Natural capital utilization on an international tourism island based on a three-dimensional ecological footprint model: A case study of Hainan Province, China. Ecol. Indic. 2019, 104, 479–488. [Google Scholar] [CrossRef]
  45. Yang, T.; Jin, Y.; Yan, L.; Pei, P. Aspirations and Realities of Polycentric Development: Insights from Multi-Source Data into the Emerging Urban Form of Shanghai. Environ. Plan. B Urban Anal. City Sci. 2019, 46, 1264–1280. [Google Scholar] [CrossRef]
  46. Haughton, G. Developing Sustainable Urban Development Models. Cities 1997, 14, 189–195. [Google Scholar] [CrossRef]
Figure 1. A map showing the study area of Hainan. Note: the data in the figure comes from the People’s Government of Hainan Province [27].
Sustainability 13 11092 g001
Figure 2. Single index score dashboard of cities in Hainan in 2010, 2015, and 2018. The indexes corresponding to the horizontal axis are No. 1: The proportion of people enjoying the minimum living security, No. 2: annual passenger capacity, No. 3: land utilization rate, No. 4: population disaster rate, No. 5: ratio of direct economic losses to GDP, No. 6: domestic garbage removal volume, No. 7: air quality index, No. 8: park green area per capita.
Sustainability 13 11092 g002
Figure 3. Single index progress chart of cities in Hainan in 2018. The indexes corresponding to the horizontal axis are: No. 1: the proportion of people enjoying the minimum living security; No. 2: annual passenger traffic; No. 3: land utilization; No. 4: population disaster rate; No. 5: direct economy loss as a percentage of GDP; No.6: domestic waste removal and transportation; No.7: air quality (PM2.5, CO2, SO2, NO2); No.8: per capita park green area.
Sustainability 13 11092 g003
Figure 4. Comprehensive scoring showing the development trend of 18 cities in Hainan Province.
Sustainability 13 11092 g004
Figure 5. Score chart for cities in Hainan in 2010, 2015, and 2018.
Sustainability 13 11092 g005
Figure 6. Spatial distribution of sustainability in 18 cities and counties in Hainan Province. HK: Haikou City, SY: Sanya City, DZ: Danzhou City, WZS: Wuzhishan City, QH: Qionghai City, WCS: Wenchang City, WN: Wanning City, DF: Dongfang City, DA: Ding’an County, TC: Tunchang County, CM: Chengmai County, LG: Lingao County, BS: Baisha Li Autonomous County, CJ: Changjiang Li Autonomous County, LD: Ledong Li Autonomous County, LS: Lingshui Li Autonomous County, BT: Baoting Li and Miao Autonomous County, QZ: Qiongzhong Li and Miao Autonomous County.
Sustainability 13 11092 g006
Figure 7. Hotspot areas of urban sustainability in Hainan Province. HK: Haikou City, SY: Sanya City, DZ: Danzhou City, WZS: Wuzhishan City, QH: Qionghai City, WCS: Wenchang City, WN: Wanning City, DF: Dongfang City, DA: Ding’an County, TC: Tunchang County, CM: Chengmai County, LG: Lingao County, BS: Baisha Li Autonomous County, CJ: Changjiang Li Autonomous County, LD: Ledong Li Autonomous County, LS: Lingshui Li Autonomous County, BT: Baoting Li and Miao Autonomous County, QZ: Qiongzhong Li and Miao Autonomous County.
Sustainability 13 11092 g007
Table 1. Data related to SDG11 used in the study.
Localized
Indicators [1,28]
DataTemporal IntervalData Sources
11.1.1—— (1) Rate of subsistence allowances (−)Number of subsistence allowances2010–2018Statistical data [27]
11.2.1—— (2) Passenger volume (+)Passenger volume2010, 2015, 2020Statistical data [29]
11.3.1—— (3) Ratio of land consumption rate to population growth rate (−)Urban population and urban built-up area 2010, 2015, 2020Remote sensing data (Sentinel-1A/210m time series data, WorldPop Global Project Population Data 100 × 100 m) [30]
11.5.1—— (4) Fertility rate (−)Total population of the city and the number of victims2010–2018Statistical data [27]
11.5.1—— (5) Rate of dead and missing (−)Total population of the city and the number of dead and missing2010–2018Statistical data [27]
11.5.2—— (6) Direct economic loss in disasters to global GDP (−)GDP and direct economic loss in disasters2010–2018Statistical data [27]
11.6.1—— (7) Domestic garbage clearance volume (+)Domestic garbage clearance volume2010–2018Statistical data [27]
11.6.2—— (8) PM2.5 concentrations (−)PM2.5 remote sensing data2010–2018Remote sensing data (AOD Data 1° × 1°) [31]
11.6.2—— (9) CO2 emissions (−)CO2 emissions2010–2018Ground monitoring data [32]
11.6.2—— (10) NO2 concentration (−)NO2 concentration2010–2018Statistical data [27]
11.6.2—— (11) SO2 concentration (−)SO2 concentration2010–2018Statistical data [27]
11.7.1—— (12) Per capita park green area (+)Per capita park green area2010–2018Statistical data [27]
Note: + (−) means the higher (lower) the indicator, the better the level for sustainability.
Table 2. Construction and localization method of the SDG11 indicator system in Hainan.
SDG11 Indicators [1,28]Localized IndicatorsMethod
11.1.1 Proportion of urban population living in slums, informal settlements or inadequate housing(1) Rate of subsistence allowances X 1 = N u m b e r   o f   s u b s i s t e n c e   a l l o w a n c e s T o t a l   p o p u l a t i o n × 100 % [39]
11.2.1 Proportion of population that has convenient access to public transport, by sex, age, and persons with disabilities(2) Passenger volumeStatistics [27]
11.3.1 Ratio of land consumption rate to population growth rate(3) Ratio of land consumption rate to population growth rate X 3 = L C R P G R = ln U r b t + n / U r b t ln P o p t + n / P o p t × 100 % [39,40]
11.5.1 Number of deaths, missing persons and directly affected persons attributed to disasters per 100,000 population(4) Fertility rate X 4 = N u m b e r   o f   v i c t i m s T o t a l   p o p u l a t i o n × 100 % [39]
(5) Rate of dead and missing X 5 = N u m b e r   o f   d e a d   a n d   m i s s i n g T o t a l   p o p u l a t i o n × 100 % [39]
11.5.2 Direct economic loss in relation to global GDP, damage to critical infrastructure, and number of disruptions to basic services, attributed to disasters(6) Direct economic loss in disasters to global GDP X 6 = D i r e c t   e c o n o m i c   l o s s   i n   d i s a s t e r s G D P × 100 % [39]
11.6.1 Proportion of municipal solid waste collected and managed in controlled facilities out of total municipal waste generated by cities(7) Domestic garbage clearance volumeStatistics [27]
11.6.2 Annual mean levels of fine particulate matter (e.g., PM2.5 and PM10) in cities (population weighted)(8) PM2.5 remote sensing data
(9) CO2 emissions
(10) NO2 concentration
(11) SO2 concentration
Remote sensing data used to calculate the local average PM2.5 concentration [29]/statistics [27]
11.7.1 Average share of the built-up area of cities that is open space for public use for all, by sex, age, and persons with disabilities(12) Per capita park green areaStatistics [27]
LCRPGR represents the ratio of land use rate to population growth rate; U r b t represents the area of the built-up area in the past as the initial value; U r b represents the area after n years of urban expansion, as the final value; P o p t represents the number of the city’s population in the past as the initial value; P o p t + n represents the number after n years of urban population growth as the final value.
Table 3. Classification threshold for the trend of each indicator.
Substantial Progress/on TrackFair Progress but Acceleration NeededLimited or No ProgressDeterioration
11.1.1 x 0.2 0.1 x < 0.2 0 x < 0.1 x < 0
11.2.1 x 0.3 0.1 x < 0.3 0 x < 0.1 x < 0
11.3.1 x 0.2 0.05 x < 0.2 0.05 x < 0.05 x < 0.05
11.5.1 x 0.5 0.1 x < 0.5 0 x < 0.1 x < 0
11.5.2 x 1 0.5 x < 1 0 x < 0.5 x < 0
11.6.1 x 0.1 0.05 x < 1 0.05 x < 0.05 x < 0.05
11.6.2 x 0.01 0 x < 0.01 0.01 x < 0 x < 0.01
11.7.1 x 0.1 0.05 x < 0.1 0.05 x < 0.05 x < 0.05
Table 4. Global Moran’s I of the sustainable development level in Hainan.
Year201020112012201320142015201620172018
Moran’s I0.1480.1970.1780.081−0.004−0.0100.0950.038−0.056
Publisher’s Note: MDPI stays neutral with regard to jurisdictional claims in published maps and institutional affiliations.

