Article

Exploring Barriers for Circularity in the EU Furniture Industry

1
Research Centre, Wittenborg University of Applied Sciences, 7311 PE Apeldoorn, The Netherlands
2
College of Business and Economics, University of Johannesburg, Johannesburg 2000, South Africa
3
AIDIMME Technology Institute, 46980 Paterna, Valencia, Spain
4
Materially srl, 20126 Milano, Italy
*
Author to whom correspondence should be addressed.
Sustainability 2021, 13(19), 11072; https://doi.org/10.3390/su131911072
Submission received: 23 August 2021 / Revised: 23 September 2021 / Accepted: 2 October 2021 / Published: 7 October 2021
(This article belongs to the Section Sustainable Management)

Abstract

:
A circular economy is seen as a potential solution to the overburdening of Earth’s resources in our global economic system. However, implementation of circularity is still in its early stages, which is attributed to a variety of barriers that companies experience. Studies on these barriers identified a substantial number of potential barriers, however, these studies did not explore the variety of perceptions of these barriers by different companies. This study therefore explores the variety of barriers to the transition to circularity, as perceived by European furniture companies. Using Q-methodology, and with participation of 30 furniture companies from five EU countries, the study revealed four patterns of the perception of barriers. These four patterns of perception are distinct from each other, with high composite reliabilities and weak correlations between the patterns. Our analysis showed that especially the perception of market and resources categories of barriers make the difference between the identified patterns. The study demonstrated that barriers to circularity are not experienced in a single generalizable way, and provided valuable insight for the development of supporting or stimulation policies for circularity.

1. Introduction

The balance between economic growth and social wellbeing has been around as a political and managerial challenge for over 150 years [1]. However, the more contemporary concerns about sustainability may have been initiated by the book “The Limits to Growth” [2] in 1972. In the book, the authors concluded that if the world’s population and economy would continue to grow at their current speeds, our planet’s natural resources would approach depletion. Today, humanity uses the equivalent of 1.75 Earths to provide the resources it uses and the waste it produces [3], and the concerns about humanity’s ecological overshoot may have never been more imminent.
One of the factors causing the overburdening of Earth’s resources is our global economic system, which is based on a linear flow of materials and energy [4] leading to depletion of natural resources and large amounts of waste. A possible solution to the overburdening of Earth natural capacity is to replace this linear model by a circular one [5]: the circular economy (CE). Much of the current enthusiasm regarding the CE seems to be fueled by its alleged benefits for sustainable development [6,7,8]. Although CE lacks a consensual definition [9], some characterizing core elements are: extension of the life-cycles of products, minimization of the use of non-regenerative resources, and minimization of waste [10].
CE influences all parts of the value chain of products (design, extraction, production, use, disposal, regeneration) [5] and therefore requires inter-organizational cooperation and sustainability management systems [11]. Despite its alleged benefits, CE is also a contested concept [4,12]. One of the reasons for this is its slow adoption and implementation. While many business and political leaders have proclaimed their support for a CE [13,14], Kirchherr et al. [8] conclude that its implementation still appears to be in the early stages [15,16]. This limited progress in CE implementation is attributed to a variety of CE barriers [8] which are seen in several studies in recent years (Most notably: [17,18,19,20,21,22,23,24,25,26].
This “considerable amount of literature” [22] (p.158), on the barriers and challenges for CE that companies experience, identifies a large number of potential barriers. However, these studies also show that there is little consensus between companies on which factors help and which hinder the adoption of CE [27], with García-Quevedo et al. [28] concluding that “each firm tends to … perceive different barriers”. Until now, the published studies did not explore the variety of perceptions of these barriers by different companies. It is this gap in the literature that the study reported in this paper focuses on. By investigating and revealing different patterns of perception of barriers, the study aims to contribute to a greater understanding of the factors that limit the implementation of CE. The study thereby answers the appeal of De Jesus and Mendonça [29] that “the CE framework requires more empirical content” [29] (p.85).
As barriers to CE also differ across industries, the study focuses on a specific industry, the European (EU) furniture industry. The furniture industry is an industry that is characterized by value chains that are still relatively local or regional, with some exceptions. The furniture industry would therefore provide good opportunities to transition to CE. The research question of the study was formulated as Which patterns of barriers for the transition to circularity are experienced by European furniture companies?
The remainder of the article is organized as follows. In the next Section, the concepts of CE, and barriers for their adoption, are explored, based on the literature on this topic. The following Section will describe the research design of the study, which was based on Q-methodology. Section 4 will present the findings of our study, followed by a discussion of its implications in Section 5. Section 6 presents the conclusions of the study and discusses its limitations.

2. Literature Review

This paragraph discusses the main concepts and variables of the study. In Section 2.1 we will describe the concept of circular economy, and in Section 2.2 some specifics about CE in the European furniture industry. Section 2.3 will discuss earlier studies on barriers and challenges for the transition towards circularity in order to derive a framework of barriers for the study.

2.1. Circular Economy

The CE concept has attracted interest over the last decade as a solution direction for the sustainability challenges related to extraction of natural resources and the manufacturing, use and disposal of products [30,31]. The concept is rooted in the sphere of industrial ecology [32,33], where foundations for circularity have been central as a key aspect for the reduction of environmental impacts and resource optimization along the productive processes and, in general, the supply chain [15,34,35]. Since then, the CE concept has progressively moved towards centrality in the field of natural science, public policies, and businesses.
More recently, CE has attracted increasing interest as a public policy and business driver for envisioning the redesign of the economy [35], being promoted either by private advocacy organizations [36] or stimulated through public policies [37]. The CE literature shows an evolution since the mid-2010s with a predominance of the European context, as well as a turn addressed to micro level issues such as circular product design, business models, and supply chain [38]. In Europe, the CE concept has been established as an approach to simultaneously improve both environmental and economic performance, offering a response to what is commonly labelled as the ‘take-make-dispose’ or linear economic model [37] and even decoupling economic growth and environmental burden [15].
In the management field, CE has attracted recent attention due to its transformative impact for business models, remarking the potentiality of the concept for bringing innovation to organizations and creating value while adhering to CE principles [39]. Thus, up to six main patterns have been identified for the conceptualization and innovation of central business models elements such as the value proposition, the need for creating value ecosystems, and new forms of interaction with customers [40,41,42,43].
Due to this multi-faceted scope, it is difficult to find a commonly accepted definition of CE in the literature [44,45,46,47], having been described as an umbrella concept [48]. According to CE literature reviews [9,45], a prominent definition describes the concept as “an industrial system that is restorative or regenerative by intention and design. It replaces the ‘end-of-life’ concept with restoration, shifts towards the use of renewable energy, eliminates the use of toxic chemicals, which impair reuse, and aims for the elimination of waste through the superior design of materials, products, systems, and, within this, business models” [36] (p.7). However, approaches to CE cover a wide range of perspectives, including recycling, reduction of material use, design for circularity, waste management, or lifecycle assessment, to mention just some of them. Korhonen et al. [4] discuss the difficulties for attaining a universal definition that includes all CE aspects as well as its dynamic nature along time. Other authors claim a consensus in its definition [5,49]. Kirchherr et al. [9] conducted a review on the CE definition and found up to 114 definitions, attempting to synthesize CE in a comprehensive statement as “an economic system that is based on business models which replace the ‘end-of-life’ concept with reducing, alternatively reusing, recycling and recovering materials in production/distribution and consumption processes, thus operating at the micro level (products, companies, consumers), meso level (eco-industrial parks) and macro level (city, region, nation and beyond), with the aim to accomplish sustainable development, which implies creating environmental quality, economic prosperity and social equity, to the benefit of current and future generations” [9] (pp.224–225). More recently, Alhawari et al. [49] summarized the concept to its essence, where in sum CE is usually considered a set of practices for prolonging the lifecycle of products beyond their main use.
The enactment of CE still requires to be adequately systematized: preliminary measures for its implementation have been taken by only a limited number of countries [15,24,50], confirming the necessity of further investigating challenges, opportunities, and strengthening actions [24]. Recent researches focusing on environmental management investigate the key impacts of circular economy practices within different business areas that guide a sustainable management of businesses in an attempt to clear the main implications of CE to key business areas [51]. However, so far there are no studies that seem to have developed universal CE roadmaps for the furniture industry [52] that are eligible to become industry-recognized and provide shared guidelines, thereby effectively enabling the transition towards circularity taking into account the potential differences between involved businesses. As most actors in the sector are SMEs, supporting measures should also be adapted to the size and scale of these companies.

2.2. Circularity in the Furniture Industry

Predominantly consisting of SMEs, the EU furniture industry employs around 1 million European workers and manufactures approximately a quarter of the world’s furniture, representing a EUR 84 billion market equating to an EU28 consumption of ~10.5 million tons of furniture per annum [53,54]. Despite a notable degree of knowledge and awareness of CE principles, analyses conducted in the framework of luxury furniture show that the involvement of furniture companies in CE practices, in particular those concerning reuse and recycle actions, is still marginal, and very limited use of process and product certifications has been noted [55]. Furniture-specific system and product certifications as well as their impact and effective value for both furniture manufacturers and end-users require attentive study.
Circularity in the furniture industry is being addressed in recent literature. In particular, strategies for the transition towards CE furniture models and its relation to the sustainable development goals have been the focus. Thus, the main issues addressed are the strategic organization of the furniture supply chain, with particular interest in the potential of component standardization and design strategies as a way of closing the loop in the furniture business [24,56]. Beyond this business scope, other works focus on best practices at the industrial and institutional levels [57] and on potential policy instruments and interventions through regulatory packages [54].
As opposed to linear businesses, which seek to continuously sell new products by conceiving goods that have a relatively short lifespan, circular businesses aim to retain a product’s added value for as long as possible [58]. An adequate quality standard implies the possibility of furniture life cycle prolongation in the form of reuse, although the latter still fails to be prioritized over recycling, incineration, and landfill [54] and its environmental impact must be quantified precisely and adequately. In absence of dedicated evaluations, current sources only state that the environmental benefits associated with reuse are not always greater than those deriving from recycling benefits, even where these can be properly calculated, as whether the reused article results in the avoided purchase of a new manufactured article is critical [59]. In parallel to overall quality and requiring dedicated studies, as well, superior aesthetic value is indicated as a relevant feature contributing to product lifetime extension, therefore improving the efficiency of material and energy consumption [60].
While human health and safety are generically included among key requirements of the CE in general and for the furniture industry in particular [55], existing literature still lacks a consistent focus on human capital empowerment, especially considering the characteristics of SMEs, Europe’s socio-economic fabric’s backbone. Studies focusing on CE health-related activities indicate the enhancement of social equity and fair burden-sharing as a goal in the framework of social and human capital [37,61], but do not address the challenges faced by employees imposed by the transition from linear to circular business and manufacturing models.

2.3. Barriers for the Transition to Circularity

Despite the concerns about humanity’s impact on Earth and Earth’s resources, and the support for CE as expressed in business and political circles [8], the progress of transitioning to a CE is reported to be limited [18,19,29,62,63,64,65,66]. Several studies, for example [17,18,20,22,26,28,29,64,67,68,69], report barriers or challenges that businesses experience in their transition towards circularity. For example, Preston [18] identified the following: high up-front costs; complex international supply chains; resource-intensive infrastructure lock-in; failures in company cooperation; lack of consumer enthusiasm; and limited dissemination of innovation, across both emerging economies and developed countries. De Jesus and Mendonça [29] recognized these technical, market related, and economic barriers, and added ‘softer’ criteria, such as regulatory, social, and cultural barriers. Kazancoglu et al. [68] added that “governmental policies, regulations, and legislations play important role” in the transition towards CE. In one of the most recent studies, Ormazabal et al. [22] summarized the barriers found in earlier studies as: lack of financial support, inadequate information management systems, lack of proper technology, lack of technical resources, lack of financial resources, lack of consumer interest in the environment, lack of support from public institutions, lack of qualified professionals in environmental management, and lack of commitment on the part of the organizations’ leaders.
These earlier studies on barriers or challenges for circularity provide an identification of a large number of potential barriers. However, they did not investigate the variety of perceptions of these barriers, as the study reported in this paper aims to do. This study therefore makes a contribution by revealing different patterns of perceived barriers, next to the insights that the study will bring to the specific barriers for the furniture industry.
As basis for the exploration of different patterns of perception of barriers, the authors followed the example of Araujo Galvão et al. [69] by organizing the barriers identified in literature in categories that create more overview. The categorization followed that of Araujo Galvão et al. [69], with minor adjustments in order to capture the perspective of a company. The seven selected categories are:
  • Policy barriers and challenges (in Araujo Galvão et al. [69] labeled “Policy and Regulatory”): Barriers or challenges that result from the policies or behavior of public institutions, including regulatory barriers.
  • Market barriers and challenges (in Araujo Galvão et al. [69] labeled “Customer”): Barriers or challenges that result from customer behavior and market preferences.
  • Value chain barriers and challenges (in Araujo Galvão et al. [69] not addressed): Barriers or challenges that result from the drivers and dependencies for circularity in the supply chain or value chain
  • Technology barriers and challenges (in Araujo Galvão et al. [69] labeled “Technological”): Barriers and challenges of technological nature, including the availability of technologies for recovery of materials.
  • Resources barriers and challenges (in Araujo Galvão et al. [69] partly addressed as “Social”): Barriers or challenges related to the organization’s human resources and their competences.
  • Awareness barriers and challenges (in Araujo Galvão et al. [69] addressed as “Managerial”): Barriers or challenges resulting from the company’s leadership’s motivation for and stimulation of circularity.
  • Business case barriers and challenges (in Araujo Galvão et al. [69] partly addressed as “Financial/Economic”): Barriers or challenges resulting from the balance between costs and benefits of circularity.
Table 1 provides an overview of barriers found in literature, organized in the seven categories.
García-Quevedo et al. [28] concluded that “CE barriers, however, are largely subjective in nature” and that “each firm tends to … perceive different barriers” [28] (p.2453). It is for that reason that the seven categories of barriers derived from the literature acted in our study as a framework to interpret and characterize the various patterns of barriers that different companies experience.

3. Research Strategy

This paragraph presents the research strategy and research design of the study. As several studies (for example, [22,24,28]) pointed out that companies experience the barriers and challenges in various ways, the study was designed to capture this variety of different perceptions of the barriers. As methodology, the study deployed Q-methodology, which analyzes different patterns of behavior that may appear, instead of focusing on a single average behavioral pattern. Q-methodology provides a foundation for the systematic study of subjectivity [73], which fits the different subjective perceptions of barriers that the furniture companies may have.

3.1. Q-Methodology

Q-methodology has its roots in psychology and social science [74] and was developed to study people’s subjectivity. From the 1970s onwards it became more widely used in other disciplines, including business and management [75]. Q-methodology is fundamentally qualitative, although it bridges qualitative and quantitative research [76]. It is a qualitative methodology with strong quantitative features [77]. Q-methodology differs from R-methodology in that the latter asks participants to express views on isolated statements, whereas Q-methodology identifies participants’ views on statements in the context of the valuation of all statements presented [78,79]. Furthermore, as opposed to R-methodology, which aims to find the best fitting ‘average’ view within the population, Q-methodology intends to reveal different subjective perceptions within the population.
In Q-methodology, the participants are presented with a set of statements, called the Q-set, about the topic of the study [77]. The participants, called the P-set, are asked to rank-order the statements from their individual point of view, according to their preference, judgment or feeling about them, mostly using a quasi-normal distribution. Q-methodology does not claim to measure, but clarifies patterns of perceptions [80].
Steps in the Q-study are:
1.
Determining the viewpoints on the topic studied (Concours);
2.
Reducing the statements into a manageable set (Q-Set);
3.
Determining participants (P-Set);
4.
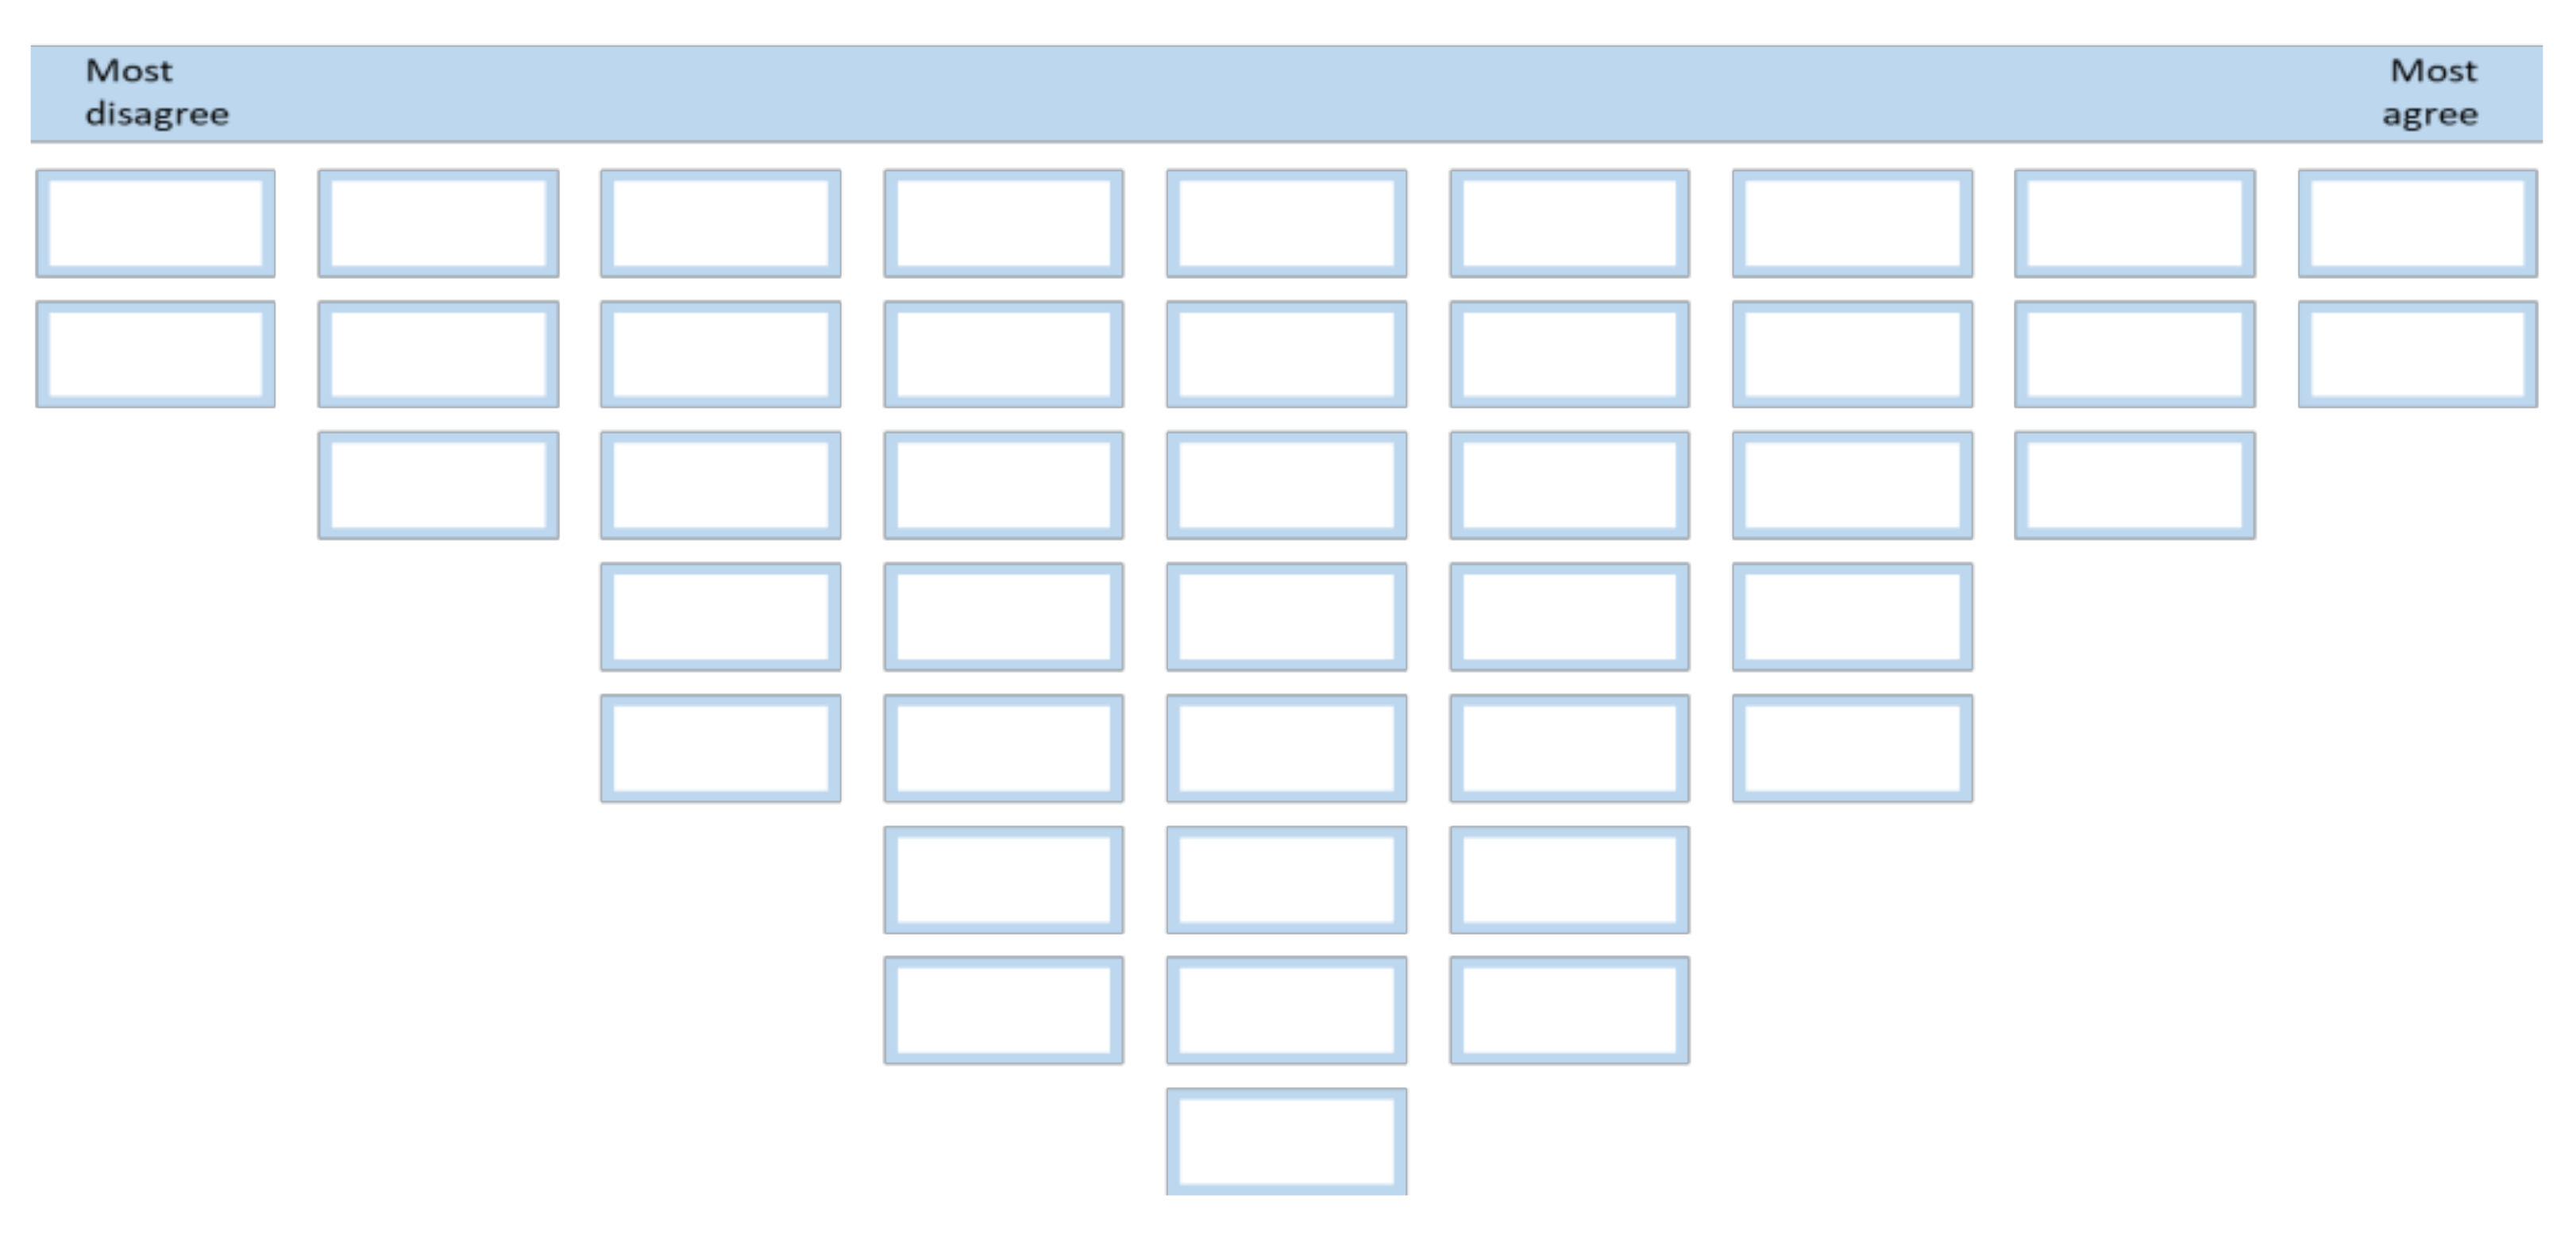
Sorting the set according to the degree of their agreement with the statements (Q-Sorting);
5.
Analysis and description of the factors found.

3.2. Concours

Concours aims to cover the universe of viewpoints of the subject. In the study reported in this paper, this was done based on a bibliographical search with the search strings (“barriers” OR “challenges”) AND (“circular economy” OR “circularity” OR “circular business”), using Google Scholar as search engine. This resulted in over 30,000 hits, which were reduced by limiting the search to the first 10 pages of search results. Based on the abstracts of the articles of the search results, we selected 19 articles that included the most relevant views on the barriers for circularity. From these articles we derived seven categories of barriers (policy, market, value chain, technology, resources, awareness, and business case), as described in Section 2.3 above. These views were then formulated in the form of statements. Some statements directly linked to earlier studies, whereas others were developed by the research team.
All statements were written in the same style and formulated as answers to the ‘umbrella question’: “Challenges or barriers for changing to circularity of our organization are…”. The formulation, content, and classification of the statements were reviewed by a group of experts on circular economy. Although this is no guarantee for absolute completeness or perfection, this was not considered problematic, as Donner [81] suggests that no set of statements is perfect or has to be perfect. Of real interest are “the tacit, underlying criteria and perceptions people use to consider an issue” [81] (p.27).

3.3. Q-Set

In Q-methodology there is no clear rule for the number of statements in the Q-set. Indications show quite a wide range, for example between 40 and 80 [77], 50 and 70 [82] and between 30 and 100 [83]. The aim is to select a representative but not necessarily exhausting set of statements so that the Q-set reflects all the important ideas, viewpoints, feelings, and opinions, but does not overwhelm the participant [82]. In line with this, the research team decided to aim for a Q-set of 42 statements, with an equal number of statements relating to each of the seven categories of barriers. Table 2 presents the final Q-set.
The statements were numbered randomly in order not to influence the participant with recognizable categories and connections between the statements.

3.4. Participants

Q-methodology aims to reveal (and to explicate) some of the main viewpoints that are favored by a particular group of participants [84], which does not require a large number of participants. Webler et al. [85] suggest a ratio of Q-statements to participants of 2:1. The participants were selected from the participants of the Erasmus+ “Innovation in the FURniture Industry in the era of circular economy” project, aimed at promoting circularity in the furniture industry. The participating companies were approached through professional and regional networks. As qualification criterion, the participating company representatives needed to have a basic understanding of the concept of circularity and good knowledge of the products and business processes of the furniture companies they represented. This resulted in a P-set of 30 participating furniture companies from five EU countries. Table 3 presents the profiles of these companies.
The locations of the participating companies represent the partners in the research project and provide a good representation of EU countries. A large majority (87.7%) of participating companies are more than five years old and therefore beyond their initial startup phase. The size of the companies is diverse, ranging from micro-enterprises to midsize companies.
Approximately 83.3% of the participating companies are active in the Business-to-Business market, and 63.3% in the Business-to-Consumer market. Almost half of the participants (46.7%) are active in both markets. Next to these markets, 30% of the participants also serve public organizations.
With regards to the materials the participating companies use in their products, wood is most used (93.3%) which provides good opportunities for circularity. Metal (50%) and glass (43.3%) were also used by a substantial number of participants, followed by plastics (30%) and fabrics (23.3%). The activities of the participating companies focused on design (86.7%), followed by production of products and parts (83.3%) and assembly (73.3%). Production of raw materials was mostly outsourced (83.3%), which is a noteworthy observation with regards to the implementation of circularity. The supply chains of the participants were predominantly local or elsewhere in Europe (80%), as was expected for the furniture industry. Almost half of the participants were already engaging in some kind of circularity initiative.

3.5. Q-Sorting

The statements were printed on individual cards [86], that the participants were asked to rank-order from “Most disagree” to “Most agree” on a Q-sort diagram (Figure 1). The study used a symmetrical diagram, as is usually preferred in Q-methodology. Following Stainton Rogers [87] a 9-point ordinal scale was employed.
Data collection was done in individual face-to-face interviews (24 participants) and online (6 participants). The duration of the interviews was between one hour and one and a half hours each. The introduction and explanation of the study took about 15 min per interview. Following Webler et al. [85], the participants were encouraged to first read through all of the statements, then to sort them into three piles of indeterminate size: a ‘most agree’ pile, a ‘sort of agree’ pile, and a ‘less agree’ pile. Next, they were suggested to take the ‘most agree’ pile and sort these cards on the Q-sort diagram, followed by the same routine for the ‘less agree’ pile and finally the ‘sort of agree’ pile. Participants were encouraged to ‘think out loud’ while performing the sort. These comments provided contextual information for interpreting the results of the study.
When the participant was satisfied with his/her sort, the resulting Q-sort was recorded by the researchers. The Q-sorts were processed anonymously, although no participant found this necessary. The participants were then interviewed, with three questions: (1) Do you experience a challenge or barrier to circularity that was not mentioned on the cards? (2) At the highly ranked statements: Why did you rank these challenges high? (3) At the low ranked statements: Why did you rank these challenges low? This information was used for the interpretation of the different patterns that would emerge in the analysis.

3.6. Analysis

The individual Q-sorts of the participants were analyzed in order to reveal a limited number of factors (patterns of barriers) in which the statements were sorted by the participants. The completed Q-sorts were recorded on photo and their data entered into PQ Method version 2.35 [88]. Factor analysis was done using the centroid method, as it is the most commonly used method in Q-studies [89]. The following Section presents the results of the analysis.

4. Findings

This Section presents the findings of the study. First, the factor analysis of the Q-sorts will be presented, followed by the analysis and discussion of the different patterns that appeared from the study. Section 4.4 and Section 4.5 will discuss some further observations from the findings of the study.

4.1. Factor Analysis

As a first step in the analysis, a principal components factor analysis was performed in which the eigenvalues of the data set were calculated. The automatic flagging function of PQ Method was used to flag participants to one of the factors for a varimax rotation to maximize the loading of each factor. This factor analysis was run several times, with three, four, and five factors. In each analysis, we checked for the eigenvalues of the factors, explained variance, the number of significant persons loading, the numbers of persons not loading on any factor, the number of persons confounded across more than one factor, and the correlation between factors. Based on these considerations, we decided to complete the analysis with four factors. Although there are no formal rules for determining the number of factors in Q-methodology, all four factors satisfied the standard conditions of having eigenvalues in excess of one and having two or more participants loading on the factor [77]. Table 4 shows the characteristics of the four factors.
The four factors have a cumulative explained variance of 44%, which is considered sufficient [77]. The measure of internal consistency of the factors, Composite Reliability, can be considered ‘excellent’, with scores between 0.970 and 0.923. In total 23 participants (77%) could be loaded onto the factors. which is quite satisfactory. Table 5 shows this loading of the participants on the four factors.
Five participants loaded negatively to a factor, indicating that their sorts were more or less mirror images of others on that same factor, which is not uncommon in Q-methodology. A total of 7 of the 30 respondents did not fulfill the criteria for loading on one of the factors. Two of these ‘non-loaders’ did not load strongly on any of the factors, whereas five loaded strong on two factors. For the analysis and interpretation of the identified factors, the non-loaders were not considered. Table 6 shows the correlation between the factors.
From this table it can be concluded that the factors show a weak level of correlation. The factors therefore have a satisfactory level of uniqueness.

4.2. Analysing the Factors

Table 7 presents the average scores of the categories of barriers per factor.
This table shows that the four factors represent very different patterns of experienced barriers or challenges, which confirms the presumption that motivated this study: different companies experience different barriers for their change to circularity. These differences appear even clearer in Figure 2, which presents the average scores of the categories of barriers per pattern in a graphical way. The ‘peaks’ that the different graphs show indicate high scores for these categories of barriers. Peaks to the right indicate that this group of participants strongly experience this particular category of barriers. Peaks to the left indicate that this category of barriers is not much of a barrier or challenge to the participants.
As the factors represent distinct patterns of barriers that the furniture companies experience, we will further address them as ‘patterns’. The next section will discuss these four patterns, based on which categories of barriers scored high or low, and their distinguishing statements.

4.3. Analysing the Patterns of Barriers

4.3.1. Pattern 1

This pattern, represented by 7 (23.3%) of the participants, shows a peak in the resources category of barriers. This also shows from the distinguishing statements for this pattern (Table 8), with statement 28 Lack of technical resources scoring highest. However, other categories of statements are also amongst the distinguishing statements with a positive score, indicating that these statements indicate experienced barriers.
Distinguishing statements with a negative score, indicating that these statements are not experienced as barriers, are predominantly of the awareness category. One of the participants in this pattern stated: “Everyone in our organization is well aware regarding end of life product issues, and our organization is well conscious about circularity as an urgent matter, as we are part of a larger business holding where every firm is aligned. As a business holding we are financially strong enough for facing circularity, so fortunately financial resources are not a barrier for us.” As this quote shows, the participants in this pattern are well aware of the need for circularity and also have the know-how or technology. This shows also from statement 42 Unclear whether a used product can be recycled, which was the lowest scoring statement in this pattern. One of the participants stated as motivation for this low score: “Because for the products I have in mind to produce, I know clearly how to manage the end-of-life”.
Other than the above indicated peaks of the resources and awareness categories of barriers, the other categories do not show an obvious peak in the scores of this pattern.

4.3.2. Pattern 2

In Figure 2, this pattern does not show strong peaks in the scoring of the categories of barriers. The categories policy and business case are the highest scoring categories, with the categories value chain and resources scoring lowest. Table 9 shows the distinguishing statements for this pattern, which was represented by 5 (16.7%) of the participants. This table confirms the overall scoring patterns by showing high scores for statements from the category policy and business case, complemented by statement 20 Lack of interest in the organization. Motivations for the high scoring statements were given as: “I totally agree legislation is sometimes in opposition to circularity due to too many requirements to fulfill. There is too much bureaucracy and impediments when by-products travel between different regions with different related laws. Maybe this is good for the traceability of the by-product, but it is an impediment.” and “Financial risk of circularity is a barrier because its amortization is not so clear as when talking about machinery, for instance.
The low scoring statements come from a number of categories with the lowest scoring statements referring to the market and value chain. The participants motivated these low scores with statements such as: “The final price of the company’s products in the sales channel is high, so it is possible to assume possible investments in the circularity of the furniture.” and “Our product is structurally simple and with known materials, being versatile in terms of replacement of elements so complexity is not a problem or barrier.”.

4.3.3. Pattern 3

In this pattern, the market category of barriers scored highest, with the categories policy and business case scoring lowest (Figure 2). Table 10 shows the distinguishing statements for this pattern, which was represented by 8 (26.7%) of the participants. An illustrative motivation one participant provided for the high scoring market related barriers was “In our case, our clients are not willing to pay more for circularity, this is a barrier at the moment.”. Another participant added “In our line of business the main driver is cost price. Interest of clients in sustainability is zero.”.
The market related barriers do not imply that the participants do not see the business case for circularity. For example, one participant stated: “We don’t agree with this barrier as everyone is clearly aware about the benefits of circularity.”. However, the initial investment for the transition towards circularity forms a large barrier for this pattern, with the participants ranking statement 1 High cost of required innovations. Remarkably, statement 9 Lack of financial resources was scored lowest.

4.3.4. Pattern 4

Pattern 4 shows a scoring pattern that is partially contrasting that of pattern 1. The highest peaks in the scoring are again for the categories of awareness and resources, but the peaks are mirrored. This pattern experiences awareness as the highest scoring category of barriers and resources as the lowest (Figure 2). Next to these peaks in the scoring, two lower peaks are visible, with the category technology scoring second highest and the market category of barriers scoring second lowest. Three participants (10%) represented this pattern, for which Table 11 shows the distinguishing statements.
For this pattern, the largest barriers appear to be organization internal, with several technology and awareness related statements scoring highest. Market related barriers scored low and were therefore not perceived as barriers. One participant motivated this as: “Customers are paying more attention and the new generations are very sensitive to these issues. The challenge consists in being able to grasp circular economy as a competitive advantage”. The business case category of barriers delivered mixed scores, with statement 40 Unclear benefits of circularity scoring high as a perceived barrier, but statements about the investment, 1 High cost of required innovations and 9 Lack of financial resources, scoring low.

4.4. Most versus Least Consensus Statements

Table 12 presents the top 10 most consensus statements. In these consensus statements, the categories value chain and technology were most represented, with all statements scoring a relatively neutral score in all four patterns.
The top 10 of least consensus statements (Table 13) is populated by the market and resources categories of barriers. The perception of these barriers is apparently ‘making the difference’ between the four identified patterns.

4.5. Further Analysis

In order to further understand the four patterns of perception of barriers the study revealed, we analyzed the descriptive data of the fractions of the P-set that represented the four patterns. Although Q-methodology aims to reveal and explicate the main viewpoints that are favored by a particular group of participants, without claiming that the groups of respondent that show these viewpoints present representative fractions of the total population, the further analysis of the P-set may provide insights that can be tested in further research [77]. Table 14 therefore presents the descriptive data of the P-set including a detailing per factor.
In Factor 1, which did not have a lack of awareness but experienced the resources type of barriers as most hindering the change to circularity, companies with a global supply chain are overrepresented. The companies that represented this pattern also show a high level of outsourcing of transport and logistics. A high percentage of the companies in this factor indicated having merely a basic understanding of circularity. With regards to the location of the participants, the Greek and Italian companies are overrepresented in this factor.
In Factor 2, younger companies, 3–5 years of age, are overrepresented. In this factor the policy and business case categories of barriers scored highest, which may be an indication that these younger companies do not have the financial strength to transform to CE and are therefore experiencing the lack of supporting policies and arrangements as a barrier. With regards to the location of the participants, the Slovenian and Spanish participants are overrepresented in this factor.
Factor 3, which is the pattern that experiences mostly market related barriers, shows an overrepresentation of larger companies (>50 employees). A potential explanation for this overrepresentation may be that these are well established companies that compete mainly on price. In this factor, the Dutch participants are overrepresented.
Smaller companies are overrepresented in Factor 4. In this factor, the technology and awareness categories of barriers scored highest, which may be an indication for a less mature organization. In this factor, with mostly organization internal barriers, the use of plastics as material is also overrepresented. The organizations in this profile have a remarkable underrepresentation of design in their activities, as they tend to outsource this. This lack of involvement in the early stages of the product life-cycle may be one of the reasons why the awareness category of barriers scored high in this pattern.

5. Discussion

5.1. Key Findings

The study reported in this paper aims to contribute to a greater understanding of the factors that limit the implementation of CE, by exploring the variety of barriers to the transition to circularity, as perceived by European furniture companies. As the furniture industry still has a relatively local or regional supply chain, this industry should be a suitable industry for the implementation of circularity.
Based on the literature on barriers for the transition towards circularity, seven categories of barriers were identified:
  • Policy: Barriers or challenges that result from the policies or behavior of public institutions, including regulatory barriers.
  • Market: Barriers or challenges that result from customer behavior and market preferences.
  • Value chain: Barriers or challenges that result from the drivers and dependencies for circularity in the supply chain or value chain.
  • Technology: Barriers and challenges of technological nature, including the availability of technologies for recovery of materials.
  • Resources: Barriers or challenges related to the organization’s human resources and their competences.
  • Awareness: Barriers or challenges resulting from the company’s leadership’s motivation for and stimulation of circularity.
  • Business case: Barriers or challenges resulting from the balance between costs and benefits of circularity.
Using Q-methodology, and with participation of 30 furniture companies from five EU countries, the study revealed four distinct patterns of the perception of these barriers amongst the participating companies:
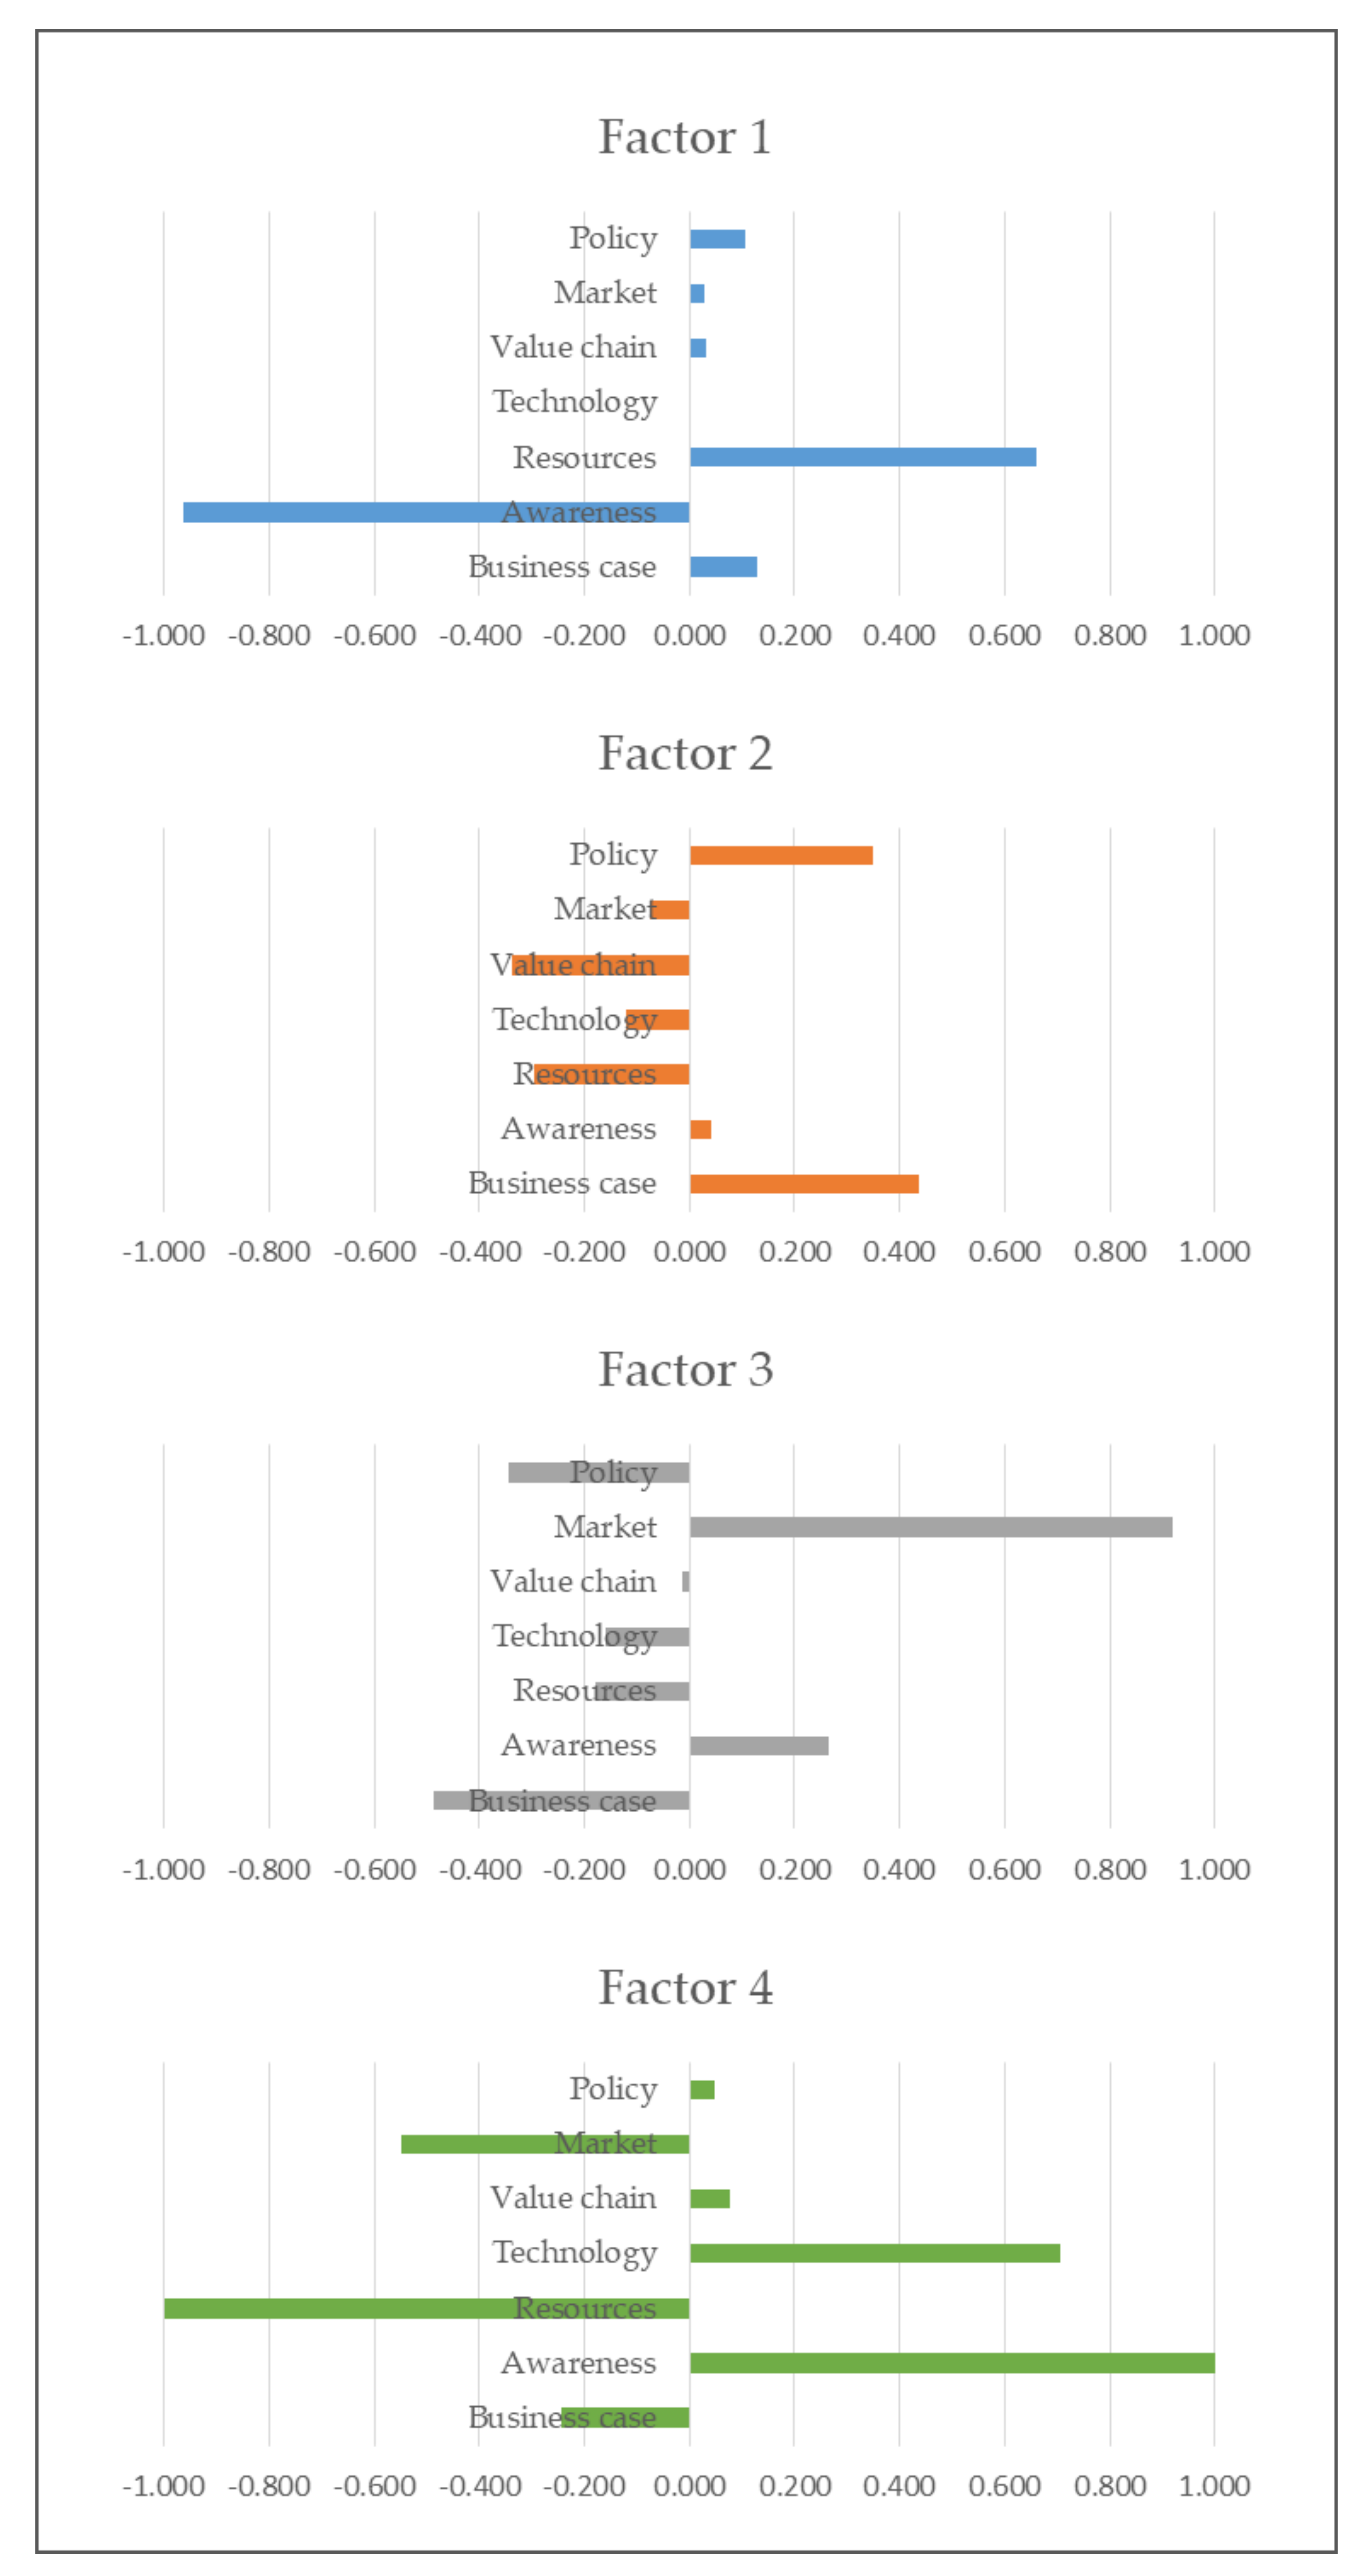
  • Pattern 1. Companies that are well aware of the need to change to circularity, but experience a lack of resources as their main barrier.
  • Pattern 2. Companies that experience mostly the policy and business case categories of barriers, such as a high required investment without stimulating subsidies or policies.
  • Pattern 3. Companies that experience mostly market related barriers, potentially as a result of competing mainly on price.
  • Pattern 4. Companies that experience mostly organization internal, technology, and awareness related barriers.
Our analysis showed that the four patterns of perception are distinct from each other, with high composite reliabilities, and weak correlations between the patterns. The analysis of least consensus statements especially showed that the perception of market and resources categories of barriers make the difference between the identified patterns.

5.2. Theoretical Contribution and Novelty

This study contributes to theory development about CE implementation at an industrial level, reducing main gaps identified in the literature on CE barriers. First, there is limited research with empirical work in specific industries, as much of the existing research is focused on theoretical, conceptual, and normative aspects of CE [49].
A second gap is related to the lack of attention paid to underlying values and culture that may boost CE practices in the industry [5]. Our research tries to delve into discouraging motivations (barriers) and impeding arguments (challenges) that delay or directly abort the adoption of CE practices in a traditional industry. In this sense, our study is industry-specific research in the European furniture industry, so we provide a contextualized perspective about the challenges and related solutions. This way we avoid a generic approach, more usual in the literature [42], while taking into account the effect of the size of firms [64].
Finally, we put the stress in a business approach through its several perspectives (market, resources, technology, business case, etc.) when researching CE industrial engagement. In this sense, we followed the suggestion of some authors who claim the need for a better understanding about usual unclear arguments for CE engaging, especially when it comes to the impact at a business level [7,41,42].

5.3. Managerial Implications

By identifying four distinct patterns of perception of barriers to circularity, the study demonstrated that these barriers are not experienced in a single generalizable way. Theis view of the variety of CE barriers, and the way they are experienced, is a much-needed perspective in the advancement of the insights, serving the implementation of CE. The four patterns the study identified provide valuable insight for the development of supporting stimulation policies for circularity. The variety of perceptions shows that a ‘one-size-fits-all’ policy will not fit the needs of all companies.
Additionally, some issues arise from the study that go beyond the institutional perspective of CE, usually focused on the need for awareness or on environmental advantages. The methodology of our research helps to identify fundamental business obstacles from the managers’ subjectivity. These obstacles shed light to future solutions and industrial policies and programs to be adopted that should focus on overcoming three practical impediments: (1) providing methods and tools for assessing the return of CE technology investments in the firm, which are really uncertain at present; (2) overcoming differences in regional and national regulations related to waste management; and (3) fostering cooperation for CE goals throughout the industrial value chain.

6. Conclusions

CE research about barriers and challenges at an industrial level is required for more industry-specific, contextualized, and insight-oriented research. This study provides evidence about specific mindset patterns in the European furniture industry related to CE practices. Thus, we identified four main groups of companies, depending whether they put the stress for CE inaction on (1) the lack of resources, (2) the financial uncertainty of these practices, (3) the difficulties for circular market development, or (4) the organizational impediments. Table 15 presents the main implications of the study.
The study contributes to both theoretical and managerial advances in the CE literature, by empirical research on subjectivity around CE in the firm, a deeper knowledge on traditional barriers descending to an insight level in the managers mindset, and arising industrial specific values that underlie traditional discourses on effective engagement of CE industrial practices.

Limitations and Future Research

In Q-methodology, the statements of the Q-set by nature place a limitation on the participant’s response [90]. The development of the Q-set is therefore a critical process in Q-methodology [89]. In order to explore the different perceptions of the barriers the participants experience, the study reported in this article developed a Q-set of statements, based on a framework of categories of barriers derived from the literature. The categorization of barriers provides confidence that no important aspects or insights are overlooked, but absolute certainty cannot be given for this. Another limitation that is inherent to the use of Q-methodology is the uncertainty about whether the identified patterns of perceived barriers are representative for the different perceptions of the total population of EU furniture companies. Experiences with Q-methodology studies, however, show that a larger P-set does not automatically lead to the identification of more patterns.
As the study was performed with participants of five EU countries, it should be expected that the perceived barriers to circularity are influenced by national or local policies. A replication of the study in other EU countries would provide more insight into the potential bias that the geographical focus created. However, given the fact that the study was aimed at exploring the variety of subjective perceptions, the researchers feel that a plurality in public policies does not hinder this aim.
Next to replicating the study in order to strengthen the robustness of the four barriers patterns, follow-up research could also be directed towards the characteristics of the companies that represent the identified patterns. As the study reported in this article was explorative in nature, aimed at identifying distinct patterns of perception, a follow up study is needed to deepen our understanding of the characteristics of the companies that represent these patterns. Section 4.5 provided a first indication for this. However, Q-methodology does not allow the claim that the groups of respondents that were loaded onto the different patterns are representative fractions of the total population. Further research may explore the barrier patterns revealed in this study further, and identify which factors are influencing a company’s perception of its barriers to circularity.
Further work could also be pursued on the policy implications of the identified patterns. Understanding the different barrier patterns allows governments and authorities to fine-tune their CE implementation programs. However, more empirical work would need to be done on the practical experiences with this in order to explore the effectiveness of these policies.

Author Contributions

Conceptualization, G.S.; methodology, G.S.; data collection, A.I., V.S.-V. and M.C.; formal analysis, A.I.; writing—original draft preparation, G.S., V.S.-V. and M.C.; writing—review and editing, G.S. and V.S.-V.; visualization, G.S.; supervision, G.S.; project administration, A.I. All authors have read and agreed to the published version of the manuscript.

Funding

The research was funded by the European Union as part of the Erasmus+ “Innovation in the FURniture Industry in the era of circular economy” project (Grant number #2020-1-NL01-KA202-064554).

Institutional Review Board Statement

Not applicable.

Informed Consent Statement

Informed consent was obtained from all subjects involved in the study.

Data Availability Statement

Not applicable.

Conflicts of Interest

The authors declare no conflict of interest.

References

  1. Dyllick, T.; Hockerts, K. Beyond the business case for corporate sustainability. Bus. Strategy Environ. 2002, 11, 130–141. [Google Scholar] [CrossRef]
  2. Meadows, D.H.; Meadows, D.L.; Randers, J.; Behrens, W.W. The Limits to Growth; Universe Books: New York, NY, USA, 1972. [Google Scholar]
  3. Global Footprint Network World Footprint. 2020. Available online: https://www.footprintnetwork.org/our-work/ecological-footprint/ (accessed on 1 March 2020).
  4. Korhonen, J.; Nuur, C.; Feldmann, A.; Birkie, S.E. Circular economy as an essentially contested concept. J. Clean. Prod. 2018, 175, 544–552. [Google Scholar] [CrossRef]
  5. Korhonen, J.; Honkasalo, A.; Seppälä, J. Circular economy: The concept and its limitations. Ecol. Econ. 2018, 143, 37–46. [Google Scholar] [CrossRef]
  6. Homrich, A.; Galvão, G.; Abadia, L.; Carvalho, M. The circular economy umbrella: Trends and gaps on integrating pathways. J. Clean. Prod. 2018, 175, 525–543. [Google Scholar] [CrossRef]
  7. Bocken, N.M.P.; de Pauw, I.; Bakker, C.; van der Grinten, B. Product design and business model strategies for a circular economy. J. Ind. Prod. Eng. 2016, 33, 308–320. [Google Scholar] [CrossRef] [Green Version]
  8. Kirchherr, J.; Piscicelli, L.; Bour, R.; Kostense-Smit, E.; Muller, J.; Huibrechtse-Truijens, A.; Hekkert, M. Barriers to the circular economy: Evidence from the European Union (EU). Ecol. Econ. 2018, 150, 264–272. [Google Scholar] [CrossRef] [Green Version]
  9. Kirchherr, J.; Reike, D.; Hekkert, M. Conceptualizing the circular economy: An analysis of 114 definitions. Resour. Conserv. Recycl. 2017, 127, 221–232. [Google Scholar] [CrossRef]
  10. De Jesus, A.; Antunes, P.; Santos, R.; Mendonça, S. Eco-innovation in the transition to a circular economy: An analytical literature review. J. Clean. Prod. 2018, 172, 2999–3018. [Google Scholar] [CrossRef]
  11. Seuring, S.; Gold, S. Sustainability management beyond corporate boundaries: From stakeholders to performance. J. Clean. Prod. 2013, 56, 1–6. [Google Scholar] [CrossRef]
  12. Skene, K.R. Circles, spirals, pyramids and cubes: Why the circular economy cannot work. Sustain. Sci. 2018, 13, 479–492. [Google Scholar] [CrossRef]
  13. European Commission. Directive 2008/98/EC of the European Parliament and of the Council of 19 November 2008 on waste and repealing certain Directives. 2008. Available online: http://eur-lex.europa.eu/legal-content/EN/TXT/PDF/?uri=CELEX:32008L0098&from=EN (accessed on 22 November 2016).
  14. Lacy, P.; Rutqvist, J. Waste to Wealth: The Circular Economy Advantage; Palgrave Macmillan: London, UK, 2016. [Google Scholar]
  15. Ghisellini, P.; Cialani, C.; Ulgiati, S. A review on circular economy: The expected transition to a balanced interplay of environmental and economic systems. J. Clean. Prod. 2016, 114, 11–32. [Google Scholar] [CrossRef]
  16. Stahel, W.R. The circular economy. Nature 2016, 531, 435–438. [Google Scholar] [CrossRef] [PubMed] [Green Version]
  17. Geng, Y.; Doberstein, B. Developing the circular economy in China: Challenges and opportunities for achieving’leapfrog development’. Int. J. Sustain. Dev. World Ecol. 2008, 15, 231–239. [Google Scholar] [CrossRef]
  18. Preston, F. A Global Redesign? Shaping the Circular Economy; Chatham House: London, UK, 2012. [Google Scholar]
  19. Van Eik, F. Barriers & Drivers towards a Circular Economy, Acceleratio. 2016. Available online: https://circulareconomy.europa.eu/platform/en/knowledge/barriers-drivers-towards-circular-economy (accessed on 13 April 2021).
  20. Ritzén, S.; Sandström, G.Ö. Barriers to the circular economy—Integration of perspectives and domains. Procedia CIRP 2017, 64, 7–12. [Google Scholar] [CrossRef]
  21. Franco, M.A. Circular economy at the micro level: A dynamic view of incumbents’ struggles and challenges in the textile industry. J. Clean. Prod. 2017, 168, 833–845. [Google Scholar] [CrossRef]
  22. Ormazabal, M.; Prieto-Sandoval, V.; Puga-Leal, R.; Jaca, C. Circular Economy in Spanish SMEs: Challenges and opportunities. J. Clean. Prod. 2018, 185, 157–167. [Google Scholar] [CrossRef]
  23. Adams, K.T.; Osmani, M.; Thorpe, T.; Thornback, J. Circular economy in construction: Current awareness, challenges and enablers. Waste Resour. Manag. 2017, 170, 15–24. [Google Scholar] [CrossRef] [Green Version]
  24. Ribeiro de Oliveira, F.; França, S.L.B.; Rangel, L.A.D. Challenges and opportunities in a circular economy for a local productive arrangement of furniture in Brazil. Resour. Conserv. Recycl. 2018, 135, 202–209. [Google Scholar] [CrossRef]
  25. Jaeger, B.; Upadhyay, A. Understanding barriers to circular economy: Cases from the manufacturing industry. J. Enterp. Inf. Manag. 2020, 33, 729–745. [Google Scholar] [CrossRef]
  26. Upadhyay, A.; Laing, T.; Kumar, V.; Dora, M. Exploring barriers and drivers to the implementation of circular economy practices in the mining industry. Resour. Policy 2021, 72, 102037. [Google Scholar] [CrossRef]
  27. Fonseca, L.M.; Domingues, J.P.; Pereira, M.T.; Martins, F.F.; Zimon, D. Assessment of Circular Economy within Portuguese Organizations. Sustainability 2018, 10, 2521. [Google Scholar] [CrossRef] [Green Version]
  28. García-Quevedo, J.; Jové-Llopis, E.; Martínez-Ros, E. Barriers to the circular economy in European small and medium-sized firms. Bus. Strategy Environ. 2020, 29, 2450–2464. [Google Scholar] [CrossRef]
  29. De Jesus, A.; Mendonça, S. Lost in Transition? Drivers and Barriers in the Eco-innovation Road to the Circular Economy. Ecol. Econ. 2018, 145, 75–89. [Google Scholar] [CrossRef] [Green Version]
  30. Bressanelli, G.; Saccani, N.; Pigosso, D.C.A.; Perona, M. Circular Economy in the WEEE industry: A systematic literature review and a research agenda. Sustain. Prod. Consum. 2020, 23, 174–188. [Google Scholar] [CrossRef]
  31. Centobelli, P.; Cerchione, R.; Chiaroni, D.; Del Vecchio, P.; Urbinati, A. Designing business models in circular economy: A systematic literature review and research agenda. Bus. Strategy Environ. 2020, 29, 1734–1749. [Google Scholar] [CrossRef]
  32. Frosch, R.A.; Gallopoulos, N.E. Strategies for Manufacturing. Sci. Am. 1989, 261, 144–152. [Google Scholar] [CrossRef]
  33. Pearce, D.W.; Turner, R.K. Economics of Natural Resources and the Environment; Johns Hopkins University Press: Baltimore, MD, USA, 1990; 378p. [Google Scholar]
  34. Bocken, N.M.P.; Olivetti, E.A.; Cullen, J.M.; Potting, J.; Lifset, R. Taking the Circularity to the Next Level: A Special Issue on the Circular Economy. J. Ind. Ecol. 2017, 21, 476–482. [Google Scholar] [CrossRef]
  35. McDowall, W.; Geng, Y.; Huang, B.; Barteková, E.; Bleischwitz, R.; Türkeli, S.; Kemp, R.; Doménech, T. Circular Economy Policies in China and Europe. J. Ind. Ecol. 2017, 21, 651–666. [Google Scholar] [CrossRef] [Green Version]
  36. Ellen MacArthur Foundation (2012). Towards the Circular Economy: Economic and Business Rationale for an Accelerated Transition. Available online: https://www.ellenmacarthurfoundation.org/assets/downloads/publications/Ellen-MacArthur-Foundation-Towards-the-Circular-Economy-vol.1.pdf (accessed on 2 May 2018).
  37. European Environment Agency. Circular economy in Europe—Developing the knowledge base—European Environment Agency. Luxembourg: Publications Office of the European Union. 2016. Available online: https://www.eea.europa.eu/publications/circular-economy-in-europe (accessed on 13 April 2021).
  38. Mahanty, S.; Boons, F.; Handl, J.; Batista-Navarro, R. Studying the Evolution of the “Circular Economy” Concept Using Topic Modelling. In Proceedings of the 20th International Conference on Intelligent Data Engineering and Automated Learning—IDEAL 2019, Manchester, UK, 14–16 November 2019; Springer: Cham, Switzerland, 2019; pp. 259–270. [Google Scholar] [CrossRef]
  39. Lewandowski, M. Designing the Business Models for Circular Economy—Towards the Conceptual Framework. Sustainability 2016, 8, 43. [Google Scholar] [CrossRef] [Green Version]
  40. Breuer, H.; Fichter, K.; Lüdeke-Freund, F.; Tiemann, I. Sustainability-oriented business model development: Principles, criteria and tools. Int. J. Entrep. Ventur. 2018, 10, 256–286. [Google Scholar] [CrossRef]
  41. Lüdeke-Freund, F.; Gold, S.; Bocken, N.M.P. A Review and Typology of Circular Economy Business Model Patterns. J. Ind. Ecol. 2019, 3, 36–61. [Google Scholar] [CrossRef] [Green Version]
  42. Pieroni, M.P.; McAloone, T.C.; Pigosso, D.C. Business model innovation for circular economy and sustainability: A review of approaches. J. Clean. Prod. 2019, 215, 198–216. [Google Scholar] [CrossRef]
  43. Geissdoerfer, M.; Pieroni, M.P.; Pigosso, D.C.; Soufani, K. Circular business models: A review. J. Clean. Prod. 2020, 277, 123741. [Google Scholar] [CrossRef]
  44. Reike, D.; Vermeulena, W.J.V.; Witjes, S. The circular economy: New or Refurbished as CE 3.0?—Exploring Controversies in the Conceptualization of the Circular Economy through a Focus on History and Resource Value Retention Options. Resour. Conserv. Recycl. 2018, 135, 246–264. [Google Scholar] [CrossRef]
  45. Geissdoerfer, M.; Savaget, P.; Bocken, N.M.P.; Hultink, E.J. The Circular Economy—A new sustainability paradigm? J. Clean. Prod. 2017, 143, 757–768. [Google Scholar] [CrossRef] [Green Version]
  46. Murray, A.; Skene, K.; Haynes, K. The Circular Economy: An Interdisciplinary Exploration of the Concept and Application in a Global Context. J. Bus. Ethics 2017, 140, 369–380. [Google Scholar] [CrossRef] [Green Version]
  47. Sauvé, S.; Bernard, S.; Sloan, P. Environmental sciences: Sustainable development and circular economy: Alternative concepts for trans-disciplinary research. Environ. Dev. 2016, 17, 48–56. [Google Scholar] [CrossRef] [Green Version]
  48. Blomsma, F.; Brennan, G. The emergence of circular economy: A new framing around prolonging resource productivity. J. Ind. Ecol. 2017, 21, 603–614. [Google Scholar] [CrossRef]
  49. Alhawari, O.; Awan, U.; Bhutta, M.K.S.; Ülkü, M. Insights from Circular Economy Literature: A Review of Extant Definitions and Unravelling Paths to Future Research. Sustainability 2021, 13, 859. [Google Scholar] [CrossRef]
  50. Smol, M.; Marcinek, P.; Koda, E. Drivers and Barriers for a Circular Economy (CE) Implementation in Poland—A Case Study of Raw Materials Recovery Sector. Energies 2021, 14, 2219. [Google Scholar] [CrossRef]
  51. Barros, M.V.; Salvador, R.; do Prado, G.F.; de Francisco, A.C.; Piekarski, C.M. Circular Economy As A Driver To Sustainable Businesses. Clean. Environ. Syst. 2021, 2, 100006. [Google Scholar] [CrossRef]
  52. European Furniture Industries Confederation. Sustainable Products Initiative; Position Paper Accompanying Input to Open Public Consultation. 2020. Available online: https://9e2160bf-a0b5-460b-aec7-e9af818978ee.filesusr.com/ugd/a1d93b_42844d7f427b498e8ece1fe643ab5734.pdf (accessed on 22 February 2021).
  53. Centre for European Policy Studies. The EU Furniture Market Situation and a Possible Furniture Products Initiative. 2014. Available online: https://www.ceps.eu/ceps-publications/eu-furniture-market-situation-and-possible-furniture-products-initiative/ (accessed on 7 June 2021).
  54. European Environmental Bureau. Circular Economy Opportunities in the Furniture Sector. 2017. Available online: https://eeb.org/library/circular-economy-opportunities-in-the-furniture-sector/ (accessed on 3 November 2020).
  55. Barbaritiano, M.; Bravi, L.; Savelli, E. Sustainability and quality management in the Italian luxury furniture sector: A circular economy perspective. Sustainability 2019, 11, 3089. [Google Scholar] [CrossRef] [Green Version]
  56. Hagejärd, S.; Ollár, A.; Femenías, P.; Rahe, U. Designing for Circularity—Addressing Product Design, Consumption Practices and Resource Flows in Domestic Kitchens. Sustainability 2020, 12, 1006. [Google Scholar] [CrossRef] [Green Version]
  57. EFIC—European Furniture Industries Confederation. The Furniture Sector and Circular Economy 2.0; EFIC—European Furniture Industries Confederation: Brussels, Belgium, 2020. [Google Scholar]
  58. Achterberg, E.; Hinfelaar, J.; Bocken, N. The Value Hill Business Model Tool: Identifying Gaps and Opportunities in a Circular Network. 2016. Available online: https://www.scienceandenergychallenge.nl/sites/default/files/workshops/attachments/NWO%20Sc4CE%20-%20Workshop%20Business%20Models%20-%20Paper%20on%20Circular%20Business%20Models.pdf (accessed on 6 February 2021).
  59. Rocha, C.; Camocho, D.; Sampaio, J.; Alexandre, J. Product-Service Development for Circular Economy and Sustainability Course; LNEG—Laboratório Nacional de Energia e Geologia, I.P.: Amodora, Portugal, 2020; ISBN 978-989-675-063-3. [Google Scholar]
  60. Enel, Symbola. 100 Italian Circular Economy Stories, 38, 128, 158. 2018. Available online: https://www.symbola.net/ricerca/100-italian-circular-economy-stories-la-ricerca-enel-symbola/ (accessed on 5 April 2018).
  61. World Health Organization. Circular Economy and Health: Opportunities and Risks. 2018. Available online: https://www.euro.who.int/__data/assets/pdf_file/0004/374917/Circular-Economy_EN_WHO_web_august-2018.pdf (accessed on 23 June 2021).
  62. Pheifer, A.G. Barriers and Enablers to Circular Business Models. 2017. Available online: https://www.circulairondernemen.nl/uploads/4f4995c266e00bee8fdb8fb34fbc5c15.pdf (accessed on 22 February 2021).
  63. Shahbazi, S.; Wiktorsson, M.; Kurdve, M.; Jönsson, C.; Bjelkemyr, M. Material efficiency in manufacturing: Swedish evidence on potential, barriers and strategies. J. Clean. Prod. 2016, 127, 438–450. [Google Scholar] [CrossRef]
  64. Rizos, V.; Behrens, A.; van der Gaast, W.; Hofman, E.; Ioannou, A.; Kafyeke, T.; Flamos, A.; Rinaldi, R.; Papadelis, S.; Hirschnitz-Garbers, M.; et al. Implementation of Circular Economy Business Models by Small and Medium sized Enterprises (SMEs): Barriers and Enablers. Sustainability 2016, 8, 1212. [Google Scholar] [CrossRef] [Green Version]
  65. Bicket, M.; Guilcher, S.; Hestin, M.; Hudson, C.; Razzini, P.; Tan, A.; ten Brink, P.; van Dijl, E.; Vanner, R.; Watkins, E. Scoping Study to Identify Potential Circular Economy Actions, Priority Sectors, Material Flows and Value Chains; Publications Office of the European Union: Luxembourg, 2014. [Google Scholar] [CrossRef]
  66. Ranta, V.; Aarikka-Stenroos, L.; Ritala, P.; Mäkinen, S.J. Exploring institutional drivers and barriers of the circular economy: A cross-regional comparison of China, the US, and Europe. Resour. Conserv. Recycl. 2018, 135, 70–82. [Google Scholar] [CrossRef]
  67. Shi, H.; Peng, S.Z.; Liu, Y.; Zhong, P. Barriers to the implementation of cleaner production in Chinese SMEs: Government, industry and expert stakeholders’ perspectives. J. Clean. Prod. 2008, 16, 842–852. [Google Scholar] [CrossRef]
  68. Kazancoglu, I.; Sagnak, M.; Kumar Mangla, S.; Kazancoglu, Y. Circular economy and the policy: A framework for improving the corporate environmental management in supply chains. Bus. Strategy Environ. 2021, 30, 590–608. [Google Scholar] [CrossRef]
  69. Araujo Galvão, G.D.; De Nadae, J.; Clemente, D.H.; Chinen, G.; Carvalho, M. Circular economy: Overview of barriers. Procedia CIRP 2018, 73, 79–85. [Google Scholar] [CrossRef]
  70. Ormazabal, M.; Prieto-Sandoval, V.; Jaca, C.; Santos, J. An overview of the circular economy among smes in the Basque Country: A multiple case study. J. Ind. Eng. Manag. 2016, 9, 1047–1058. [Google Scholar] [CrossRef] [Green Version]
  71. Nußholz, J.L.K. Circular business models: Defining a concept and framing an emerging research field. Sustainability 2017, 9, 1810. [Google Scholar] [CrossRef] [Green Version]
  72. Biondi, V.; Iraldo, F.; Meredith, S. Achieving sustainability through environmental innovation: The role of SMEs. Int. J. Technol. Manag. 2002, 24, 612. [Google Scholar] [CrossRef]
  73. Brown, S. Political Subjectivity—Application of Q Methodology in Political Science; Yale University Press: New Haven, CT, USA; London, UK, 1980. [Google Scholar]
  74. Stephenson, W. The Study of Behavior; Q-Technique and Its Methodology; University of Chicago Press: Chicago, IL, USA, 1953. [Google Scholar]
  75. Angelopulo, G. Q methodology and the measurement of subjectivity in corporate brand perception. S. Afr. J. Bus. Manag. 2009, 40, 21–34. [Google Scholar] [CrossRef] [Green Version]
  76. Brown, S. Q methodology and qualitative research. Qual. Health Res. 1996, 6, 561–567. [Google Scholar] [CrossRef]
  77. Watts, S.; Stenner, P. Doing Q methodology: Theory, method and interpretation. Qual. Res. Psychol. 2005, 2, 67–91. [Google Scholar] [CrossRef]
  78. Dryzek, J.S.; Berejikian, A. Reconstitutive democratic theory. Am. Political Sci. Rev. 1993, 87, 48–60. [Google Scholar] [CrossRef]
  79. Silvius, G.; Schipper, R. Exploring variety in factors that stimulate project managers to address sustainability issues. Int. J. Proj. Manag. 2020, 38, 353–367. [Google Scholar] [CrossRef]
  80. Stenner, P.; Stainton Rogers, R. Q Methodology and Qualiquantology: The Example of Discriminating between Emotions; Psychology Press: Hove, UK, 2004; pp. 101–120. [Google Scholar]
  81. Donner, J.C. Using Q-Sorts in Participatory Processes: An Introduction to the Methodology. In Social Analysis, Selected Tools and Techniques; Social Development Papers, Paper Number 36; Krueger, R.A., Casey, M.A., Donner, J., Kirsch, S., Maack, J.N., Eds.; The World Bank: Washington, DC, USA, 2001. [Google Scholar]
  82. Schlinger, M. Cues on Q-techniques. J. Advert. Res. 1969, 9(3), 53–60. [Google Scholar]
  83. McKeown, B.; Thomas, D. Q Methodology; Sage Publications, Inc.: Newbury Park, CA, USA, 1988. [Google Scholar]
  84. Silvius, G.; Kampinga, M.; Paniagua, S.; Mooi, H. Considering Sustainability in Project Management Decision Making; An investigation using Q-methodology. Int. J. Proj. Manag. 2017, 35, 1133–1150. [Google Scholar] [CrossRef]
  85. Webler, T.; Danielson, S.; Tuler, S. Using Q Method to Reveal Social Perspectives in Environmental Research; Social and Environmental Research Institute: Greenfield, MA, USA, 2009; Available online: www.serius.org/pubs/Qprimer.pdf (accessed on 22 April 2021).
  86. Denzine, G. The use of Q Methodology in Student Affairs Research and Practice. Student Affairs Journal Online. 1998. Available online: http://www.sajo.org/denzine040398.html (accessed on 15 January 2017).
  87. Stainton Rogers, R. Q methodology. In Rethinking Methods in Psychology; Sage Publications: London, UK; Thousand Oaks, CA, USA, 1995; pp. 178–192. [Google Scholar]
  88. Smolck, P. The Qmethod Software. 2018. Available online: http://schmolck.org/qmethod/ (accessed on 3 April 2018).
  89. Dziopa, F.; Ahern, K. A systematic literature review of the applications of Q-technique and its methodology. Methodology 2011, 7, 39–55. [Google Scholar] [CrossRef]
  90. Cross, R.M. Exploring Attitudes: The Case for Q Methodology. Health Educ. Res. 2005, 20, 206–213. [Google Scholar] [CrossRef] [PubMed] [Green Version]
Figure 1. Structure of the Q-sort diagram used.
Sustainability 13 11072 g001
Figure 2. Graphical presentation of the distribution of categories of barriers per factor.
Sustainability 13 11072 g002
Table 1. Barriers to circularity identified in literature.
CategoryIdentified Barriers/ChallengesReferences
PolicyLack of support from public institutions[17,18,22,50,64,70]
Lack of financial support[17,22,64,70]
Legal issues with circularity[21]
Limited sustainable public procurement[19]
Incoherent policies at different levels[19,28]
MarketNegative reception of ‘recycled’ products[17,25,50]
Lack of consumer awareness and interest[17,18,19,21,22,24,70,71]
Price sensitivity of the product[21]
Lack of incentive to design for end of life (products)[23,24]
Widespread planned obsolescence in products[19]
Value chainFragmented supply chain[23,25]
Lack of consideration for end-of-life issues[22]
Lack of market mechanisms for recovery[19,23]
Low value of raw material/products at end of life[17,19,21,23]
Non-alignment of power and incentives across the value chain[19,21,25]
Lack of investment in recycling and recovery infrastructure[19,23]
TechnologyLack of recycling and recovery technology[17,18,19,20,22,50,64,67,70]
Inadequate information[17,19,20,22,25,64,70]
Complexity of product[21,23]
ResourcesLack of technical resources[17,18,22,25,28,50,64,67,70]
Lack of qualified professionals[17,18,22,50,67,70]
Lack of circular economy knowledge[19,24,50]
AwarenessLack of commitment on the part of the organizations’ leaders[17,67,70,72]
Lack of awareness or interest[23,24]
Business caseUncertain/unclear business case[19,23,50]
Lack of financial resources[17,19,22,25,50,64,67,70]
Table 2. The statements of the Q-set.
StatementCategory
P1Lack of support from public institutionsPolicy
P2Lack of stimulating subsidies or policiesPolicy
P3Public organizations do not support circularity in their procurementPolicy
P4Incoherent public policies on circularity and wastePolicy
P5Laws hinder circularityPolicy
P6Industry regulations hinder circularityPolicy
M1Lack of consumer awareness and interestMarket
M2Customers consider products that are made of recycled materials less desirableMarket
M3Customers are not interested in circularityMarket
M4A competitive price in the market leaves no room for investing in circularityMarket
M5Lack of incentive to design for end of lifeMarket
M6No price premium for sustainable productsMarket
C1Lack of consideration of end-of-life issuesValue chain
C2Lack of market mechanisms for recoveryValue chain
C3Low value of raw materialValue chain
C4Difficult to align incentives for circularity across the value chainValue chain
C5Lack of know how in the supply chainValue chain
C6Lack of recycling and recovery infrastructureValue chain
T1Lack of recycling and recovery technologyTechnology
T2Lack of information about the circular aspects of the productTechnology
T3Unclear whether a used product can be recycledTechnology
T4Product is too complex to realize circularityTechnology
T5The product includes different material streams, making it difficult to determine ‘circularity’Technology
T6Limited availability and quality of recycled materialsTechnology
R1Lack of technical resourcesResources
R2Lack of qualified professionalsResources
R3Lack of circular economy knowledgeResources
R4Lack of know how in the organizationResources
R5Unclear where or how to startResources
R6Lack of creativity in the organizationResources
A1Lack of commitment on the part of the organizations’ leadersAwareness
A2Lack of interest in the organizationAwareness
A3Lack of support from the organization’s leadershipAwareness
A4Difficult to embed circularity in the organization’s cultureAwareness
A5The organization is facing more urgent issuesAwareness
A6Lack of support from the organization’s ownersAwareness
B1Uncertain business case for circularityBusiness case
B2Unclear benefits of circularityBusiness case
B3Lack of financial resourcesBusiness case
B4High cost of required innovationsBusiness case
B5High financial risk of circularity investmentsBusiness case
B6Regenerating used products is too costlyBusiness case
Table 3. Description of the P-set.
QuestionAnswer CategoriesTotal Sample
FrequencyPercentage.
Location of the
company
Greece620.0%
Italy620.0%
Netherlands620.0%
Slovenia620.0%
Spain620.0%
Age of the company1–2 years26.7%
3–5 years26.7%
6–10 years310.0%
>10 years2376.7%
Markets served
(multiple answers
allowed)
Consumers (B2C)1963.3%
Businesses (B2B)2583.3%
Public organizations (B2P)930.0%
Number of employees0–1 employee310.0%
2–5 employees310.0%
6–20 employees930.0%
21–50 employees26.7%
51–250 employees930.0%
>250 employees413.3%
Main materials used
(multiple answers
allowed)
Ceramics13.3%
Fabrics723.3%
Glass1343.3%
Metal1550.0%
Paper/Carton26.7%
Plastics930.0%
Wood2893.3%
Activities performed (mainly) internally
(multiple answers
allowed)
Design of products 2686.7%
Production of raw materials516.7%
Production products and parts of products2583.3%
Assembly of final products2273.3%
Transport and logistics1550.0%
Activities (mainly) outsourced
(multiple answers
allowed)
Design of products1136.7%
Production of raw materials2583.3%
Production products and parts of products826.7%
Assembly of final products620.0%
Transport and logistics1343.3%
Supply chainLocally/Nationally1240.0%
Elsewhere in Europe1240.0%
Europe and mainly Asia26.7%
Europe and mainly Africa00.0%
Europe and mainly North America00.0%
Europe and mainly South America00.0%
Globally413.3%
Familiarity with
circularity
Basic understanding1446.7%
Some familiarity310.0%
Familiar and some application1343.3%
Table 4. Characteristics of the four factors.
Factor 1Factor 2Factor 3Factor 4
Eigenvalues4.49363.67092.6382.4731
% Explained Variance151298
Number of Defining Variables7583
Average Reliability Coefficient0.8000.8000.8000.800
Composite Reliability0.9660.9520.9700.923
Standard Error of Factor Z-Scores0.1860.2180.1740.277
Table 5. Loading of the respondents on the four factors (grey cells indicate loaded factor.).
Participant #Factor 1Factor 2Factor 3Factor 4
10.39420.05440.4505X0.1731
20.2779−0.20170.1639−0.0847
30.3068−0.091−0.3654X0.166
40.46890.4894−0.2264−0.2902
50.10630.4418X0.317−0.3274
60.2740.11320.4125X0.0409
70.13750.05170.03930.4155X
80.36460.1570.5341X0.0506
90.5285X−0.26810.07340.2087
100.34670.21390.7065X0.0113
110.4820X−0.3094−0.0622−0.2529
120.5661X−0.15830.0650.2565
130.2519−0.4285−0.29110.4888
140.3483X−0.21360.26940.264
150.4872−0.4382−0.1590.3718
160.3224−0.23660.4369X0.1225
170.21010.5893X0.1564−0.3117
180.3194−0.3556X−0.0322−0.064
190.6827X−0.3593−0.1319−0.152
200.27840.2650.0001−0.4041X
210.4526X−0.1162−0.1626−0.1961
220.6288X−0.1838−0.0051−0.4992
230.2619−0.07240.0886−0.2344
240.14470.10930.3002X0.1269
250.4386−0.1002−0.3122−0.5560X
260.36460.3836−0.5410X0.0167
270.16340.7563X−0.1470.3057
280.2380.7724X−0.00080.3488
290.4780.3757−0.24360.4756
300.46220.4733−0.37620.0878
Table 6. Factor correlations.
Factor 1Factor 2Factor 3Factor 4
Factor 11−0.13230.2025−0.3847
Factor 2−0.132310.1378−0.026
Factor 30.20250.137810.0875
Factor 4−0.3847−0.0260.08751
Table 7. Categories of barriers per factor.
Factor 1Factor 2Factor 3Factor 4
Policy0.1070.350−0.3450.047
Market0.030−0.0750.918−0.547
Value chain0.033−0.337−0.0150.077
Technology0.003−0.120−0.1600.707
Resources0.660−0.297−0.178−1.043
Awareness−0.9630.0400.2671.000
Business case0.1300.438−0.487−0.245
Table 8. Distinguishing statements for pattern 1 (p < 0.05; asterisk (*) indicates significance at p < 0.01).
StatementCategoryQ-Sort ValueAverage
z-Score
28Lack of technical resourcesResources41.29 *
35Public organizations do not support circularity in their procurementPolicy31.27
41Unclear where or how to startResources31.01 *
1High cost of required innovationsBusiness case31.01
37The organization is facing more urgent issuesAwareness20.96
33Limited availability and quality of recycled materialsTechnology20.91
10Lack of incentive to design for end of lifeMarket10.83 *
25Lack of recycling and recovery infrastructureValue chain10.60 *
12A competitive price in the market leaves no room for investing in circularityMarket10.57 *
9Lack of financial resourcesBusiness case00.50*
19Lack of information about the circular aspects of the productTechnology00.46
6Lack of consideration of end-of-life issuesValue chain−1−0.82
13Difficult to embed circularity in the organization’s cultureAwareness−1−0.91 *
20Lack of interest in the organizationAwareness−2−1.21 *
40Unclear benefits of circularityBusiness case−2−1.34 *
27Lack of support from the organization’s ownersAwareness−3−1.52 *
5Lack of commitment on the part of the organizations’ leadersAwareness−4−1.75 *
42Unclear whether a used product can be recycledTechnology−4−2.31 *
Table 9. Distinguishing statements for pattern 2 (p < 0.05; asterisk (*) indicates significance at p < 0.01).
StatementCategoryQ-Sort ValueAverage
z-Score
17Lack of stimulating subsidies or policiesPolicy41.96 *
1High cost of required innovationsBusiness case31.84 *
39Uncertain business case for circularityBusiness case31.45 *
3Industry regulations hinder circularityPolicy20.81 *
20Lack of interest in the organizationAwareness10.41
8Lack of creativity in the organizationResources00.25 *
9Lack of financial resourcesBusiness case−1−0.61 *
23Lack of market mechanisms for recoveryValue chain−2−0.89 *
35Public organizations do not support circularity in their procurementPolicy−2−1.03
34Product is too complex to realize circularityTechnology−2−1.13 *
31No price premium for sustainable productsMarket−3−1.25 *
22Lack of know how in the supply chainValue chain−4−1.43 *
12A competitive price in the market leaves no room for investing in circularityMarket−4−1.85 *
Table 10. Distinguishing statements for pattern 3 (p < 0.05; asterisk (*) indicates significance at p < 0.01).
StatementCategoryQ-Sort ValueAverage
z-Score
12A competitive price in the market leaves no room for investing in circularityMarket42.45 *
37The organization is facing more urgent issuesAwareness31.48
32Difficult to align incentives for circularity across the value chainValue chain31.34 *
14Customers are not interested in circularityMarket20.95 *
35Public organizations do not support circularity in their procurementPolicy10.66
1High cost of required innovationsBusiness case10.49
28Lack of technical resourcesResources10.36 *
13Difficult to embed circularity in the organization’s cultureAwareness00.11 *
18Lack of support from the organization’s leadershipAwareness00.09 *
2Incoherent public policies on circularity and wastePolicy−1−0.5
20Lack of interest in the organizationAwareness−1−0.52 *
26Lack of recycling and recovery technologyTechnology−3−1.61 *
Table 11. Distinguishing statements for pattern 4 (p < 0.05; asterisk (*) indicates significance at p < 0.01).
StatementCategoryQ-Sort ValueAverage
z-Score
34Product is too complex to realize circularityTechnology41.95 *
38The product includes different material streams, making it difficult to determine ‘circularity’Technology41.83 *
5Lack of commitment on the part of the organizations’ leadersAwareness31.82 *
18Lack of support from the organization’s leadershipAwareness31.29 *
20Lack of interest in the organizationAwareness31.2
40Unclear benefits of circularityBusiness case21.09 *
27Lack of support from the organization’s ownersAwareness20.93 *
29Laws hinder circularityPolicy10.53 *
39Uncertain business case for circularityBusiness case10.13
35Public organizations do not support circularity in their procurementPolicy−1−0.33
1High cost of required innovationsBusiness case−1−0.41 *
12A competitive price in the market leaves no room for investing in circularityMarket−1−0.42 *
36Regenerating used products is too costlyBusiness case−2−0.66 *
10Lack of incentive to design for end of lifeMarket−2−1.03 *
14Customers are not interested in circularityMarket−3−1.50 *
Table 12. Top 10 most consensus statements.
StatementCategoryFactor 1Factor 2Factor 3Factor 4
6Lack of consideration of end-of-life issuesValue chain−1000
33Limited availability and quality of recycled materialsTechnology2010
11Lack of support from public institutionsPolicy2100
15Customers consider products that are made of recycled materials less desirableMarket−1−2−20
2Incoherent public policies on circularity and wastePolicy01−11
25Lack of recycling and recovery infrastructureValue chain100−1
21Lack of know how in the organizationResources2021
19Lack of information about the circular aspects of the productTechnology0−1−20
32Difficult to align incentives for circularity across the value chainValue chain0130
38The product includes different material streams, making it difficult to determine ‘circularity’Technology0114
Table 13. Top 10 least consensus statements.
StatementCategoryFactor 1Factor 2Factor 3Factor 4
12A competitive price in the market leaves no room for investing in circularityMarket1−44−1
42Unclear whether a used product can be recycledTechnology−4221
5Lack of commitment on the part of the organizations’ leadersAwareness−4113
9Lack of financial resourcesBusiness case0−1−4−4
24Lack of qualified professionalsResources22−3−3
10Lack of incentive to design for end of lifeMarket144−2
34Product is too complex to realize circularityTechnology−1−2−14
28Lack of technical resourcesResources4−31−3
4Lack of circular economy knowledgeResources4−12−2
7Lack of consumer awareness and interestMarket−133−1
Table 14. Description of the P-set detailed by factor.
QuestionAnswer CategoriesTotal P-SetFactor 1Factor 2Factor 3Factor 4
Location of the companyGreece20.0%42.9%0.0%12.5%33.3%
Italy20.0%42.9%0.0%25.0%33.3%
Netherlands20.0%0.0%20.0%37.5%0.0%
Slovenia20.0%0.0%40.0%12.5%33.3%
Spain20.0%14.3%40.0%12.5%0.0%
Age of the company1–2 years6.7%0.0%0.0%12.5%0.0%
3–5 years6.7%0.0%40.0%0.0%0.0%
6–10 years10.0%0.0%20.0%12.5%33.3%
>10 years76.7%100.0%40.0%75.0%66.7%
Markets servedConsumers (B2C)63.3%57.1%60.0%62.5%100.0%
Businesses (B2B)83.3%100.0%80.0%87.5%100.0%
Public organizations (B2P)30.0%42.9%40.0%25.0%33.3%
Number of employees0–1 employee10.0%0.0%0.0%12.5%33.3%
2–5 employees10.0%0.0%20.0%12.5%0.0%
6–20 employees30.0%57.1%40.0%12.5%66.7%
21–50 employees6.7%14.3%0.0%0.0%0.0%
51–250 employees30.0%14.3%20.0%50.0%0.0%
>250 employees13.3%14.3%20.0%12.5%0.0%
Main materials usedCeramics3.3%0.0%20.0%0.0%0.0%
Fabrics23.3%14.3%60.0%12.5%33.3%
Glass43.3%42.9%40.0%37.5%66.7%
Metal50.0%57.1%60.0%50.0%66.7%
Paper/Carton6.7%14.3%0.0%12.5%0.0%
Plastics30.0%28.6%40.0%25.0%66.7%
Wood93.3%100.0%80.0%87.5%100.0%
Activities (performed mainly internal)Design of products86.7%100.0%100.0%87.5%33.3%
Production of raw materials16.7%0.0%40.0%12.5%0.0%
Production products and parts of products83.3%85.7%100.0%75.0%66.7%
Assembly of final products73.3%71.4%80.0%62.5%66.7%
Transport and logistics50.0%14.3%40.0%62.5%66.7%
Activities (mainly outsourced)Design of products36.7%57.1%40.0%25.0%66.7%
Production of raw materials83.3%100.0%80.0%75.0%100.0%
Production products and parts of products26.7%14.3%20.0%25.0%33.3%
Assembly of final products20.0%28.6%40.0%12.5%33.3%
Transport and logistics43.3%85.7%40.0%25.0%33.3%
Supply chainLocally/Nationally40.0%42.9%40.0%50.0%33.3%
Elsewhere in Europe40.0%14.3%60.0%37.5%66.7%
Europe and mainly Asia6.7%14.3%0.0%12.5%0.0%
Globally13.3%28.6%0.0%0.0%0.0%
Familiarity with circularityBasic understanding46.7%85.7%40.0%37.5%66.7%
Some familiarity10.0%0.0%20.0%0.0%0.0%
Familiar and some application43.3%14.3%40.0%62.5%33.3%
Table 15. Summary of main implications of the study.
ImplicationsIndustry-specific contextualized research on CE barriers.
Focus on business insights related to CE.
Four patterns of subjective arguments for avoiding the adoption of CE practices exist at present.
Solutions should focus on assessing financial risks, introducing circular offerings in markets, and fostering internal changes in the organizations.
Publisher’s Note: MDPI stays neutral with regard to jurisdictional claims in published maps and institutional affiliations.

