
Measuring Energy Poverty and Its Impact on Economic Growth in Pakistan


Abstract
:1. Introduction
2. Energy Poverty: Some Measurement Issues
2.1. Energy Services Availability
2.2. Clean Energy
2.3. Energy Governance
2.4. Energy Affordability
2.5. Methodology
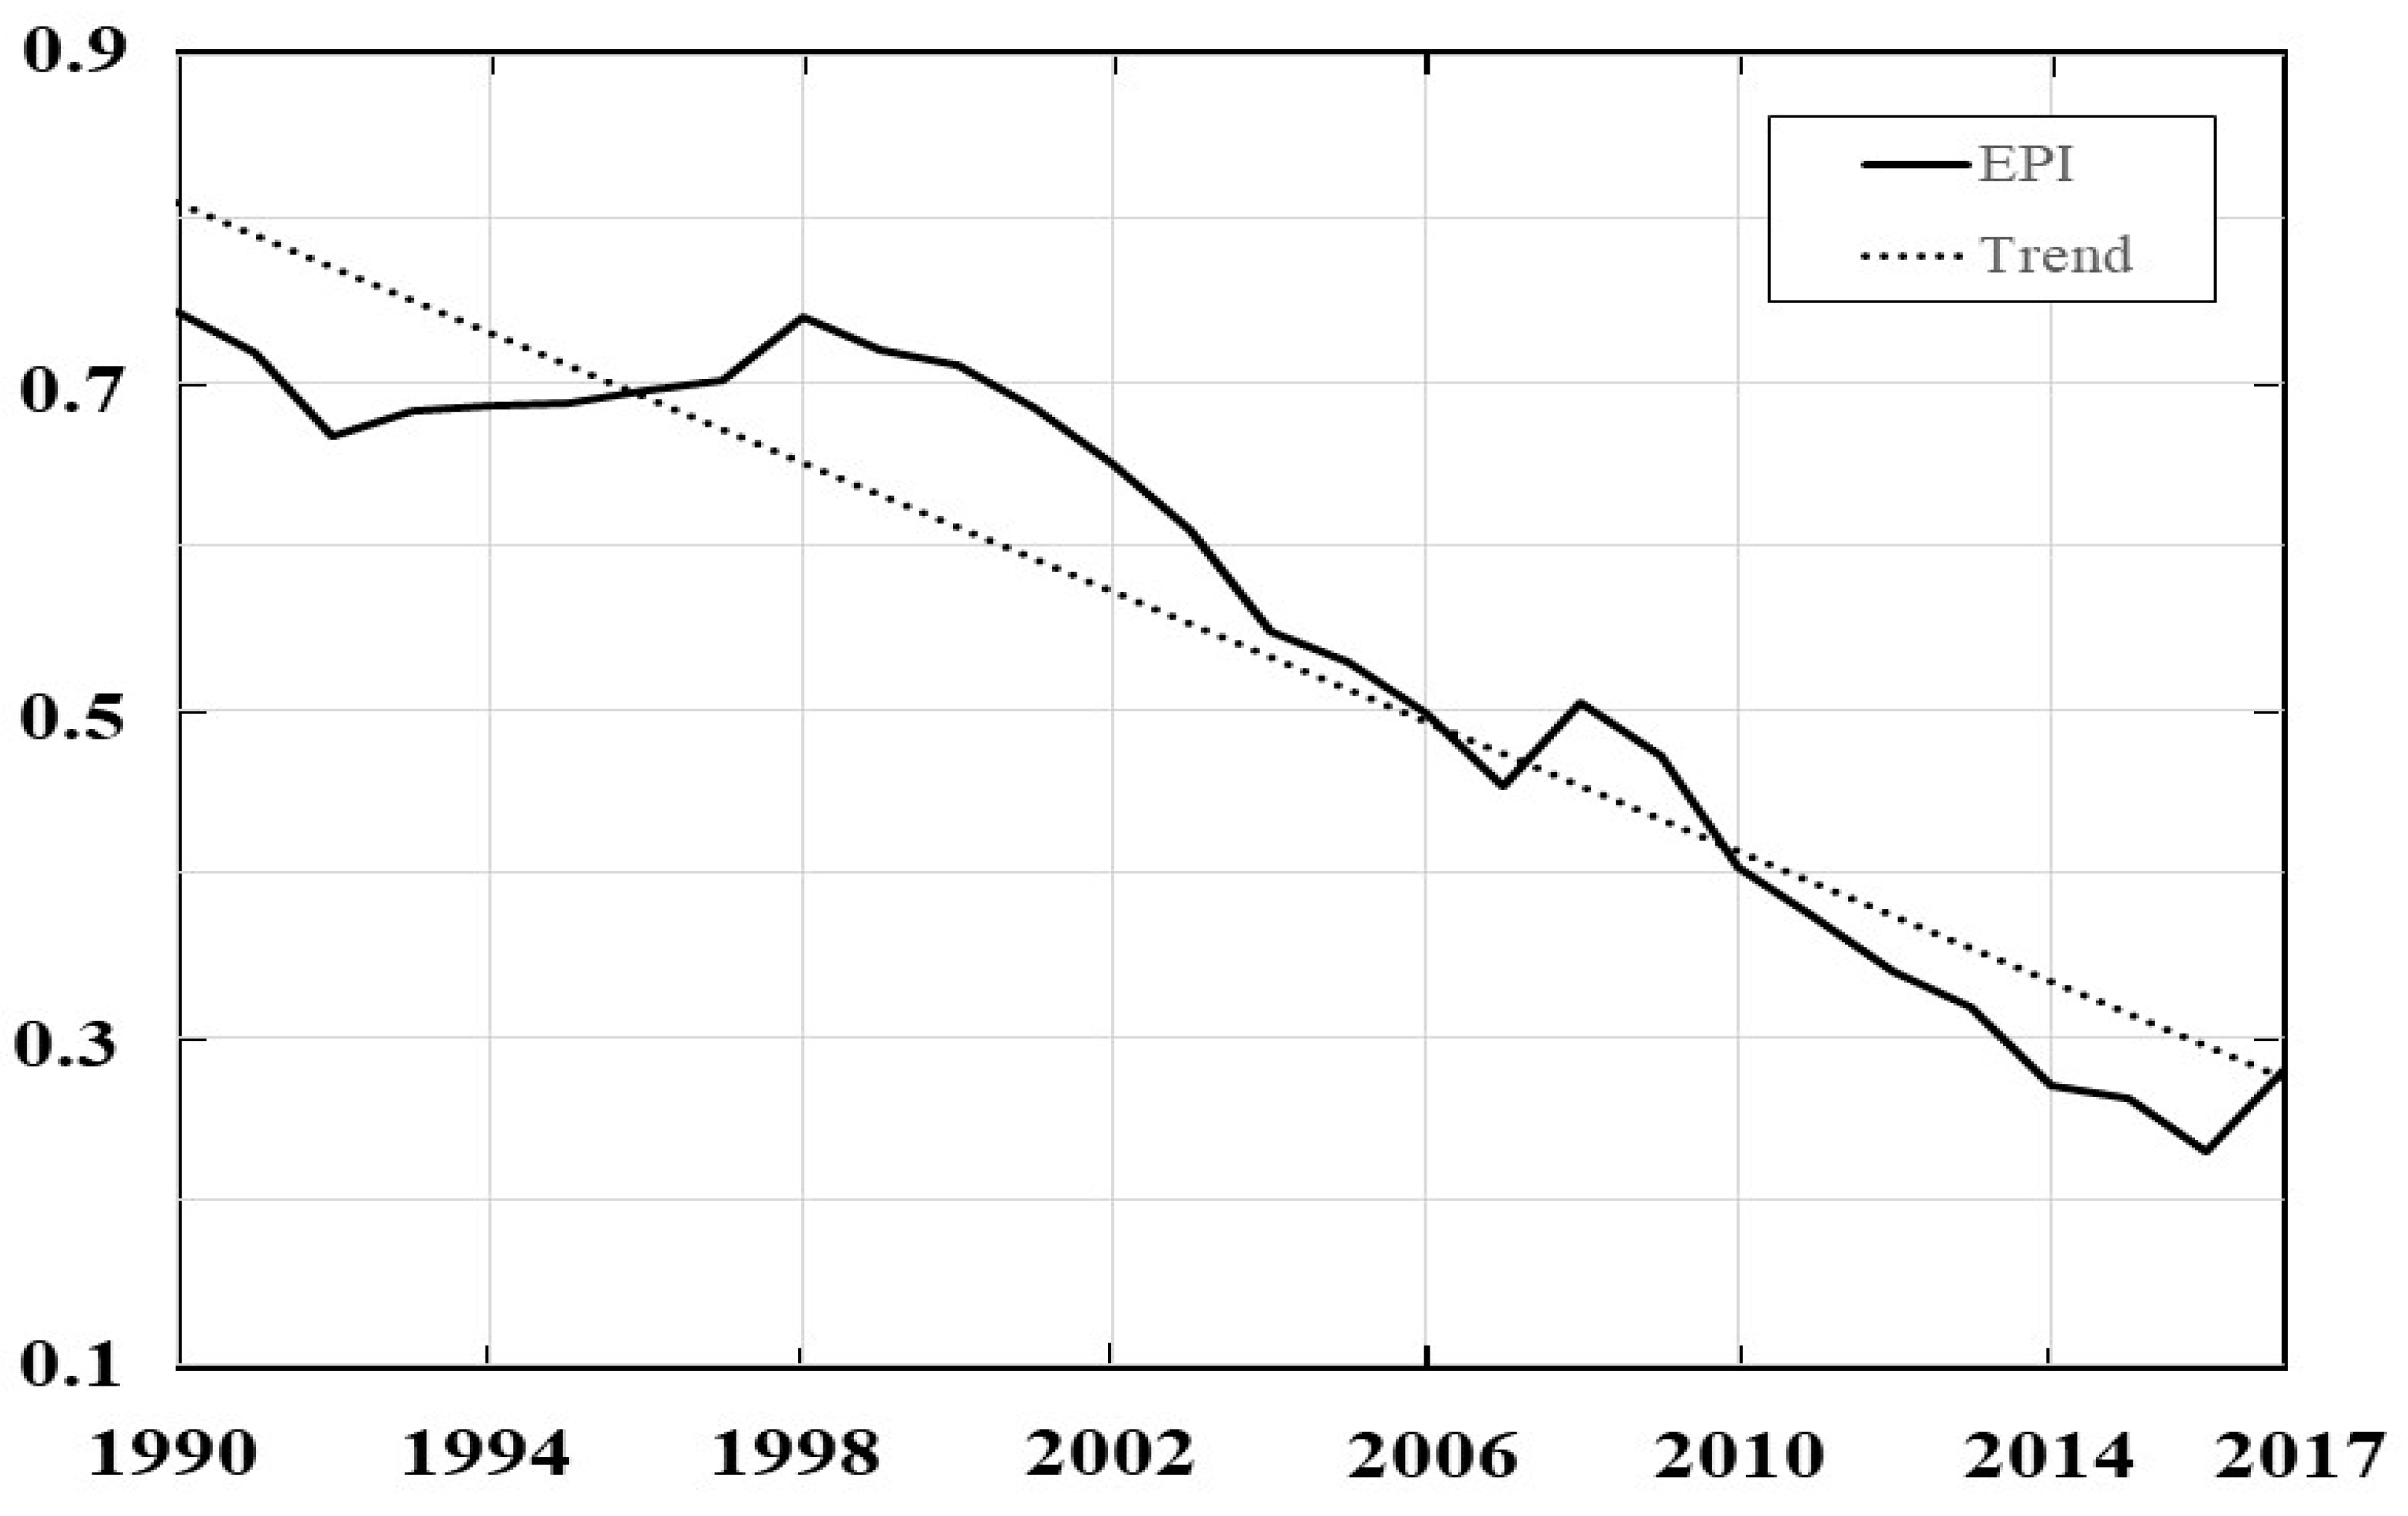
2.6. Energy Poverty
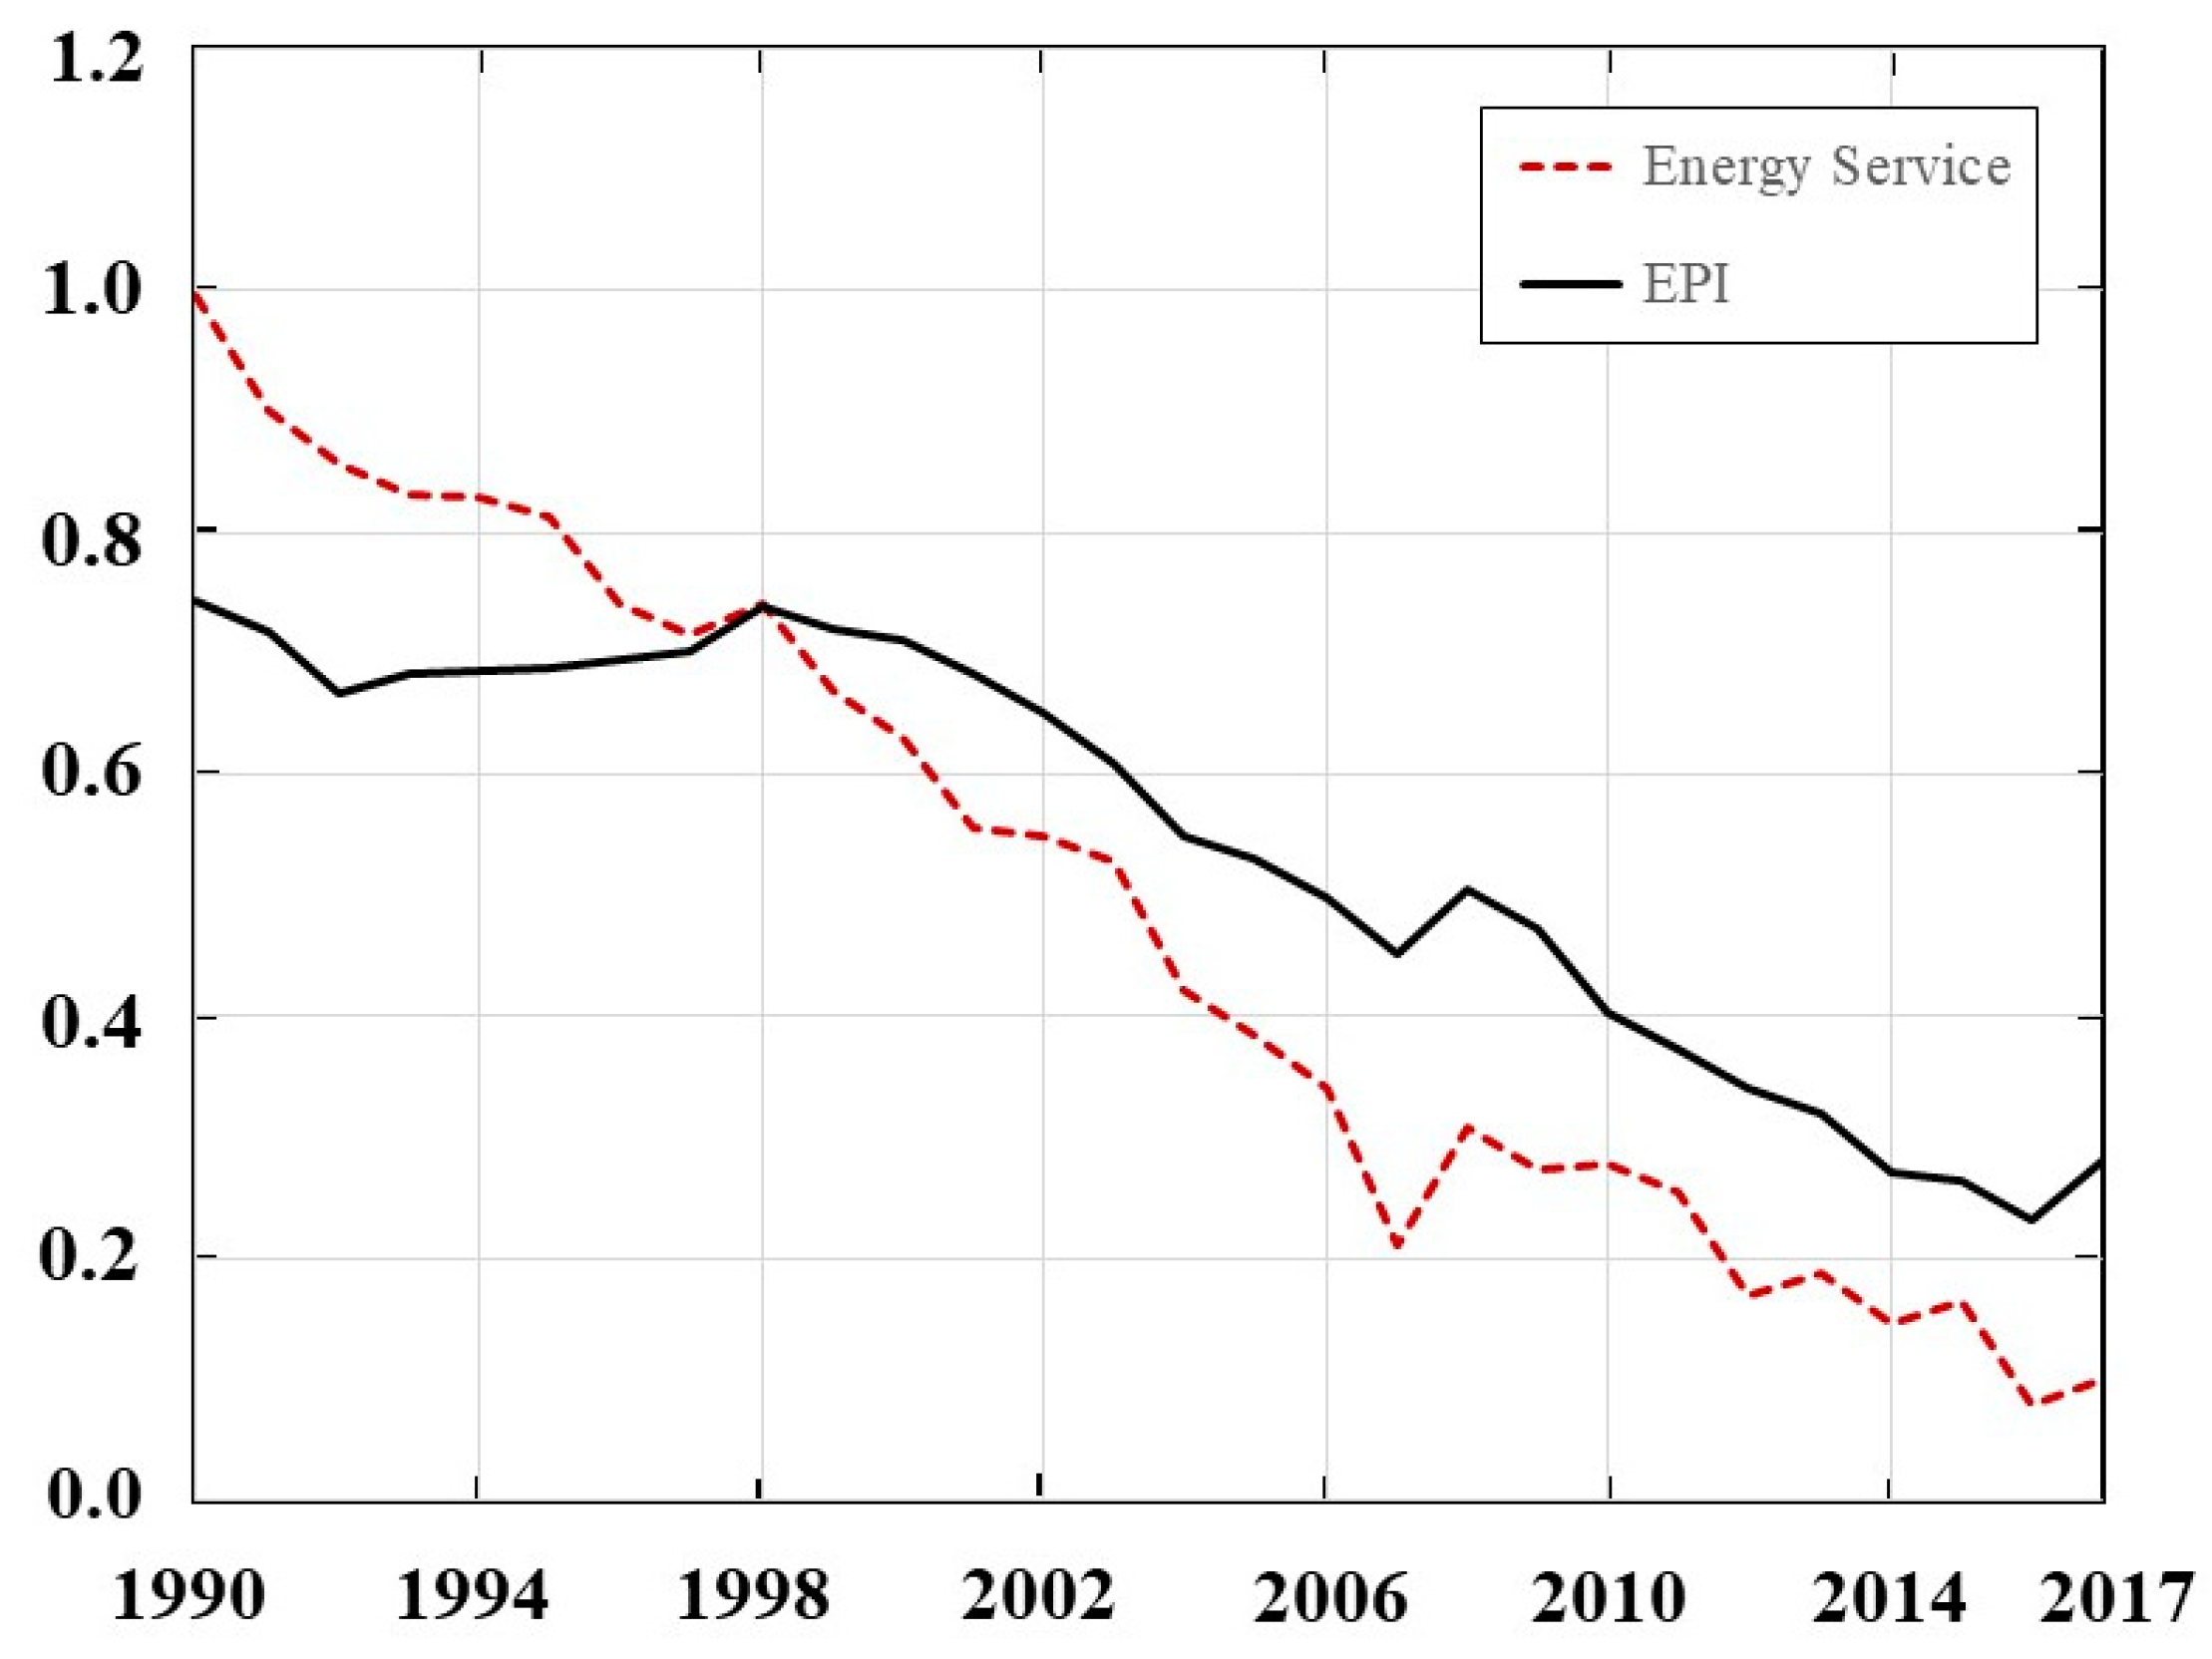
2.6.1. Energy Services and Energy Poverty
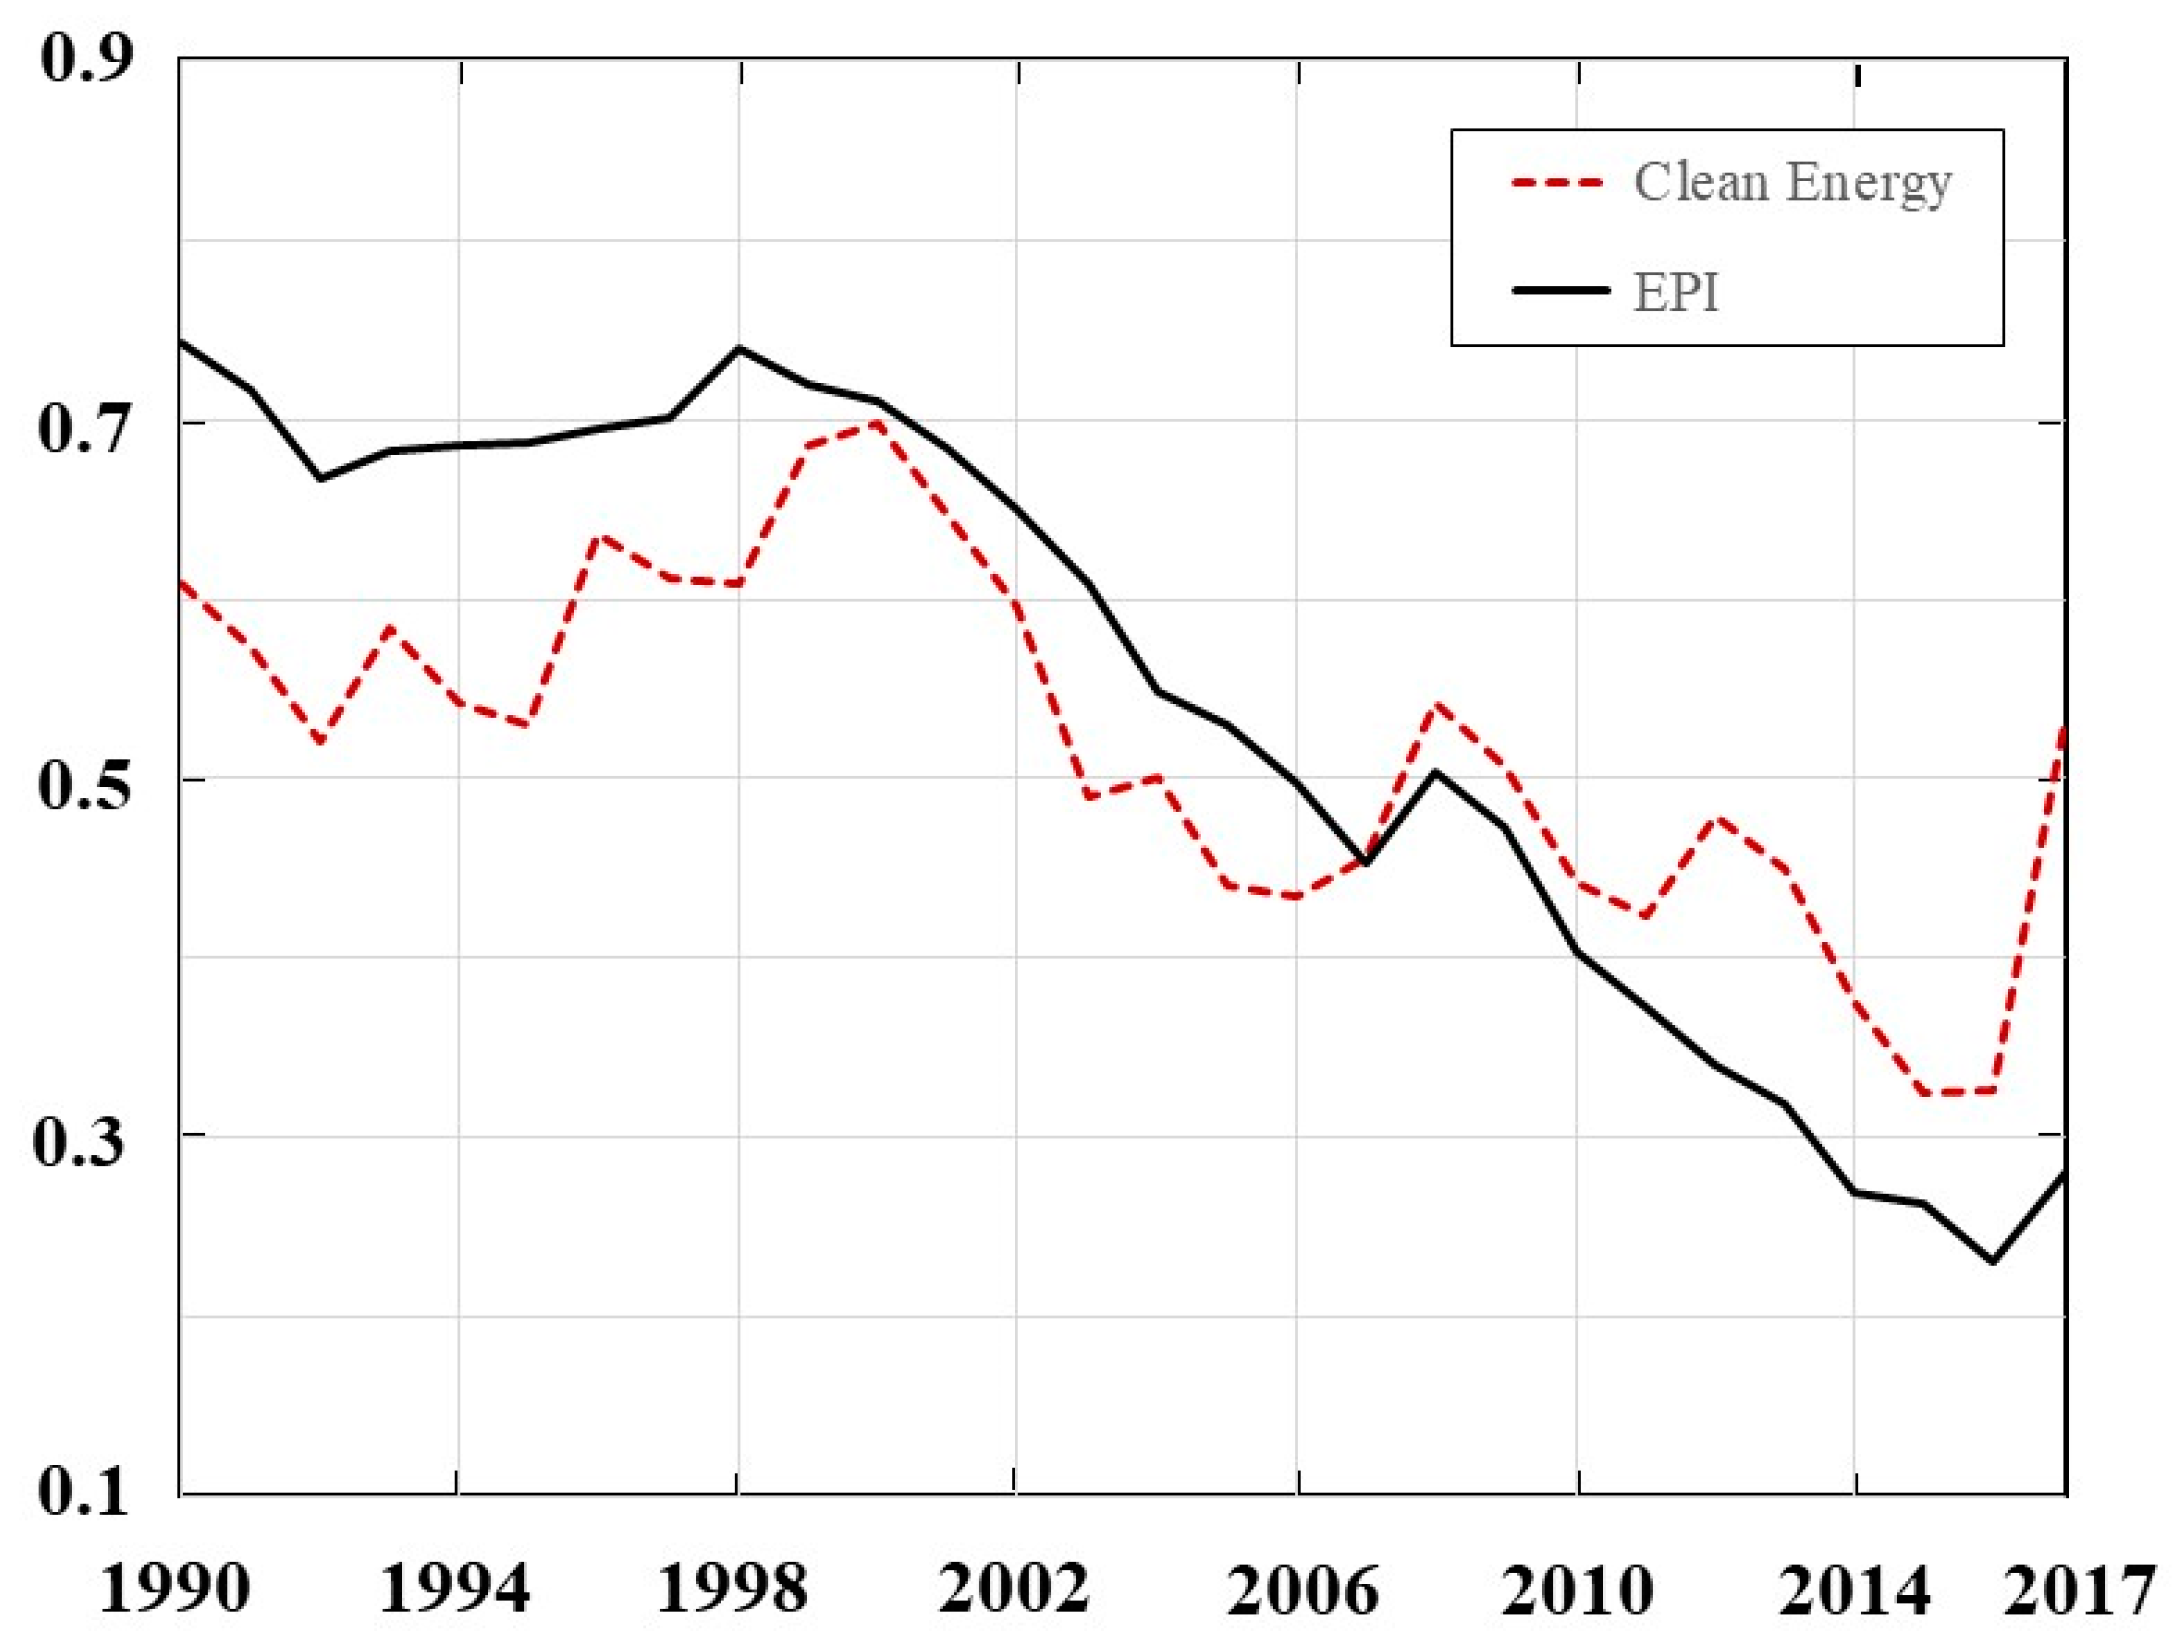
2.6.2. Clean Energy and Energy Poverty
2.6.3. Energy Governance and Energy Poverty
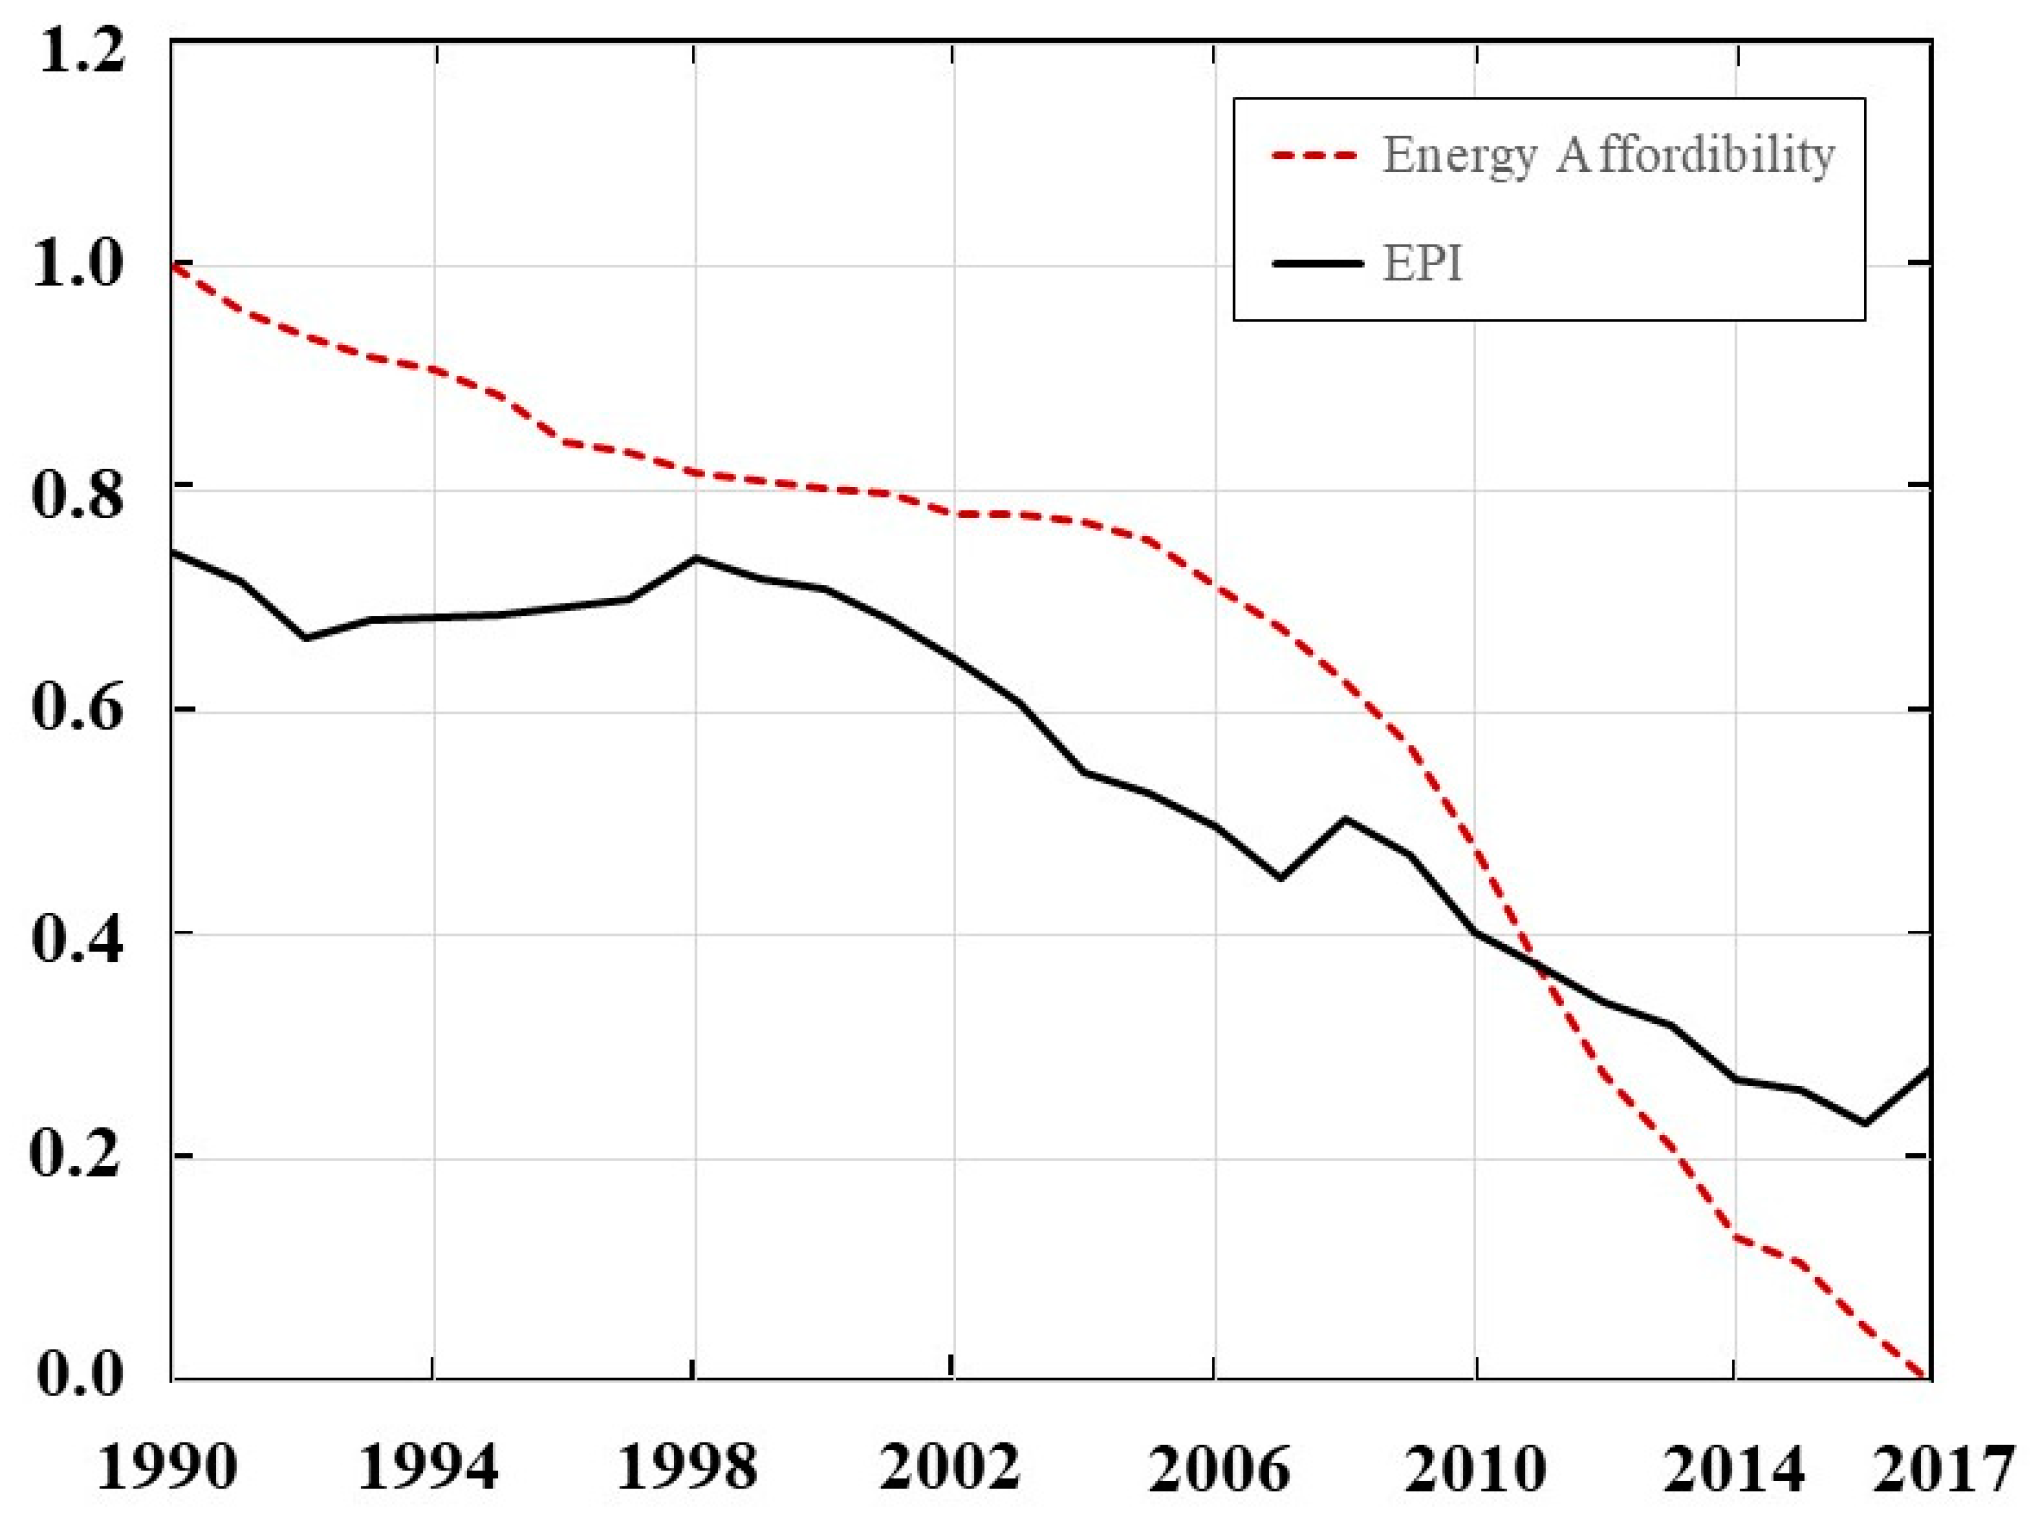
2.6.4. Energy Affordability and Energy Poverty
3. Model and Estimation Procedure
4. Results and Discussion
4.1. Stationarity Tests
4.2. Johansen Cointegration Test
4.3. Long-Run and Short-Run Results
4.4. Variance Decomposition Analysis
5. Conclusions
Author Contributions
Funding
Institutional Review Board Statement
Informed Consent Statement
Data Availability Statement
Conflicts of Interest
Abbreviations
| COP21 | 21st conference on climate held in Paris |
| CPEC | China–Pakistan Economic Corridor |
| EPI | Energy poverty index |
| EU | European Union |
| FDI | Foreign direct investment |
| IEA | International Energy Agency |
| PBS | Pakistan Bureau of Statistics |
| PEB | Pakistan Energy Year Book |
| SDGs | Sustainable Development Goals |
| TOE | Ton of oil equivalent |
| UNDP | United Nations Development Programme |
| WDI | World Development Indicators |
References
- Bauer, P.T. The vicious circle of poverty. Weltwirtschaftliches Archiv 1965, 95, 4–20. Available online: https://www.jstor.org/stable/pdf/40436342.pdf (accessed on 27 October 2018).
- Buzar, S. Energy Poverty in Eastern Europe: Hidden Geographies of Deprivation. Routledge 2007. Available online: https://www.routledge.com/Energy-Poverty-in-Eastern-Europe-Hidden-Geographies-of-Deprivation/Buzar/p/book/9780754671305 (accessed on 27 October 2018).
- Karekezi, S.; McDade, S.; Boardman, B.; Kimani, J.; Lustig, N. Energy, poverty, and development. In Global Energy Assessment Writing Team, Global Energy Assessment: Toward a Sustainable Future; Cambridge University Press: Cambridge, UK, 2012; pp. 151–190. [Google Scholar] [CrossRef]
- Chakravarty, S.; Tavoni, M. Energy poverty alleviation and climate change mitigation: Is there a trade off? Energy Econ. 2013, 40, S67–S73. [Google Scholar] [CrossRef] [Green Version]
- Dagoumas, A.; Kitsios, F. Assessing the impact of the economic crisis on energy poverty in Greece. Sustain. Cities Soc. 2014, 13, 267–278. [Google Scholar] [CrossRef]
- Atkinson, A.B.; Bourguignon, F. The comparison of multi-dimensioned distributions of economic status. Rev. Econ. Stud. 1982, 49, 183–201. [Google Scholar] [CrossRef]
- Pachauri, S.; Spreng, D. Measuring and monitoring energy poverty. Energy Policy 2011, 39, 7497–7504. [Google Scholar] [CrossRef]
- International Energy Forum. Energy access and affordability. In Proceedings of the Paper Presented at the 16th International Energy Forum Ministerial, New Delhi, India, 10–12 April 2018; Available online: https://www.ief.org/_resources/files/events/ief16-ministerial/ief16-ofid-background-paper.pdf (accessed on 27 October 2018).
- Aftab, S. Pakistan’s Energy Crisis: Causes, Consequences and Possible Remedies; The Norwegian Peacebuilding Resource Centre: Oslo, Norway, 2014; Available online: https://www.files.ethz.ch/isn/177484/ade59fba5daf67a11a1c217434abf440.pdf (accessed on 27 October 2018).
- Javed, M.S.; Raza, R.; Hassan, I.; Saeed, R.; Shaheen, N.; Iqbal, J.; Shaukat, S.F. The energy crisis in Pakistan: A possible solution via biomass-based waste. J. Renew. Sustain. Energy 2016, 8, 43102. [Google Scholar] [CrossRef]
- Boardman, B. Fuel Poverty: From Cold Homes to Affordable Warmth; Belhaven Press: London, UK, 1991; Available online: https://books.google.fr/books/about/Fuel_Poverty.html?id=HwYtAAAAMAAJ&redir_esc=y. (accessed on 27 October 2018).
- Schuessler, R. Energy poverty indicators: Conceptual issues—Part I: The ten-percent-rule and double median/mean indicators. ZEW-Cent. Eur. Econ. Res. Discuss. Pap. 2014. [Google Scholar] [CrossRef] [Green Version]
- Mahmood, R.; Shah, A. Deprivation counts: An assessment of energy poverty in Pakistan. Lahore J. Econ. 2017, 22, 109–132. [Google Scholar] [CrossRef]
- Qurat-ul-Ann, A.-R.; Mirza, F.M. Multidimensional energy poverty in Pakistan: Empirical evidence from household level micro data. Soc. Indic. Res. 2021, 155, 211–258. [Google Scholar] [CrossRef]
- Foster, V.; Tre, J.-P.; Wodon, Q. Energy prices, energy efficiency, and fuel poverty. In Latin America and Caribbean Regional Studies Programme; World Bank: Washington, DC, USA, 2000; Available online: https://citeseerx.ist.psu.edu/viewdoc/download?doi=10.1.1.557.1335&rep=rep1&type=pdf (accessed on 27 October 2018).
- Wang, K.; Wang, Y.X.; Li, K.; Wei, Y.M. Energy poverty in China: An index based comprehensive evaluation. Renew. Sustain. Energy Rev. 2015, 47, 308–323. [Google Scholar] [CrossRef]
- Nussbaumer, P.; Bazilian, M.; Modi, V. Measuring energy poverty: Focusing on what matters. Renew. Sustain. Energy Rev. 2012, 16, 231–243. [Google Scholar] [CrossRef] [Green Version]
- Ketting, N.G. Towards a sustainable energy future. Energy Policy 1995, 23, 637–638. [Google Scholar] [CrossRef]
- Sovacool, B.K. The political economy of energy poverty: A review of key challenges. Energy Sustain. Dev. 2012, 16, 272–282. [Google Scholar] [CrossRef]
- Day, R.; Walker, G.; Simcock, N. Conceptualising energy use and energy poverty using a capabilities framework. Energy Policy 2016, 93, 255–264. [Google Scholar] [CrossRef]
- González-Eguino, M. Energy poverty: An overview. Renew. Sustain. Energy Rev. 2015, 47, 377–385. [Google Scholar] [CrossRef]
- International Energy Agency. World Energy Outlook. 2012. Available online: https://webstore.iea.org/world-energy-outlook-2012-2. (accessed on 27 October 2018).
- Latief, R.; Kong, Y.; Peng, Y.; Javeed, S.A. Conceptualizing pathways of sustainable development in the union for the mediterranean countries with an empirical intersection of energy consumption and economic growth. Int. J. Environ. Res. Public Health 2020, 17, 5614. [Google Scholar] [CrossRef] [PubMed]
- Shahbaz, M. Measuring Economic Cost of Electricity Shortage: Current Challenges and Future Prospects in Pakistan; Munich Personal RePEc Archive (MPRA) Paper 67164; 2015; Available online: https://mpra.ub.uni-muenchen.de/67164/1/MPRA_paper_67164.pdf (accessed on 27 October 2018).
- Knotek, E.S., II. How useful is Okun’s law? Econ. Rev.-Fed. Reserve Bank Kans. City 2007, 92, 73–103. [Google Scholar]
- Bollino, C.A.; Botti, F. Energy poverty in Europe: A multidimensional approach. PSL Q. Rev. 2017, 70, 473–507. [Google Scholar] [CrossRef]
- Ullah, S.; Mahmood, T. Energy consumption and four growth hypotheses: An evidence from SAARC Nations. Rev. Econ. Dev. Stud. 2020, 6, 833–843. [Google Scholar] [CrossRef]
- Yu, S.; Sial, M.S.; Tran, D.K.; Badulescu, A.; Thu, P.A.; Sehleanu, M. Adoption and implementation of sustainable development goals (SDGs) in China-Agenda 2030. Sustainability 2020, 12, 6288. [Google Scholar] [CrossRef]
- Okushima, S. Gauging energy poverty: A multidimensional approach. Energy 2017, 137, 1159–1166. [Google Scholar] [CrossRef] [Green Version]
- Thiam, D.R. Renewable energy, poverty alleviation and developing nations: Evidence from Senegal. J. Energy S. Afr. 2011, 22, 23–34. Available online: http://www.scielo.org.za/pdf/jesa/v22n3/04.pdf. (accessed on 27 October 2018). [CrossRef] [Green Version]
- Papageorgiou, C.; Saam, M.; Schulte, P. Substitution between clean and dirty energy inputs: A macroeconomic perspective. Rev. Econ. Stat. 2017, 99, 281–290. [Google Scholar] [CrossRef]
- Zaman, R.; Brudermann, T. Energy governance in the context of energy service security: A qualitative assessment of the electricity system in Bangladesh. Appl. Energy 2018, 223, 443–456. [Google Scholar] [CrossRef]
- Bazilian, M.; Nakhooda, S.; Van de Graaf, T. Energy governance and poverty. Energy Res. Soc. Sci. 2014, 1, 217–225. [Google Scholar] [CrossRef]
- Khalid, I.; Mukhtar, A. Energy crisis: An issue of good governance, a way forward. J. Political Stud. 2016, 23, 101–116. Available online: http://pu.edu.pk/images/journal/pols/pdf-files/7-IRAM-ASIA_v23_1_16.pdf (accessed on 22 November 2018).
- Amjad, R.; Burki, S.J. (Eds.) Pakistan: Moving the Economy Forward; Cambridge University Press: Delhi, India, 2015. [Google Scholar]
- Van de Graaf, T.; Colgan, J. Global energy governance: A review and research agenda. Palgrave Commun. 2016, 2, 1–12. [Google Scholar] [CrossRef] [Green Version]
- Bradley, R. Comment—Defining health insurance affordability: Unobserved heterogeneity matters. J. Health Econ. 2009, 28, 255–264. [Google Scholar] [CrossRef]
- Whitehead, C.M.E. From need to affordability: An analysis of UK housing objectives. Urban Stud. 1991, 28, 871–887. [Google Scholar] [CrossRef]
- Department of Energy & Climate Change. In Annual Report on Fuel Poverty Statistics 2011; National Statistics Publication: London, UK, 2011. Available online: https://assets.publishing.service.gov.uk/government/uploads/system/uploads/attachment_data/file/48138/2181-annual-report-fuel-poverty-stats-2011.pdf (accessed on 22 November 2018).
- Khan, R.E.A.; Ullah, S. Measuring the governance in Pakistan: An introduction to KU Index. Acta Econ. 2014, 12, 23–41. Available online: http://store.ectap.ro/articole/1009.pdf (accessed on 22 November 2018). [CrossRef] [Green Version]
- Greco, S.; Ishizaka, A.; Tasiou, M.; Torrisi, G. On the methodological framework of composite indices: A review of the issues of weighting, aggregation, and robustness. Soc. Indic. Res. 2019, 141, 61–94. [Google Scholar] [CrossRef] [Green Version]
- Gisselquist, R.M. Good Governance as a Concept, and Why This Matters for Development Policy; WIDER Working Paper; United Nations-World Institute for Development Economics Research (UNU/WIDER): Helsinki, Finland, 2012. [Google Scholar]
- Brown, T.A.; Moore, M.T. Confirmatory factor analysis. In Handbook of Structural Equation Modeling; Hoyle, R.H., Ed.; The Guilford Press: New York, NY, USA, 2012; pp. 361–379. [Google Scholar]
- Snook, S.C.; Gorsuch, R.L. Component analysis versus common factor analysis: A Monte Carlo study. Psychol. Bull. 1989, 106, 148–154. [Google Scholar] [CrossRef]
- Mishra, M. Confirmatory factor analysis (CFA) as an analytical technique to assess measurement error in survey research: A review. Paradigm 2016, 20, 97–112. [Google Scholar] [CrossRef]
- Sarmento, R.; Costa, V. Comparative Approaches to Using R and Python for Statistical Data Analysis; IGI Global: Hershey, PA, USA, 2017. [Google Scholar] [CrossRef]
- Culver, L.C. Energy poverty: What you measure matters. In Paper presented at the Proceedings of the Reducing Energy Poverty with Natural Gas: Changing Political; Business and Technology Paradigms Symposium: Stanford, CA, USA, 2017; Available online: https://ngi.stanford.edu/sites/default/files/NGI_Metrics_LitReview%282-17%29.pdf (accessed on 22 November 2018).
- Pachauri, S.; Brew-Hammond, A.; Barnes, D.F.; Bouille, D.H.; Gitonga, S.; Modi, V.; Prasad, G.; Rath, A.; Zerriffi, H.; Dafrallah, T.; et al. Energy access for development. In Global Energy Assessment Writing Team, Global Energy Assessment: Toward a Sustainable Future; Cambridge University Press: Cambridge, UK, 2012; pp. 1401–1458. [Google Scholar] [CrossRef]
- Solow, R.M. A contribution to the theory of economic growth. Q. J. Econ. 1956, 70, 65–94. [Google Scholar] [CrossRef]
- Mankiw, N.G.; Romer, D.; Weil, D.N. A contribution to the empirics of economic growth. Q. J. Econ. 1992, 107, 407–437. [Google Scholar] [CrossRef]
- Doğanalp, N.; Ozsolak, B.; Aslan, A. The effects of energy poverty on economic growth: A panel data analysis for BRICS countries. Environ. Sci. Pollut. Res. 2021, 1–12. [Google Scholar] [CrossRef]
- Amin, A.; Liu, Y.; Yu, J.; Chandio, A.A.; Rasool, S.F.; Luo, J.; Zaman, S. How does energy poverty affect economic development? A panel data analysis of South Asian countries. Environ. Sci. Pollut. Res. 2020, 27, 31623–31635. [Google Scholar] [CrossRef]
- Kubik, R. Looking for the right human capital proxy. Rev. Econ. Perspect. 2010, 10, 61–70. [Google Scholar] [CrossRef]
- Khan, M.Z.; Khan, F.N. Estimating the demand for rail freight transport in Pakistan: A time series analysis. J. Rail Transp. Plan. Manag. 2020, 14, 100176. [Google Scholar] [CrossRef]
- Barro, R.J. Economic Growth in a Cross Section of Countries. Source Q. J. Econ. 1991, 106, 407–443. [Google Scholar] [CrossRef] [Green Version]
- Laverde-Rojas, H.; Correa, J.C.; Jaffe, K.; Caicedo, M.I. Are average years of education losing predictive power for economic growth? An alternative measure through structural equations modeling. PLoS ONE 2019, 14, e0213651. [Google Scholar] [CrossRef] [PubMed]
- World Bank. World Development Indicators (WDI). Data Cat. 2019. Available online: https://datacatalog.worldbank.org/dataset/world-development-indicators (accessed on 20 June 2019).
- Dickey, D.A.; Fuller, W.A. Distribution of the estimators for autoregressive time series with a unit root. J. Am. Stat. Assoc. 1979, 74, 427–431. [Google Scholar] [CrossRef]
- Phillips, P.C.B.; Perron, P. Testing for a unit root in time series regression. Biometrika 1988, 75, 335–346. [Google Scholar] [CrossRef]
- Stock, J.H.; Watson, M.W. A simple estimator of cointegrating vectors in higher order integrated systems. Econometrica 1993, 61, 783–820. [Google Scholar] [CrossRef]
- Johansen, S.; Juselius, K. Maximum likelihood estimation and inference on cointegration—With applications to the demand for money. Oxf. Bull. Econ. Stat. 1990, 52, 169–210. [Google Scholar] [CrossRef]
- Ahmad, N.; Du, L. Effects of energy production and CO2 emissions on economic growth in Iran: ARDL approach. Energy 2017, 123, 521–537. [Google Scholar] [CrossRef]
- Masih, A.M.M.; Masih, R. Energy consumption, real income and temporal causality: Results from a multi-country study based on cointegration and error-correction modelling techniques. Energy Econ. 1996, 18, 165–183. [Google Scholar] [CrossRef]
- Judson, R.A.; Schmalensee, R.; Stoker, T.M. Economic development and the structure of the demand for commercial energy. Energy J. 1999, 20, 29–57. [Google Scholar] [CrossRef] [Green Version]
- Toman, M.T.; Jemelkova, B. Energy and economic development: An assessment of the state of knowledge. Energy J. 2003, 24, 93–112. [Google Scholar] [CrossRef]
- Ang, J.B. Economic development, pollutant emissions and energy consumption in Malaysia. J. Policy Modeling 2008, 30, 271–278. [Google Scholar] [CrossRef]
- Lin, B.; Raza, M.Y. Coal and economic development in Pakistan: A necessity of energy source. Energy 2020, 207, 118244. [Google Scholar] [CrossRef]


| Dimensions | Indicators | Hypothesis | Data Source | |
|---|---|---|---|---|
| Energy Poverty Index (EPI) | Energy Services | Access to electricity, rural (% of rural population) | + | WDI * |
| Domestic crude oil production (TOE) | + | IEA ** | ||
| Total energy supply by all sources in KTOE | + | IEA | ||
| Access to electricity (% of urban population) | + | WDI | ||
| Energy use (kg of oil equivalent) | + | WDI | ||
| Clean Energy | Alternative and nuclear energy (% of total energy use) | + | PEB *** | |
| CO2 emissions (metric tons per capita) | − | WDI | ||
| Access to clean fuels and technologies for cooking (% of population) | + | WDI | ||
| Share of renewable energy (hydro production) | + | IEA | ||
| Share of non-renewable (coal consumption KTOE) | − | IEA | ||
| Biofuels and waste KTOE | − | IEA | ||
| Energy Governance | Transmission and distribution losses (electricity billion kwh) | − | PEB | |
| Generation billion KW | + | IEA | ||
| Energy imports, net (% of energy use) | − | WDI | ||
| Energy Affordability | Number of consumers of gas | + | PEB | |
| Registered four wheels out of 1000 people | + | PBS **** | ||
| Registered two wheels for 1000 people | + | PBS |
| Dimensions | Indicators | Correlation between Dimension and EPI | |
|---|---|---|---|
| Energy Poverty Index | 1/4(Energy Services) | 1/5(Access to electricity, rural (% of rural population)) | 0.92578 |
| 1/5(Domestic crude oil production (TOE)) | |||
| 1/5(Total energy supply by all sources in KTOE) | |||
| 1/5(Access to electricity (% of urban population)) | |||
| 1/5(Energy use (kg of oil equivalent)) | |||
| 1/4(Clean Energy) | 1/6(Alternative and nuclear energy (% of total energy use)) | 0.60597 | |
| 1/6(CO2 emissions (metric tons per capita)) | |||
| 1/6(Access to clean fuels and technologies for cooking (% of population)) | |||
| 1/6(Share of non-renewable (coal)) | |||
| 1/6(Share of renewable energy (hydro production)) | |||
| 1/6(Biofuels and waste KTOE) | |||
| 1/4(Energy Governance) | 1/3(Transmission and distribution losses (electricity billion kwh)) | 0.460029 | |
| 1/3(Generation billion KW) | |||
| 1/3(Energy imports, net (% of energy use)) | |||
| 1/4(Energy Affordability) | 1/3(Number of consumers of gas) | 0.95205 | |
| 1/3(Registered four-wheels out of 1000 people) | |||
| 1/3(Registered two-wheels for 1000 people) |
| Coeff | OIM S.E | Z value | P > |z| | |
|---|---|---|---|---|
| Energy Services <- EPI | 0.89 | 0.07 | 12.33 | 0.00 |
| Constant | 1.75 | 0.30 | 5.82 | 0.00 |
| Clean Energy <- EPI | 0.46 | 0.16 | 2.70 | 0.01 |
| Constant | 7.53 | 1.02 | 7.14 | 0.00 |
| Energy Governance <- EPI | 0.29 | 0.15 | 1.93 | 0.08 |
| Constant | 4.47 | 0.63 | 7.14 | 0.00 |
| Energy Affordability <- EPI | 0.98 | 0.07 | 13.84 | 0.00 |
| Constant | 2.12 | 0.34 | 6.23 | 0.00 |
| Var(e. Energy Services) | 0.20 | 0.13 | NA | NA |
| Var(e. Clean energy) | 0.80 | 0.14 | NA | NA |
| Var(e. Energy Governance) | 0.92 | 0.09 | NA | NA |
| Var(e. Energy Affordability) | 0.02 | 0.14 | NA | NA |
| Variable | Augmented Dickey–Fuller (ADF) Test | Phillips Perron (PP) Test | Remarks | ||||||
|---|---|---|---|---|---|---|---|---|---|
| Intercept | Intercept with Trend | Intercept | Intercept with Trend | ||||||
| Level | 1st Diff. | Level | 1st Diff. | Level | 1st Diff. | Level | 1st Diff. | ||
| LY | −0.11 | −3.56 ** | −2.88 | −3.46 ** | −0.32 | −3.56 *** | −2.14 | −3.47 ** | |
| LHC | −1.1 | −4.98 * | −0.99 | −5.14 * | −1.15 | −4.98 * | −1.02 | −5.16 * | |
| LEP | 0.19 | −5.05 * | −1.73 | −5.15 * | 0.21 | −5.07 * | −1.72 | −5.14 * | |
| LK | −0.26 | −4.31 * | −1.80 | −4.23 ** | −0.31 | −4.29 * | −1.96 | −4.21 ** | |
| Unrestricted Cointegration Rank Test (Trace) | Unrestricted Cointegration Rank Test (Maximum Eigenvalue) | |||||||
|---|---|---|---|---|---|---|---|---|
| Hypothesized No. of CE(s) | Eigenvalue | Trace Statistics | 0.05 Critical Value | p-Value | Eigenvalue | Max-Eigen Statistics | 0.05 Critical Value | p-Value |
| None | 0.71 | 53.44 | 47.86 | 0.014 * | 0.70 | 32.93 | 27.58 | 0.009 * |
| At Most 1 | 0.40 | 20.51 | 29.79 | 0.391 | 0.39 | 13.59 | 27.13 | 0.390 |
| At Most 2 | 0.18 | 6.91 | 15.49 | 0.588 | 0.18 | 5.39 | 14.26 | 0.690 |
| At Most 3 | 0.06 | 1.51 | 3.84 | 0.210 | 0.05 | 1.51 | 3.84 | 0.210 |
| Dependent Variable: Income | Coefficient | |
|---|---|---|
| Long-term elasticities | ||
| LEP | 0.052 *** | 2.683 |
| LHC | −0.876 *** | −30.899 |
| LK | −0.132 *** | −6.837 |
| Short-term elasticities | ||
| ECT | −0.370 * | −1.88 |
| Δ(LY(–1)) | 0.558 *** | 2.42 |
| Δ (LEP) | −0.004 | −0.08 |
| Δ(LHC(–1)) | −1.106 | −0.48 |
| Δ(LK(–1)) | 0.006 | 0.19 |
| Diagnostic tests | Test statistic | p-value |
| Jarque–Bera normality (joint) | 8.61 | 0.38 |
| Breusch–Godfrey LM test | 14.77 | 0.54 |
| (a) Variance Decomposition of GDP | |||||
| Period | S.E. | LY | LEP | LHC | LK |
| 1 | 0.02 | 100.00 | 0.00 | 0.00 | 0.00 |
| 2 | 0.03 | 96.24 | 0.96 | 0.55 | 2.26 |
| 3 | 0.04 | 89.30 | 3.92 | 1.51 | 5.27 |
| 4 | 0.04 | 85.06 | 6.19 | 2.02 | 6.74 |
| 5 | 0.05 | 83.61 | 7.08 | 2.17 | 7.14 |
| 6 | 0.05 | 83.24 | 7.33 | 2.20 | 7.23 |
| 7 | 0.06 | 82.9 | 7.49 | 2.24 | 7.33 |
| 8 | 0.06 | 82.56 | 7.69 | 2.28 | 7.47 |
| 9 | 0.06 | 82.20 | 7.88 | 2.33 | 7.59 |
| 10 | 0.07 | 81.94 | 8.02 | 2.36 | 7.68 |
| (b) Variance Decomposition of LEP | |||||
| Period | S.E. | LY | LEP | LHC | LGFC |
| 1 | 0.08 | 0.79 | 99.21 | 0.00 | 0.00 |
| 2 | 0.11 | 5.32 | 92.90 | 1.61 | 0.17 |
| 3 | 0.14 | 12.50 | 83.92 | 3.12 | 0.46 |
| 4 | 0.17 | 18.39 | 77.94 | 3.33 | 0.34 |
| 5 | 0.19 | 21.60 | 74.84 | 3.27 | 0.30 |
| 6 | 0.20 | 23.12 | 73.34 | 3.27 | 0.27 |
| 7 | 0.22 | 23.99 | 72.45 | 3.32 | 0.24 |
| 8 | 0.23 | 24.71 | 71.70 | 3.37 | 0.21 |
| 9 | 0.25 | 25.36 | 71.05 | 3.40 | 0.18 |
| 10 | 0.26 | 25.89 | 70.52 | 3.42 | 0.17 |
Publisher’s Note: MDPI stays neutral with regard to jurisdictional claims in published maps and institutional affiliations. |
© 2021 by the authors. Licensee MDPI, Basel, Switzerland. This article is an open access article distributed under the terms and conditions of the Creative Commons Attribution (CC BY) license (https://creativecommons.org/licenses/by/4.0/).
Share and Cite
Ullah, S.; Khan, M.; Yoon, S.-M. Measuring Energy Poverty and Its Impact on Economic Growth in Pakistan. Sustainability 2021, 13, 10969. https://doi.org/10.3390/su131910969
Ullah S, Khan M, Yoon S-M. Measuring Energy Poverty and Its Impact on Economic Growth in Pakistan. Sustainability. 2021; 13(19):10969. https://doi.org/10.3390/su131910969
Chicago/Turabian StyleUllah, Shafqut, Muhammad Khan, and Seong-Min Yoon. 2021. "Measuring Energy Poverty and Its Impact on Economic Growth in Pakistan" Sustainability 13, no. 19: 10969. https://doi.org/10.3390/su131910969
APA StyleUllah, S., Khan, M., & Yoon, S.-M. (2021). Measuring Energy Poverty and Its Impact on Economic Growth in Pakistan. Sustainability, 13(19), 10969. https://doi.org/10.3390/su131910969