Article

Anomaly Detection with Machine Learning Algorithms and Big Data in Electricity Consumption

by
Simona-Vasilica Oprea
1,*,
Adela Bâra
1,
Florina Camelia Puican
1 and
Ioan Cosmin Radu
2
1
Department of Economic Informatics and Cybernetics, Bucharest University of Economic Studies, Romana Square 6, 010374 Bucharest, Romania
2
Departament of Engineering in Foreign Languages, University Politehnica of Bucharest, Splaiul Independenței, No. 313, 060042 Bucharest, Romania
*
Author to whom correspondence should be addressed.
Sustainability 2021, 13(19), 10963; https://doi.org/10.3390/su131910963
Submission received: 23 August 2021 / Revised: 30 September 2021 / Accepted: 30 September 2021 / Published: 2 October 2021

Abstract

:
When analyzing smart metering data, both reading errors and frauds can be identified. The purpose of this analysis is to alert the utility companies to suspicious consumption behavior that could be further investigated with on-site inspections or other methods. The use of Machine Learning (ML) algorithms to analyze consumption readings can lead to the identification of malfunctions, cyberattacks interrupting measurements, or physical tampering with smart meters. Fraud detection is one of the classical anomaly detection examples, as it is not easy to label consumption or transactional data. Furthermore, frauds differ in nature, and learning is not always possible. In this paper, we analyze large datasets of readings provided by smart meters installed in a trial study in Ireland by applying a hybrid approach. More precisely, we propose an unsupervised ML technique to detect anomalous values in the time series, establish a threshold for the percentage of anomalous readings from the total readings, and then label that time series as suspicious or not. Initially, we propose two types of algorithms for anomaly detection for unlabeled data: Spectral Residual-Convolutional Neural Network (SR-CNN) and an anomaly trained model based on martingales for determining variations in time-series data streams. Then, the Two-Class Boosted Decision Tree and Fisher Linear Discriminant analysis are applied on the previously processed dataset. By training the model, we obtain the required capabilities of detecting suspicious consumers proved by an accuracy of 90%, precision score of 0.875, and F1 score of 0.894.

1. Introduction

The Non-Technical Losses (NTL) represent a challenge, as electricity theft is identified in both conventional meters and smart metering systems and buildings [1]. They cause significant financial losses that threaten the security of supply and lead to collective burden as NTL are included in the utility companies’ tariff and paid by all consumers in countries such as India, China, Brazil [2], Tunisia [3], Uruguay, etc. Furthermore, analyses of the smart meters data of a grid operator in the Czech Republic are performed to identify suspicious behavior [4]. Hence, resilient and performant investigations with ML algorithms or energy theft detection systems and on-site inspections are required to discourage and penalize dishonest behaviors [5].
Various approaches have been studied to identify frauds in electricity consumption. Most of them rely on supervised ML algorithms, namely classification, or combining clustering with classification. In addition, anomaly detection is performed as most of the time, the target or flag is not available. Some famous researchers in ML, namely Andrew Ng, state that anomaly detection is actually a better approach for identifying frauds, as there are fewer similarities among them that make the training impossible [6]. Furthermore, anomaly detection is indicated when the expected number of positive examples is small, as most of the consumers are normal. The large number of negative examples allows us to fit the Gaussian parameters and estimate the probability. Smart metering systems lead to different types of anomalies that are not usual for conventional meters. Therefore, they generate many types of anomalies that makes it hard for any algorithm to learn, as future anomalies may look less similar.
Thus, we identified at least two major challenges regarding fraud detection in electricity consumption. The main challenge in developing performant models for electricity fraud detection is to reduce number of false positives, meaning the consumers falsely identified as suspicious by the algorithm, and the costs associated with on-site investigations while maximizing the true positive or the real suspicious consumers. Another challenge is created by consumers that continuously steal some of the electricity they consume, as it is not an obvious anomaly, especially when the smart meter data are unlabeled.
In the proposed two-stage method that combines unsupervised and supervised ML algorithms, the first stage aims to label the data, whereas the second stage, classification with Two-Class Boosted Decision Tree and Fisher Linear Discriminant for feature selection, brings an additional validation regarding suspicious consumers initially detected by SR-CNN and an anomaly trained model based on martingales for determining variations in time-series data streams. Thus, the hybrid method both label the data and classify the consumers. Compared with the method without classification, the hybrid method increases the accuracy of the model by providing more confidence based on metrics. For example, in case anomaly detection identifies a suspicious consumer (labeled with 1), and the classification methods also classify it as 1, there is clearer evidence that the consumption is fraudulent, and the consumer should be verified onsite. Otherwise, if anomaly detection indicates 1 and classification indicates 0, then the suspicion is not confirmed, and the utility company may choose not to investigate further.
The benefits of classification as a second stage include the following: validation of anomaly detection, bringing more confidence, reducing the costs of onsite investigation, and training the utility company’s employees to conduct such investigations. In our hybrid method, the classification model is quite helpful, providing consistent metrics such as an accuracy of 90%, precision of 0.875, and F1 score of 0.894.
The results of the two unsupervised methods, namely SR-CNN and an anomaly trained model based on martingales for determining variations in time-series data streams, are compared, indicating the best combination of a hybrid approach. Therefore, in comparison with anomaly detection only, the proposed method including a classifier adds more value and increases the confidence of analyses on smart metering consumption data.
This paper is structured in six sections. The second section provides a literature survey of the most recent studies and research; the third section describes the data transformation methodology proposed for electricity anomaly detection in a smart grid environment. It consists of the workflow design and instrumentation stage. The fourth and fifth sections are dedicated to the implementation of the algorithms and simulations with real consumption, using large datasets that are available courtesy of the Commission of Energy Regulation (CER) and Irish Social Science Data Archive (ISSDA). Conclusions are drawn in the final section.

2. Literature Survey

A robust multitask feature extracting fraud detector and a deep learning model (combining a de-noising autoencoder [7] with a deep Siamese network and a day discriminant network) are proposed to manage high-dimensional data and identify consumption patterns [2]. The model is trained, using half-hourly smart meter records of over five thousand Irish consumers for 535 days, with significant results weaving the advantages of supervised and unsupervised ML algorithms. It evaluates the false positive rate and recall with a semi-supervised approach.
Another study that handles the Irish consumption dataset uses a pattern-based anomaly detector, combining clustering and classification techniques that improve the predictability of normal and suspicions consumers identifying non-malicious changes in consumers profile by investigating a small sample of data [8].
Classification algorithms can be useful to detect suspicious consumers [9]; however, most of the time, labeled data are not always available, and synthetical malicious data are not efficient in detecting issues in consumption data [10]. Using an Artificial Neural Network (ANN), the current consumption is repeatedly compared with the forecast or typical profile, and if the difference is over a threshold, a suspicion is raised. Furthermore, recent works using deep learning models and dynamic mode decomposition techniques for probabilistic and short-term load forecasting are proposed in [11,12]. A forecasting method based on gradient boosting neural networks is proposed for network traffic classification that can be adapted for electricity consumption forecast as input for fraud detection [13].
The efficiency of the detection methods (Support Vector Machine (SVM), Random Forest (RF), which proved to be the best in this study, and ANN) are assessed considering the fines amount and on-site inspection costs. This approach is formulated as a versatile pipeline method and validated with real data from Uruguayan consumers and increases the profit and assists with planning the budget for the NTL of the utility company [14].
Six steps are implemented for anomaly detection in smart metering data [4]. First, data segmentation is performed as creating datasets per day and per smart meter. Then, the association rule mining is applied to identify frequent events instances with an A Priori algorithm. Third, the set of most frequent events is selected from more than one data segment, whereas less frequent events are assimilated with suspicions. Fourth, additional contextual data are augmented to the previous step. Fifth, clustering with clustering silhouette thresholding is performed to detect anomalous behavior. Sixth, the less frequent events are analyzed and clustered to verify if they fit into the existing clusters.
Different deep neural networks architectures are proposed in [15,16] computing the mean per-class error to assess the performance on multiple datasets and identify the consumption anomalies. Deep multilayer perceptron, fully convolutional networks, multi-convolutional neural networks, and residual networks are evaluated together with other classification specific algorithms for time-series [17] such as Bag-Of-SFA-Symbols in Vector Space (BOSSVS).
The XMR charts method is applied to time series to detect fraud [18] in a set with consumption data recorded between 2005 and 2012 of 106 Serbian customers. In 93.4% of the time series with suspicions, the XMR charts successfully indicate an abnormal consumption pattern. It is essential to analyze regular readings; otherwise, this approach affects the Moving Ranges (MR) component of the charts that is the difference of the two consecutive X values.
Linear programming is applied to reduce the NTL and false positives by considering the impact of technical losses in smart grids. In this sense, two novel anomaly detection schemes for smart metering systems and two metrics, loss factor and error term, are suggested to calculate technical losses. Suspicious consumers or malfunctions in smart meters can be identified even if the NTL is intermittent [19]. This approach considers the equilibrium of quantities at the substation level, meaning that the sum of energies that exits the substation plus technical losses should be equal with the energies that entered. Otherwise, theft and/or malfunction of the smart metering system occur.
An electricity theft detection method using interpolation for missing data, empirical mode decomposition, and K-Nearest Neighbors (K-NN) that is adequate for a time series is proposed in [20] using a labeled dataset provided by State Grid Corporation of China that consists of over 42,000 of daily time series that stretch over 1035 days. Time-series feature extraction is implemented underlying the most significant features for the classification process. Outliers and unbalanced data are adjusted with a simple approach considering the mean and standard deviation, respectively the Synthetic Minority Oversampling Technique (SMOTE), Adaptive Synthetic (ADASYN) sampling approach, etc. Some other approaches are emerging with the progress of IoT and fog technologies [21,22], regularly analyzing data steaming. The idea is to catch the irregularities in consumption and perform on-site verifications in a short time interval, compared with the classical way of analyzing larger datasets and performing more analyses that could bring a serious time gap between the problem identification and inspection.

3. Materials and Methods

The ML is supportive for optimizing the screening processes of fraud use cases. From the research perspective of the impact of our proposed methodology, we have used smart meter electricity data from Ireland. Our main objective is the maximization of the provided services and minimization of potential electricity leaks. By appealing to the advanced and real-time analytics and using the ML algorithms, we foster the efficiency of different cross areas, such as fraud and risk management, the dynamics of the operational services, anomaly detection, and fast adjustments of the energy economics, based on close monitoring of supply and demand.

3.1. Workflow Design Considerations

In the energy system, electric power is the vector for the end use for the household services. The new era of smart energy industry offers unprecedented opportunities to ensure predictive, scalable, and reliable services. To sustain the technical deep dive in this direction, we develop our paradigm as a computational model based on ML algorithms for data platform modernization for electricity consumption.
In general terms, the data science process comprises several steps of iterations: (a) the overview of the business needs; (b) perspectives of data collection; (c) data processing; (d) implementation of the analytical results; and of course, the validation of the delivered methodology. We applied the same hypothesis with the goal of deploying the ML model to obtain anomaly detection capabilities and predictive analytics for electricity consumption, as detailed in the proposed workflow in Figure 1.
We define the lifecycle of ML methodology regarding the electricity consumption that we followed, starting from the business need for the utility companies to detect malfunctions or suspicious consumption behavior that could uncover a fraud. The next step consists of data acquisition converted in datasets further offered as a pipeline, from which the key variables are subtracted for the architecture developed as a solution. In the energy sector, collected data will consist of consumptions in time frames. Further on, the data are explored and cleaned through different mechanics. For example, this will involve transforming and editing data formats from the meters measurements, converting timestamps data, importing them in a suitable form to be incorporated in databases, reviewing data, and subtracting consistently the most relevant one. After the tuning stage is finished, the trained algorithms can be next exploited to model data. The last two stages mentioned constitute the pre-processing part of the workflow. After the analytical data are validated, it can be further consulted to flag up consumptions that can be considered normal or anomalies in the last post processing stage. In the end, the results can be scaled out for featuring decisional actions.
We consider moving forward with a more granular perspective, for the type of algorithms of the ML that can be used, and we focus on the identification of the following core components applied on the electricity consumption evaluation described in the data science assessment methodology for electricity consumption (as in Figure 2).
In general terms, this methodology comprises the outlined key points (objectives: forecasts, identification of anomalous patterns, data segmentation, and potential forecasts for the type of consumers; and methods: anomaly detections in time series, data clustering and classifications for potential fraud points). The ML models for electricity consumption evaluations make use of supervised and unsupervised algorithms. The supervised ones cover for example regressions and classification (we will adjust these methods on our hybrid proposed framework and make use of the suitable methods for our analysed dataset), whereas in unsupervised learning, the datasets lack labeling. Therefore, an unsupervised algorithm will need additional information to organize data in a manner that will allow a correct strategy implementation to achieve the retrieval of the most important points of interest [23].

3.2. Instrumentation Stage

3.2.1. Pre-Processing Data

Our methodology will focus on data that have no labels, so the implementation of unsupervised algorithms will be necessary. The raw data contain smart meter readings for almost 4300 households from Ireland, which are collected over 2 years with the following details: Meter IDs, five-digit codes for timestamp codification (such as day code: digits 1–3, time code: digits 4–5 for 1–48 for each 30 min with 1= 00:00:00–00:29:59–in a format such as: RowNumber, DateAndTimeFormat, Consumption:0,2009-09-25T01:30:00.0000000,0.13) and electricity consumption for 30 min intervals, measured in kWh. Thus, we manage the date time conversion with the CAST function.
The consumption data have 157,992,996 rows and contain measurements from smart meters. We will also include codes for tariff categories according to residential areas, such as Residential stimulus (Control, Bi-monthly detailed bill, Monthly detailed bill, Weekend tariff), Residential tariff, and Small and Medium Enterprise (SME) allocation for residential smart meter electricity participants.

3.2.2. Data Transformation

Our approach proposal will make use of a mix of unsupervised and supervised algorithms. The hybrid methodology can be applied to any dataset (labeled or unlabeled) for electricity consumption to detect anomalies and make fraud classifications. Therefore, we aimed to detect with the unsupervised algorithms the predominant consumption anomalies within the group of consumers and to decide the benchmarks for potential frauds for the meter readings. The remote data-driven insights will determine the top k meters with potential fraud readings for the selected time frames. Those readings can be analyzed and flagged accordingly considering a threshold for detecting the anomalies. At this stage, we transform the complex data into a simpler and more organized form and select thresholds that can be used for supervised algorithms to determine suitable predictive consumption solutions for targeted consumers clusters.
In summary, for data modeling, various ML algorithms can be run in parallel. For our strategy, the selected model highlights that the anomaly detection with the unsupervised learning and fraud classification for the meter readings with supervised learning represents a reliable solution.

3.2.3. Feature Extraction

Once we run out the unsupervised algorithms on our set of data, we establish a threshold, considering that if more than 15% of the data points in the time series are detected as anomalies, we mark the respective electricity consumption meter as suspicious and we label it for further analysis. From this point onwards, we can apply supervised learning algorithms to predict if a certain household is likely to be fraudulent.
We factor out that the feature selection process needs to also be included, since the collected datasets incorporate large raw datasets, and we implement a suitable framework to achieve data refinement for any type of smart meter measurements. The scope is to propose a framework applicable to any data input type to obtain normalized and minified datasets while keeping essential features for optimizing computational costs and boost performance.
From the electricity consumption perspective, for the state-of-the-art model, we propose a framework to reduce any type of the dataset to one that contains only valuable features. When data with many features are available, it is helpful to have a pre-existing algorithm that helps transforming and choosing relevant information for training the model. This is an iterative process that frequently must be run to ensure that the most suitable information continues to be used. This is how issues such as missing values, data and feature redundancy, duplication, or high correlated variables (a phenomenon called multicollinearity [24]) are avoided.
In our proposed model, we also obtain the labeled data for meters: marked as suspicious or non-suspicious, labeled with “0” or “1”, and other features such as measurements, anomalies, codes residential-tariff allocation, residential-stimulus allocation, and SME allocations. Using this dataset, we determine the most suitable algorithm to be included for the feature extraction. There are several models, such as Kendall’s or Spearman’s correlation coefficient [25].
In Table 1, for the experiment, we chose and compared the most applicable ones for the feature selection algorithms: Chi-squared statistics, which helps identify how close the expected results are to the actual ones, and Fisher score, which scores how much information can be provided based on others, to identify the most predictable feature columns to be used for the meters marked as suspicious.
To obtain the scores from Table 1, we evaluated the chosen models against the mentioned feature columns from our labeled dataset, such as Anomalies, Residential-stimulus allocation, Residential-tariff allocation, and SME allocation. For these algorithm results, we needed the labeled columns and feature columns only with numerical data for Fisher scoring. We transformed the used raw data as detailed in Section 3.2.1 and Section 3.2.2 and pre-processed dataset transformations to be eligible for the feature selection methods. The dataset input format for the feature selection algorithm will have the following structure, as outlined in the sample extract from Figure 3.
As seen in the above Figure 3, the already transformed dataset contains information for meter ID, measurements taken per meter, anomalies detected, codes, residential-stimulus allocation, residential-tariff allocation, SME allocation, and suspicious activity. The input data used for the Chi-squared and Fisher score statistics were already transformed. Our proposed data transformation stage was included in our hybrid methodology and can be applicable for most of the electricity consumption unlabeled raw dataset formats. Our main contribution is the proposal of a hybrid methodology that comes against the challenge of obtaining valuable information, such as fraud predictability indicators only from unlabeled data. By being able to apply supervised learning and training models on transformed label datasets, we enhance data computation capabilities with outcomes such as the likelihood of fraud for a consumer, based on contract parameters. Such results could not have been obtained by only training unsupervised ML models. This is due to be demonstrated in our state-of-the-art hybrid methodology approach from Section 4 and the experimentation part from Section 5.
For both Chi-squared and Fisher Linear Discriminant statistical approaches, the input data had to be valid and normal distributed, the algorithms expecting only unique numerical values for Fisher and all data types for Chi-square. For data that do comply with the rules, error status codes will be returned. Therefore, the data transformation processes for obtaining suitable input datasets played an essential role.
We run the experiments for both algorithms against the same selected columns. These experiments had the goal of using statistical methods to determine the features of the dataset, with the best predictability for the data output. We will further outline how the statistical methodologies were run out for consumption dataset inputs.
The Chi-squared algorithms evaluate how near the expected outcomes are to the end results. The algorithm starts with the presumption that all the parameters are arbitrary and deducted from samples with autonomous parameters. The Chi-squared experiment, in the context of the used data samples for electricity consumption, is a random distribution of households/consumers to groups, representing normal consumption and suspicious consumption. We consider that there are k groups; the first one represents the normal consumption and the remaining k−1 correspond to suspicious consumption. We denote with n the total number of consumers from the experiment and O i the number of consumers we study from the mentioned groups, with i taken values from 1 to k. The statistical method will consider the group of normal consumption corresponding to the O 1 studied consumer, the suspicious group 1 corresponding to the O 2 consumer, and the suspicious group (k−1) corresponding to the O k consumer. The goal is to prove that the initial hypothesis is expected under the null assumption that there are arbitrarily distributed consumers to each group. There is also an expectation that we will have a portfolio of q i consumers of each of the n users to be arbitrarily distributed to i, which takes values from 1 to k. In this case, there will also be E i = n q i to be distributed to each group, so that O i E i is insignificant to the expected outcome E i . The difference between the studied and expected outcomes from each group will be counted as ( O i E i ) 2 E i . Applying the same for all the groups, with i = 1, …, k will provide the measurement of how reliable the studied outcomes are from the expected results. This statistical model behind the scores was obtained by applying the following:
R e s u l t k 1 2 = i = 1 k ( O i E i ) 2 E i = i = 1 k ( O i n q i ) 2 n q i .
The score will represent the indicators for predictive features on the data output. In the model, if the number of extracted features is greater than the columns from the input dataset, then all the features will be returned. If in the algorithm we chose fewer outcome columns and then the number of desired features, the extracted features will be rated in descending order.
The Fisher statistical method provides the volume of information that one parameter can give about the unexplored other variables on which it relies. The Fisher Linear Discriminant Analysis algorithm narrows down data dimensions, since it identifies and places a combination of features onto a reduced feature dimension workspace, but it still considers the data that distinguish between classes [26]. The computational principles of this algorithm are based on the inputs (so-called eigenvectors [27]) and resulted outputs (transformed feature workspace for the eigenvectors).
The statistical methodology of Fisher is used for the consumption data input. We have labeled data, which are marked as suspicious or not. Since the dataset dimensionality is high, we will be applying the statistical method to reduce the dimensionality of the trained data, and the Fisher model is the best one to be used to keep the discriminative information throughout dimensionality reduction. The algorithm is to be applied for handling the consumers marked as suspicious or not. There is a subroutine on which the Fisher method is being used. If we denote the following input vectors { v i } from the dimension dim, and we have a set of classes C l a s s n = { i   | v i   b e l o n g s   t o   c l a s s   # n } for each n = 1 , , N , N representing the dataset dimension space, we will obtain the output vectors { r i } [26]. The corresponding subroutine for dimension space reduction is the following:
    f o r   k = 1 : d im
     f o r   i = 1 : s i z e ( { v _ i } )
        r i = Eliminate   k t h   component   of   vector ( r i )
        R e s u l t k = F i s h e r ( { r ( k ) i } , { C l a s s n } )
     e n d
    e n d
     If M is defined as M = max k R e s u l t k then:
    f o r   i = 1 : s i z e ( { v i } )
       r i = Eliminate   M t h component   of   vector ( v i )
e n d .
We run out the Fisher feature model by selecting the columns outlined in Table 1. We also defined the number of feature extractors as the number of the extracted columns that we expected as outcome. Thus, we chose 2. If the feature selection was to be 0 for n columns defined as input, there would have been n features selected as new data values for the n dimension space.
We experiment with the Fisher Discriminant Analysis for the labelled data as explained above for two feature extractors. The feature columns from the datasets relevant for the suspicious meter identification are obtained with the following statistics, optimally splitting the data based on the computational statistics (mean, median, min, max, standard deviations, and missing values) as in Table 2 and Figure 4.
Both methods scored highly for anomalies, being the most relevant feature to be used as relevant information for the dataset, with a Chi-square of 93.59 and Fischer score of 1.05 (as in Table 1). The proposed methodology is a demonstration of the phases that must be undertaken for even more complex and various datasets, where data inputs with the highest predictability power must be identified. By applying the feature extractor technique, the data with the suspicious categorization will be prepared for the ML models for electricity consumption fraud predictions.

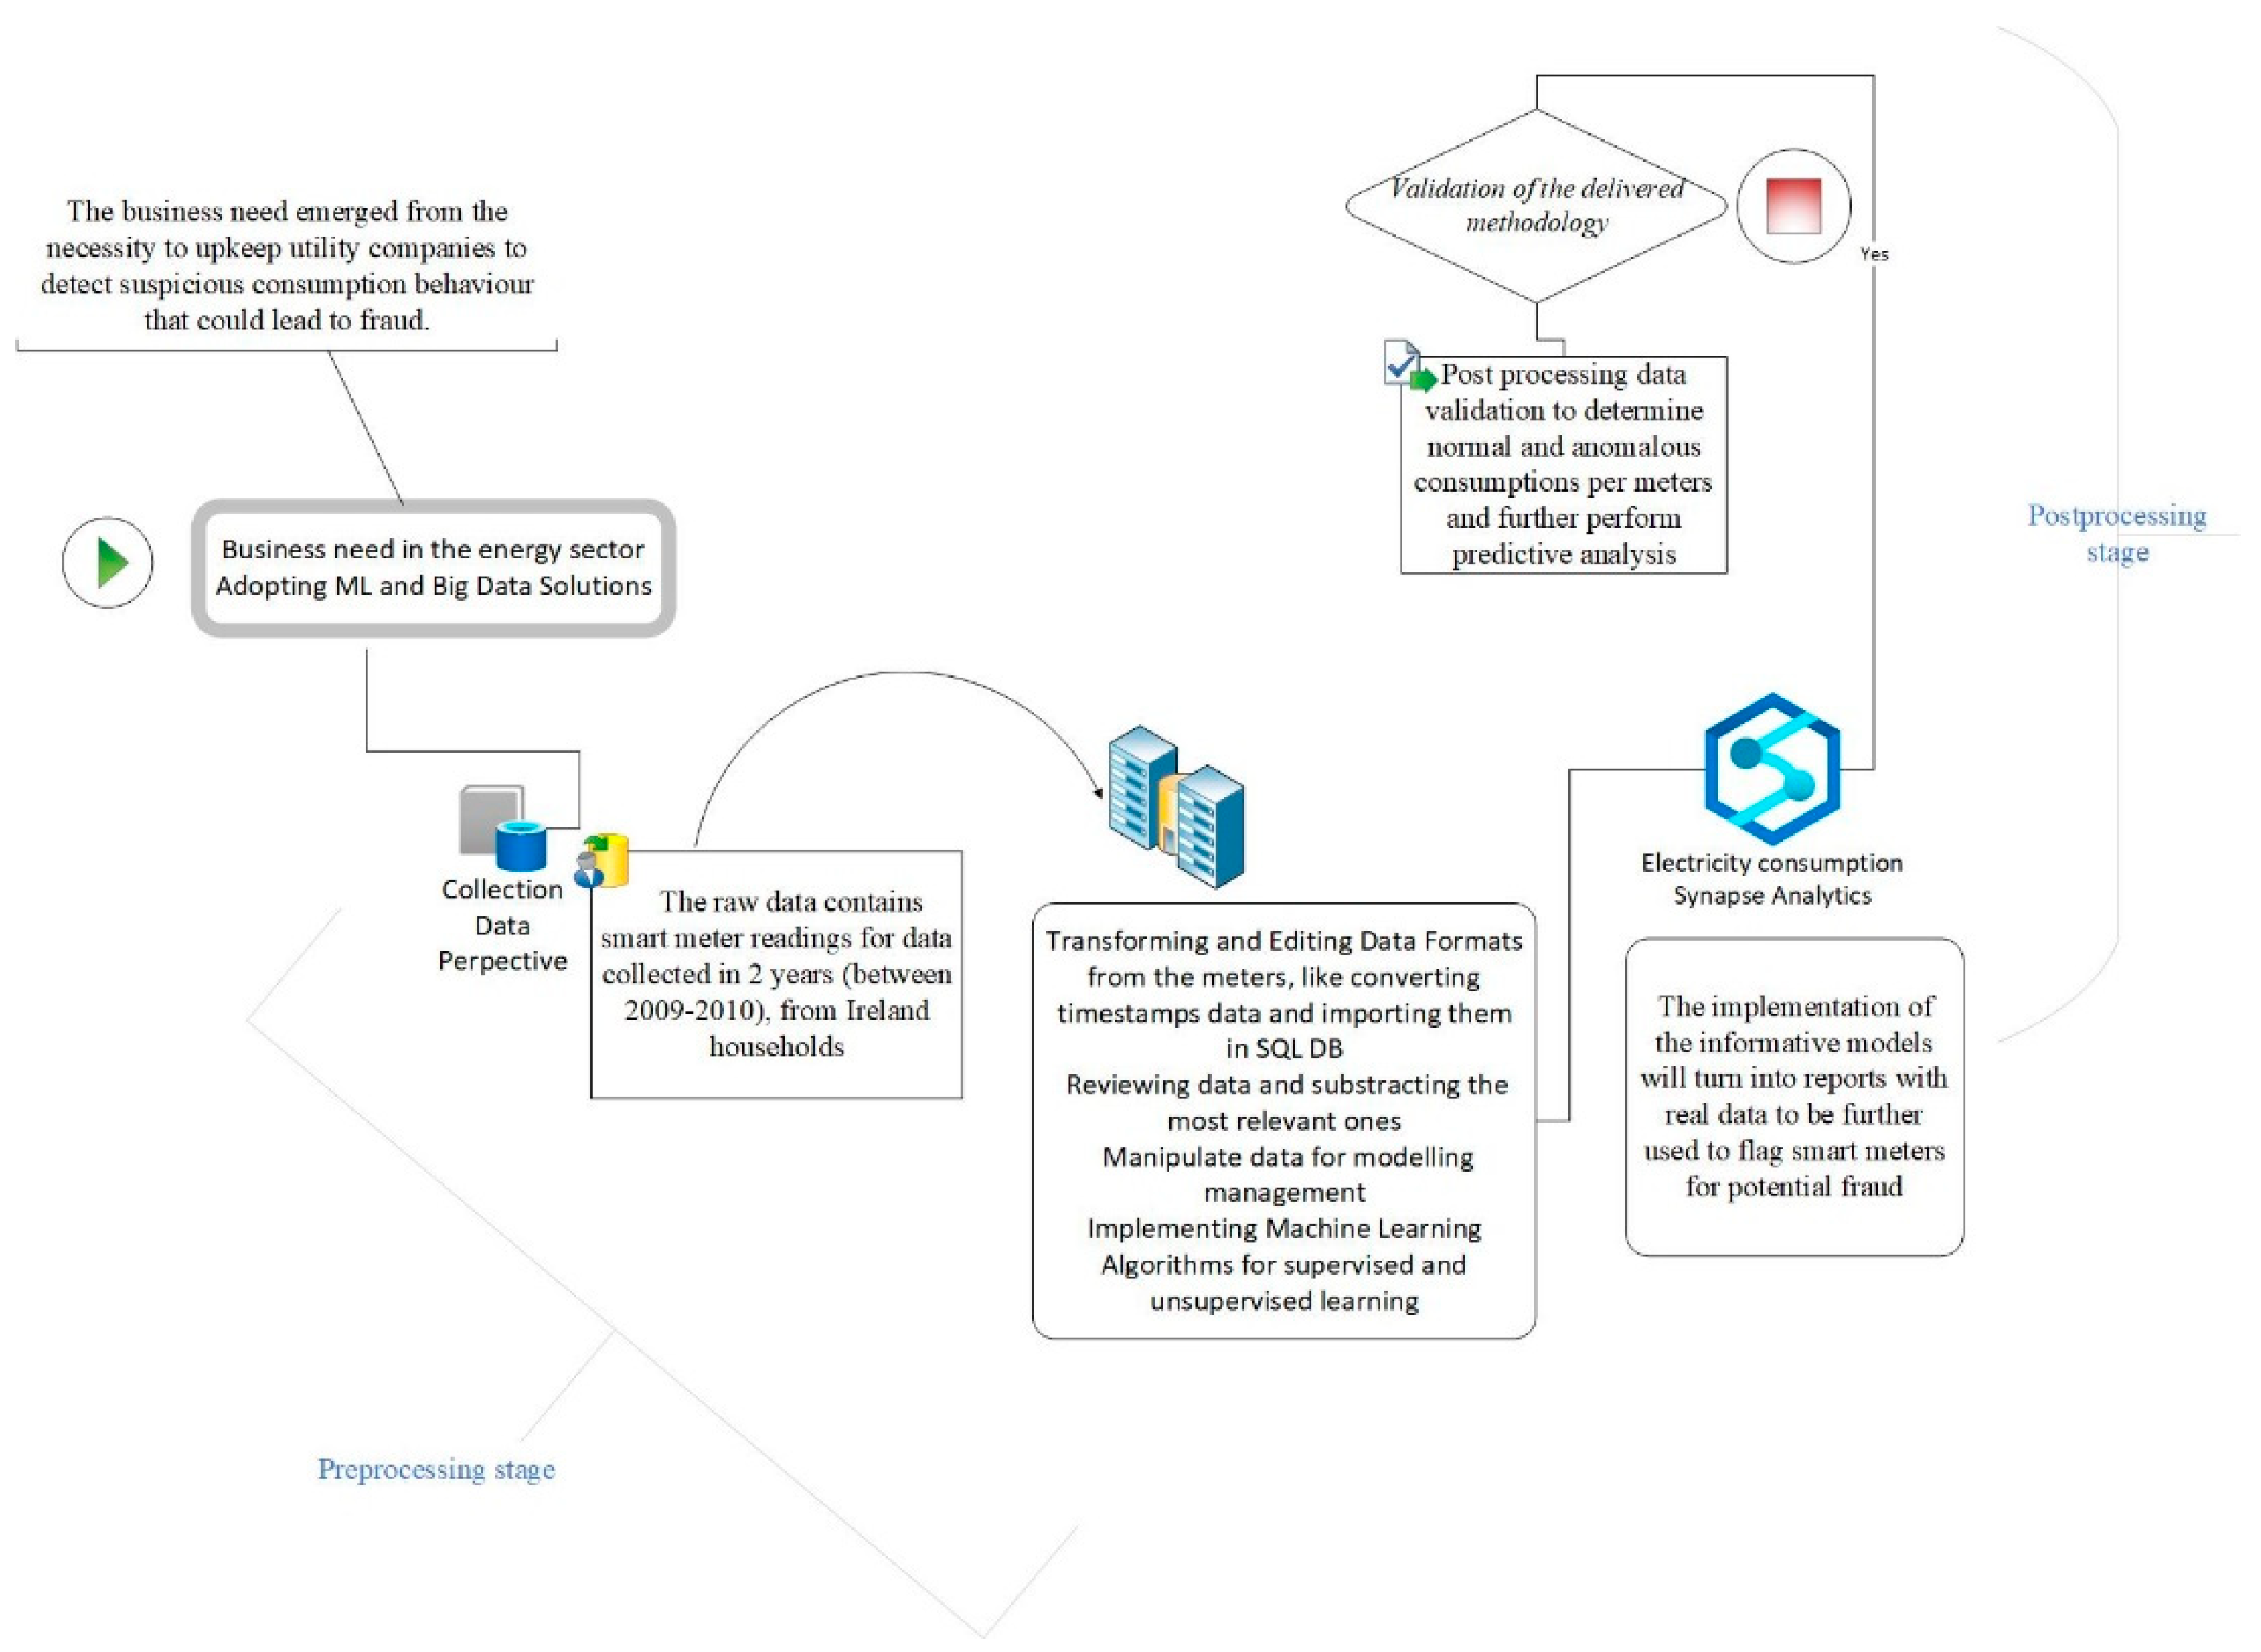
4. Implementation of the Proposed Approach

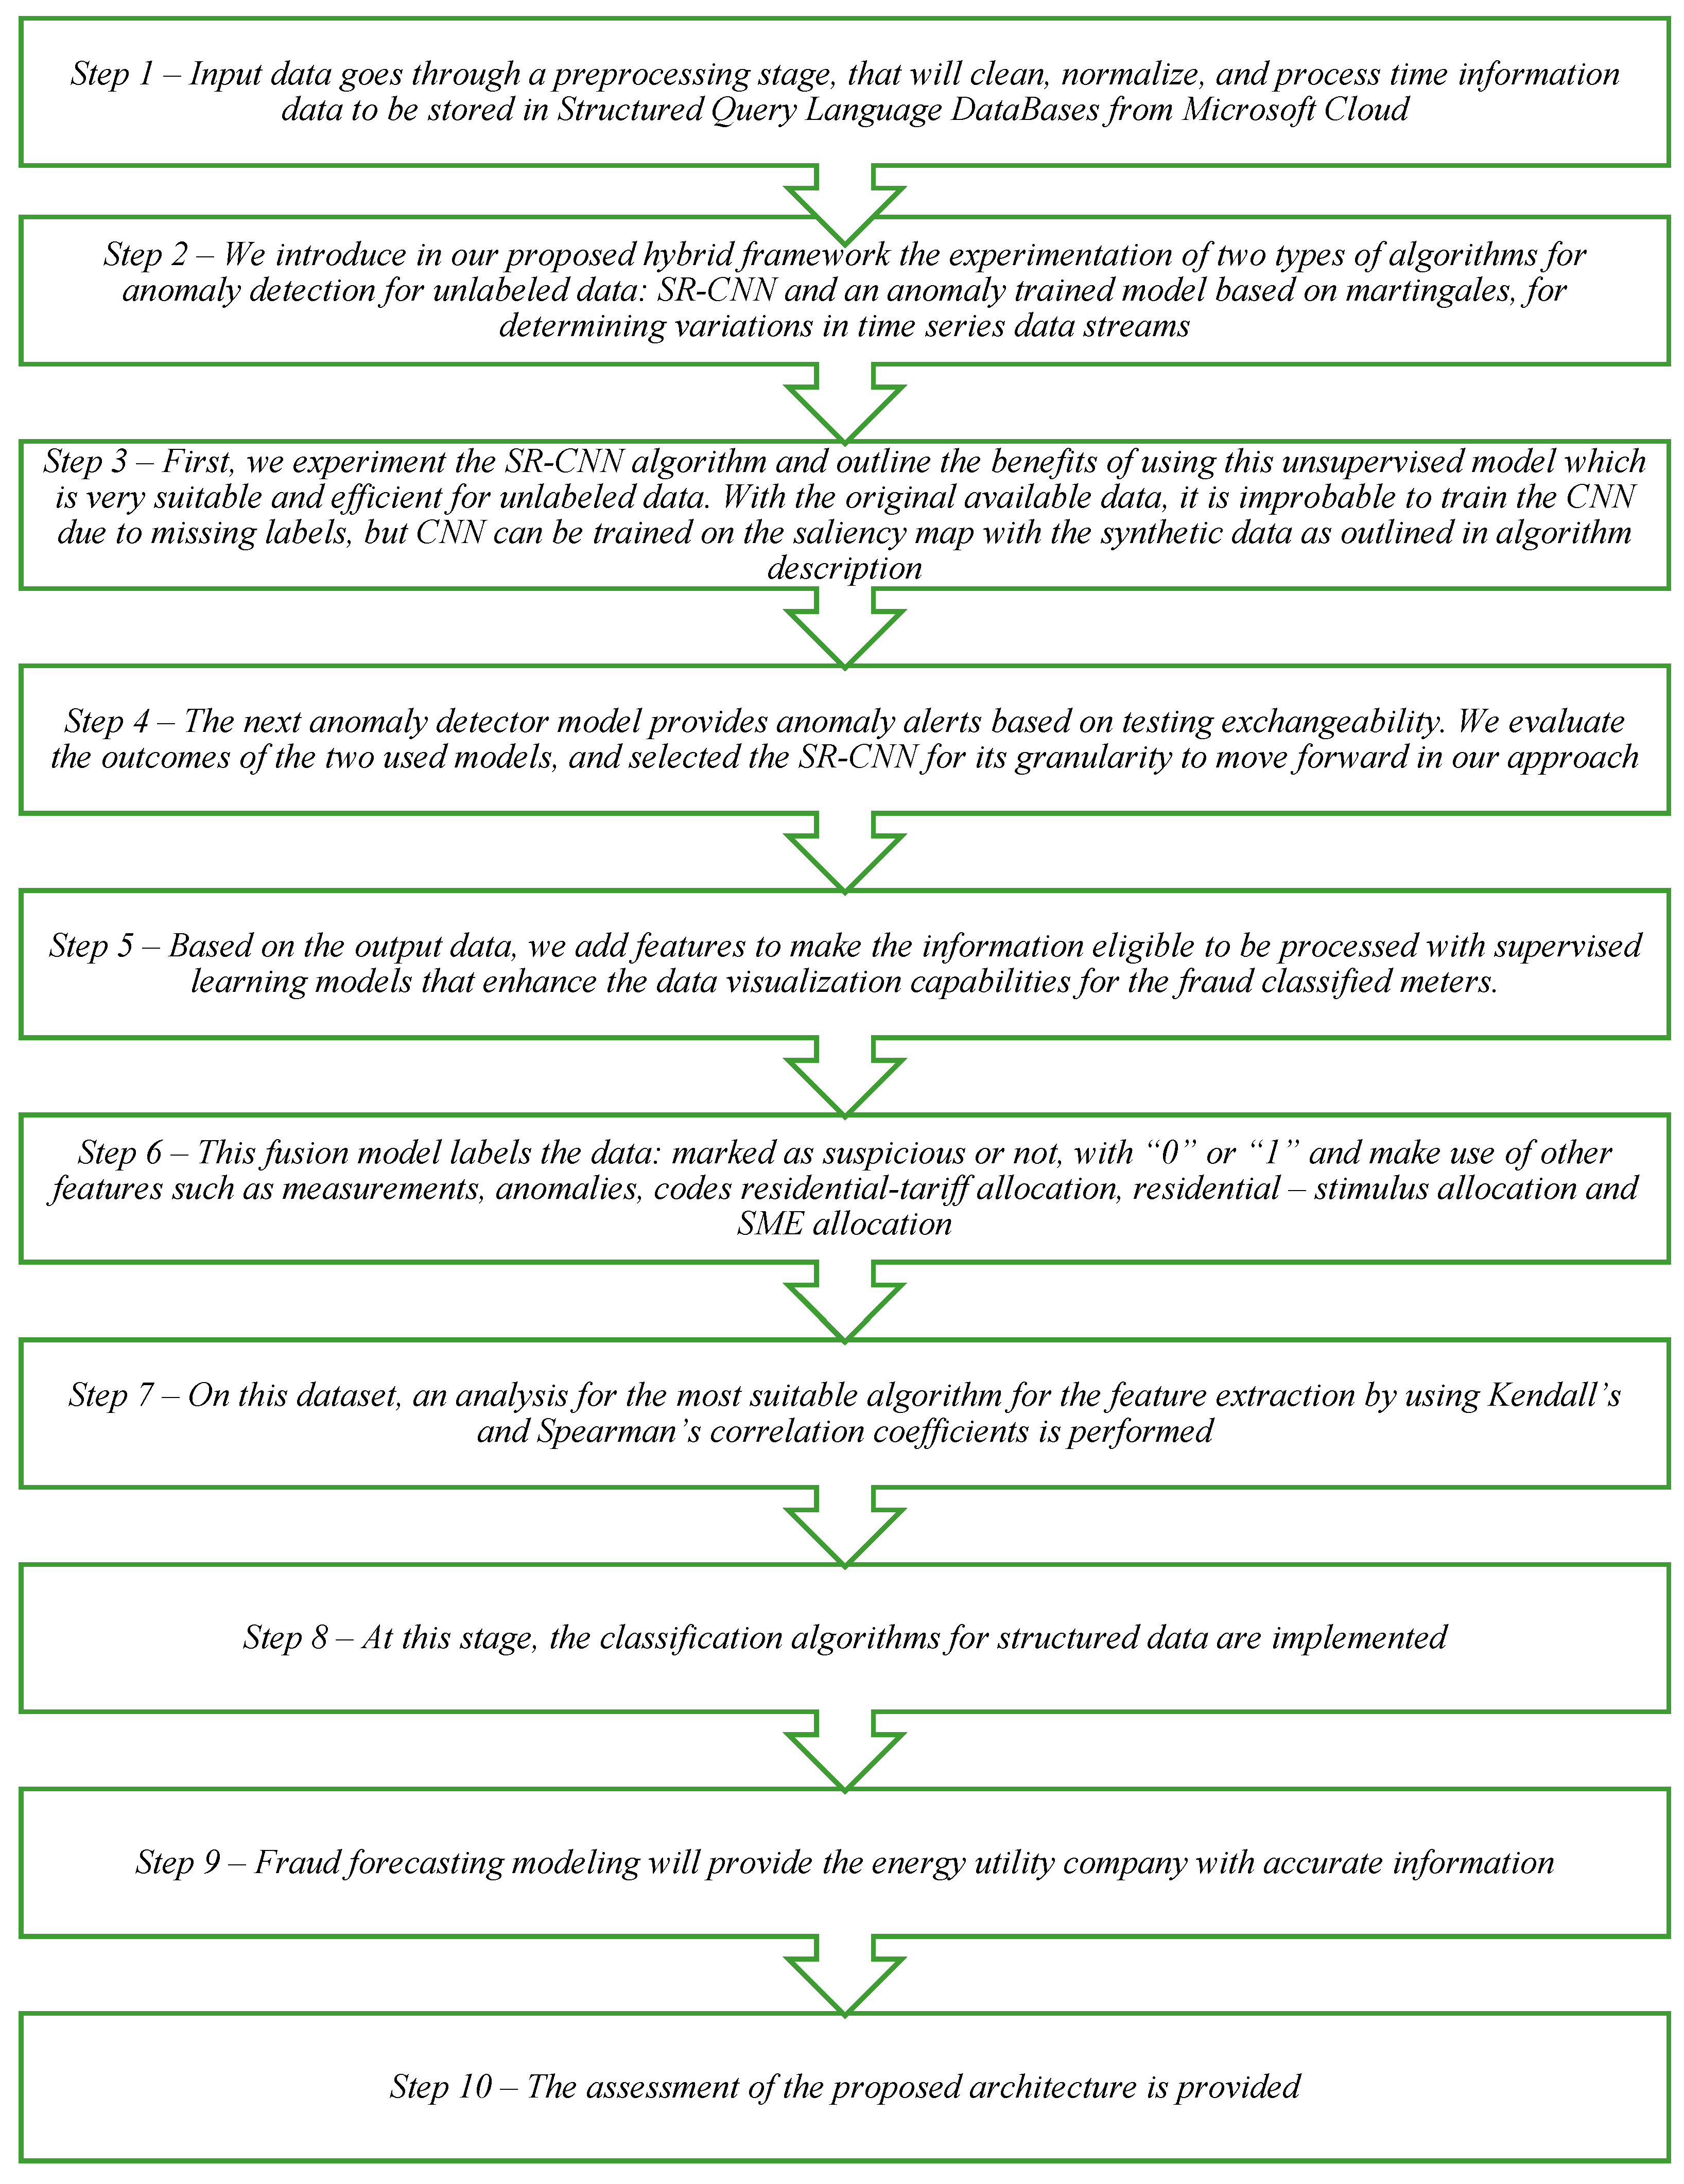
We propose a combined architecture of different ML models that covers the challenge of handling the generalized information from unlabeled raw datasets for anomalous detections for electricity consumption. We propose a hybrid framework that handles the initial unlabeled data with unsupervised ML models and then the application of supervised algorithms for fraud classification with the intention of obtaining predictive analysis. This proposed framework methodology offers easy data ingestion and transformation workflows and implements the most context-suitable ML models, within the following sequential steps (as in Figure 5).
The novelty of our contribution to the above framework comes from the hybrid approach in two stages. First, we identify the anomalies in an unlabeled time series with the SR-CNN algorithm, and then, we label it as suspicious or not, by establishing a threshold for labeling, when more than 15% of the data points in the time series are detected as anomalies. Two unsupervised ML methods are used for detecting the anomalies in the time series, and their performance is then compared. In the second stage, we use the now labeled time series and associate their tag with the contract offers the consumers have. Since now we have labeled data, supervised ML can be used for training a model that is able to detect the likelihood of someone committing a fraud based on the different parameters of their contract. For this task, we are using a two-class boosted decision tree. The methodology logic and implementation steps are detailed in this section. Considering the targeted multitude of set points { p 1   ,   p 2 ,   ,   p n } with the distributed features f 1 ( 1 ) ,   f 2 ( 2 ) ,   , f n ( n ) , the anomaly detection is the process of identifying data points that are deviating from the normal pattern in the dataset. The training models t ( p e x p e r i m e n t ) will classify the points that are normal or anomalies, based on a computed probability and an established limit, such as if t ( p e x p e r i m e n t ) l i m i t , the anomaly is outlined, else, if t ( p e x p e r i m e n t ) > l i m i t , a normal flag will be provided [6]. For the anomaly detection methodology, there are several ML models for different classified groups such as nearest-neighbor based algorithms, local correlation integral, K-NN, influenced outliers, connectivity-based outlier factor, and local outlier factor; classification-based techniques include Bayesian Networks, ANN, Decision Tree; statistic-based techniques include parametric and non-parametric models; and clustering-based algorithms include local density cluster-based outlier factor and cluster-based local outlier factor. The approaches for anomaly detection can consist of ANN (Autoencoder), Principal Component Analysis, Multivariate Gaussian Distribution, One-Class SVM, or Neural Nets [28].
By monitoring the electricity consumption half-hourly, the anomaly detection method will be applied for an univariant time-series model. Therefore, we utilize as a deep learning model the Spectral Residual-SR model from the visual saliency detection field. The Convolutional Neural Network (CNN) model is due to learn a discriminative rule on the saliency map, train through automatically generated anomalies, arbitrarily choose points in the time series, and compute the injection value to substitute the original point. The injection value will be calculated as:
x = ( x ¯ + m e a n ) × ( 1 + v a r ) × r .
This model has a high predictability for the electricity consumption evaluation [29].
The principles of the SR-CNN unsupervised algorithm are the following: (1) Fourier Transform (F) to acquire the amplitude spectrum; (2) Computation of SR; and (3) Transposed F that metamorphosizes the grouping to the spatial dimension [30]. The mathematical model behind a sequence x, which is an input sequence with the shape n × 1, consists of the following:
A ( f ) = A m p l i t u d e ( F ( x ) )
P ( f ) = P h r a s e ( F ( x ) )
L ( f ) = log A ( f )
A L ( f ) = h n ( f ) × L ( f )
R ( f ) = L ( f ) A L ( f )
S ( x ) = F 1 ( exp ( R ( f ) + P ( f ) ) 2 )
n f ( f ) = [ 1 1 1 1 1 1 1 1 1 1 1 1 ]
A ( f ) —amplitude spectrum of a sequence x;
P ( f ) —corresponding phase spectrum of a sequence x;
L ( f ) —log representation of A ( f ) ;
A L ( f ) —average spectrum of L ( f ) , which can be approximated by convoluting the input sequence by h n ( f ) -an n × n matrix defined as n f ( f ) ;
R ( f ) —spectral residual;
S ( x ) —saliency map.
In parallel, we also experiment with the Machine Learning Studio trained model for anomaly detection and compared the outcomes. This model covers the challenges of obtaining fake anomalies from time-series data with changing data values. The proposed model adds to two mechanisms for evaluating fluctuations from time-series trends: (1) assessing the magnitude of variations (if, for example, the consumption for a meter looks stable for a given timeframe, and after a while, a significant decrease is spotted), and (2) computing the timings and directions of the variations.
The configuration of this model implies connections with the provided time-series data. There is the possibility to transform the data with the Structured Query Language (SQL) Transformation Module or perform a conversion with the Execute R. Afterwards, the anomaly detection model can be adjusted with the selection of the martingale function, which is used to manage the reactivity of the anomaly detector, the strangeness function (which can be RangePercentile, SlowPosTrend, and SlowNegTrend), the strangeness values to establish the history window, and the alert threshold for anomaly scoring, which measures the probability of encountering the time-series anomalies. The mathematical approach for martingales in this model comes from [31]. Martingales are classes of arbitrary variables V 0 ,   V 1 , ,   V n ,   n = 0 , , M n , with weighable functions f 1 ,   f 2 , , f n , where V 0 is a constant and V n E   ( V n + 1 | V 1 , V n ) for a martingale M n = E ( V n + 1 | V 1 ,     ,   V n ) . When defining a class of martingales, the above-mentioned power martingale is indexed by ε [ 0 ,   1 ] , where p n are arbitrary martingales with an initial value 1:
M n ( ε ) = i = 1 n ( ε p i ε 1 )
and ε can be eliminated with the usage of the following:
M n = 0 1 M n ( ε ) d ε .
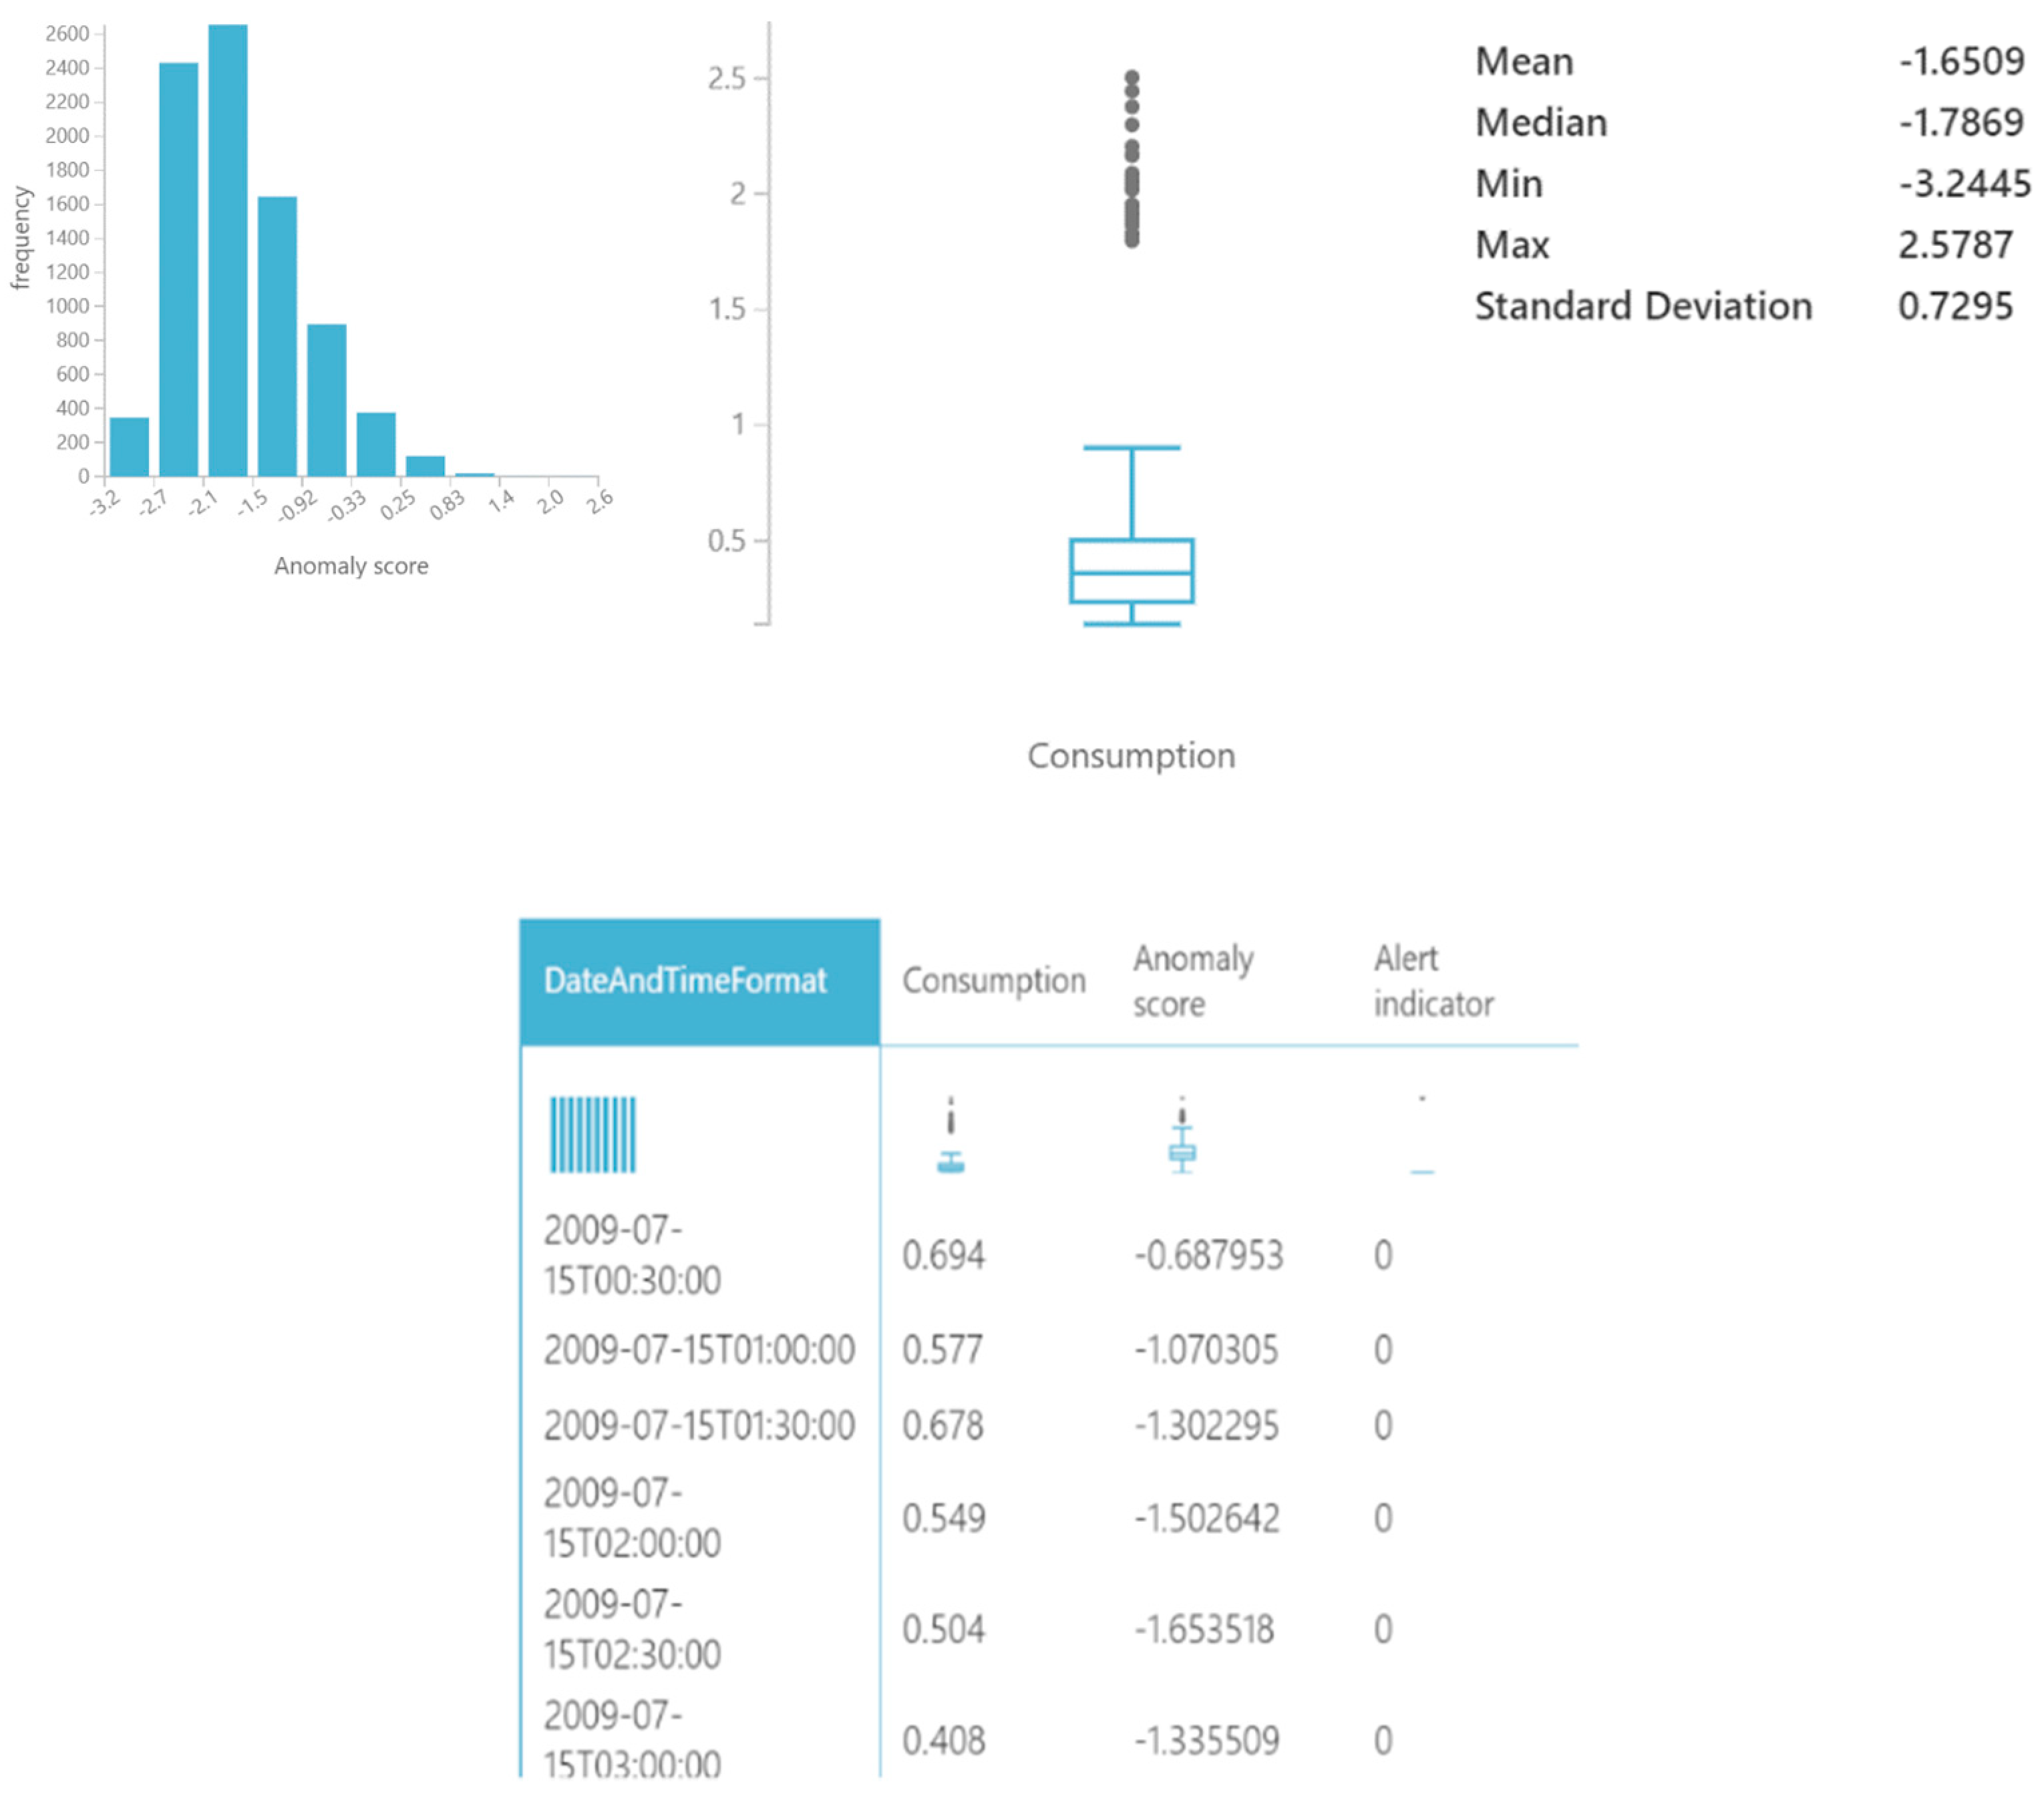
The benefit of this approach is the usage of one single algorithm and the ability to be applied on large amounts of data. The challenge that remains open regarding this model rests upon the establishment of a baseline martingale before the distribution transformation. In addition, there is not an evaluation of the errors around the change identification, and there is not a confidence measurement for the occurred changes. For comparing benchmarks, we experiment with the SR-CNN algorithm on the same data sample to be able to assess the anomaly detections sensitivity per meter. Thus, we do the same by using the trained model with a martingales setup. By comparison, we obtain the accuracy statics as shown in Figure 6.
In Figure 6, we established the alert threshold to a higher value, and the anomaly score was calculated with a deviation of 0.72. By overlooking the time series for the same data batch with the other algorithm, we are able to identify a better precision of anomaly detections per meter ID. The alert threshold uses the highest suitable value, but it did not reach the accuracy of the SR-CNN algorithm anomaly detections.
By using the SR-CNN algorithm outputs, we move forward with the proposed hybrid framework steps with ML models for electricity consumption fraud classifications. Following the previous outlined framework, we start by uploading the data files containing the consumption in a storage of the type of Azure Data Lake Storage Gen2 [32]. This storage is connected to an Azure Synapse Analytics environment [33]. In the Azure Synapse Analytics workspace, we create an ingestion pipeline that reads the text files and inserts the data into a SQL table. We perform the data mapping and also import the data regarding each consumer’s tariff and status. The five-digit code specifying the electricity consumption’s date and hour in the Datetime format was converted and added as a column in the table containing the consumption data.
During the conversion, we note that the format of the code for the date and hour does not always follow the format specified in the manifest file. Normally, the hour should have been registered as a code ranging from 01 to 48, showing 30 min intervals (30 min × 48 = 24 h, so one day). However, we found values of 49 and 50 for this code. Basically, these values overlapped the measurements for the next day. Taking this into account, it is impossible to create a coherent time series, as we have identical timestamps for different values. Thus, we decided to ignore the values for the codes 49 and 50. Furthermore, an Azure Cognitive Service of the type of Anomaly Detector was created [34] that can analyze a time series and identify the indexes containing anomalies [35]. The method used by the Anomaly Detector is based on unsupervised learning using the SR-CNN algorithm. Further on, we use code written in Python to build a chronologically ordered time series for each electricity consumption meter. Then, each time series using the Anomaly Detector service was analyzed.
Therefore, for anomaly detection identification, we recognize unusual patterns in the data per day, which can be flagged for further analysis. For the smart meter time-series data, alerts can be sent out when drifting, since this can imply potential anomalies. By using the trained SR-CNN model, the algorithms can provide accurate deviations for cycles, spikes, and downs and possible pattern detections.
In this section, we detailed our main contribution, which is represented by the innovative methodology proposal, which combines supervised and unsupervised ML algorithms. The final goal is to obtain fast and accurate predictions regarding the fraudulent household consumers. Of course, this seems unrealistic when we have available only unlabeled raw data inputs. For this, to reach the end goal, we brought our contribution to build the state-of-the-art framework methodology, after performing input raw data refinement, data digestion, applying statistical methods for features extraction, evaluating, comparing, refining, training, and selecting the most suitable models and algorithms to be applied. We obtained scoring regarding fraudulent households with data that were not suitable for any singular or pre-existing ML model. We contributed to the achievement of predictions by applying combined ML models: unsupervised ones at the beginning and by establishing thresholds transforming data to be eligible for supervised ones. Another important contribution to be considered is the reduction of a complex process to a feasible, detailed, and performant one, which can be integrated to be used by the field consumption electricity evaluators. In the next section, we will demonstrate the simulation results.

5. Results

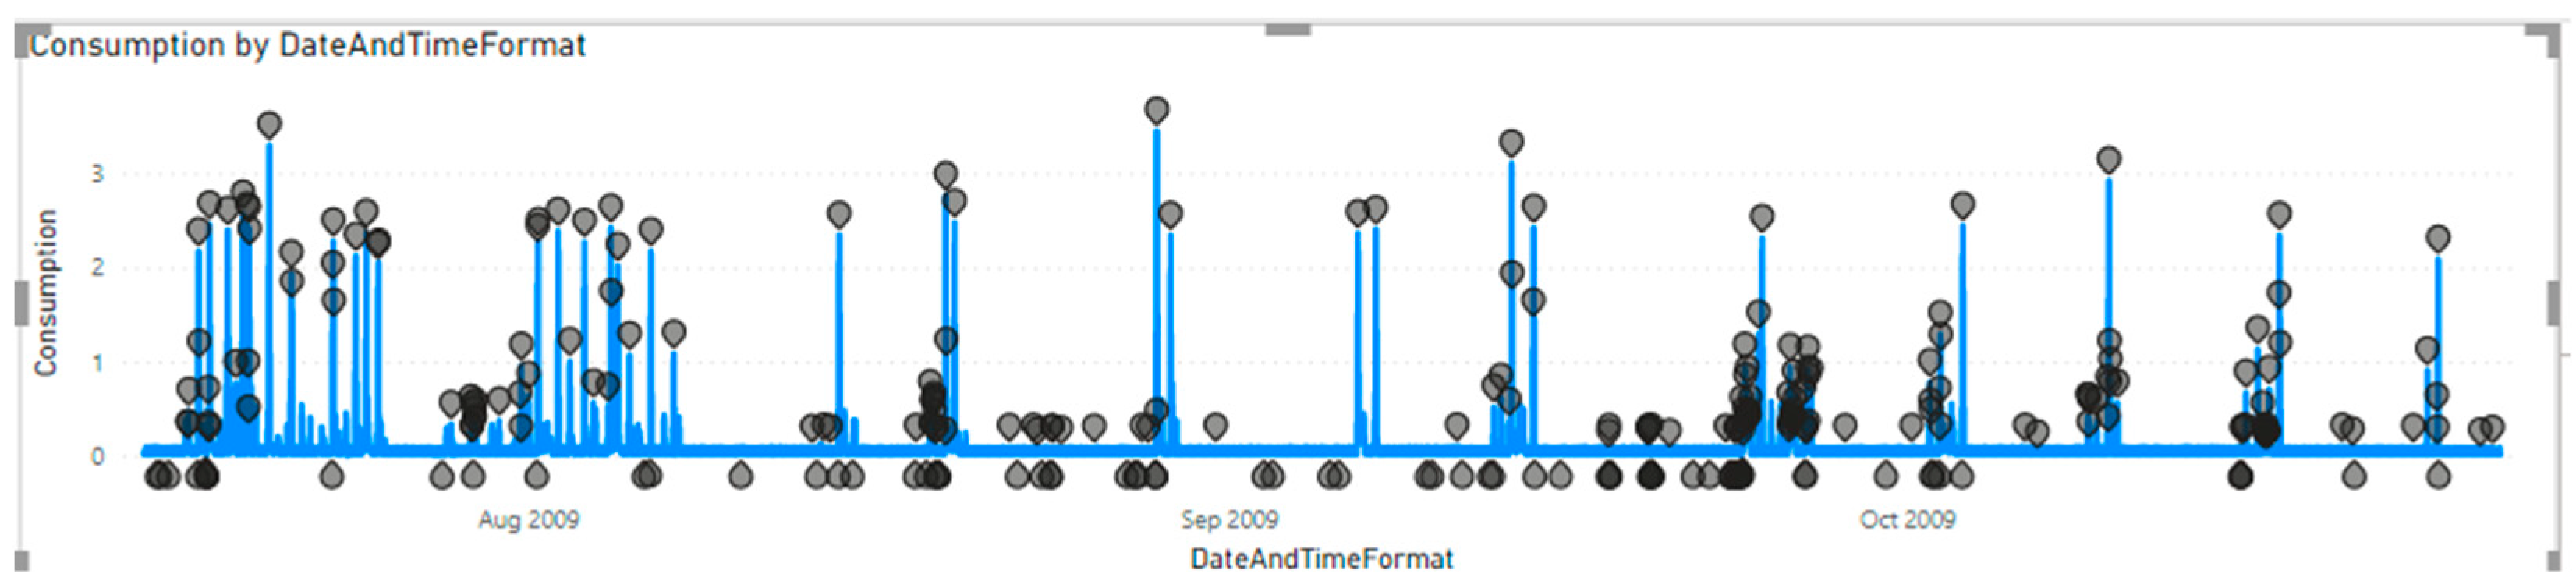
A closer look per meter ID, after applying the anomaly detector algorithm, will provide summarized information regarding the number of measurements and number of detected anomalies in the time series for different indexes. We can zoom in, taking for sample purposes the assessment results from a random meter, for which we obtained a total number of measurements of 466, with detected anomalies in the entire time series at different indexes as shown in Figure 7.
We can access the anomaly detection trends information. Consumption increased for the last 1.10 days on record. For instance, consumption jumped from 0.07 to 0.12 during its steepest incline between Sunday 27 September 2009 and Sunday 27 September 2009. Consumption was unexpectedly high on Sunday 27 September 2009. It had a value of 0.12, which is outside the expected range of 0.08–0.12. Consumption experienced the longest period of growth (+0.07) between Saturday 26 September 2009 and Sunday 27 September 2009.
From using the SR-CNN algorithm through the Azure Anomaly Detector, we proceed to analyze the time-series data for the electricity consumption meters for labeled data.
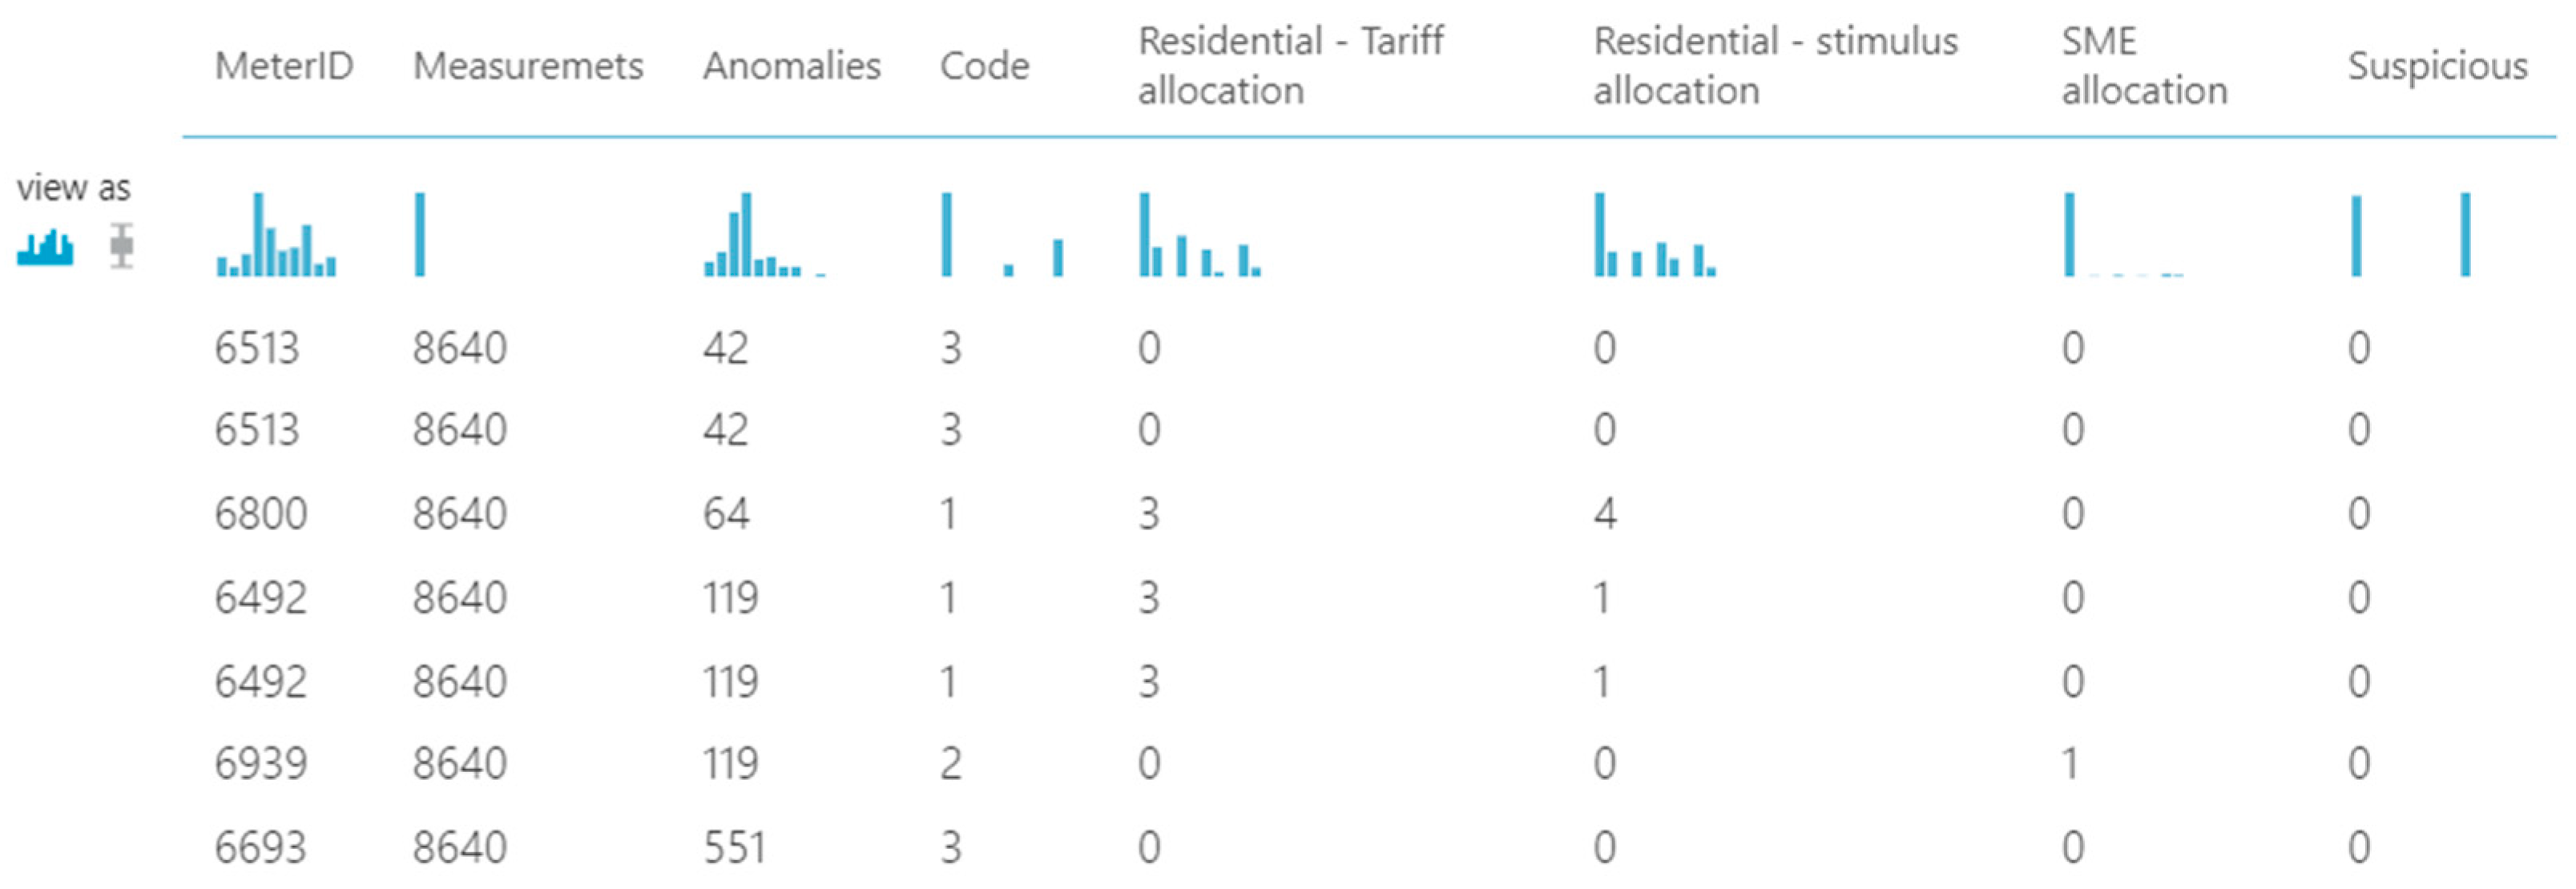
Therefore, we established a threshold, considering that if more than 15% of the data points in the time series are detected as anomalies, we mark the respective electricity consumption meter as suspicious and we label it for analysis. We perform a join using the IDs of the electricity consumption meters between the table containing the meter ID with a flag for whether it is marked as suspicious or not and the characteristics of the contract for that meter ID such as code, residential stimulus, residential tariff, and SME, obtaining a set of labeled data. Then, this dataset was imported in our model for discovering, given a certain set of parameters for the contract, if the consumer is rather likely to commit a fraud or not. We converted the letters symbolizing contract characteristics into numerical values (Table 3).
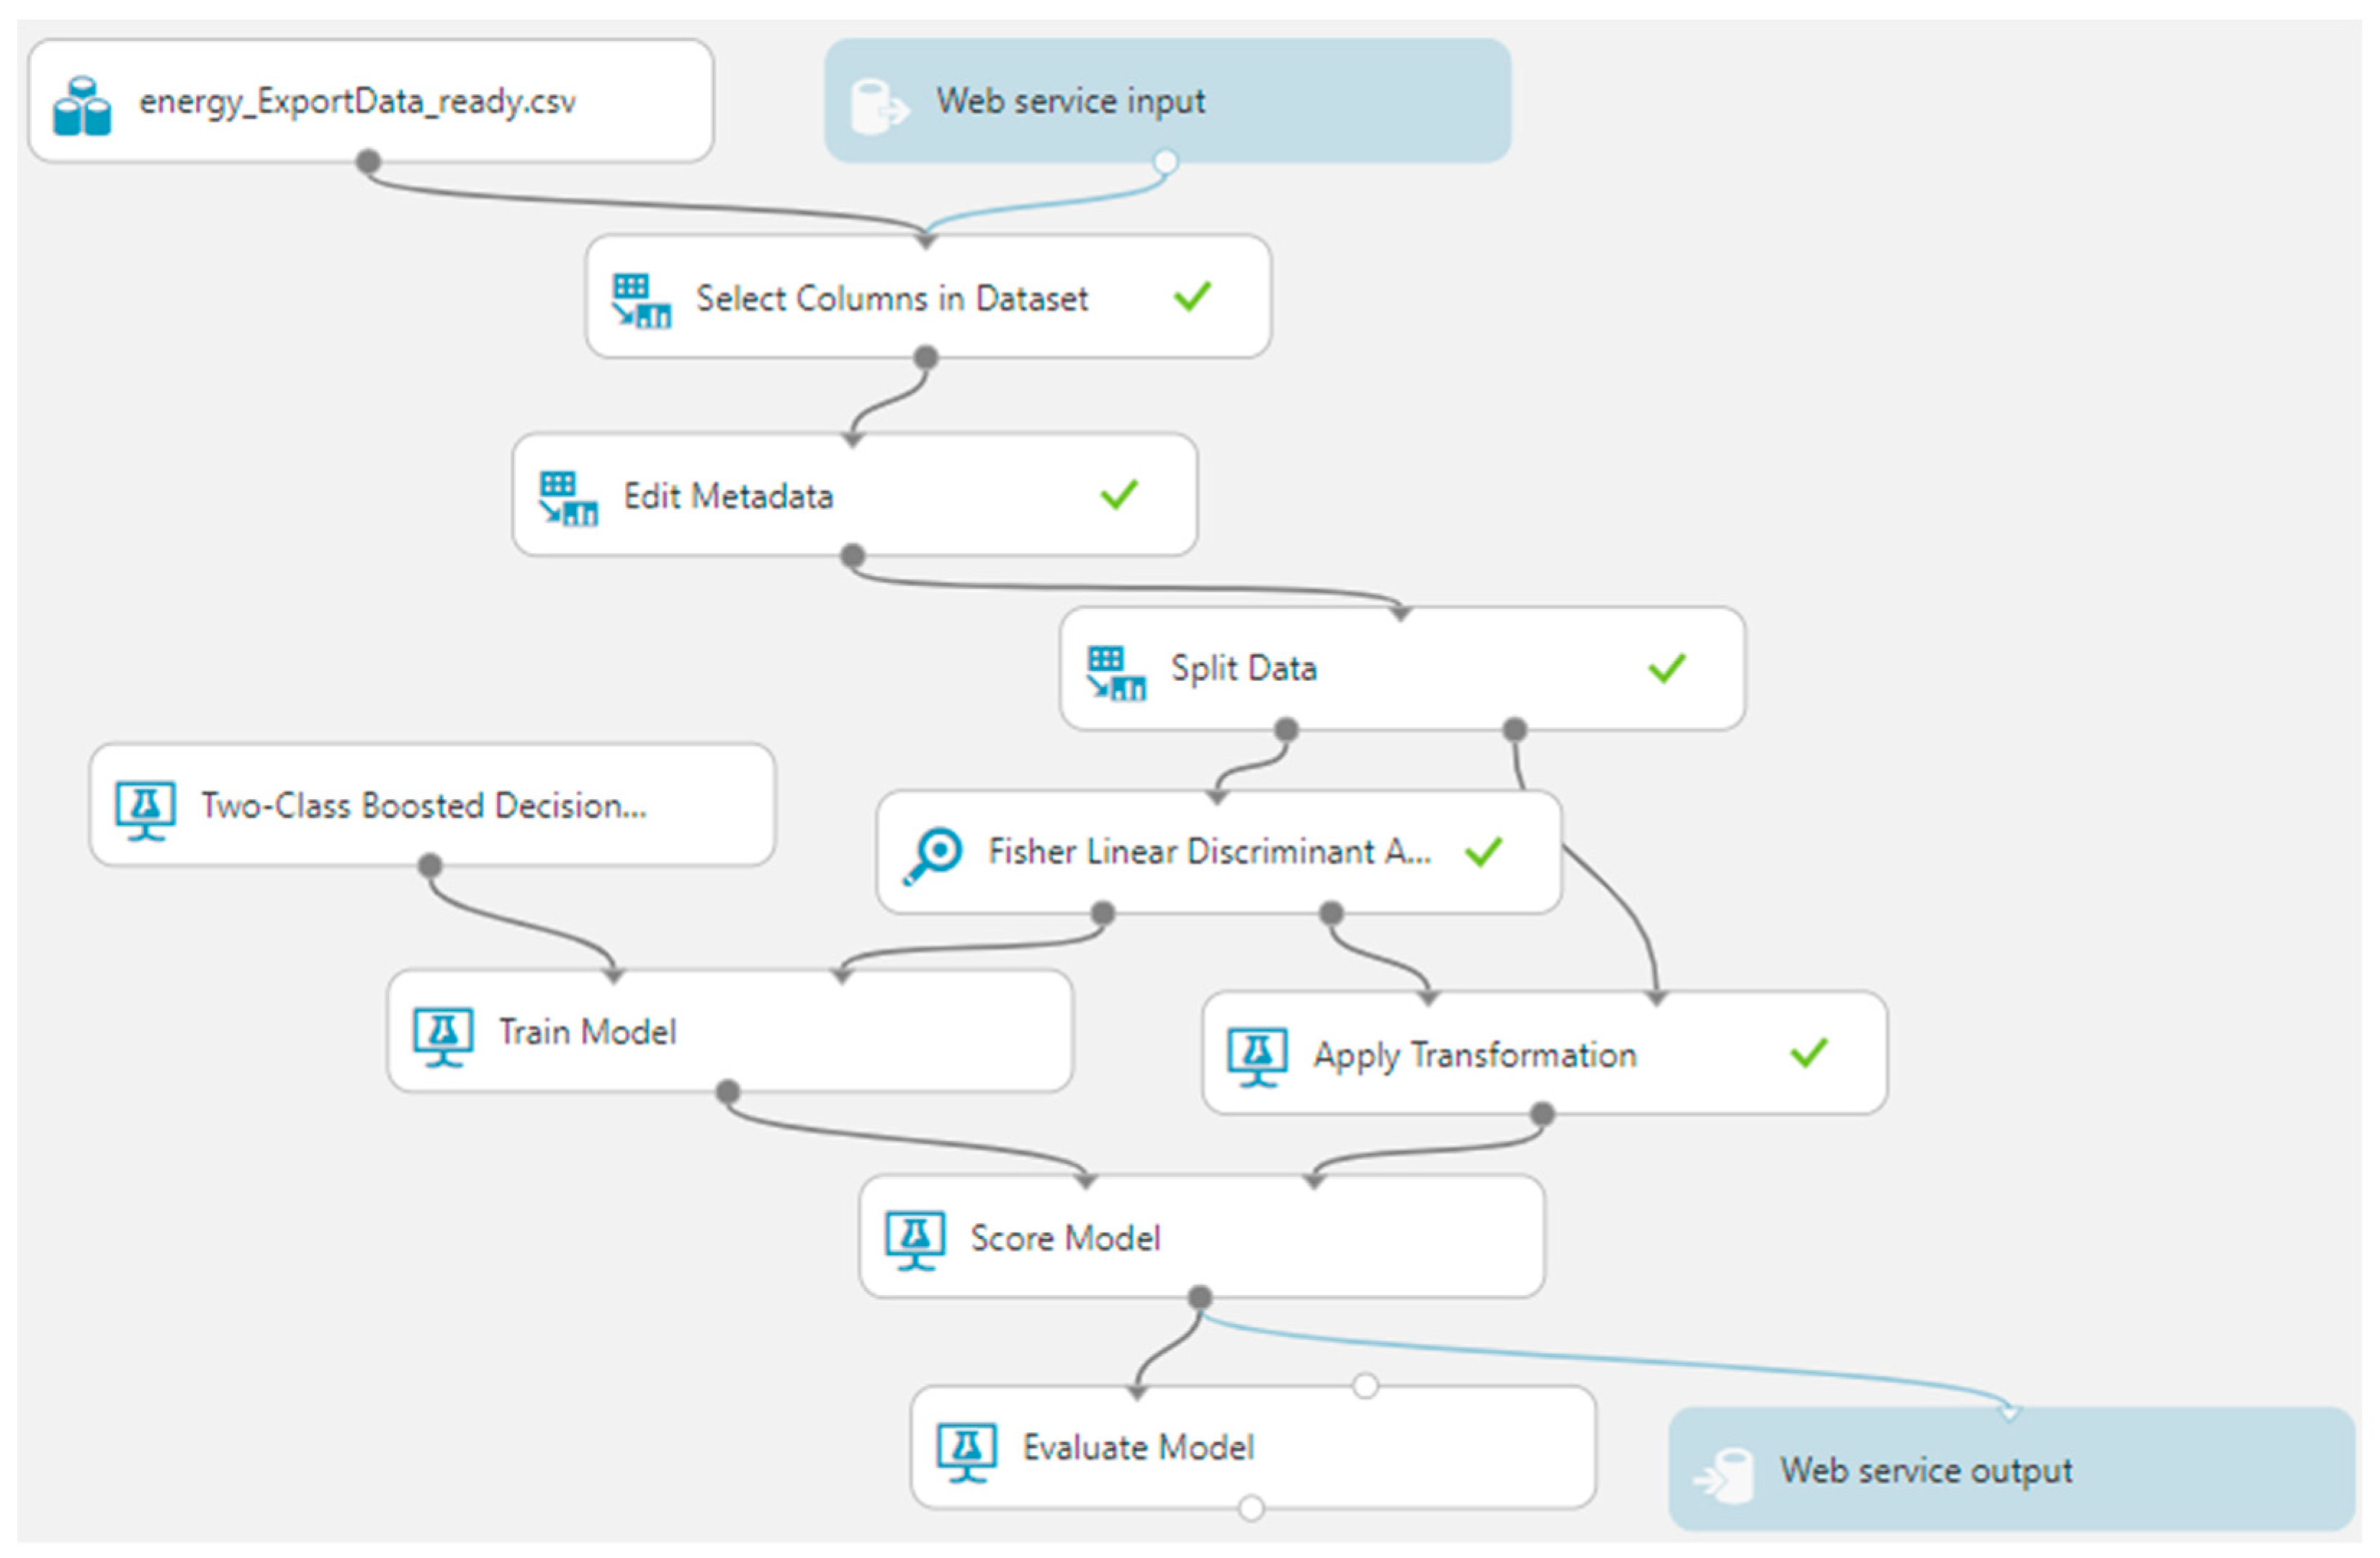
In all cases, null values were replaced with 0 (zero). Furthermore, we selected the columns for training: Code, Residential-tariff allocation, Residential-stimulus allocation, SME allocation, Suspicious. Thus, these are all categorical columns with integer data types now. Then, the data were split 70% for training the model and 30% for evaluating the model, by using the Two-Class Boosted Decision Tree from the two-class classification algorithms and the Fisher Linear Discriminant analysis as outlined in the supervised proposed ML model for fraud classification and predictive analytics on electricity consumption. The steps of the methodology at this stage are the following: data selection, feature selection using two types of algorithms, applying data transformations, evaluating the model, and output retrieval based on the added webservices, which will provide the fraud probability for the household contract details (as in Figure 8).
By applying the above model, the following results format can be obtained for the trained model also deployed as a web service:
‘Energy analysis [Predictive Exp.]’ test returned [“3”,”3”,”3”,”0”,”0”,”1”,”0.789865434169769”]...
Result: {“Results”:{“output1”:{“type”:”table”,”value”:{“ColumnNames”:[“Code”,”Residential-Tariff allocation”,”Residential-stimulus allocation”,”SME allocation”,”Suspicious”,”Scored Labels”,”Scored Probabilities”],”ColumnTypes”:[“Int32”,”Int32”,”Int32”,”Int32”,”Int32”,”Int32”,”Double”],”Values”:[[“3”,”3”,”3”,”0”,”0”,”1”,”0.789865434169769”]]}}}}.
In this example, we send to the prediction model for analysis a consumer contract with the following details: Code: 3, Residential-tariff allocation: 3, Residential-stimulus allocation: 3, SME allocation: 0. The return result has 1 for the value of the Scored Label, meaning that this consumer is more likely to be fraudulent with a probability of 0.79 (on a scale from 0 to 1), as indicated by the returned Scored Probabilities field.
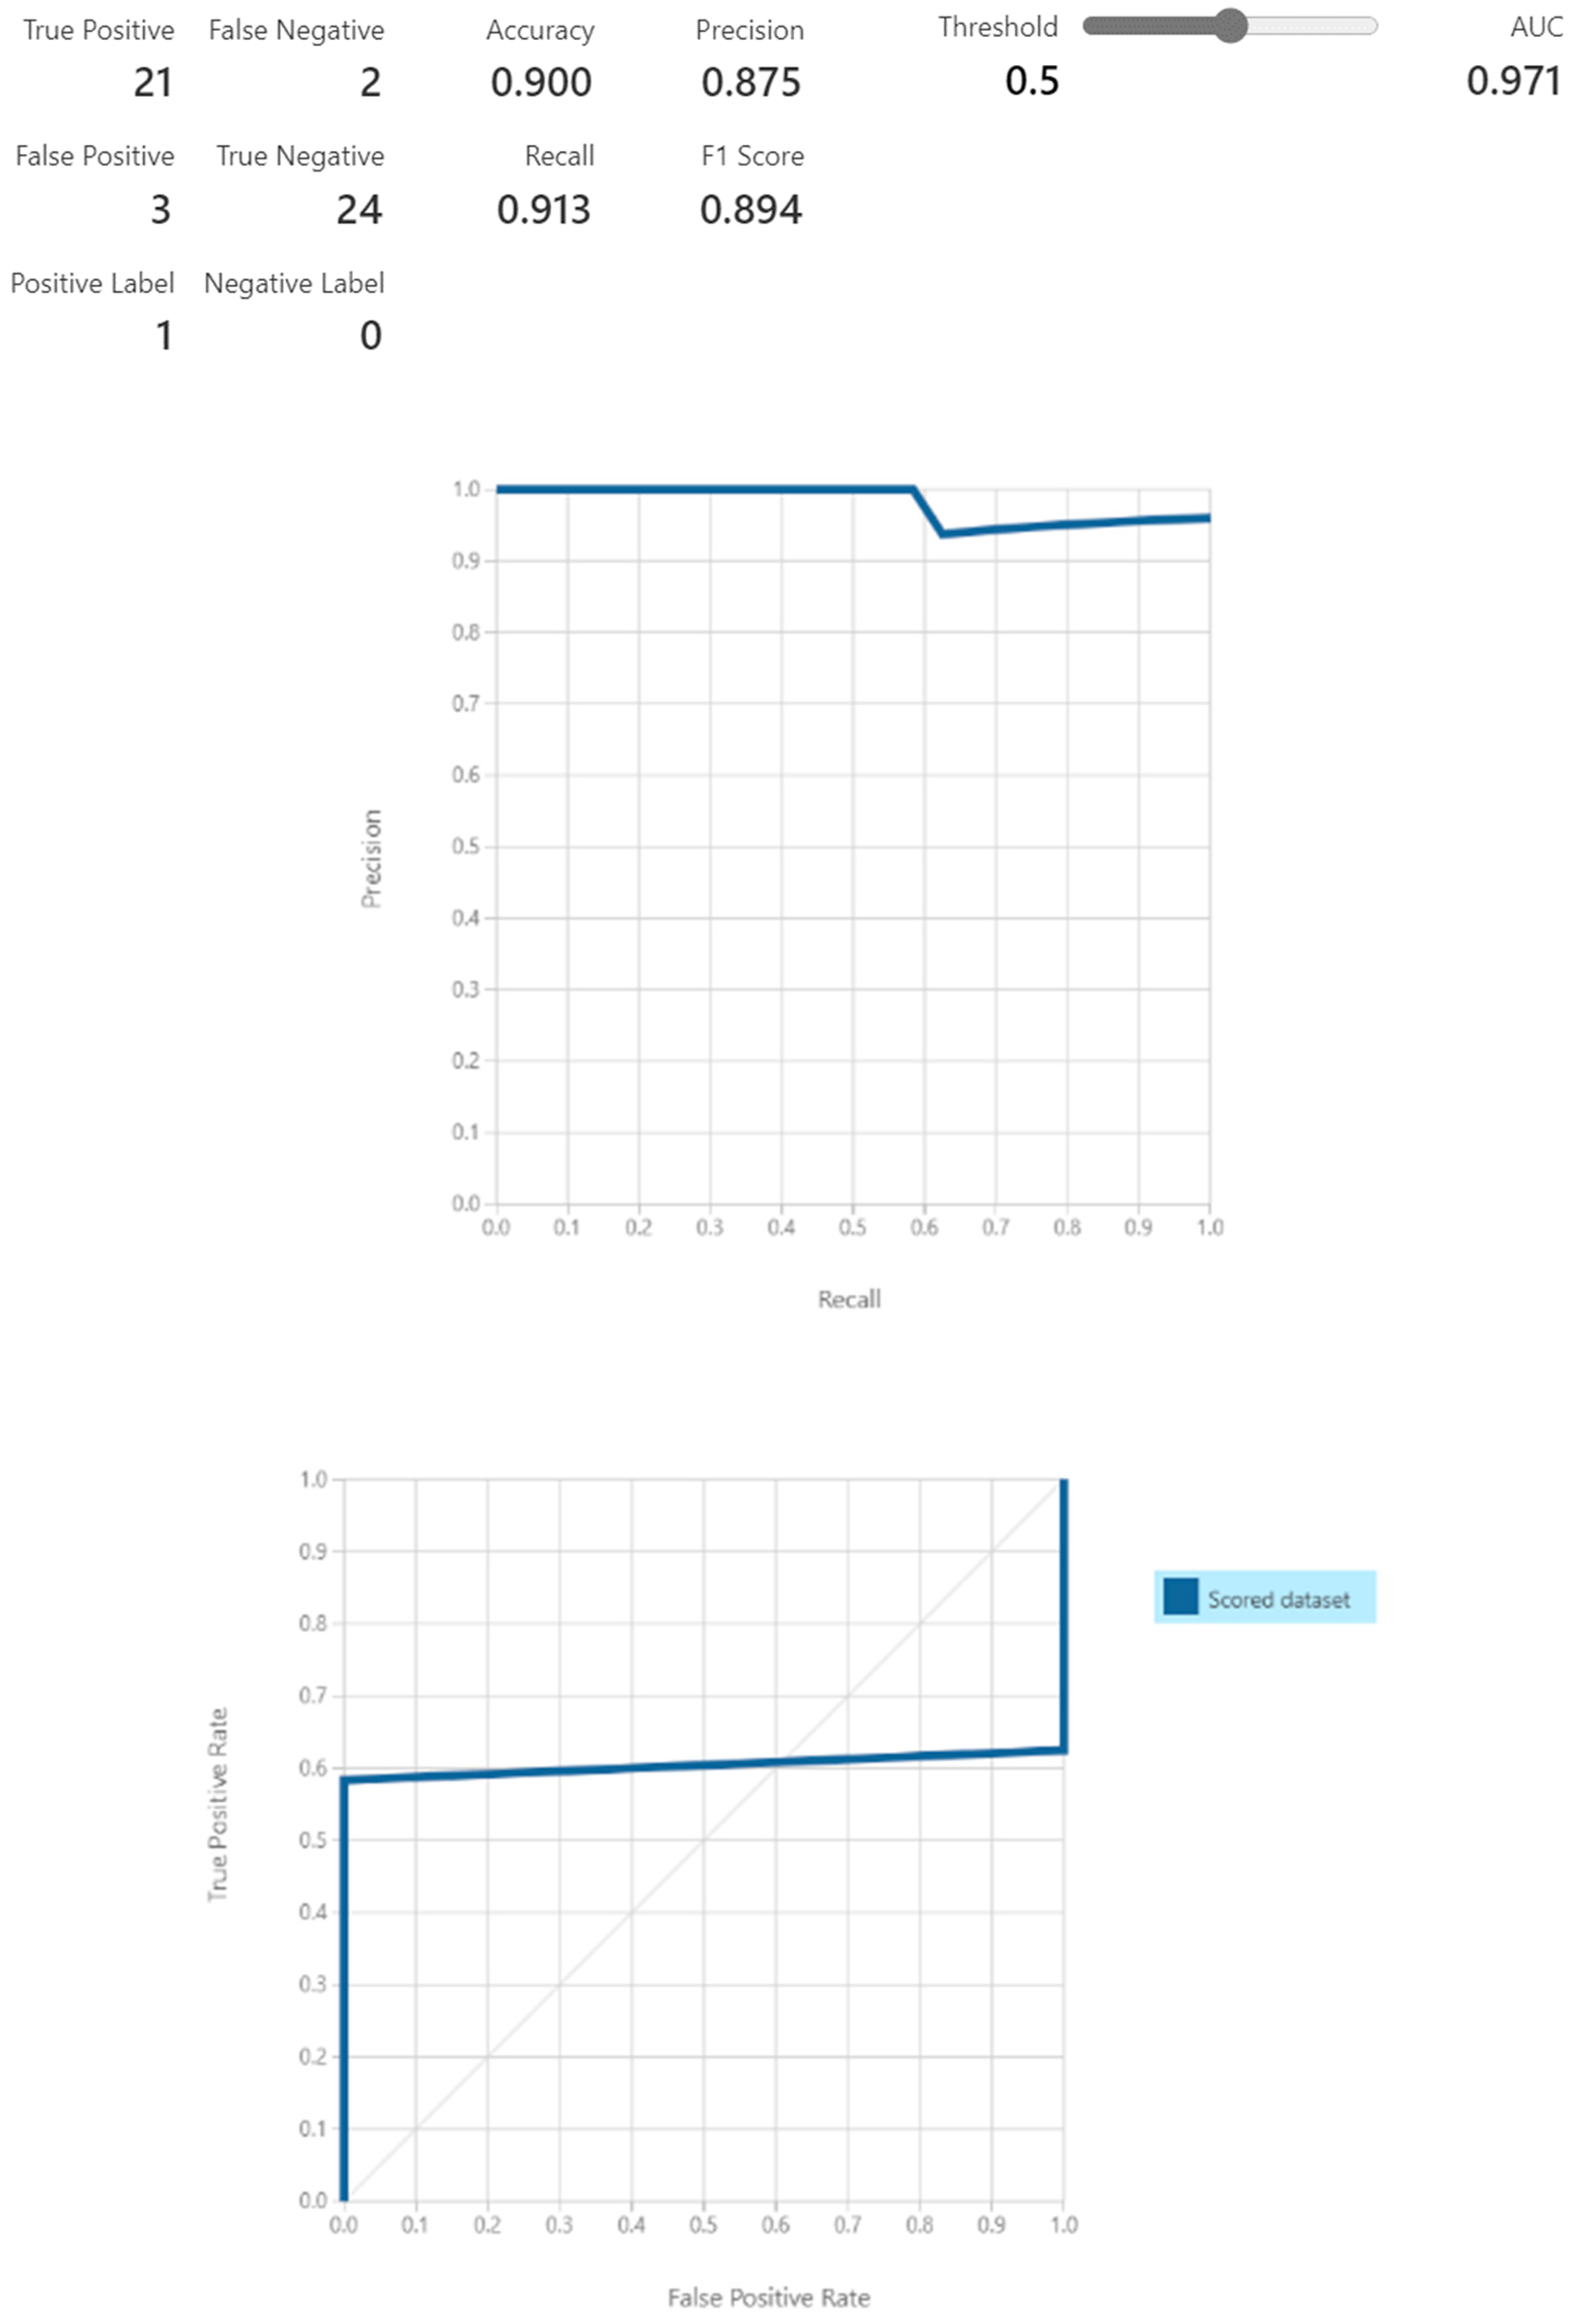
We submit the evaluation of the above ML model for fraud detections for the sampled data and obtain the scores as shown in Figure 9.
The evaluation of the above proposed framework has an accuracy of 90%, a precision score of 0.875, and an F1 score of 0.894.

6. Conclusions

The classification of the fraud consumption for the electricity users is a challenging process due to the amount of data that needs to be processed and the factors that must be considered when analyzing the data, such as type of consumers, locations, timeframes of the evaluations, time of the day when the measurements are performed, determination of factors that influence the trends in in electricity consumption, weather conditions, etc. This research started from the hypothesis that there is a need to implement an extensive methodology that overcomes the impediments of obtaining rapidly accurate predictive data for consumption anomaly detections and, at the same time, also forecasts capabilities for potential fraud electricity consumers. Therefore, we proposed a hybrid model approach based on rigorous assessments and testing of the available existing technologies, ML models, and algorithms for the integration of those most suitable for such an approach. This research can be further extended with the evaluation of the proposed methodology on real-time data, as until now, it was assessed only by using recorded consumptions. In addition, the inclusion of the supervised learning model incorporates feature extractions algorithms that can be set up to include even more features than those currently used in the current work. Using all the aforementioned, our model can be tested out with extended featured data and can be refined and evaluated with actual onsite inspections.
In this paper, we point out the motivation for detecting frauds in the reporting of electricity consumption. Then, we perform an analysis of the existing approaches that use big data and ML for fraud detection and proceed to propose our own analysis framework. The methodology consists of using unsupervised ML for detecting anomalies in time-series data, establishing a threshold for the percentage of anomaly points from the total measures, and labeling the meters situated over the threshold as suspicious. Then, using a supervised ML approach, we train a classification model to predict the likelihood of consumers to commit a fraud based upon their consumption pattern and contract parameters. In the end, we apply the proposed methodology on the dataset and evaluate the results for anomaly consumption detections and fraud classification for electricity consumers. The research can be extended for real-time data evaluations.

Author Contributions

Conceptualization, S.-V.O. and A.B.; methodology, F.C.P. and I.C.R.; software, F.C.P. and I.C.R.; validation, all; formal analysis, all.; investigation, F.C.P. and I.C.R.; resources, all; data curation, F.C.P. and I.C.R.; writing—original draft preparation, all; writing—review and editing, all.; visualization, S.-V.O. and A.B.; supervision, S.-V.O. and A.B.; project administration, S.-V.O. and A.B.; funding acquisition, S.-V.O. and A.B. All authors have read and agreed to the published version of the manuscript.

Funding

The APC was funded by authors.

Institutional Review Board Statement

Not applicable.

Informed Consent Statement

Not applicable.

Data Availability Statement

The data is available by request: https://www.ucd.ie/issda/ (accessed on 29 September 2021).

Acknowledgments

In This work was supported by a grant of the Romanian Ministry of Research and Innovation, CCCDI –UEFISCDI, project number 462PED/28.10.2020, project code PN-III-P2-2.1-PED-2019-1198, within PNCDI III.

Conflicts of Interest

The authors declare no conflict of interest.

Abbreviations

MLMachine Learning
SR-CNNSpectral Residual-Convolutional Neural Network
NTLNon-Technical Losses
CERCommission of Energy Regulation
ISSDAIrish Social Science Data Archive
ANNArtificial Neural Network
SVMSupport Vector Machine
RFRandom Forest
BOSSVSBag-Of-SFA-Symbols in Vector Space
MRMoving Ranges
XMRControl charts
SMOTESynthetic Minority Oversampling Technique
ADASYNAdaptive Synthetic sampling approach
SMESmall and Medium Enterprise
K-NNK-Nearest Neighbors
FFourier Transform
SQLStructured Query Language

References

  1. Capozzoli, A.; Piscitelli, M.S.; Brandi, S.; Grassi, D.; Chicco, G. Automated load pattern learning and anomaly detection for enhancing energy management in smart buildings. Energy 2018, 157, 336–352. [Google Scholar] [CrossRef]
  2. Hu, T.; Guo, Q.; Shen, X.; Sun, H.; Wu, R.; Xi, H. Utilizing Unlabeled Data to Detect Electricity Fraud in AMI: A Semisupervised Deep Learning Approach. IEEE Trans. Neural Netw. Learn. Syst. 2019, 30, 3287–3299. [Google Scholar] [CrossRef]
  3. Oprea, S.-V.; Bâra, A. Machine learning classification algorithms and anomaly detection in conventional meters and Tunisian electricity consumption large datasets. Comput. Electr. Eng. 2021, 94, 107329. [Google Scholar] [CrossRef]
  4. Rossi, B.; Chren, S.; Buhnova, B.; Pitner, T. Anomaly detection in Smart Grid data: An experience report. In Proceedings of the 2016 IEEE International Conference on Systems, Man, and Cybernetics, SMC 2016, Budapest, Hungary, 9–12 October 2016. [Google Scholar]
  5. McLaughlin, S.; Holbert, B.; Fawaz, A.; Berthier, R.; Zonouz, S. A multi-sensor energy theft detection framework for advanced metering infrastructures. IEEE J. Sel. Areas Commun. 2013, 31, 1319–1330. [Google Scholar] [CrossRef]
  6. Coates, A.; Ng, A.; Lee, H. An analysis of single-layer networks in unsupervised feature learning. J. Mach. Learn. Res. 2011, 15, 215–223. [Google Scholar]
  7. Fan, C.; Xiao, F.; Zhao, Y.; Wang, J. Analytical investigation of autoencoder-based methods for unsupervised anomaly detection in building energy data. Appl. Energy 2018, 211, 1123–1135. [Google Scholar] [CrossRef]
  8. Jokar, P.; Arianpoo, N.; Leung, V.C. Electricity theft detection in AMI using customers’ consumption patterns. IEEE Trans. Smart Grid 2016, 7, 216–226. [Google Scholar] [CrossRef]
  9. Araya, D.B.; Grolinger, K.; ElYamany, H.F.; Capretz, M.A.; Bitsuamlak, G. An ensemble learning framework for anomaly detection in building energy consumption. Energy Build. 2017, 144, 191–206. [Google Scholar] [CrossRef]
  10. Korba, A. Energy fraud detection in advanced metering infrastructure AMI. In Proceedings of the 7th International Conference on Software Engineering and New Technologies, Hammamet, Tunisia, 26–28 December 2018. [Google Scholar]
  11. Lopez-Martin, M.; Sanchez-Esguevillas, A.; Hernandez-Callejo, L.; Arribas, J.; Carro, B. Additive ensemble neural network with constrained weighted quantile loss for probabilistic electric-load forecasting. Sensors 2021, 21, 2979. [Google Scholar] [CrossRef] [PubMed]
  12. Lopez-Martin, M.; Sanchez-Esguevillas, A.; Hernandez-Callejo, L.; Arribas, J.I.; Carro, B. Novel data-driven models applied to short-term electric load forecasting. Appl. Sci. 2021, 11, 5708. [Google Scholar] [CrossRef]
  13. Lopez-Martin, M.; Carro, B.; Sanchez-Esguevillas, A. IoT type-of-traffic forecasting method based on gradient boosting neural networks. Futur. Gener. Comput. Syst. 2020, 105, 331–345. [Google Scholar] [CrossRef]
  14. Massaferro, P.; Di Martino, J.M.; Fernandez, A. Fraud Detection in Electric Power Distribution: An Approach That Maximizes the Economic Return. IEEE Trans. Power Syst. 2019, 35, 703–710. [Google Scholar] [CrossRef]
  15. Zhai, S.; Cheng, Y.; Lu, W.; Zhang, Z. Deep structured energy based models for anomaly detection. In Proceedings of the 33rd International Conference on Machine Learning, ICML 2016, New York, NY, USA, 19–24 June 2016. [Google Scholar]
  16. Wang, Z.; Yan, W.; Oates, T. Time series classification from scratch with deep neural networks: A strong baseline. In Proceedings of the International Joint Conference on Neural Networks, Anchorage, AK, USA, 14–19 May 2017. [Google Scholar]
  17. Basu, K.; Debusschere, V.; Douzal-Chouakria, A.; Bacha, S. Time series distance-based methods for non-intrusive load monitoring in residential buildings. Energy Build. 2015, 96, 109–117. [Google Scholar] [CrossRef]
  18. Spirić, J.V.; Dočić, M.B.; Stanković, S.S. Fraud detection in registered electricity time series. Int. J. Electr. Power Energy Syst. 2015, 71, 42–50. [Google Scholar] [CrossRef]
  19. Yip, S.-C.; Tan, W.-N.; Tan, C.; Gan, M.-T.; Wong, K. An anomaly detection framework for identifying energy theft and defective meters in smart grids. Int. J. Electr. Power Energy Syst. 2018, 101, 189–203. [Google Scholar] [CrossRef]
  20. Aziz, S.; Naqvi, S.Z.H.; Khan, M.U.; Aslam, T. Electricity Theft Detection using Empirical Mode Decomposition and K-Nearest Neighbors. In Proceedings of the 2020 International Conference on Emerging Trends in Smart Technologies, ICETST 2020, Karachi, Pakistan, 26–27 March 2020. [Google Scholar]
  21. Siffer, A.; Fouque, P.A.; Termier, A.; Largouet, C. Anomaly detection in streams with extreme value theory. In Proceedings of the ACM SIGKDD International Conference on Knowledge Discovery and Data Mining, Halifax, NS, Canada, 13–17 August 2017. [Google Scholar]
  22. Lyu, L.; Jin, J.; Rajasegarar, S.; He, X.; Palaniswami, M. Fog-empowered anomaly detection in IoT using hyperellipsoidal clustering. IEEE Internet Things J. 2017, 4, 1174–1184. [Google Scholar] [CrossRef]
  23. Hossain, E.; Khan, I.; Un-Noor, F.; Sikander, S.S.; Sunny, M.S.H. Application of Big Data and Machine Learning in Smart Grid, and Associated Security Concerns: A Review. IEEE Access. 2019, 7, 13960–13988. [Google Scholar] [CrossRef]
  24. Katrutsa, A.; Strijov, V. Comprehensive study of feature selection methods to solve multicollinearity problem according to evaluation criteria. Expert Syst. Appl. 2017, 76, 1–11. [Google Scholar] [CrossRef]
  25. May, J.O.; Looney, S.W. Sample size charts for Spearman and Kendall coefficients. J. Biom. Biostat. 2020, 11, 1–7. [Google Scholar]
  26. Kalsoom, A.; Maqsood, M.; Ghazanfar, M.A.; Aadil, F.; Rho, S. A dimensionality reduction-based efficient software fault prediction using Fisher linear discriminant analysis (FLDA). J. Supercomput. 2018, 74, 4568–4602. [Google Scholar] [CrossRef]
  27. Tsymbal, A.; Puuronen, S.; Pechenizkiy, M.; Baumgarten, M.; Patterson, D.W. Eigenvector-based Feature Extraction for Classification. In Proceedings of the 15th International Florida Artificial Intelligence Research Society Conference, Pensacola Beach, FL, USA, 14–16 May 2002. [Google Scholar]
  28. Abdel-Aziz, A.S.; Hassanien, A.E.; Azar, A.T.; Hanafi, S.E.O. Machine Learning Techniques for Anomalies Detection and Classification. In Communications in Computer and Information Science; Springer: Berlin/Heidelberg, Germany, 2013. [Google Scholar]
  29. Hou, X.; Zhang, L. Saliency detection: A spectral residual approach. In Proceedings of the IEEE Computer Society Conference on Computer Vision and Pattern Recognition, Minneapolis, MN, USA, 17–22 June 2007. [Google Scholar]
  30. Microsoft. SrCnnAnomalyEstimator Class. Available online: https://docs.microsoft.com/en-us/dotnet/api/microsoft.ml.transforms.timeseries.srcnnanomalyestimator?view=ml-dotnet (accessed on 15 August 2021).
  31. Microsoft. Fisher Linear Discriminant Analysis. Available online: https://docs.microsoft.com/en-us/azure/machine-learning/studio-module-reference/fisher-linear-discriminant-analysis (accessed on 15 August 2021).
  32. Microsoft. Introduction to Azure Data Lake Storage Gen2. Available online: https://docs.microsoft.com/en-us/azure/storage/blobs/data-lake-storage-introduction (accessed on 27 August 2021).
  33. Microsoft. Azure Synapse Analytics. Available online: https://docs.microsoft.com/en-us/azure/synapse-analytics/ (accessed on 28 August 2021).
  34. Microsoft. Anomaly Detector. Available online: https://azure.microsoft.com/en-us/services/cognitive-services/anomaly-detector/ (accessed on 5 September 2021).
  35. Hamura, Y.; Kubokawa, T. Bayesian predictive density estimation for a Chi-squared model using information from a normal observation with unknown mean and variance. J. Stat. Plan. Inference 2021, 217, 33–51. [Google Scholar] [CrossRef]
Figure 1. ML methodology for predictive analytics solutions proposed for electricity consumption.
Sustainability 13 10963 g001
Figure 2. Data science assessment methodology for electric power consumption.
Sustainability 13 10963 g002
Figure 3. Extract from transformed dataset input, eligible for feature extraction methods.
Sustainability 13 10963 g003
Figure 4. Fisher Linear Discriminant analysis transformed features for electricity consumption smart readings for the two identified columns, Column 1 and Column 2.
Sustainability 13 10963 g004
Figure 5. Methodology of our proposed hybrid framework.
Sustainability 13 10963 g005
Figure 6. Results for anomaly detection by using the trained model with threshold alerts.
Sustainability 13 10963 g006
Figure 7. Anomaly detection trends per meter.
Sustainability 13 10963 g007
Figure 8. Supervised proposed ML model for fraud classification and predictive analytics on electricity consumption.
Sustainability 13 10963 g008
Figure 9. Evaluation of the proposed ML model with graphs for fraud classification and predictive analytics on electricity consumption.
Sustainability 13 10963 g009
Table 1. Comparison of tested dataset results against different feature selection methods.
Feature ColumnChi-SquaredFischer Score
Anomalies93.5974391.05212
Residential-stimulus allocation12.1825750.026703
Residential-tariff allocation14.3115320.081486
SME allocation0.9713780.005146
Table 2. Feature extractor columns from the Fisher Linear Discriminant analysis.
-Column 1Column 2
Mean−158.05235.4357
Median−156.48615.6542
Min−171.82892.7343
Max−141.66729.279
Standard Deviation7.71071.5527
Missing Values00
Feature TypeNumeric FeatureNumeric Feature
Table 3. Pre-processing the dataset.
Encoded VariableOld ValueMeaningNew Value
For “code”, we maintained the original encoding:1Residential1
3SME3
4Other4
For “residential stimulus”, we performed the following transformation:EControl5
1Bi-monthly detailed bill1
2Monthly detailed bill2
3Bi-monthly detailed bill (IHD)3
4Bi-monthly detailed bill (OLR)4
WWeekend tariff6
For “residential tariff”, we performed the following transformation:EControl5
ATariff A1
BTariff B2
CTariff C3
DTariff D4
WWeekend tariff6
For “SME”, we performed the following transformation:1Monthly detailed bill1
2Bi-monthly detailed bill (IOD)2
3Bi-monthly detailed bill + web-access3
4Bi-monthly detailed bill4
CControl5
Publisher’s Note: MDPI stays neutral with regard to jurisdictional claims in published maps and institutional affiliations.

