Article

Integration of Large-Scale Electric Vehicles into Utility Grid: An Efficient Approach for Impact Analysis and Power Quality Assessment

by
Md. Mosaraf Hossain Khan
1,
Amran Hossain
1,
Aasim Ullah
1,
Molla Shahadat Hossain Lipu
2,3,*,
S. M. Shahnewaz Siddiquee
4,
M. Shafiul Alam
5,
Taskin Jamal
6,7 and
Hafiz Ahmed
8
1
Department of Electrical and Electronics Engineering, International Islamic University Chittagong, Chattogram 4318, Bangladesh
2
Department of Electrical, Electronic and Systems Engineering, Universiti Kebangsaan Malaysia (UKM), Bangi 43600, Selangor, Malaysia
3
Centre for Automotive Research (CAR), Universiti Kebangsaan Malaysia (UKM), Bangi 43600, Selangor, Malaysia
4
Intelligent Efficiency Research Group (IERG), School of Engineering, University College Cork, T12HY8E Cork, Ireland
5
K.A.CARE Energy Research & Innovation Center (ERIC), King Fahd University of Petroleum & Minerals (KFUPM), Dhahran 31261, Saudi Arabia
6
Department of Electrical and Electronic Engineering, Ahsanullah University of Science and Technology, Dhaka 1208, Bangladesh
7
School of Geography, Geology and the Environment, Keele University, Staffordshire ST5 5BG, UK
8
Nuclear Futures Institute, Bangor University, Bangor LL57 1UT, UK
*
Author to whom correspondence should be addressed.
Sustainability 2021, 13(19), 10943; https://doi.org/10.3390/su131910943
Submission received: 28 August 2021 / Revised: 25 September 2021 / Accepted: 27 September 2021 / Published: 1 October 2021
(This article belongs to the Special Issue Sustainable Management of Power Supply System)

Abstract

:
Electric vehicles (EVs) have received massive consideration in the automotive industries due to their improved performance, efficiency and capability to minimize global warming and carbon emission impacts. The utilization of EVs has several potential benefits, such as increased use of renewable energy, less dependency on fossil-fuel-based power generations and energy-storage capability. Although EVs can significantly mitigate global carbon emissions, it is challenging to maintain power balance during charging on-peak hours. Thus, it mandates a comprehensive impact analysis of high-level electric vehicle penetration in utility grids. This paper investigates the impacts of large-scale EV penetration on low voltage distribution, considering the charging time, charging method and characteristics. Several charging scenarios are considered for EVs’ integration into the utility grid regarding power demand, voltage profile, power quality and system adequacy. A lookup-table-based charging approach for EVs is proposed for impact analysis, while considering a large-scale integration. It is observed that the bus voltage and line current are affected during high-level charging and discharging of the EVs. The residential grid voltage sag increases by about 1.96% to 1.77%, 2.21%, 1.96 to 1.521% and 1.93% in four EV-charging profiles, respectively. The finding of this work can be adopted in designing optimal charging/discharging of EVs to minimize the impacts on bus voltage and line current.

1. Introduction

Air pollution in shipping, manufacturing and coal-fired electricity generation, exacerbated by fossil-fuel combustion, has become a critical problem for the global climate in recent years [1]. Climate change, incremental energy prices and reliance on fossil fuels are significant challenges nowadays [2]. These complicated issues are intimately associated with the heavy conventional electric energy generations which depend on fossil fuels [3]. Researchers and governments worldwide have contributed to limiting fossil fuels by awakening and substituting clean energy solutions [4,5]. One of the most comprehensive methods of addressing global climate change is to move towards sustainable mobility. EVs are an ecologically friendly way to decarbonize the transportation sector. The EV charging station is typically powered by the electricity grid; however, a solar photovoltaic system may be used instead of the electricity grid for EV-charging stations [6]. The electric vehicle (EV) is an alternative solution to conventional vehicles, as it reduces emissions, helps eliminate the impacts of higher fuel costs and enforces environmental regulation [7,8]. EVs are extensively identified as an effective solution for reducing greenhouse gas emissions and reconfiguring urban area’s energy structures.
Many countries have viewed EVs as one of the most prevalent development legislations [9]. Reducing oil and gas dependency, reducing carbon electricity demand and enhancing environmental efficiency, EVs have a significant potential to increase energy security [10,11]. Ghosh [6] presented a comprehensive analysis on the impacts of EVs towards decarbonization in terms of efficient battery management system (BMS); fast charging facility; and numerous sociotechnical challenges, incentives, benefits and government policies. Nevertheless, EV batteries have several limitations with regard to a short lifespan, battery-health degradation, aging, long charging duration, overcharging and over-discharging issues, charge and voltage unbalancing, temperature influences, thermal runaway, overheating and fire threats [12,13]. Thus, a BMS is required to improve the battery performance including efficient charging–discharging operation, temperature control, health assessment, fault diagnosis and protection. Bhattacharjee et al. [14] developed an optimized thermal management scheme, emphasizing air-cooling and liquid-cooling approaches to examine the performance of lithium-ion batteries at high discharge rates. The proposed cooling method reduces the battery peak temperature from 49.76 to 27.43 °C, at a 2 °C discharging rate. Moreover, the rapid growth of EVs has created several problems in the electrical grid, such as charging scheduling, optimal energy transfer in the vehicle-to-grid (V2G) or grid-to-vehicle (G2V) operation, grid integration technical issues and dynamic pricing [15]. Moreover, high-level EV penetration with the utility grids creates several problems, such as high load profile in peak hour, transmission losses, phase unbalance, harmonics and system instability [16]. These problems decrease the performance efficiency and reliability of the electrical power network. Hence, it is essential to track the effects of EVs on the worst condition in the grid. Numerous research works have been underway to evaluate the EV’s impacts, focusing on economic, environmental and grid evaluations [17]. However, the systematic approach of the quantitative analysis of these problems is missing in the existing literature. Therefore, this work is mainly focused on designing an efficient method of analyzing the impacts of large-scale EV penetration with the utility grids.
Although EV charging has detrimental impacts on power quality, some research has been conducted to minimize the effects by using a collaborative charging technique [18]. The spatial and temporal load curve adjustments by coordinated charging methods of EVs can improve the system’s reliability. An efficient charging approach helps to minimize the cost of charging and peak charge level. However, an individual case was not considered for the analysis of the negative impact on the grid of the unordered charging. Several researches have been published considering voltage reliability in the power system [19,20]. In general, charging EVs can have two significant impacts on the electrical grid. Firstly, the extra demand for recharging EV batteries supplied in residential households while parking and charging vehicles mainly during the night would affect the total energy requirements and make electricity, transmission and delivery management more difficult [21]. Secondly, EVs would either have to be interpreted as a distributed storage system or as versatile loads functioning as a virtual power plant (VPP). In automated smart grids, applications of the vehicle-to-grid (V2G) and coordinated EV charging aim to better incorporate unused renewable energies and generally improve electricity systems operation and reliability [11]. However, the impacts of large-scale EVs on power quality, especially, the voltage profile and power demand, should be analyzed carefully. Power consumption by plug-in hybrid electric vehicles (PHEVs) depends on many factors that can be driver dependent or independent. The best driving technique was chosen based on the primary variable that determined the economics of a given drive system. Four driving strategies were chosen to examine which one might provide the most benefits [22]. Battery aging and energy prices have significant impacts on the economics of PHEVs. A real-world-dri-ing-behavior-based simulation model for PHEVs on the electricity grid allows us to compare the impact of various charging techniques. It illustrates that using the right charging strategy may extend battery life and lower charging expenses. According to the findings, automakers should develop sophisticated charging techniques [23].
Various studies have been carried out in relation to the integration of EVs and their potential impacts on the utility grid. In Reference [24], the authors investigated grid impact on the operation of ten electrified vehicles and solar stations for two years considering load scheduling problems. However, the analysis results for daily power demand were not considered in this study. Moreover, this study did not consider transformer load factors and other power quality parameters. In Reference [25], a framework was proposed for adequacy analysis, while the simulation results illustrated that the proposed approach effectively enhances adequacy evaluation of the power network. This study considered one ideal charging schedule, whereas voltage deviation, voltage sag and hourly power demand have not been considered. In Reference [26], a systematic co-modeling and simulation framework to evaluate the medium-scale EV-charging impacts on the power distribution network were proposed. However, the size of the AC distribution system and load demand before and after EV charging are not considered. In Reference [27], the authors evaluated the impact of EVs on power loss, system voltage profile and line loading by considering low- and large-scale EV integration. This study considered a single EV-charging scenario for a 24-h period only, while the SOC of the EV battery was not studied. The authors of Reference [28] focused on enhancing significant issues at the time of large-scale EVs deployment in the Indian market. This study provides a contextual overview of battery-based EV integration and impacts on Delhi’s distribution grid. In contrast, the SOC of different types of EVs battery, grid power quality and charging schedule were not contemplated. In Reference [29], the author provided an overview of the present E-mobility scenario in Germany, and they also analyzed the possible role of E-mobility for the distribution grid. This study considered one ideal charging schedule, whereas the SOC of different types of EV batteries and the power quality of the grid were not considered. In Reference [30], the author presented a control strategy for a V2G-integration-based radial power distribution grid, as well as regulation schemes, which were developed at both the microgrid level and distribution level. The proposed V2G integration control schemes were simulated and verified in a modified IEEE 37 bus distribution system. The simulation results were presented to show the effectiveness of the V2G integration control algorithms. Moreover, this study considered voltage profiles only for a short period. For integrating large-scale EVs with the power grid, a framework Distributed Resource Allocation (DRA) approach was proposed by the authors in Reference [31]. The major goal of the study was to acquire an approving charging strategy for the grid, which was connected with PEVs in such a way that it satisfied both grid objectives in terms of load profile smoothening and minimizing load shifting. In contrast, the power quality of the grid and charging schedule were not broadly presented in this study.
This research investigates the power demand and voltage profile considering the abovementioned research gaps for large-scale EV integration with different charging scenarios. Considering the integration of EVs into the transport and power grid, it is essential to understand the charge demand. Another significant contribution of this research is that the EVs’ charging infrastructure, using the lookup-table method, was proposed while considering the cyber–physical grid model with the help of a bottom-up approach. The system model, EV-charging approach with a lookup table and the associated controllers are developed in MATLAB Simulink. The novelty in this study are as follows:
  • Development of cyber–physical grid model in MATLAB Simulink following bottom-up approach.
  • Development of Electric Vehicles charging infrastructure by using the lookup-table method in different time schedule (100 electric vehicles).
  • Residential load profile designing for 1000 households.
  • Analyzing residential power demand and voltage profile for 24 h.
This paper is organized into five sections. Section 2 presents the overview of EVs’ impact on the utility grid. Section 3 explains the methodology and the development of the cyber–physical grid model. The general operation of EV-charging infrastructure and modeling are further discussed in this section, as well. Section 4 outlines the simulation results and the findings of this study. The concluding remarks are highlighted in Section 5.

2. Overview of Electric Vehicles’ Impact on the Utility Grid

Electrical-energy-based transportation is a promising solution to conventional transport networks and contributes to reducing climate-change problems. The integration of EVs with electrical networks follows many international charging protocols. EV integration has both challenges and opportunities in society. The adverse effects of EVs have been classified and carefully reviewed in the literature [32]. Remedial steps for negative impacts have also been identified with the potential research developments. The increase in EV penetration contributes to substantially increased grid power demand for charging; as a result, it has some unexpected impacts on the power grid [33,34,35]. In these circumstances, the power grid faces many problems. To mitigate these problems and to implement preventive measures, it is important to evaluate the impact of large-scale EV penetration in our utility grid. The EV-impact evaluation is based on many significant conditions, such as different characteristics of EV batteries, driving distances, profiles for fleet charging, various levels of EV penetration, tariffs, location of charging, charging patterns, strategies of charging, driving patterns for EVs, charging time, battery state of charge, demand response techniques and so on [36,37]. The following section discusses the power quality and peak demand issues that arise in the electricity grid from the large-scale integration of EVs.

2.1. Issues of Phase Unbalance and Voltage Instability

Voltage instability is one of the major problems that has been observed in the electrical grid in the presence of high penetration of EVs. The cause is that the power grid typically runs up to the system’s reliability constraints and has significant load demands. Different features and charging schedules of EVs also cause instability problems [38]. The attributes of the load significantly affect the reliability of the grid voltage. The complications of voltage fluctuations arise in the distribution grids and the EVs connection points [39,40]. The Monte Carlo simulation approaches for two scenarios, namely the uncoordinated charging system and the V2G technology, were proposed to investigate the effect of EV charging on grid voltage deviation below the tolerance level of 7% for the Chinese 10 kVA distribution network [41]. The study demonstrated that voltage values with 90% of EV integration in the Chinese distribution network were regulated in the V2G charging mode. The penetration rate of 60% or above with coordinated charging systems exceeds operating conditions and significantly changes the voltages of the network. The EV-charging system can perform the load balancing and maintain the minimum voltage difference between off-peak and peak load demands [42]. The smart charging technique can help integrate up to 50% EVs, while keeping the voltage deviation within the acceptable limits [18].
In Reference [43], the EV-charging model was built with constant power and negative exponential load components in the Simulink configuration. The model simulation was conducted using the IEEE-43 bus distribution network and the investigation was carried out based on several variables including location, number of charging stations of EVs and power factor based on load margin. The outcomes demonstrated that fast charging of EVs was commonly employed as a solution for voltage instability problems. A wide area management technique was introduced in Reference [36] to enhance the voltage instability problems for different degrees of penetration in EVs.

2.2. Impact Analysis of Load Profile and Peak Demand

Several studies were conducted to assess load profile and distribution grid demand of EV-charging strategies. The research into substantial peak demand was carried out as a result of the increasing usage of EVs. In Reference [34], the study revealed that 100% penetration of EVs with uncoordinated charging system introduces higher peaks in demand which surpasses the required electricity generation capacity on average load days. Another research [44] was conducted in Western Australia Perth electricity grid, based on 100% EV integration with an uncoordinated charge system in the grid. The result illustrated that the peak demands exceeded the daily average power. In a similar report, the effect of an uncoordinated charging scenario with an integration level of 30% EVs increased the peak demand to 53% [45]. Uncontrolled charging in suburban areas resulted in a significant increase in EV penetration, up to 10%. A significant increase in peak demand is also found within the typical EV-charge scenario. The impact of coordinated charging increased by 53%, with a penetration rate of 30% in EVs [46]. However, without increased generation capacity, only time-of-use (ToU) tariff plans and structured charging situations can significantly reduce peak demand [47].
In Reference [48], the authors showed that the current US grid network capability can accommodate penetration levels of up to 73% of EVs. To determine the load profile’s effect, a scientific study [32] was undertaken on the German power system in 2030. However, 42 million Internal Combustion Engine (ICE) cars are supplemented by electric vehicles. The study also showed that a 16% lower peak load could be accomplished using one million EVs as a storage grid stabilizer. Reference [49] presents an hourly overview of the Korean grid featuring criteria, such as EVs charge position. This study emphasizes the stability of the delivery grid as a result of additional charging scenarios for EVs. The dilemma of the peak load profile is therefore addressed with ToU tariff arrangements. In [50], the authors proposed a strategy considering uncoordinated EV charging and high penetration of renewable energy sources (RESs), which is based on nine scenarios with a different installed capacity of solar and wind power generation. The optimization results demonstrate that 7.9% and 7% costs of EVs aggregator could reduce when RESs installation capacity is 5 and 10 MW, respectively.
In another study [51], a grid analysis was conducted, considering 30% EV-penetration levels in the Estonian electricity grid to evaluate the impact of coordinated and uncoordinated charging of EVs. The findings illustrated that a 5% rise in peak load was reported for uncoordinated changing, and a 4% increase in peak demand was observed for coordinated charging. However, the coordinated charging, especially at night, avoided the rise of sudden peaks in the demand curve. In Reference [52], in comparison, the nighttime-controlled charging approach has been balancing with the load profile. The researchers proposed an intelligent charging technique to avoid peak residential and EVs load duplication. The offering includes various charging options, having fast charging, AC charging, easy DC charging and the possibility of battery swaps. Queuing model serves to predict delays across multiple charging plants. A principle of partial charging is employed to avoid duplication of EVs and maximum residential load. The ideal challenge is to find a minimal charge time, expense and travel time to provide an efficient charging station with an optimized solution. Improved meta-heuristic optimization of the colony was carried out, and the proposed findings suggest a decrease in the charging cost of 15% and a waiting period of 25%. However, to the best of the authors’ knowledge, the lookup-table-based EV-integration impacts have not been analyzed while considering the power quality issues.

3. Design Methodology and Grid Modeling

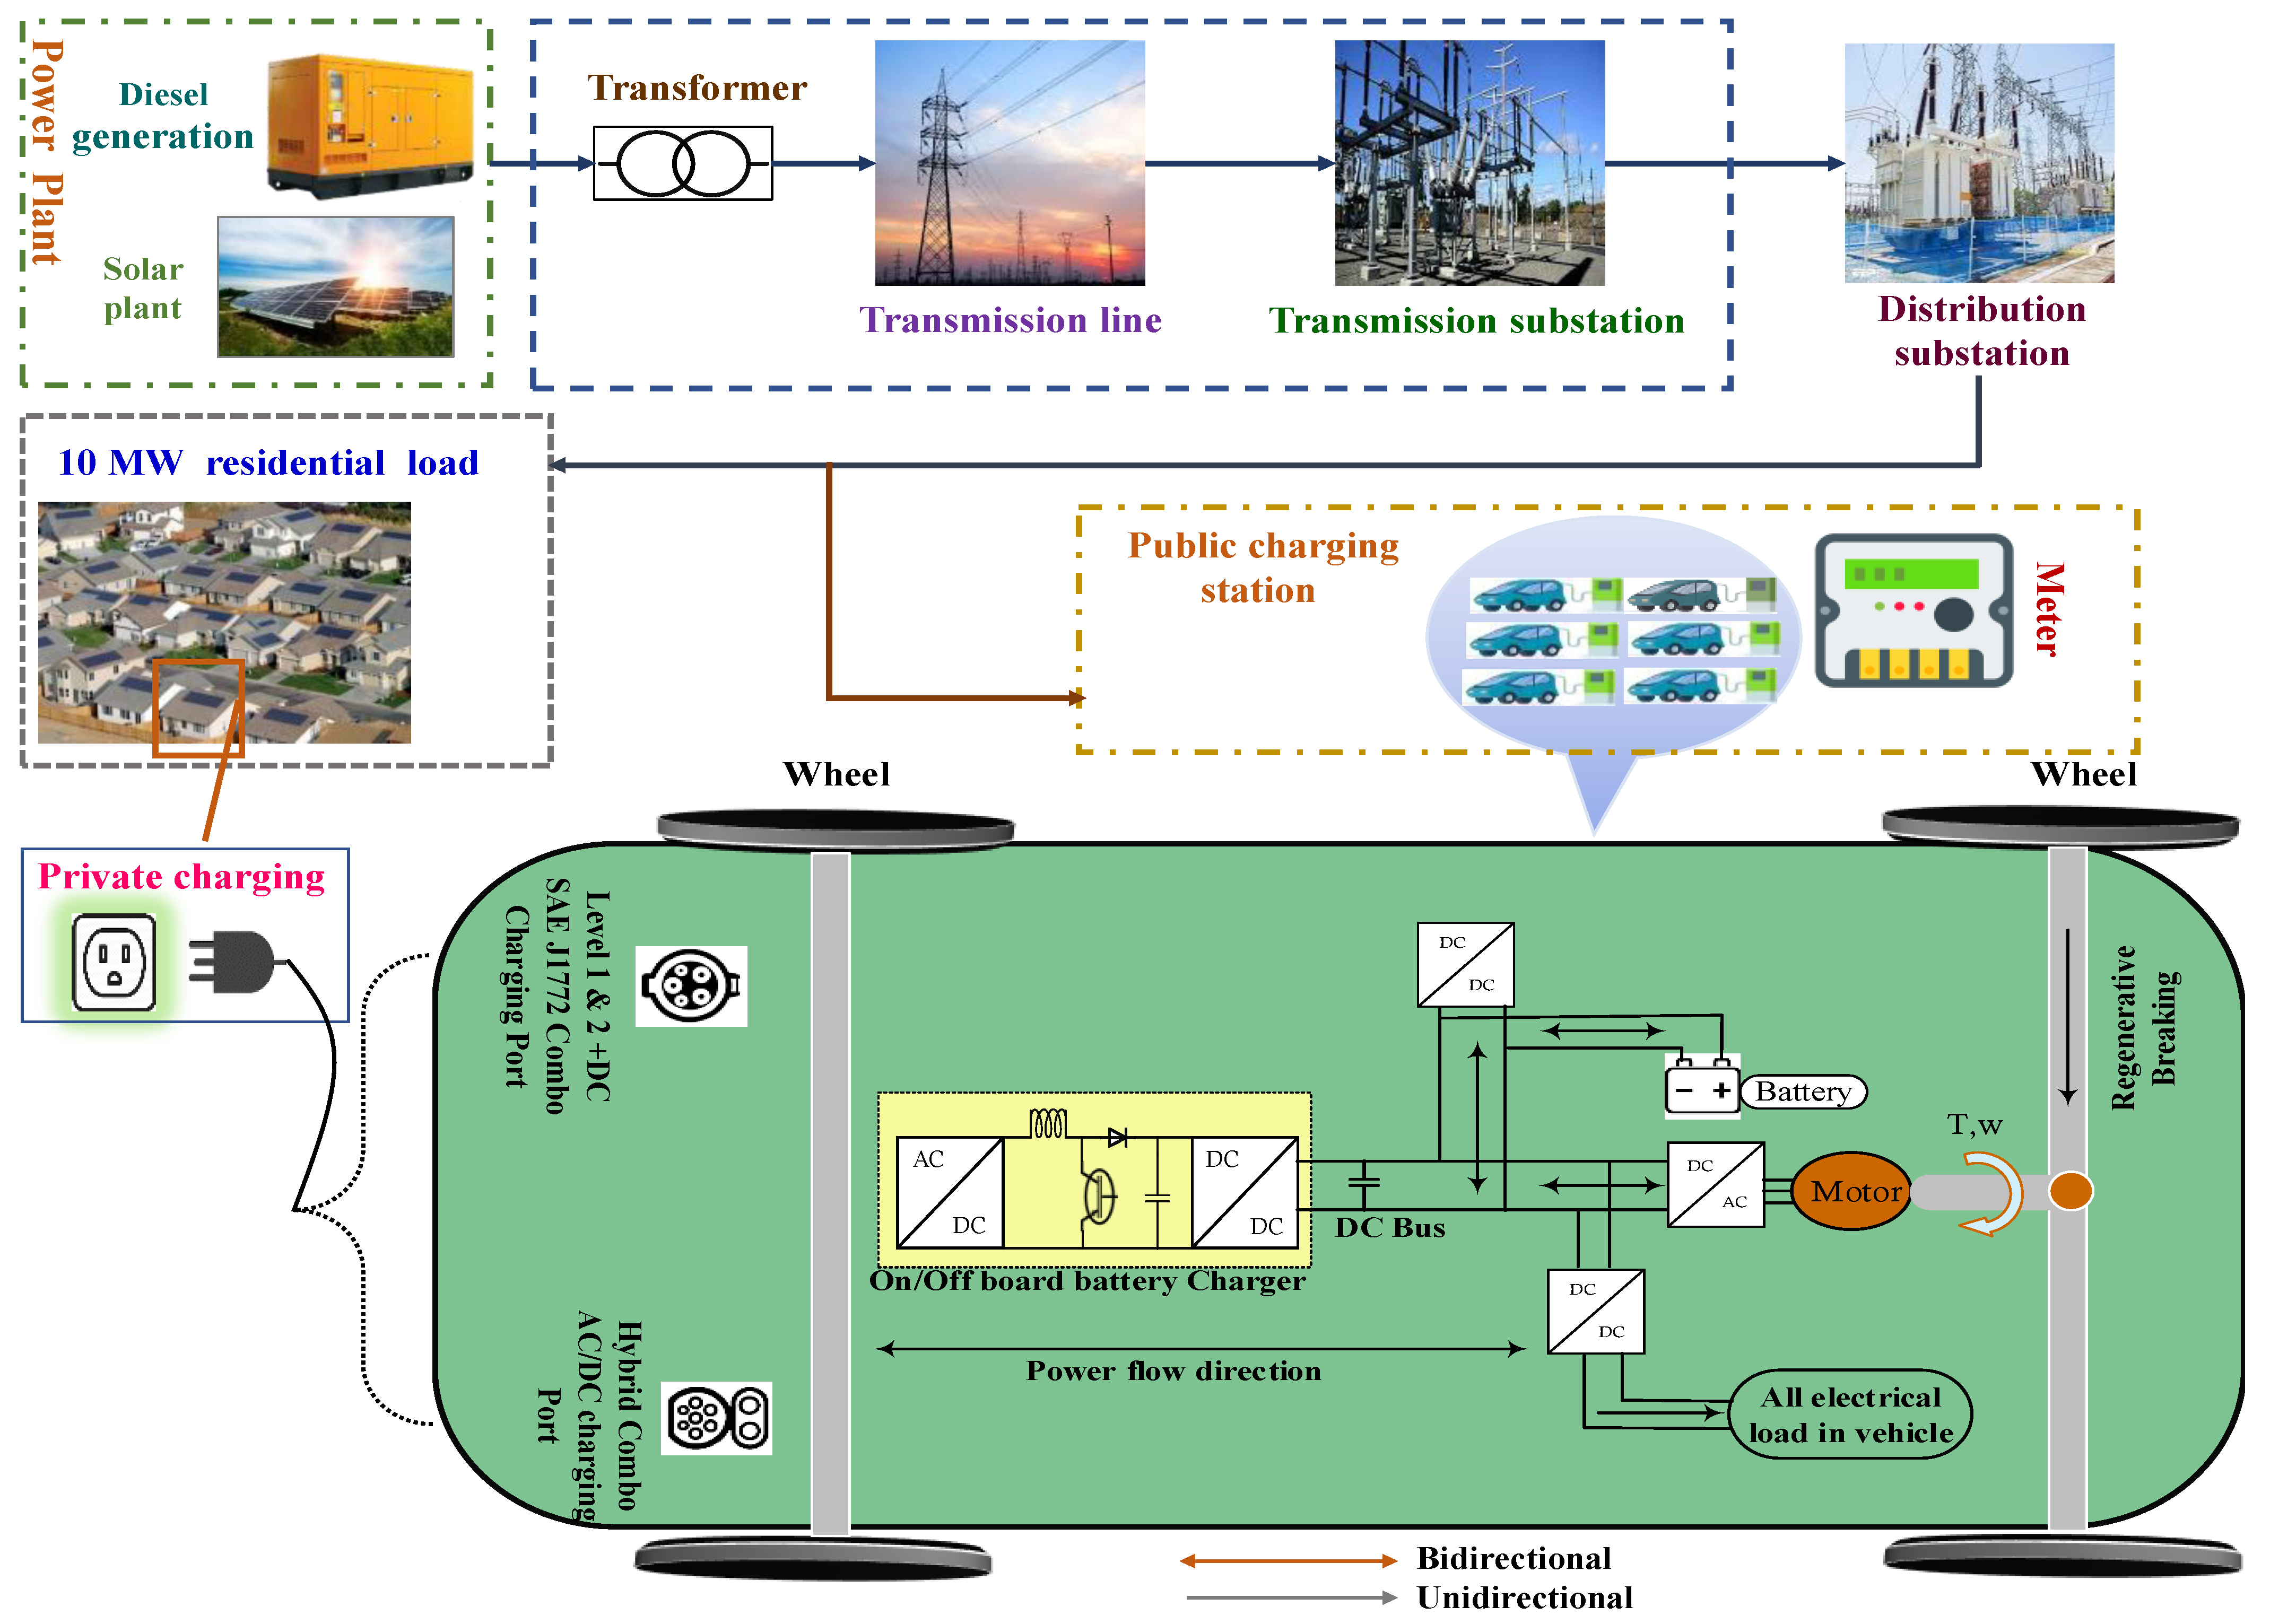
3.1. Structure of Electric Vehicles Charging Infrastructure

Grid connectivity, EV and network operator contact, and meter are essential for the advantage of grid-to-vehicle (G2V) service. Figure 1 shows the overall grid-to-vehicle (G2V) framework implementation, its specifications and G2V power flow.
Considering the V2G infrastructure, distributed storage capacities have impacts on grid operation. Electric vehicles have the energy backup ability to build and use their energy storage devices for energy supply in low-voltage grids. EVs can contribute to the collection and distribution of grid resources. It leads to the injection of electricity into the distribution grid as required and functions as a reservoir of distributed storage capacity. EVs can serve as a power source on the delivery side for emergency generators. As EVs are attached to a power supply, they can be used in two separate modes:
  • Charging mode, known as G2V mode.
  • Discharge mode, known as V2G mode.
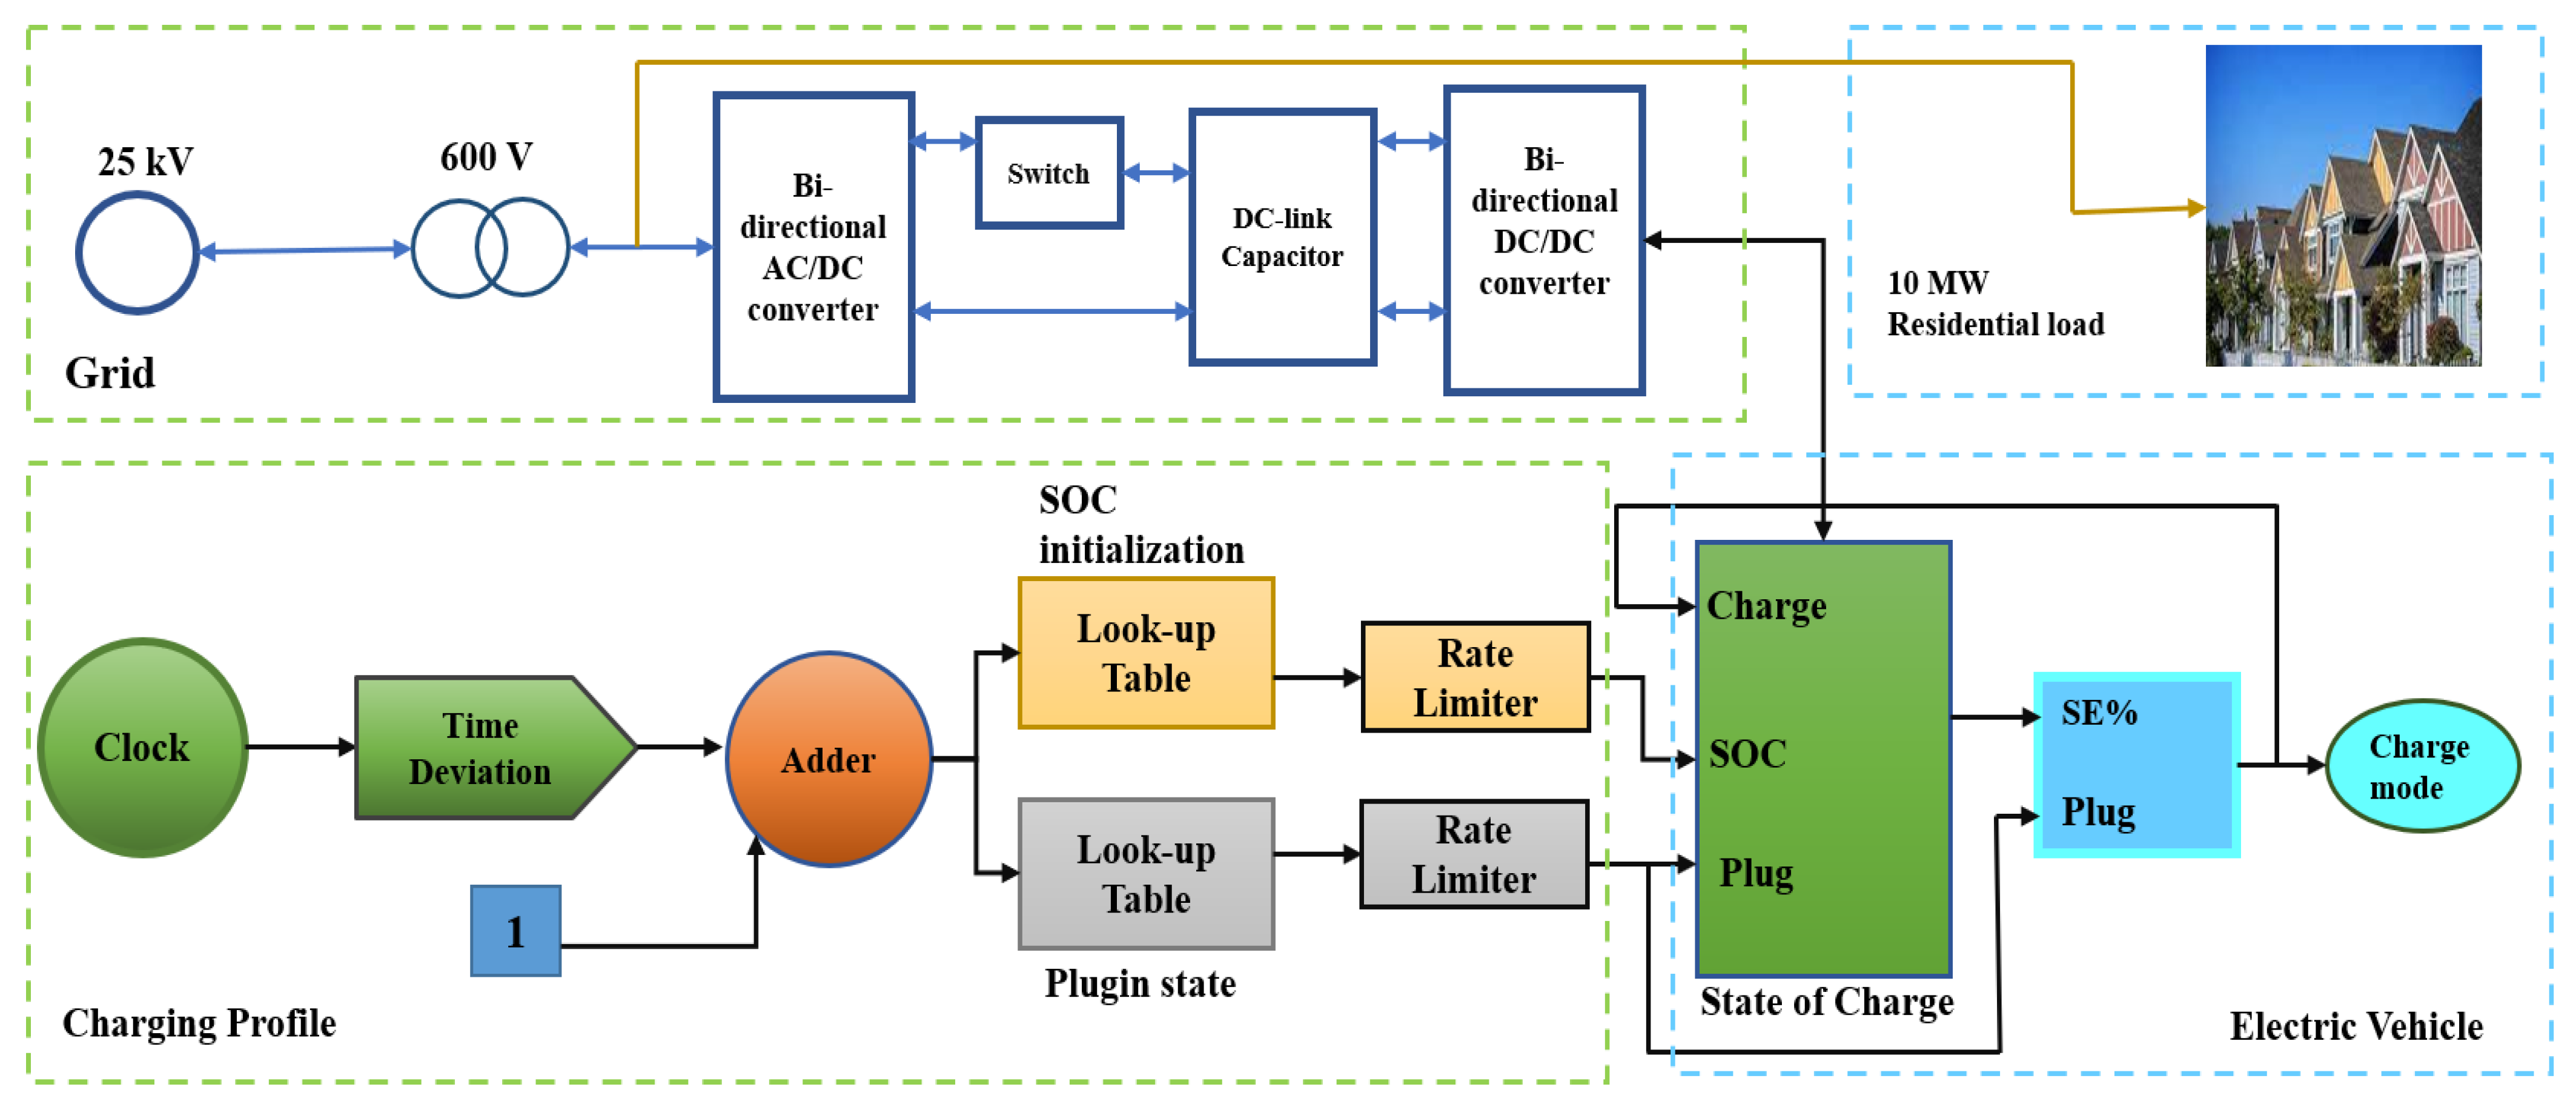
EV is a grid load in the first mode, while in the second mode, EV supplies power to the utility grid. Thus, EV is known as load or generation depending on the connection modes. When vehicles are in charge mode, they can store energy; meanwhile, they release energy during discharge. EVs can serve as a quick response load, but they can be a generator/power source for the distribution network (DN) if they plug in the grid V2G technology-enabled mode. This study shows various EV charging modes, concerning the different charging demands and time scales. The voltage profile and distribution grid power demand were assessed from these scenarios. Furthermore, large-scale EV integration was considered by incorporating a lookup-table-based approach.

3.2. Grid Modeling

The grid consists of three major parts: (i) a diesel generator, functioning as the foundation power generator; (ii) a solar farm for renewable energy production; and (iii) the utility grid. Diesel generators are typically employed as emergency energy systems for most large-scale and commercial systems to maintain a continuous power supply. The electricity generated from the grid integrated PV farms depends on several factors: (1) the size of the area covered by the PV farm, (2) the solar panels’ performance and (3) the solar radiation statistics. During the low-demand day in spring or fall, the microgrid (presented in Figure 1) covers a community of about one thousand residences. There are 100 electric vehicles in the simple model, ensuring that the vehicles and residences have a 1:10 ratio for coordinate scenarios. The load consists of a residential and an asynchronous machine that acts as an industrial inductive load on the grid. The residential load fits an energy factor utilization profile. The asynchronous system is modeled by a square relationship between rotor velocity and mechanical torque. To monitor the battery charges, four separate EV user profiles are implemented:
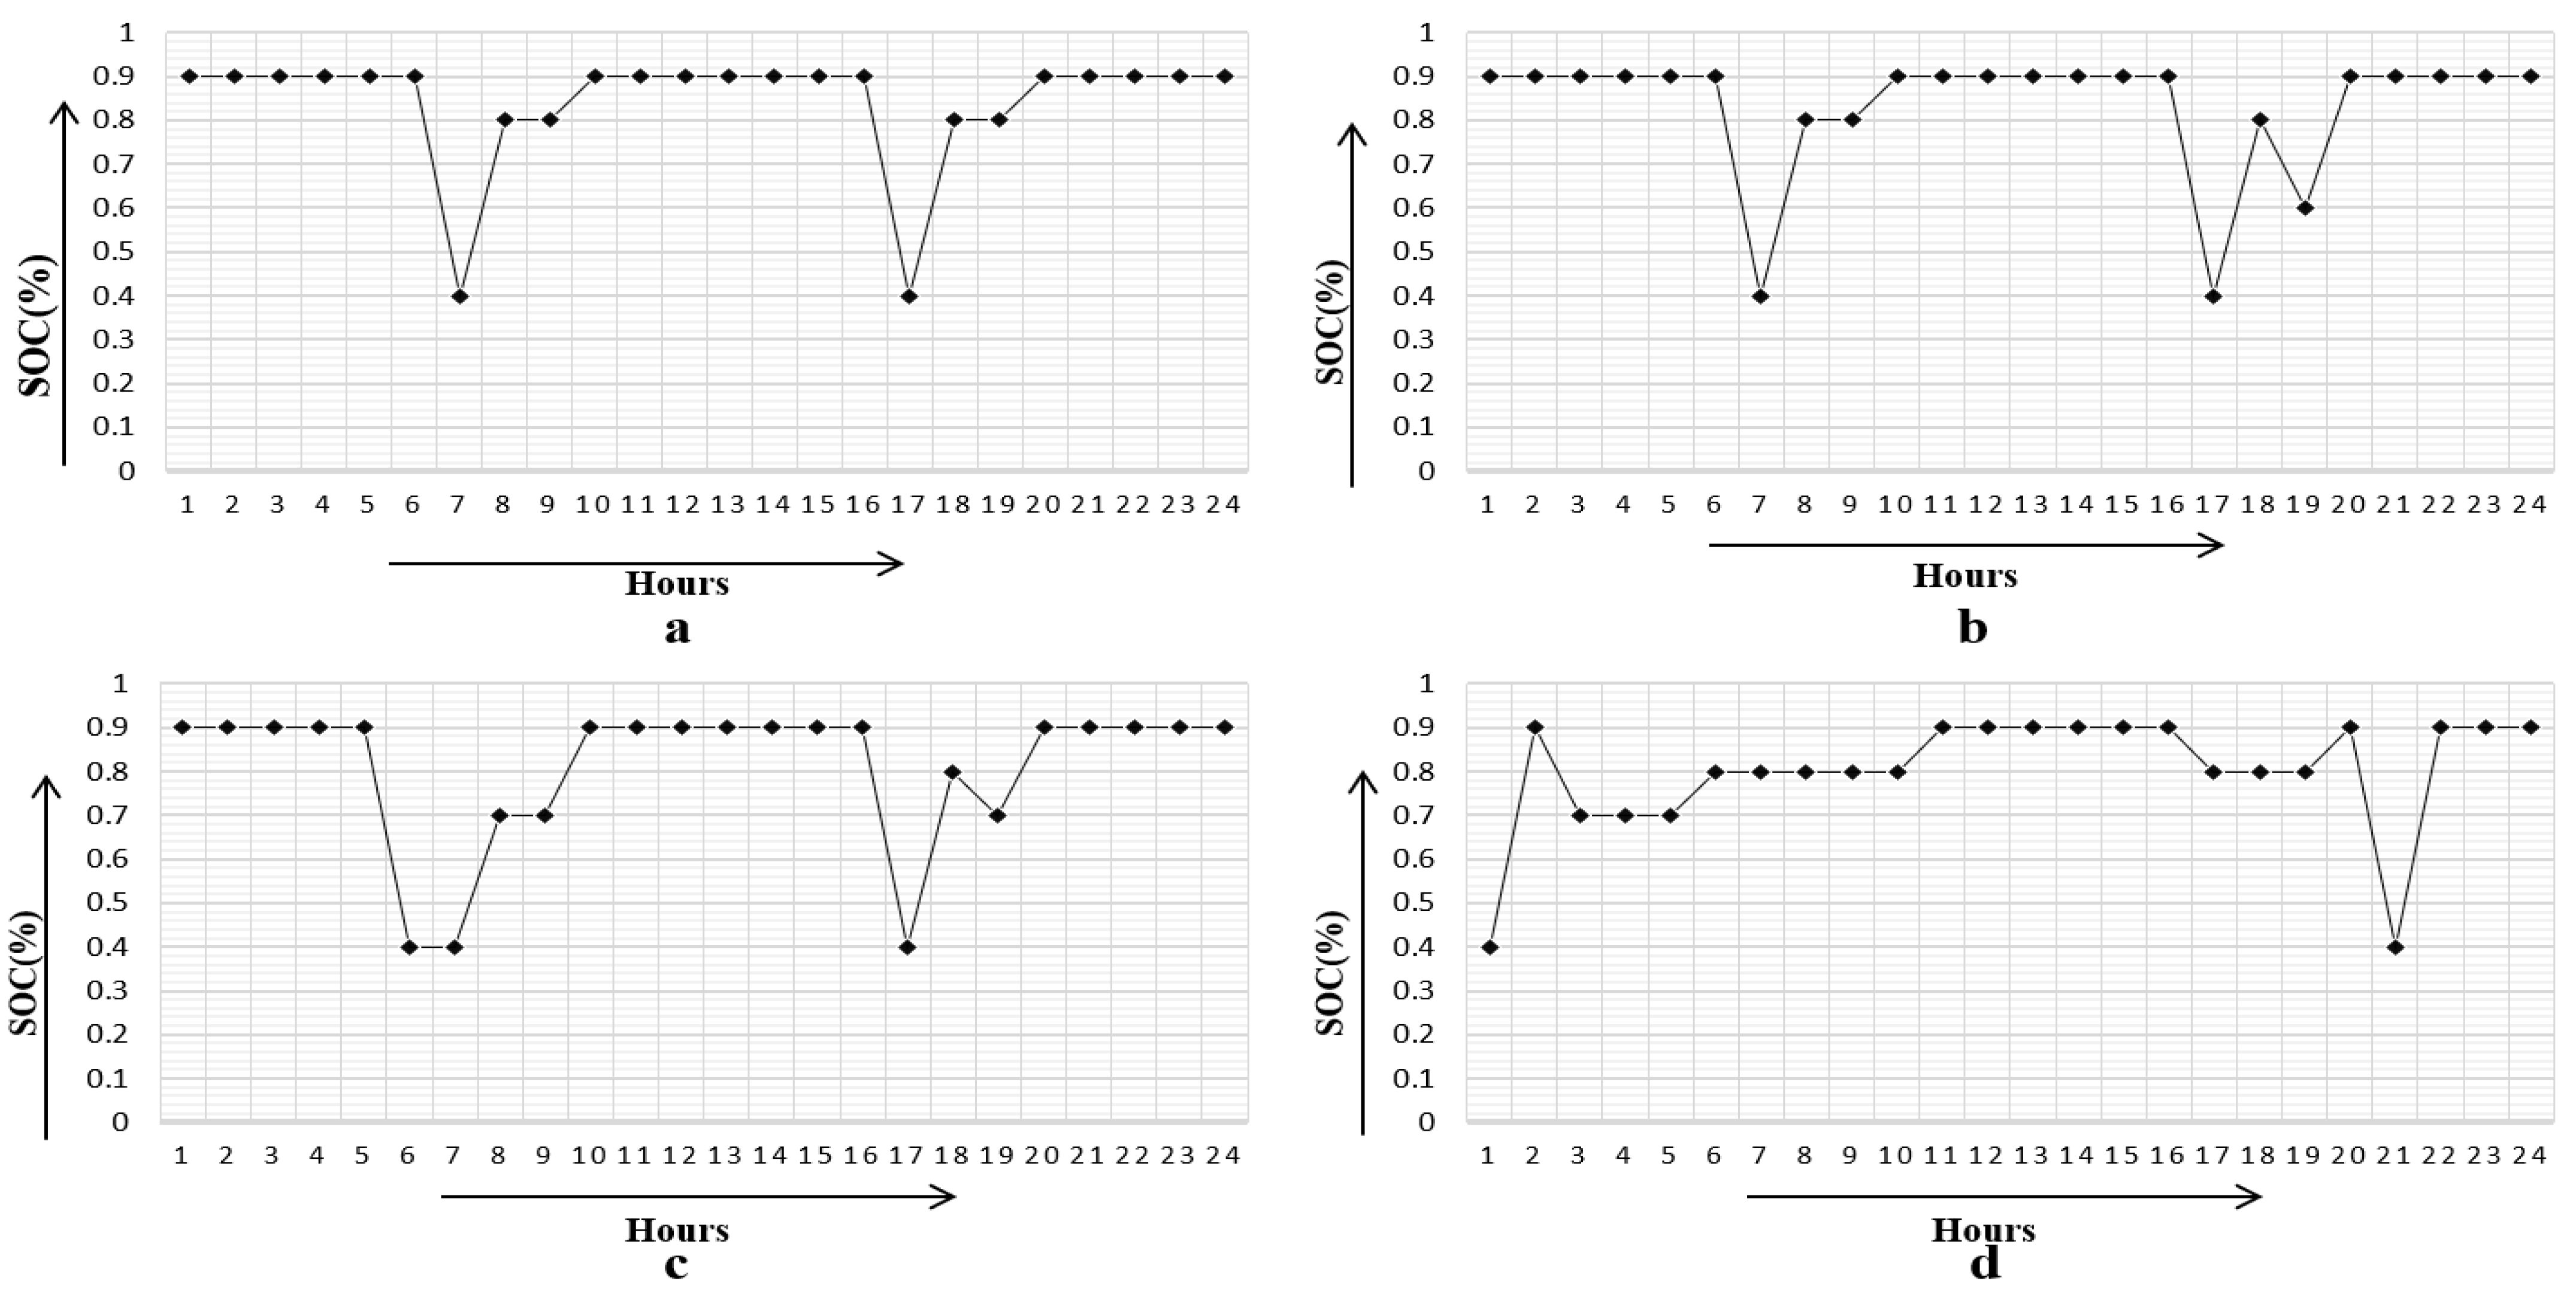
  • Profile 1: People would have the possibility of charging their EVs at work.
  • Profile 2: People have been able to charge their EVs at work.
  • Profile 3: People going to work with no possibility to charge their EVs at work.
  • Profile 4: People working a night shift.

3.3. Design of Electric Vehicles Charging Profile

Estimating the state of charge (SOC) of EVs batteries is critical to avoid overcharging and a lower depth-of-discharge (DoD) level. The SOC can be used to design different controllers for improving the battery’s life cycle. The SOC of a battery is generally specified as the ratio between its current capacity ( Q t ) and its nominal capacity ( Q n ).
SOC = Q t Q n
SOC is a key indicator for measuring EV batteries’ storage status. SOC forecasts fast charging, long life cycle and high-capacity density of batteries. However, the accurate SOC analysis of batteries is complicated, due to various properties under different working conditions. Alternative techniques have been developed to estimate SOC without details on battery chemical reactors, battery models, interior features and extra filters.
As shown in Figure 2, SOC estimation methods are broadly categorized into several groups: (i) the lookup-table technique, (ii) the coulomb counting approach, (iii) model-based estimate techniques, (iv) data-driving measurement methods and (v) the hybrid methodology [53]. The lookup-table approach usually uses direct mapping of SOCs with external parameters, such as an open-circuit voltage (OCV) impedance. This approach consists of tabulating relationships by performing intense physical examinations to characterize battery behavior [5]. The approach of the OCV-lookup table is straightforward in principle and very descriptive [54]. In this study, to estimate the SOC-lookup-table method and develop a schedule, four charging profiles and a plug-in state were used.
The OCV-based SOC estimation process flowchart is shown in Figure 3. For a set interval to enter the depolarization stage, the lithium-ion battery (LIB) is charged. After that, using current pulses, the LIB is completely discharged. Then the battery is kept at rest for a set time, and the subsequent OCV of LIB is measured. The association between the OCV and the SOC is then mapped. During the charging period, the OCV display is accompanied by a similar process. When the lookup table is developed, the SOC level is given by evaluating the LIB’s simultaneous OCV. The LIB is typically run on an ongoing basis, in real-world implementations, outside the laboratory setting.

3.4. Design of Charging Infrastructure

This study simulates the charging profile, using an efficient lookup-table method in terms of learning efficiency, reliability, generalized efficiency and speed towards improved SOC evaluations. The proposed approach shows accuracy, adaptability and robustness in various operational situations. The system architecture developed in the MATLAB Simulink environment is demonstrated in Figure 4.
The charging method includes the battery current and the original SOC value to evaluate SOC and battery end voltages. The SOC is associated with the overall battery capacities (Cbat), as shown in the following equation.
SOC t + 1 = SOC t   +   1 C bat I batt dt t + 1
The open-circuit voltage of a battery (Vbatt oc) is calculated using the current SOC value from a lookup table. Vbatt oc and the internal battery resistance rbatt measure the terminal voltage, as shown in the following equation.
V batt =   V batt OC   I batt ×   r batt
The simulation technique is developed for the EV model using the available data to test vehicle parameters. The engine power for the first iteration was set to zero, so that the model fit the EV charging/discharging profile better [55,56]. This approach was introduced, since the vehicle model must first be tested as a real-world vehicle would to ensure accurate simulation performance.

3.5. EV Driving Pattern

Although the EV can be used as a controllable load, the representation of EV-charging power as a particular load curve is complicated. Since the EV drives in a stochastic form, probabilistic methods for imitating EV driving characteristics are used.
The charge-depleting mode is designed to run EVs between the SOC 0.4 and 0.9. The All Electrical range of Rd, using EV, before the upcoming at the end of moving interval R is calculated as follows:
SOC in = 1 R R d , 0 < R < 0.9 × R d 0.4 , otherwise
In this study, the battery average power is assumed 40 kW and battery efficiency of 90%. The power required to charge the EV battery fully can be expressed as follows:
P EV =   1 SOC in × 40 kW 90 %
The parameters for the plug-in charging time and travel distance for each vehicle type under consideration are as shown in Figure 5. High-range charge-depletion mode means that the probability of charging is zero. Low-range charge-depletion mode implies that the likelihood of charging is high. Hence, EVs are in charging mode when connected to the distribution grid.

4. Results and Discussions

This section presents the simulation results, considering the four scenarios presented above. The detailed results are presented and discussed in the upcoming subsections.

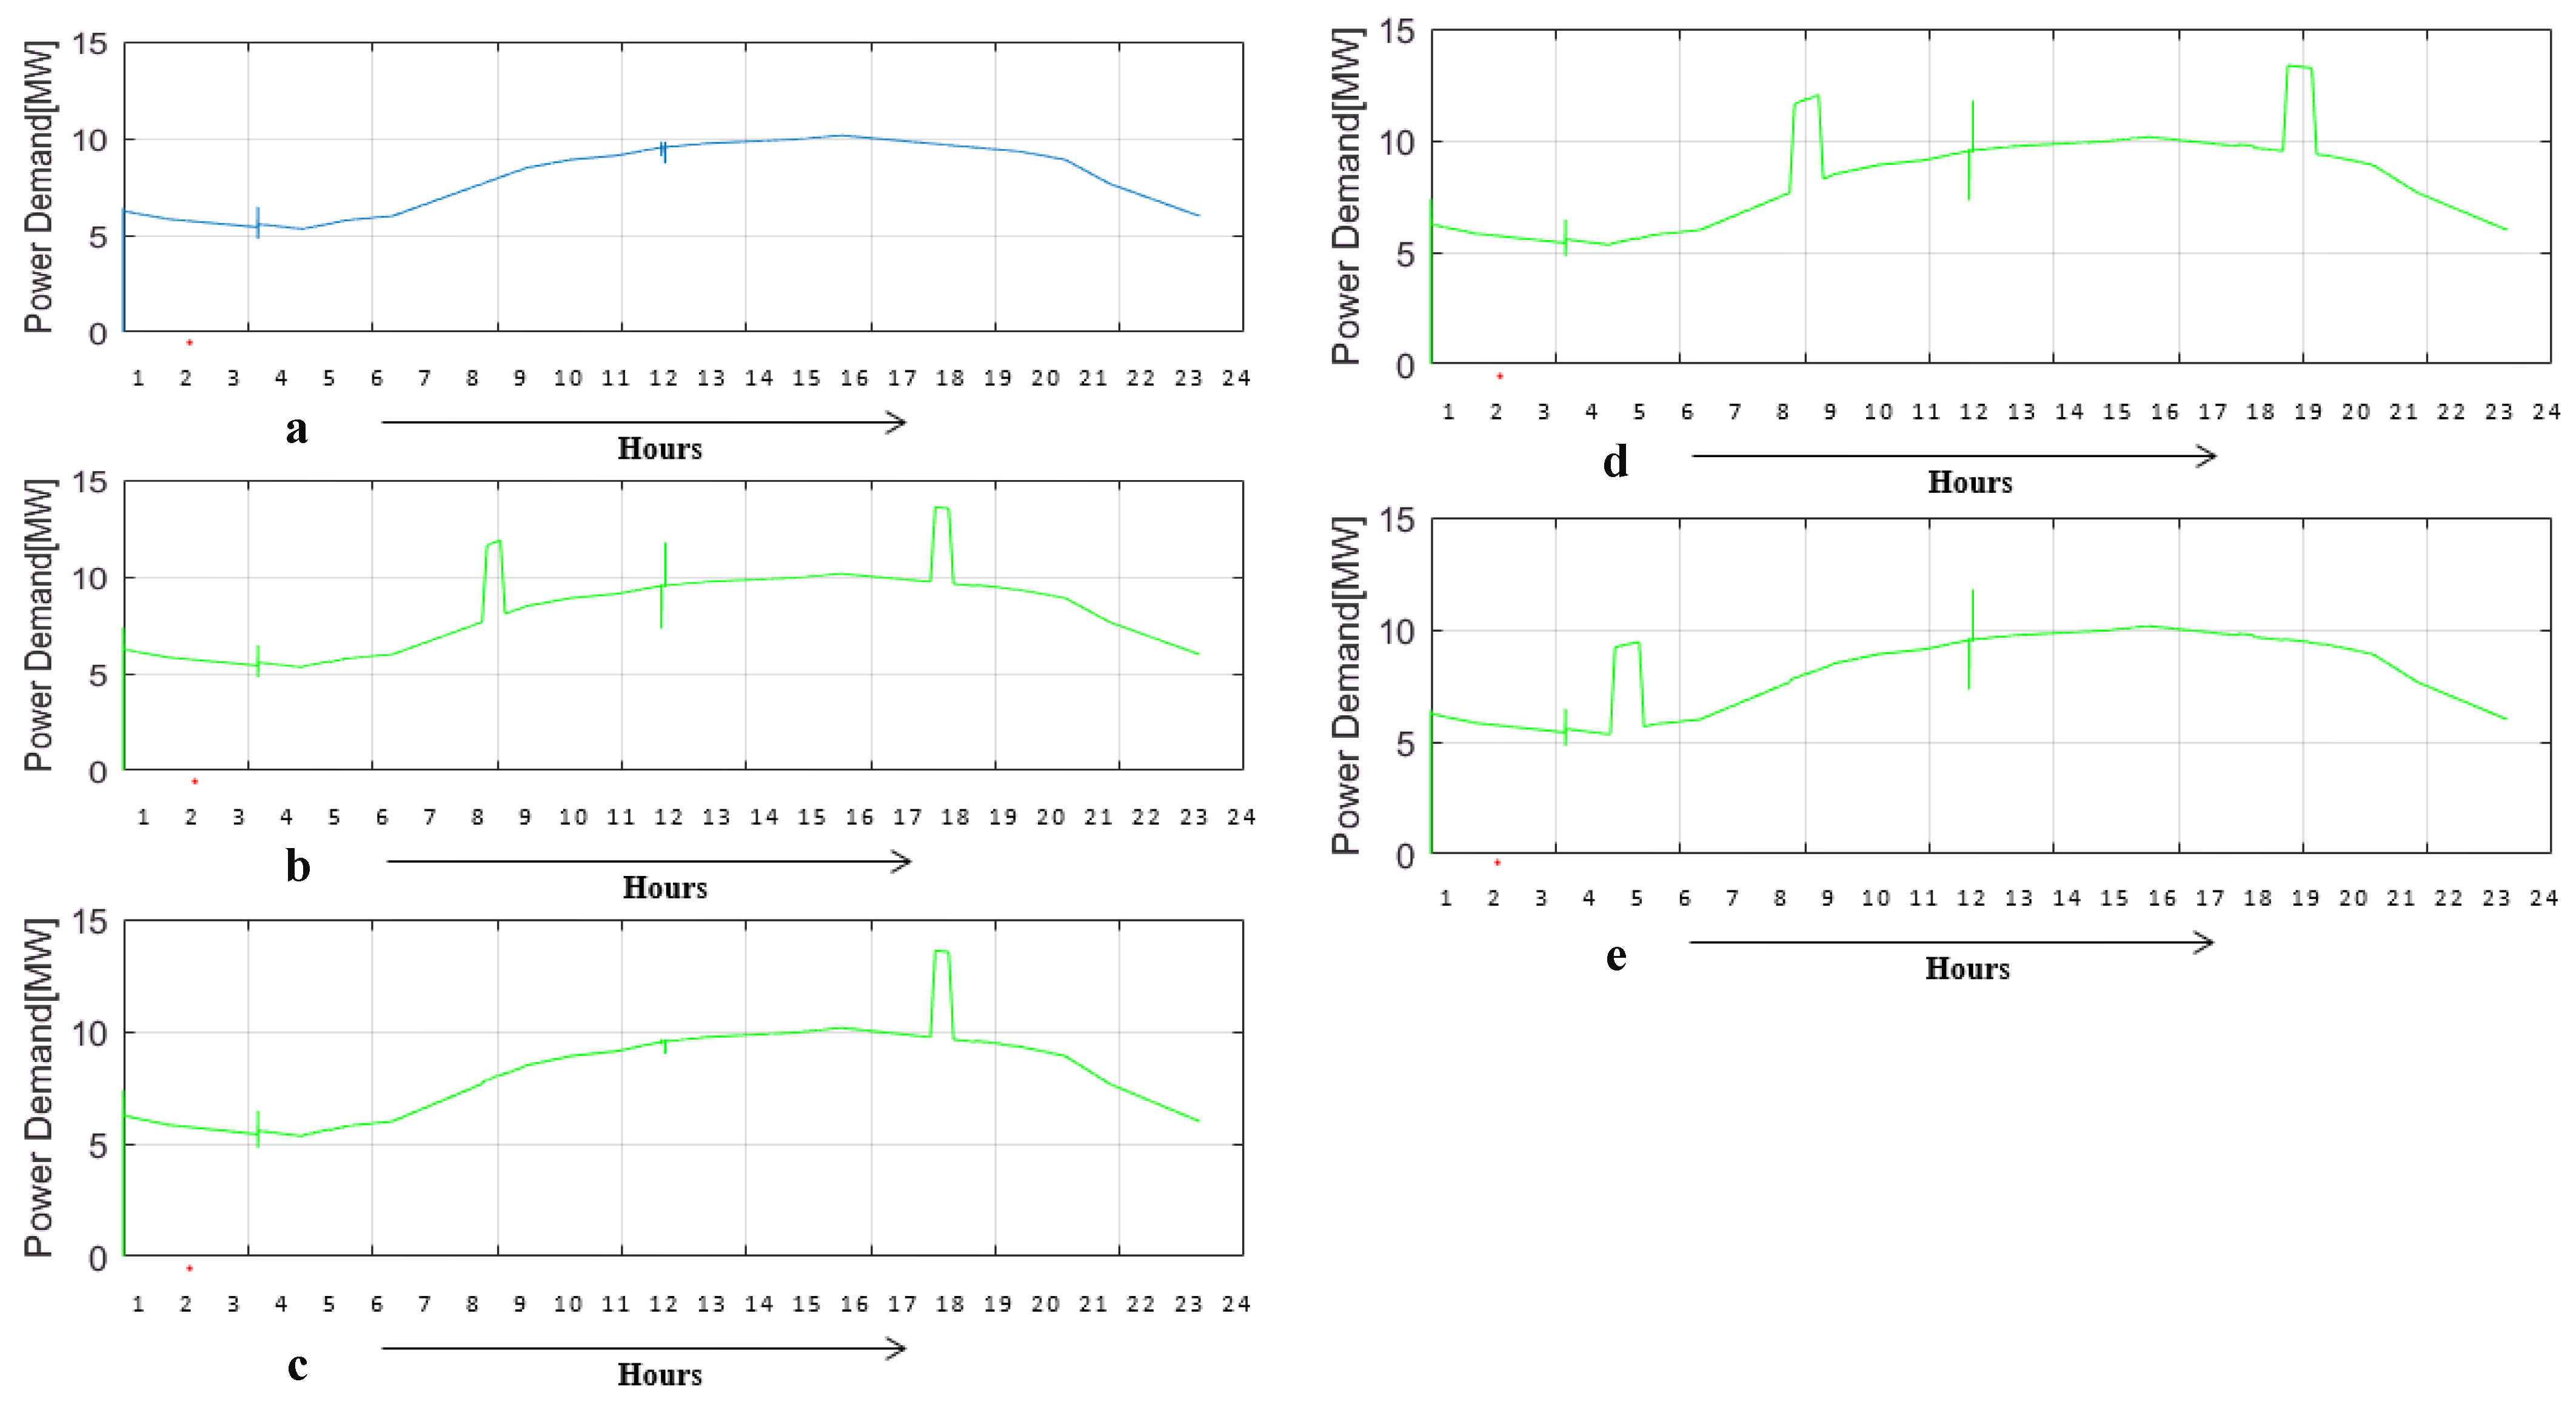
4.1. Impact on Local Residential Electrical Grid Power Demand

To assess the influence of EV-charging coordinated on the electric power distribution structure, this study considered a distribution transformer with 1000 residential loads. Table 1 presents the influence of the coordinated EV charging on distribution network integrated with residential electric power under fast EV charging, assuming an EV market share of 40% for four different charging profiles.
The simulated residential-grid-power-demand profile without electric-vehicle charging stations is demonstrated in Figure 6a. The power demand scenario for the 40% EVs adoption in the residential grid for EV charging Profile 1 is shown in Figure 6b, from 8:40 a.m. to 9:20 a.m. This time, which shows power demand increases from 7.5 to 12.8 MW. It means the power demand increases in the grid by 53%. From 6:15 p.m. to 6:50 p.m., the EVs are in a charging fleet, and the power demand rises from 10 to 14.2 MW. The power demand increases in the grid by 42% more than the conventional residential demand. The daily power-demand increase in the residential grid is 27.05%. The analytical results also consider the average transformer load factor and peak transformer load factor, as shown below.
average   transformer   load   factor = average   hourly   power   consumption transformer   nominal   power
The investigation exhibited an average transformer load factor of 0.43 when the EV-charging-station integration with the residential power grid. The average transformer load factor of 0.34 is found when the residential power grid has no EV charging station.
Peak   transformer   load   factor =   peak   hourly   power   consumption transformer   nominal   power
From 8:40 a.m. to 9:20 a.m., the peak transformer load factor (definition is shown in the equation above) is 0.512, and from 6:15 p.m. to 6:50 p.m., the peak transformer load factor of 0.568 is observed. The EVs’ adoption scenario for Profile 2 is demonstrated in Figure 6c. In the afternoon, from 5:15 p.m. to 6:45 p.m., the EVs are in charging fleet, and the power demand rises from 10 to 14.2 MW, which shows a 42% increment compared to conventional residential demand. An average transformer load factor of 0.368 was observed when the EV charging station was integrated with the residential power grid. Moreover, an average transformer load factor of 0.34 was found when the residential power grid has no EV charging station.
The power-demand scenario for EV charging Profile 3 is revealed in Figure 6d, from 8:15 a.m. to 9:30 a.m. It is observed that the power demand increases 7.5 to 12.4 MW, which corresponds to a 53% increment. From 7:15 p.m. to 8:00 p.m., the EVs are in charging fleet, and the power demand rises from 10 to 14 MW. The hourly power demand increases in the grid by 42% more than the conventional residential demand. The daily power-demand increase in the residential grid is 37%. The analysis shows an average transformer load factor of 0.47 when the EV charging station is integrated with the residential power grid. When there is no EV charging station, an average transformer load factor of 0.34 is experienced. From 7:40 a.m. to 8:50 a.m., the peak transformer load factor is 0.512, and from 6:50 p.m. to 7:45 p.m., the peak transformer load factor is 0.568 for the system with EV integration.
A residential power-demand increment of 3.9 MW for EV-charging Profile 4 is shown in Figure 6e, from 3:40 a.m. to 5:00 a.m. This represents the hourly power demand increase in the grid by 74.47% more than the conventional residential demand. The daily power demand increase in the residential grid is 4.71%, showing an average transformer load factor of 0.36 when the EV charging station integrates with the residential power grid. However, the load factor is reduced by 0.02 when the residential power grid has no EV charging station. From 3:40 a.m. to 5:00 a.m., we observed a peak transformer load factor of 0.156.
The analysis demonstrates the total residential power demand at the distribution transformer under four scenarios and 40% EV integration during a day. The analysis aims to explore the minimum influence and a large-scale EV-integration scenario. This study considers fast charging to illustrate the impact of different power levels of EV charging. The study finds that the impact of the EV-charging power level is significant on the local residential electricity demand. The sharp peaks are introduced in the local electricity demand, while fast charging is employed even when EVs are connected to the residential distribution transformer. It is noticed from Table 1 that fast charging (40 kW) has substantial impacts on residential distribution connected with EVs, since charging events are shorter but steeper at the time of fast and coordinate charging is adopted. The power demand could increase to 40% EVs. An increase of about 27.05% for Profile 1, 8.23% for Profile 2, 37% for Profile 3 and 4.17% for Profile 4 is reported when 100 EVs are considered. The charging times are decreased with the increase in charging power, hence, a fewer number of vehicles can be charged simultaneously when a more robust charging infrastructure is obtainable. With the improved modeling used in this study and the assumption of fast and coordinate charging under the EV market share of approximately 40%, the maximum 100 EVs are charged at a different schedule in the simulated day.

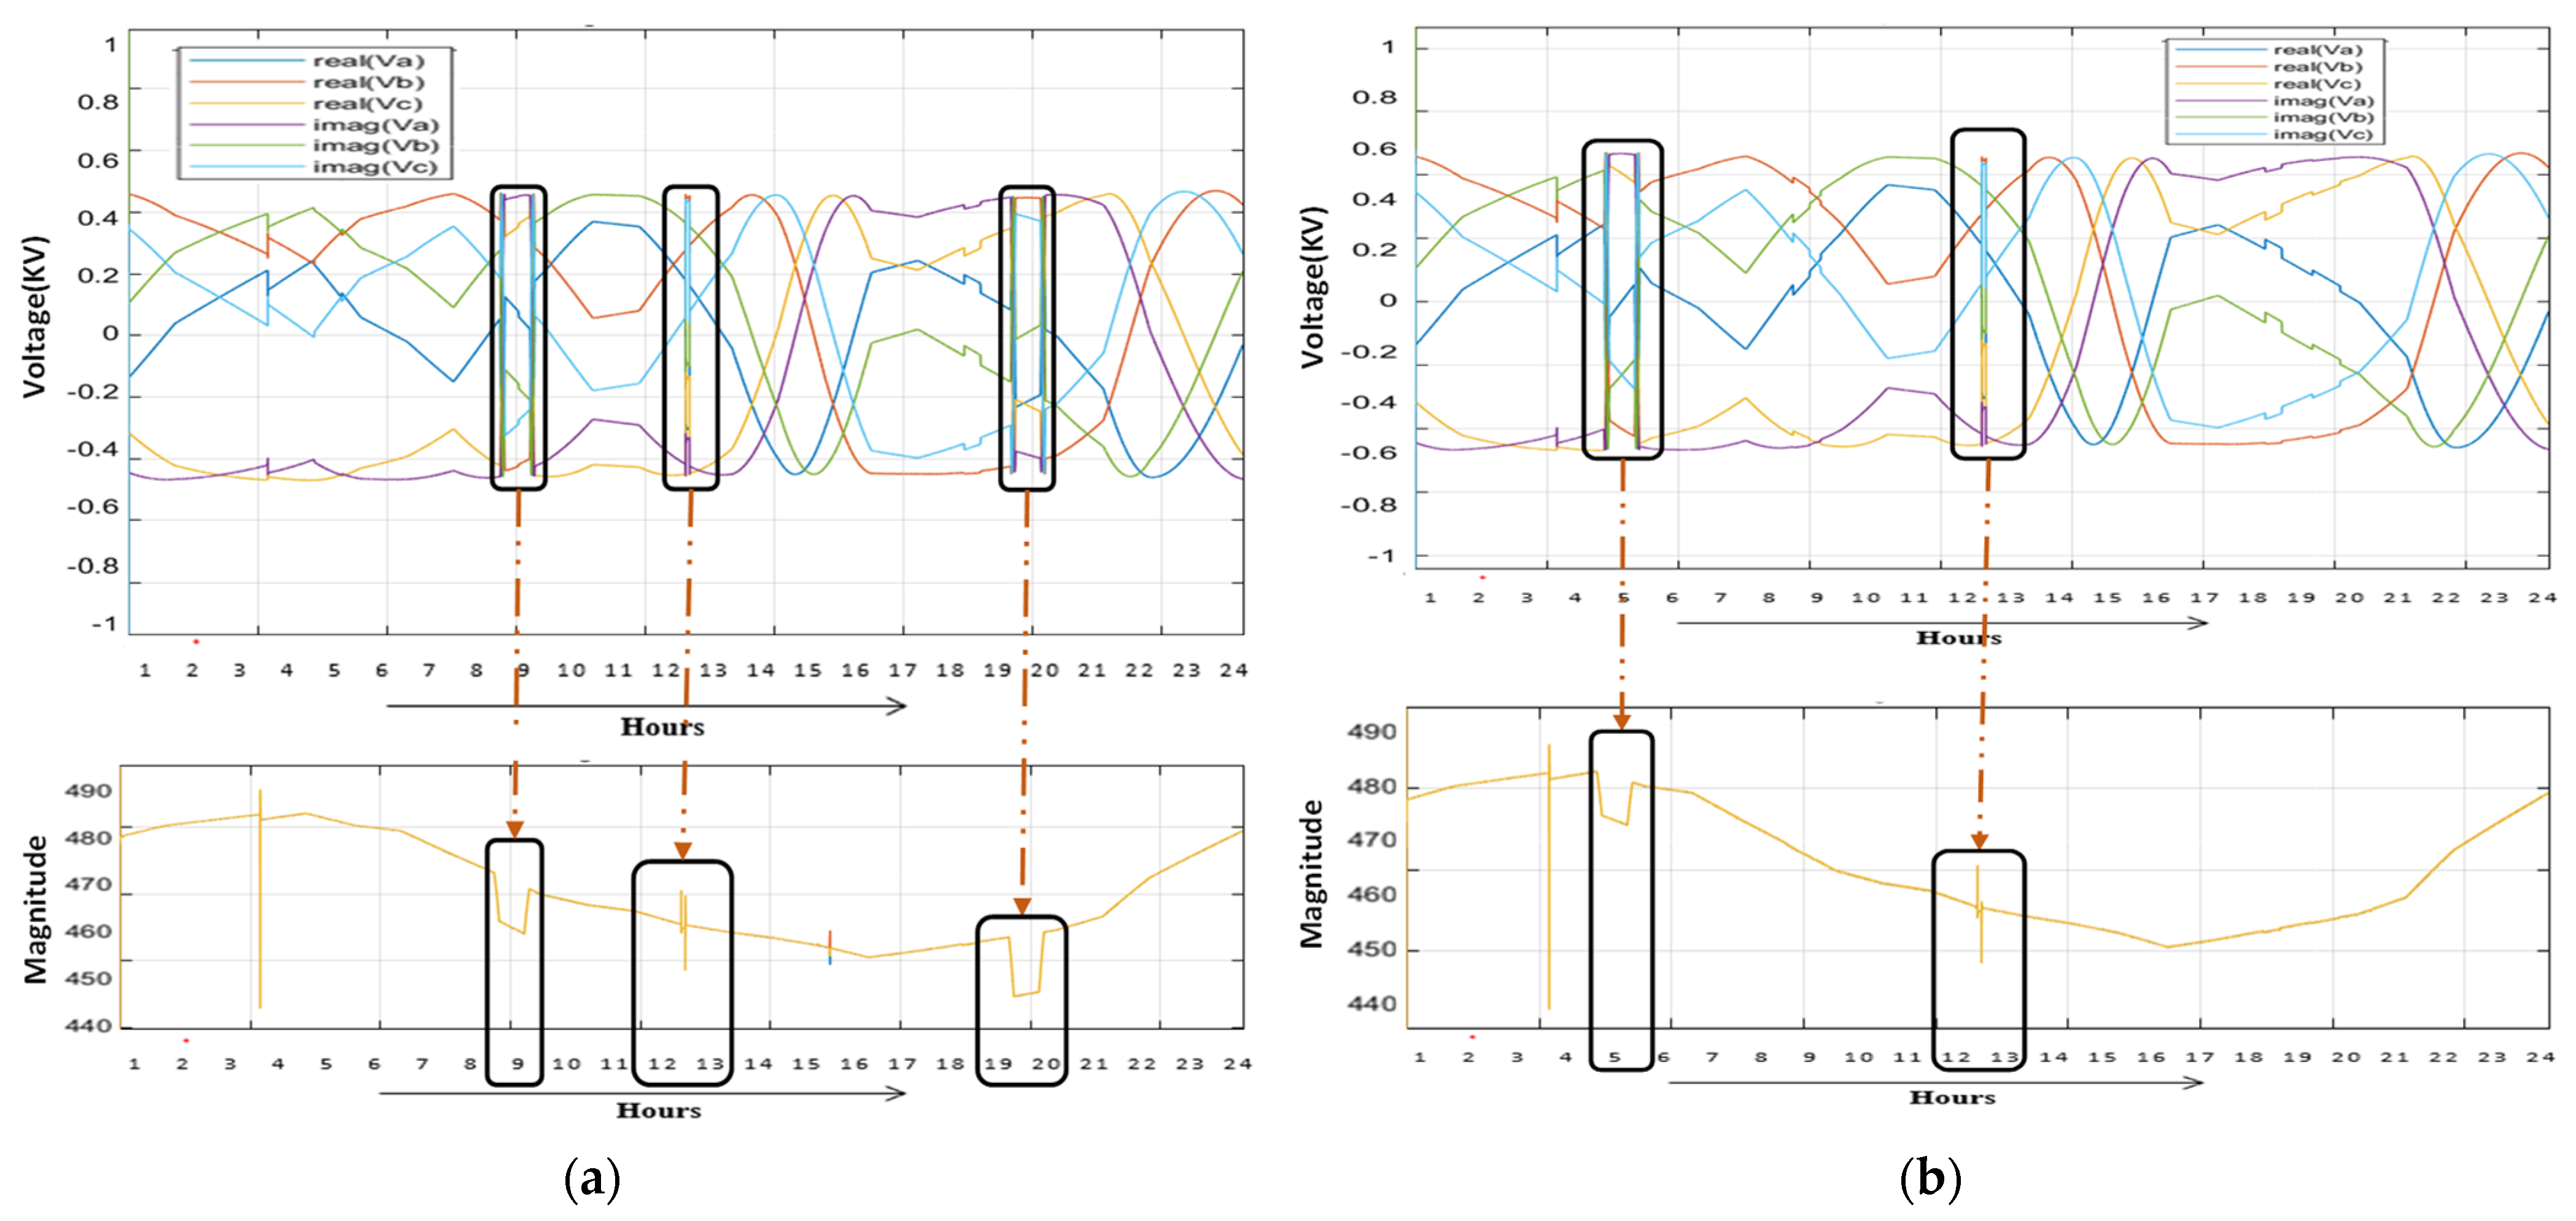
4.2. Residential Grid Voltage Profile Assessment

In addition to presenting power demand, average transformer load factor and peak transformer load factor, the analytical representation of voltage and current is imperative when considering large-scale EV integration. This section deals with the analysis of residential grid voltage and current. The voltage sag of the residential grid with coordinated charging is shown in Figure 7a. For 40% EV penetration, the maximum voltage sag reaches 1.96% from 8:40 a.m. to 9:20 a.m.
The voltage sag increased to 1.77% from 6:35 p.m. to 7:00 p.m. The voltage deviation is the difference between the nominal voltage and the actual voltage. According to Equation (8), the root means the square value is usually used to calculate the voltage deviation.
V = 0 T v 2 t dt T  
For 40% EV penetration, the voltage deviation increased to 8% from 8:40 a.m. to 9:20 a.m. and 10% from 6:35 p.m. to 7:00 p.m. The figure illustrates that by increasing the penetration level of EVs, the system energy losses increase. The voltage sag of the residential grid with coordinated charging for charging Profile 2 is shown in Figure 7b. For 40% EV penetration, the maximum voltage sag reaches 2.21% from 6:15 p.m. to 6:50 p.m. The voltage deviation increased to 10% from 6:15 p.m. to 6:50 p.m.
Figure 8a illustrated the voltage deviation of the residential grid with coordinated charging (charging Profile 3). The voltage deviation increased to 8% from 8:15 a.m. to 9:30 a.m. and 10% from 7:15 p.m. to 8:00 p.m., and voltage sag increased 1.521%. The voltage sag of the residential grid with coordinated charging is shown in Figure 8b for charging Profile 4. For 40% EV penetration, the maximum voltage sag reaches 1.93% at 3:40 a.m. to 5:00 a.m.—the voltage deviation of the residential grid with coordinated charging. For 40% EV penetration, the voltage deviation increased to 8% from 3:40 a.m. to 5:00 a.m. The above analysis illustrates that by increasing the penetration level of EVs, the system energy losses increase. Therefore, optimal calculation of EV penetration level is imperative for minimizing the overall energy losses.
Table 2 presents the residential electrical-power demand, highlighting different voltage sag and deviation values under four EV-charging scenarios. The voltage sag is introduced to the grid voltage disturbance, while fast charging is employed even when EVs are connected to the residential distribution transformer. It is noticed from Table 2 that fast charging has substantial impacts on residential distribution connected with EVs. An increase of about 1.96% to 1.77% for Profile 1, 2.21% for Profile 2, 1.96% to 1.521% for Profile 3 and 1.93% for Profile 4 is reported when 100 EVs are considered. Moreover, the voltage deviation could vary between 8% and 10%. The analysis indicates that the residential grid will be unstable in this circumstance.

5. Conclusions

In this research, the electricity demand of a medium-scale residential grid comprising 1000 households was modeled and simulated by considering large-scale EV penetration to the network. This study modeled the housing demand and EVs based on a bottom-up approach that quantifies the energy-use behaviors of consumers and the use by real-world vehicles to help evaluate the overall and local effects of coordinated EV charging. MATLAB simulation of 100 electric vehicles and different charging scenarios were developed based on a lookup-table-based charging approach. Four charging scenarios were developed and considered coordinated fast charging methods. Respective distribution system parameters were evaluated, such as power demand, average transformer load factor, peak transformer load factor, voltage sag/swell and voltage deviation at the time of EV charging.
The result demonstrated that power demand and average transformer load factor increase sharply when charging. It can be determined that a 40% EV integration in the analysis system would result in a power demand increase of about 27.05% for Profile 1, 8.23% for Profile 2, 37% for Profile 3 and 4.17% for Profile 4 when 100 EVs are considered. The average transformer load factor increase is estimated to be 0.43, 0.368, 0.47 and 0.36, respectively, for considered scenarios. Furthermore, the residential grid voltage sag increase is estimated to be 1.77% for Profile 1, 2.21% for Profile 2, 1.521% for Profile 3 and 1.93% for Profile 4. As a result, the findings suggest that the electrical energy network is becoming more unreliable as the power load rises. Consequently, the charging load must be minimized to ensure the security of the operation of the distribution network. The results of four charging cases are charged at various intervals, revealing that the residential grid is reliable if the EVs that are charging are not attached to the grid. That is because the demand for mobile energy is far from that of heavy electric load busses, such as residential buses, thus relieving the local electricity burden. Therefore, changing the connection between transportation and distribution networks is an efficient way to gain more energy margins in the distribution grid and reduce electric energy interruption in the same electrical energy demand. Furthermore, considering the important local impacts of electric vehicle charging, the authors believe that future research needs to focus further on understanding consumers’ drive and charge behavior and the complexities of the option of residential electronic charging networks. Moreover, the validation with realistic EV charging profiles can be carried out in future research works.

Author Contributions

Conceptualization, M.M.H.K., A.H. and A.U.; methodology, M.M.H.K., A.H. and A.U.; formal analysis, M.M.H.K. and S.M.S.S.; investigation, M.S.A., T.J. and H.A.; resources, A.U., S.M.S.S., M.S.A. and H.A.; data curation, M.M.H.K., A.H. and A.U.; writing—original draft preparation, M.M.H.K., A.H. and A.U.; writing—review and editing, S.M.S.S., M.S.A., T.J. and M.S.H.L.; supervision, M.S.A.; project administration, M.S.H.L.; funding acquisition, M.S.H.L. All authors have read and agreed to the published version of the manuscript.

Funding

The authors are thankful to Universiti Kebangsaan Malaysia for the financial support under Grant Code GGPM-2020-006.

Institutional Review Board Statement

Not applicable.

Informed Consent Statement

Not applicable.

Data Availability Statement

Not applicable.

Conflicts of Interest

The authors declare no conflict of interest.

Abbreviations

BMSbattery management system
DNdistribution network
DRADistributed Resource Allocation
EVselectric vehicles
G2Vgrid-to-vehicle
ICEInternal Combustion Engine
LIBlithium-ion battery
OCVopen-circuit voltage
RESsrenewable energy sources
SOCstate of charge
ToUtime of use
VPPvirtual power plant
V2Gvehicle-to-grid

Parameters

Qtcurrent capacity
Qnnominal capacity
Cbatoverall battery capacities
Vbatt ocopen-circuit voltage of a battery
rbattinternal battery resistance
I batt current of EV battery
P EV power required to charge the EV battery

References

  1. Yaacob, N.F.F.; Yazid, M.R.M.; Maulud, K.N.A.; Basri, N.E.A. A Review of the Measurement Method, Analysis and Implementation Policy of Carbon Dioxide Emission from Transportation. Sustainability 2020, 12, 5873. [Google Scholar] [CrossRef]
  2. Hannan, M.A.; Lipu, M.S.H.; Ker, P.J.; Begum, R.A.; Agelidis, V.G.; Blaabjerg, F. Power electronics contribution to renewable energy conversion addressing emission reduction: Applications, issues, and recommendations. Appl. Energy 2019, 251, 113404. [Google Scholar] [CrossRef]
  3. Hasannuddin, A.K.; Yahya, W.J.; Sarah, S.; Ithnin, A.M.; Syahrullail, S.; Sugeng, D.A.; Razak, I.F.A.; Abd Fatah, A.Y.; Aqma, W.S.; Rahman, A.H.A.; et al. Performance, emissions and carbon deposit characteristics of diesel engine operating on emulsion fuel. Energy 2018, 142, 496–506. [Google Scholar] [CrossRef]
  4. Habib, A.K.M.A.; Hasan, M.K.; Mahmud, M.; Motakabber, S.M.A.; Ibrahimya, M.I.; Islam, S. A review: Energy storage system and balancing circuits for electric vehicle application. IET Power Electron. 2021, 14, 1–13. [Google Scholar] [CrossRef]
  5. Hannan, M.A.; Lipu, M.S.H.; Hussain, A.; Mohamed, A. A review of lithium-ion battery state of charge estimation and management system in electric vehicle applications: Challenges and recommendations. Renew. Sustain. Energy Rev. 2017, 78, 834–854. [Google Scholar] [CrossRef]
  6. Ghosh, A. Possibilities and Challenges for the Inclusion of the Electric Vehicle (EV) to Reduce the Carbon Footprint in the Transport Sector: A Review. Energies 2020, 13, 2602. [Google Scholar] [CrossRef]
  7. Lipu, M.S.H.; Hannan, M.A.; Karim, T.F.; Hussain, A.; Saad, M.H.M.; Ayob, A.; Miah, M.S.; Mahlia, T.M.I. Intelligent algorithms and control strategies for battery management system in electric vehicles: Progress, challenges and future outlook. J. Clean. Prod. 2021, 292, 126044. [Google Scholar] [CrossRef]
  8. Sabri, M.F.M.; Danapalasingam, K.A.; Rahmat, M.F. A review on hybrid electric vehicles architecture and energy management strategies. Renew. Sustain. Energy Rev. 2016, 53, 1433–1442. [Google Scholar] [CrossRef]
  9. Gorbunova, A.; Anisimov, I.; Magaril, E. Studying the Formation of the Charging Session Number at Public Charging Stations for Electric Vehicles. Sustainability 2020, 12, 5571. [Google Scholar] [CrossRef]
  10. Shafiul Alam, M.; Al-Ismail, F.S.; Salem, A.; Abido, M.A. High-level penetration of renewable energy sources into grid utility: Challenges and solutions. IEEE Access 2020, 8, 190277–190299. [Google Scholar] [CrossRef]
  11. Kriegler, E.; Weyant, J.P.; Blanford, G.J.; Krey, V.; Clarke, L.; Edmonds, J.; Fawcett, A.; Luderer, G.; Riahi, K.; Richels, R.; et al. The role of technology for achieving climate policy objectives: Overview of the EMF 27 study on global technology and climate policy strategies. Clim. Chang. 2014, 123, 353–367. [Google Scholar] [CrossRef] [Green Version]
  12. Hossain Lipu, M.S.; Hannan, M.A.; Hussain, A.; Ayob, A.; Saad, M.H.M.; Karim, T.F.; How, D.N.T. Data-driven state of charge estimation of lithium-ion batteries: Algorithms, implementation factors, limitations and future trends. J. Clean. Prod. 2020, 277, 124110. [Google Scholar] [CrossRef]
  13. Lipu, M.S.H.; Hannan, M.A.; Hussain, A.; Ayob, A.; Saad, M.H.M.; Muttaqi, K.M. State of Charge Estimation in Lithium-Ion Batteries: A Neural Network Optimization Approach. Electronics 2020, 9, 1546. [Google Scholar] [CrossRef]
  14. Bhattacharjee, A.; Mohanty, R.K.; Ghosh, A. Design of an optimized thermal management system for li-ion batteries under different discharging conditions. Energies 2020, 13, 5695. [Google Scholar] [CrossRef]
  15. Jadoun, V.K.; Sharma, N.; Jha, P.; S., J.N.; Malik, H.; Márquez, F.P.G. Optimal Scheduling of Dynamic Pricing Based V2G and G2V Operation in Microgrid Using Improved Elephant Herding Optimization. Sustainability 2021, 13, 7551. [Google Scholar] [CrossRef]
  16. Asadi, S.; Nilashi, M.; Samad, S.; Abdullah, R.; Mahmoud, M.; Alkinani, M.H.; Yadegaridehkordi, E. Factors impacting consumers’ intention toward adoption of electric vehicles in Malaysia. J. Clean. Prod. 2020, 124474. [Google Scholar]
  17. Aljanad, A.; Mohamed, A.; Khatib, T.; Ayob, A.; Shareef, H. A Novel Charging and Discharging Algorithm of Plug-in Hybrid Electric Vehicles Considering Vehicle-to-Grid and Photovoltaic Generation. World Electr. Veh. J. 2019, 10, 61. [Google Scholar] [CrossRef] [Green Version]
  18. Shareef, H.; Islam, M.M.; Mohamed, A. A review of the stage-of-the-art charging technologies, placement methodologies, and impacts of electric vehicles. Renew. Sustain. Energy Rev. 2016, 64, 403–420. [Google Scholar] [CrossRef]
  19. Mohamed, A.A.; Venkatesh, B. Line-Wise Power Flow and Voltage Collapse. IEEE Trans. Power Syst. 2018, 33, 3768–3778. [Google Scholar] [CrossRef]
  20. Mohamed, A.A.; Venkatesh, B. Linearized voltage stability incorporation with line-wise optimal power flow. Int. J. Electr. Power Energy Syst. 2019, 108, 232–239. [Google Scholar] [CrossRef]
  21. Narassimhan, E.; Johnson, C. The role of demand-side incentives and charging infrastructure on plug-in electric vehicle adoption: Analysis of US States. Environ. Res. Lett. 2018, 13. [Google Scholar] [CrossRef] [Green Version]
  22. Wróblewski, P.; Kupiec, J.; Drożdż, W.; Lewicki, W.; Jaworski, J. The Economic Aspect of Using Different Plug-In Hybrid Driving Techniques in Urban Conditions. Energies 2021, 14, 3543. [Google Scholar] [CrossRef]
  23. Lunz, B.; Yan, Z.; Gerschler, J.B.; Sauer, D.U. Influence of plug-in hybrid electric vehicle charging strategies on charging and battery degradation costs. Energy Policy 2012, 46, 511–519. [Google Scholar] [CrossRef]
  24. Ha, D.L.; Guillou, H.; Martin, N.; Cung, V.D.; Jacomino, M. Optimal scheduling for coordination renewable energy and electric vehicles consumption. In Proceedings of the IEEE International Conference on Smart Grid Communications, Sydney, Australia, 6–9 November 2016; pp. 319–324. [Google Scholar]
  25. Agyeman, K.A.; Yuwei, J.; Han, S. Local and Global Adequacy Assessments of Power Network with EVs Considering Renewable Energy integration and Auxiliary Service Support. In Proceedings of the IEEE International Conference on Renewable Energy and Power Engineering, Toronto, ON, Canada, 2–4 November 2019; pp. 22–27. [Google Scholar]
  26. Xiong, J.; Zhang, K.; Guo, Y.; Su, W. Investigate the Impacts of PEV Charging Facilities on Integrated Electric Distribution System and Electrified Transportation System. IEEE Trans. Transp. Electrif. 2015, 1, 178–187. [Google Scholar] [CrossRef]
  27. Olivella-Rosell, P.; Villafafila-Robles, R.; Sumper, A. Impact evaluation of Plug-In electric vehicles on power system. Power Syst. 2015, 91, 149–178. [Google Scholar] [CrossRef]
  28. Ghatikar, G.; Ahuja, A.; Pillai, R.K. Battery Electric Vehicle Global Adoption Practices and Distribution Grid Impacts: A Preliminary Case Study for Delhi, India. Technol. Econ. Smart Grids Sustain. Energy 2017, 2, 19. [Google Scholar] [CrossRef] [Green Version]
  29. Blasius, E. Possible role of power-to-vehicle and vehicle-to-grid as storages and flexible loads in the German 110 kV distribution grid. Front. Energy 2017, 11, 146–154. [Google Scholar] [CrossRef]
  30. Cao, C.; Wu, Z.; Chen, B. Electric vehicle-grid integration with voltage regulation in radial distribution networks. Energies 2020, 13, 1802. [Google Scholar] [CrossRef] [Green Version]
  31. Tiwari, D.; Sheikh, M.A.A.; Moyalan, J.; Sawant, M.; Solanki, S.K.; Solanki, J. Vehicle-to-Grid Integration for Enhancement of Grid: A Distributed Resource Allocation Approach. IEEE Access 2020, 8, 175948–175957. [Google Scholar] [CrossRef]
  32. Shaukat, N.; Khan, B.; Ali, S.M.; Mehmood, C.A.; Khan, J.; Farid, U.; Majid, M.; Anwar, S.M.; Jawad, M.; Ullah, Z. A survey on electric vehicle transportation within smart grid system. Renew. Sustain. Energy Rev. 2018, 81, 1329–1349. [Google Scholar] [CrossRef]
  33. Alam, M.S.; Shafiullah, M.; Rana, J.M.; Javaid, M.S.; Irshad, U.B.; Uddin, M.A. Switching signal reduction of load aggregator with optimal dispatch of electric vehicle performing V2G regulation service. In Proceedings of the 2016 International Conference on Innovations in Science, Engineering and Technology, Wuhan, China, 26–27 March 2016; pp. 16–19. [Google Scholar]
  34. Habib, S.; Khan, M.M.; Abbas, F.; Tang, H. Assessment of electric vehicles concerning impacts, charging infrastructure with unidirectional and bidirectional chargers, and power flow comparisons. Int. J. Energy Res. 2018, 42, 3416–3441. [Google Scholar] [CrossRef]
  35. Johnson, J.; Chowdhury, M.; He, Y.; Taiber, J. Utilizing real-time information transferring potentials to vehicles to improve the fast-charging process in electric vehicles. Transp. Res. Part C Emerg. Technol. 2013, 26, 352–366. [Google Scholar] [CrossRef]
  36. Un-Noor, F.; Padmanaban, S.; Mihet-Popa, L.; Mollah, M.N.; Hossain, E. A comprehensive study of key electric vehicle (EV) components, technologies, challenges, impacts, and future direction of development. Energies 2017, 10, 1217. [Google Scholar] [CrossRef] [Green Version]
  37. Kong, P.Y.; Karagiannidis, G.K. Charging Schemes for Plug-In Hybrid Electric Vehicles in Smart Grid: A Survey. IEEE Access 2016, 4, 6846–6875. [Google Scholar] [CrossRef]
  38. Niu, Q.; Jiang, K.; Yang, Z. An Improved, Negatively Correlated Search for Solving the Unit Commitment Problem’s Integration with Electric Vehicles. Sustainability 2019, 11, 6945. [Google Scholar] [CrossRef] [Green Version]
  39. Deb, S.; Tammi, K.; Kalita, K.; Mahanta, P. Impact of electric vehicle charging station load on distribution network. Energies 2018, 11, 178. [Google Scholar] [CrossRef] [Green Version]
  40. Rubino, L.; Capasso, C.; Veneri, O. Review on plug-in electric vehicle charging architectures integrated with distributed energy sources for sustainable mobility. Appl. Energy 2017, 207, 438–464. [Google Scholar] [CrossRef]
  41. Yang, J.; Hao, W.; Chen, L.; Chen, J.; Jin, J.; Wang, F. Risk assessment of distribution networks considering the charging-discharging behaviors of electric vehicles. Energies 2016, 9, 560. [Google Scholar] [CrossRef] [Green Version]
  42. Zheng, Y.; Niu, S.; Shang, Y.; Shao, Z.; Jian, L. Integrating plug-in electric vehicles into power grids: A comprehensive review on power interaction mode, scheduling methodology and mathematical foundation. Renew. Sustain. Energy Rev. 2019, 112, 424–439. [Google Scholar] [CrossRef]
  43. Dharmakeerthi, C.H.; Mithulananthan, N.; Saha, T.K. Impact of electric vehicle fast charging on power system voltage stability. Int. J. Electr. Power Energy Syst. 2014, 57, 241–249. [Google Scholar] [CrossRef]
  44. Wang, Z.; Paranjape, R. Optimal Residential Demand Response for Multiple Heterogeneous Homes with Real-Time Price Prediction in a Multiagent Framework. IEEE Trans. Smart Grid 2017, 8, 1173–1184. [Google Scholar] [CrossRef]
  45. Khalid, M.R.; Alam, M.S.; Sarwar, A.; Jamil Asghar, M.S. A Comprehensive review on electric vehicles charging infrastructures and their impacts on power-quality of the utility grid. eTransportation 2019, 1, 100006. [Google Scholar] [CrossRef]
  46. Hadley, S.W. Impact of Plug-in Hybrid Vehicles on the Electric Grid; Oak Ridge National Laboratory: Oak Ridge, TN, USA, 2006. [Google Scholar]
  47. Iria, J.; Soares, F.; Matos, M. Optimal supply and demand bidding strategy for an aggregator of small prosumers. Appl. Energy 2018, 213, 658–669. [Google Scholar] [CrossRef]
  48. Das, H.S.; Rahman, M.M.; Li, S.; Tan, C.W. Electric vehicles standards, charging infrastructure, and impact on grid integration: A technological review. Renew. Sustain. Energy Rev. 2020, 120. [Google Scholar] [CrossRef]
  49. Park, W.J.; Song, K.B.; Park, J.W. Impact of electric vehicle penetration-based charging demand on load profile. J. Electr. Eng. Technol. 2013, 8, 244–251. [Google Scholar] [CrossRef] [Green Version]
  50. Clairand, J.-M.; Rodríguez-García, J.; Álvarez-Bel, C. Electric Vehicle Charging Strategy for Isolated Systems with High Penetration of Renewable Generation. Energies 2018, 11, 3188. [Google Scholar] [CrossRef] [Green Version]
  51. Drovtar, I.; Rosin, A.; Landsberg, M.; Kilter, J. Large scale electric vehicle integration and its impact on the Estonian power system. In Proceedings of the 2013 IEEE Grenoble Conference PowerTech, POWERTECH 2013, Grenoble, France, 16–20 June 2013; pp. 1–6. [Google Scholar]
  52. Moghaddam, Z.; Ahmad, I.; Habibi, D.; Phung, Q.V. Smart Charging Strategy for Electric Vehicle Charging Stations. IEEE Trans. Transp. Electrif. 2017, 4, 76–88. [Google Scholar] [CrossRef]
  53. How, D.N.T.; Hannan, M.A.; Hossain Lipu, M.S.; Ker, P.J. State of Charge Estimation for Lithium-Ion Batteries Using Model-Based and Data-Driven Methods: A Review. IEEE Access 2019, 7, 136116–136136. [Google Scholar] [CrossRef]
  54. Shen, P.; Ouyang, M.; Lu, L.; Li, J.; Feng, X. The co-estimation of state of charge, state of health, and state of function for lithium-ion batteries in electric vehicles. IEEE Trans. Veh. Technol. 2018, 67, 92–103. [Google Scholar] [CrossRef]
  55. Palcu, P.; Bauman, J. Whole-Day Driving Prediction Control Strategy: Analysis on Real-World Drive Cycles. IEEE Trans. Transp. Electrif. 2017, 4, 172–183. [Google Scholar] [CrossRef]
  56. Bauman, J.; Stevens, M.B.; Hacikyan, S.; Tremblay, L.; Mallia, E.; Mendes, C.J. Residential smart-charging pilot program in Toronto: Results of a utility controlled charging pilot. World Electr. Veh. J. 2016, 8, 531–542. [Google Scholar] [CrossRef] [Green Version]
Figure 1. Architecture of grid model and EV-charging infrastructure.
Sustainability 13 10943 g001
Figure 2. Classification of SOC estimation methods; Adapted from How et al. [53], 2019.
Sustainability 13 10943 g002
Figure 3. Flowchart of OCV-based SOC-estimation process; Adapted from How et al. [53], 2019.
Sustainability 13 10943 g003
Figure 4. Block diagram of the developed charging infrastructure, using the lookup-table method.
Sustainability 13 10943 g004
Figure 5. (a) State of charge of electric-vehicle-charging Profile 1. (b) State of charge of electric-vehicle-charging Profile 2. (c) State of charge of electric-vehicle-charging Profile 3. (d) State of charge of electric-vehicle-charging Profile 4.
Sustainability 13 10943 g005
Figure 6. (a) Residential grid power demand without electric-vehicle charging station. (b) Residential grid power demand with electric-vehicle charging station (Profile 1). (c) Residential grid power demand with electric-vehicle charging station (Profile 2). (d) Residential grid power demand with electric-vehicle charging station (Profile 3). (e) Residential grid power demand with electric-vehicle charging station (Profile 4).
Sustainability 13 10943 g006
Figure 7. (a) Voltage profile of microgrid when EVs are in charging phase (Profile 1). (b) Voltage profile of microgrid when EVs are in charging phase (Profile 2).
Sustainability 13 10943 g007
Figure 8. (a) Voltage profile of microgrid when EVs are in charging phase (Profile 3). (b) Voltage profile of microgrid when EVs are in charging phase (Profile 4).
Sustainability 13 10943 g008
Table 1. Various EV-charging profiles of residential electrical power demand under the electricity distribution transformer, considering 1000 residential loads.
Charging ProfileProfile 1Profile 2Profile 3Profile 4
Number of EVs100100100100
Average Power demand (kW) without EV8500850085008500
Average Power demand (kW) with EV10,850920011,8008800
Power demand Increase daily (%)27.058.23374.17
Average hourly transformer load factor0.430.3680.470.36
Peak transformer load factor0.5120.560.5120.156
Table 2. Various EV-charging profiles of residential electrical power demand under the electricity distribution transformer, considering 1000 residential load.
Charging ProfileVoltage SagVoltage DeviationTime
Profile 11.96%8%8:40 a.m. to 9:20 a.m.
1.77%10%6:35 p.m. to 7:00 p.m.
Profile 22.21%10%6:15 p.m. to 6:50 p.m.
Profile 31.96%8%8:15 a.m. to 9:30 a.m.
1.521%10%7:15 p.m. to 8:00 p.m.
Profile 41.93%8%3:40 a.m. to 5:00 a.m.
Publisher’s Note: MDPI stays neutral with regard to jurisdictional claims in published maps and institutional affiliations.

