Article

The Impact of the COVID-19 Pandemic on College Students: An Online Survey

1
Faculty of Computer Science and Engineering, Ho Chi Minh City University of Foreign Languages-Information Technology, Ho Chi Minh City 70000, Vietnam
2
Computer Science and Mathematics Program, Penn State Harrisburg, Middletown, PA 17057, USA
3
Faculty of Information Technology, Haiphong University, Haiphong 180000, Vietnam
4
Faculty of Basic Science, College of Food Industry, Danang 50000, Vietnam
5
College of Information and Communication Technology, Can Tho University, Cantho 900000, Vietnam
6
School of Materials Science and Engineering, Hanoi University of Science and Technology, Hai Ba Trung, Hanoi 100000, Vietnam
7
Department of E-Commerce, Vietnam Electric Power University, Hanoi 100000, Vietnam
8
Center for Applied GIS of Ho Chi Minh City, Ho Chi Minh City 70000, Vietnam
*
Authors to whom correspondence should be addressed.
Sustainability 2021, 13(19), 10762; https://doi.org/10.3390/su131910762
Submission received: 25 August 2021 / Revised: 20 September 2021 / Accepted: 22 September 2021 / Published: 28 September 2021
(This article belongs to the Special Issue Working during the COVID-19 Global Pandemic)

Abstract

:
The COVID-19 pandemic, since its beginning in December 2019, has altered every aspect of human life. In Vietnam, the pandemic is in its fourth peak and is the most serious so far, putting Vietnam in the list of top 30 countries with the highest daily cases. In this paper, we wish to identify the magnitude of its impact on college students in Vietnam. As far as we’re concerned, college students belong to the most affected groups in the population, especially in big cities that have been hitting hard by the virus. We conducted an online survey from 31 May 2021 to 9 June 2021, asking students from four representative regions in Vietnam to describe how the pandemic has changed their lifestyle and studying environment, as well as their awareness, compliance, and psychological state. The collected answers were processed to eliminate unreliable ones then prepared for sentiment analysis. To analyze the relationship among the variables, we performed a variety of statistical tests, including Shapiro–Wilk, Mc Nemar, Mann–Whitney–Wilcoxon, Kruskal–Wallis, and Pearson’s Chi-square tests. Among 1875 students who participated, many did not embrace online education. A total of 64.53% of them refused to think that online education would be the upcoming trend. During the pandemic, nearly one quarter of students were in a negative mood. About the same number showed signs of depression. We also observed that there were increasing patterns in sleeping time, body weight, and sedentary lifestyle. However, they maintained a positive attitude toward health protection and compliance with government regulations (65.81%). As far as we know, this is the first project to conduct such a large-scale survey analysis on students in Vietnam. The findings of the paper help us take notice of financial and mental needs and perspective issues for indigent students, which contributes to reducing the pandemic’s negative effects and going forwards to a better and more sustainable life.

1. Introduction

Until June 2021, the world has known more than 170 million people infected with COVID-19 and more than 3.5 million deaths from this disease [1]. For those whose loved ones have passed away and those who suffer lifelong sequelae, the consequences of the pandemic are forever irreversible. Statistically, the mortality rate caused by SARS-CoV 2 is not as high as that of many other viruses. However, the danger consists in its ability to spread, with the reproduction number R0 being between 3.5 and 6.4 [2]. In other words, in the absence of immunity, one infected person can infect from 3.5 to 6.4 other people, which manifests its terrifying infectivity. With its rapid spread when causing a pandemic, COVID-19 has changed human life. From a highly social species, now humans lean toward a “caveman” lifestyle, which is less active and accumulates more food and fat. Wearing masks in public and social distancing have kept people away from the transitional space in the development of human relationships. The word “cave” here should also be understood as a virtual world into which we crawl more often and get separated from the community. Economically, changes in human behaviors lead to changes in the long-run consumption structure. As more people enter the cave and go online, online services will grow, and offline services will decline. The changes also deepen the gap between the rich and the poor. Social consequences would include increasing crime rate, decreasing compulsory education rate, reduced life expectancy, and increasing need for medical care.
According to the Vietnamese Ministry of Health, Vietnam is currently facing the fourth wave of the pandemic (https://ncov.moh.gov.vn/ Date accessed 7 June 2021). The first outbreak lasted 85 days from 23 January 2020, with 100 cases in the community. With the first case appearing in Ho Chi Minh City, which was an imported case from Wuhan (China), the disease then spread to 13 cities and provinces. The second outbreak lasted 129 days from 25 July 2020, spreading to 15 localities from North to South, recording up to 554 cases of the disease in the community, which was more than 5.5 times higher than the first peak. The third outbreak lasted 57 days from 28 January 2021 and broke out in Hai Duong, recording up to 910 patients with COVID-19 in the community. The third wave spread to 13 provinces and across the country like the previous two waves. The fourth wave of the pandemic started on 27 April 2021 and is ongoing. This is the first time Vietnam has seen such a rapid spread of the COVID-19 pandemic. From 27 April to 7 June, the whole country has recorded a total of 6165 cases of COVID-19, appearing in 39 provinces and cities, of which five localities suffer the most are: Ho Chi Minh City, Bac Giang, Bac Ninh, Hanoi, and Da Nang. Figure 1 shows the number of cases in the four regions covered by this survey. The North provinces are in turquoise, the Central provinces are in yellow, the Southern provinces are in pink, and the West provinces are in red. Ho Chi Minh City in the South has the highest population density and is the second hardest hit (3828), only after Bac Giang (5723—the North).
College students across the country are also among the most impacted by the pandemic. Personal activities are disrupted, and so is schoolwork. Most universities switch into online mode. Students in mountainous and remote areas have difficulty in adopting this mode because of the lack of infrastructure as well as the supporting means for online learning.
This survey was conducted during the first days of the fourth wave of the pandemic. We collected survey responses from 1875 students in four areas representing the four main regions of Vietnam: Hanoi, Da Nang, Ho Chi Minh City, and Can Tho. We aimed to learn about the students’ hardship which would be the evidence for any appropriate intervention and supporting policy. The survey questionnaire targeted the following information: personal information, activities before and during COVID-19, learning during COVID-19, awareness of and compliance with COVID-19 regulations, and psychological factors in the period of COVID-19. The collected data were analyzed using non-parametric statistical tests. The emotional information of the students was evaluated by a classifier built on the sentiment orientation approach. We used Local Interpretable Model-Agnostic Explanations (LIME) [3] to interpret the advantages of the proposed model when compared with other approaches.
The purpose of this study is to investigate Vietnamese students’ emotions, psychology, and lifestyle changes during COVID-19. The present paper is to explore the following issues:
  • How have students’ lifestyles changed in the course of COVID-19?
  • Are their studying and working affected?
  • How are their awareness and emotions about the pandemic?
  • How are they psychologically affected?
The main contributions of the paper are:
  • This is the first large-scale survey on the impact of the pandemic on Vietnamese college students.
  • The data are analyzed by profound statistical methods and state-of-the-art sentiment analysis models.
  • This paper could be used as the basis to support policy makers’ decisions at the provincial level as well as the state level.
The remainder of the paper is organized as follows. Section 2 introduces related work. Section 3 presents the proposed method, and Section 4 and Section 5 present the results and discussion. Finally, Section 6 offers a conclusion.

2. Related Work

For the past 18 months, numerous researches have been published to contribute to the fight against the pandemic. Early warning, rapid detecting, and diagnosis systems based on artificial intelligence are reported in [4,5,6,7,8]. Tracking and predicting models are reported in [9]. Fighting misinformation and understanding the virus are equipped with systems of chatbots and sentiment analysis in [10,11,12]. Changes and social impacts of the pandemic have also been studied. Renzo et al. [13] investigated the impact of the COVID-19 pandemic on eating habits and changes in Italian people’s lifestyles. They showed that 48.6% of 3533 people participating in the survey had gained weight, and 15% of participants switched to using farm products or organic products. In [14], the authors showed that women are strongly affected by the pandemic due to the risk of losing a job being 24% higher for women than for men, and the reduction of income being 50% higher when compared to that of men. In [15], the authors explored the impact of the pandemic on families with young children, reporting 82.0% of respondents experienced at least one challenge during COVID-19. There are several studies on people’s attitudes and psychological state during the COVID-19 period as well. In Japan, a survey with 11,342 respondents in March 2020 about people’s attitudes to the COVID-19 pandemic claimed that about 85%, mostly women and elderly people, complied with social distancing measures. Young celibate men under 30 years old having smoking and alcohol using habits are often reluctant to take appropriate precautions [16]. In Canada, Guerrero et al. [17] used a decision tree model to predict the ability of children aged from 5 to 17 to meet COVID-19 instructions. They reported that families with limited use of electronic devices and good income complied better with the precautions required. Families with young children aged from 12 to 17, not active in outdoor activities, and more limited income, by contrast, gave more negative results. In Spain, a survey conducted in May 2020 on the mental and psychological state of 1407 health workers reported that 24.7% and 53.6% of them were stressed and had health problems, respectively [18].
Surveys on college students can be found in [19,20,21,22,23]. In [19], the authors studied 2739 students from China and Hong Kong and found that the COVID-19 pandemic had significantly reduced students’ interest in studying abroad. The authors in [20] have questioned 675 freshmen from the University of Vermont, USA, to investigate the impact of the COVID-19 pandemic on the emotional, behavioral, and psychological well-being health of freshman university students. The results showed that up to 68.4% of them did not trust the government’s handling of COVID-19. However, the positive thing was that most students, accounting for 86.3%, believed that the pandemic would go away. In addition, compliance with government rules and recommendations was ensured by most of the students (95.8%). Furthermore, 87.3% of students felt strongly disrupted by the pandemic, especially those who were younger and did not participate in wellness programs. The study [21] has conducted a survey of 2945 students in Denmark in May 2020 to investigate students’ compliance with state regulations in response to COVID-19. The results said that 68% of students followed the recommendations of the government. Most of them were older, concerned about the pandemic, and depressed. The latest works have been carried out by Turgut et al. [22,23], who have focused on changes in educational processes due to COVID-19 for reducing the pandemic’s negative effects and going forwards to a more effective working process.
It is noted that most of the surveys in the aforementioned works were carried out at the beginning of the pandemic, whereas the pandemic was still ongoing. This has prevented the authors from presenting the most exhaustive panorama. In this paper, to get the most in-depth and latest information, we have conducted surveys on a large number of students from different regions, with a variety of topics, then analyzed the data using statistical and machine-learning techniques. Based on our information, this paper is also a pioneering study on the status of Vietnamese students in the context of sustainable education, dealing with the COVID-19 pandemic.

3. Method

3.1. Questionnaire

The study was conducted with the following assumption: there has been a negative impact on many aspects of student life such as lifestyle, mental, and education. This paper is descriptive research, and survey questions are designed based on and adapted to the context in Vietnam [13,24].
The survey questionnaire consists of 54 questions, divided into five sections. The details are described in Appendix A:
  • Section 1: Personal information. This section consists of 7 questions (Q01 to Q07): year in college, gender, weight, height, region, major, who they live with;
  • Section 2: Lifestyle before and during COVID-19. There are 14 questions (Q08 to Q21) on their daily activities, including shopping, sleeping, using alcohol/tobacco, exercising, eating, and part-time jobs;
  • Section 3: Studying in the period of COVID-19. This part contains 8 questions (Q22 to Q29) about online vs. in-class learning;
  • Section 4: Awareness of COVID-19. There are 16 relevant questions (Q30 to Q45) with regard to understanding about COVID-19, attitudes towards the disease, compliance with government guidelines and regulations such as following 5K instructions (Khẩu trang “Facemask”—Khử khuẩn “Disinfection”—Khoảng cách “Distance”—Không tụ tập “No Gathering”—Khai báo y tế “Health Declaration”);
  • Section 5: Psychological state during the COVID-19 period. This section includes 8 questions (Q46 to Q53) about depression based on the CES-D scale [25], using a 4-point Likert scale from 1 “almost none of the time” to 4 “almost all of the time”, how much time during the past week: (i) they were depressed, (ii) that everything they did was an effort, (iii) their sleep was restless, (iv) they were happy, (v) they were lonely, (vi) they enjoyed life, (vii) they were sad, (viii) they could not get going.
  • Students’ comments on the pandemic (Q54): A free-style paragraph on what they thought about COVID-19.

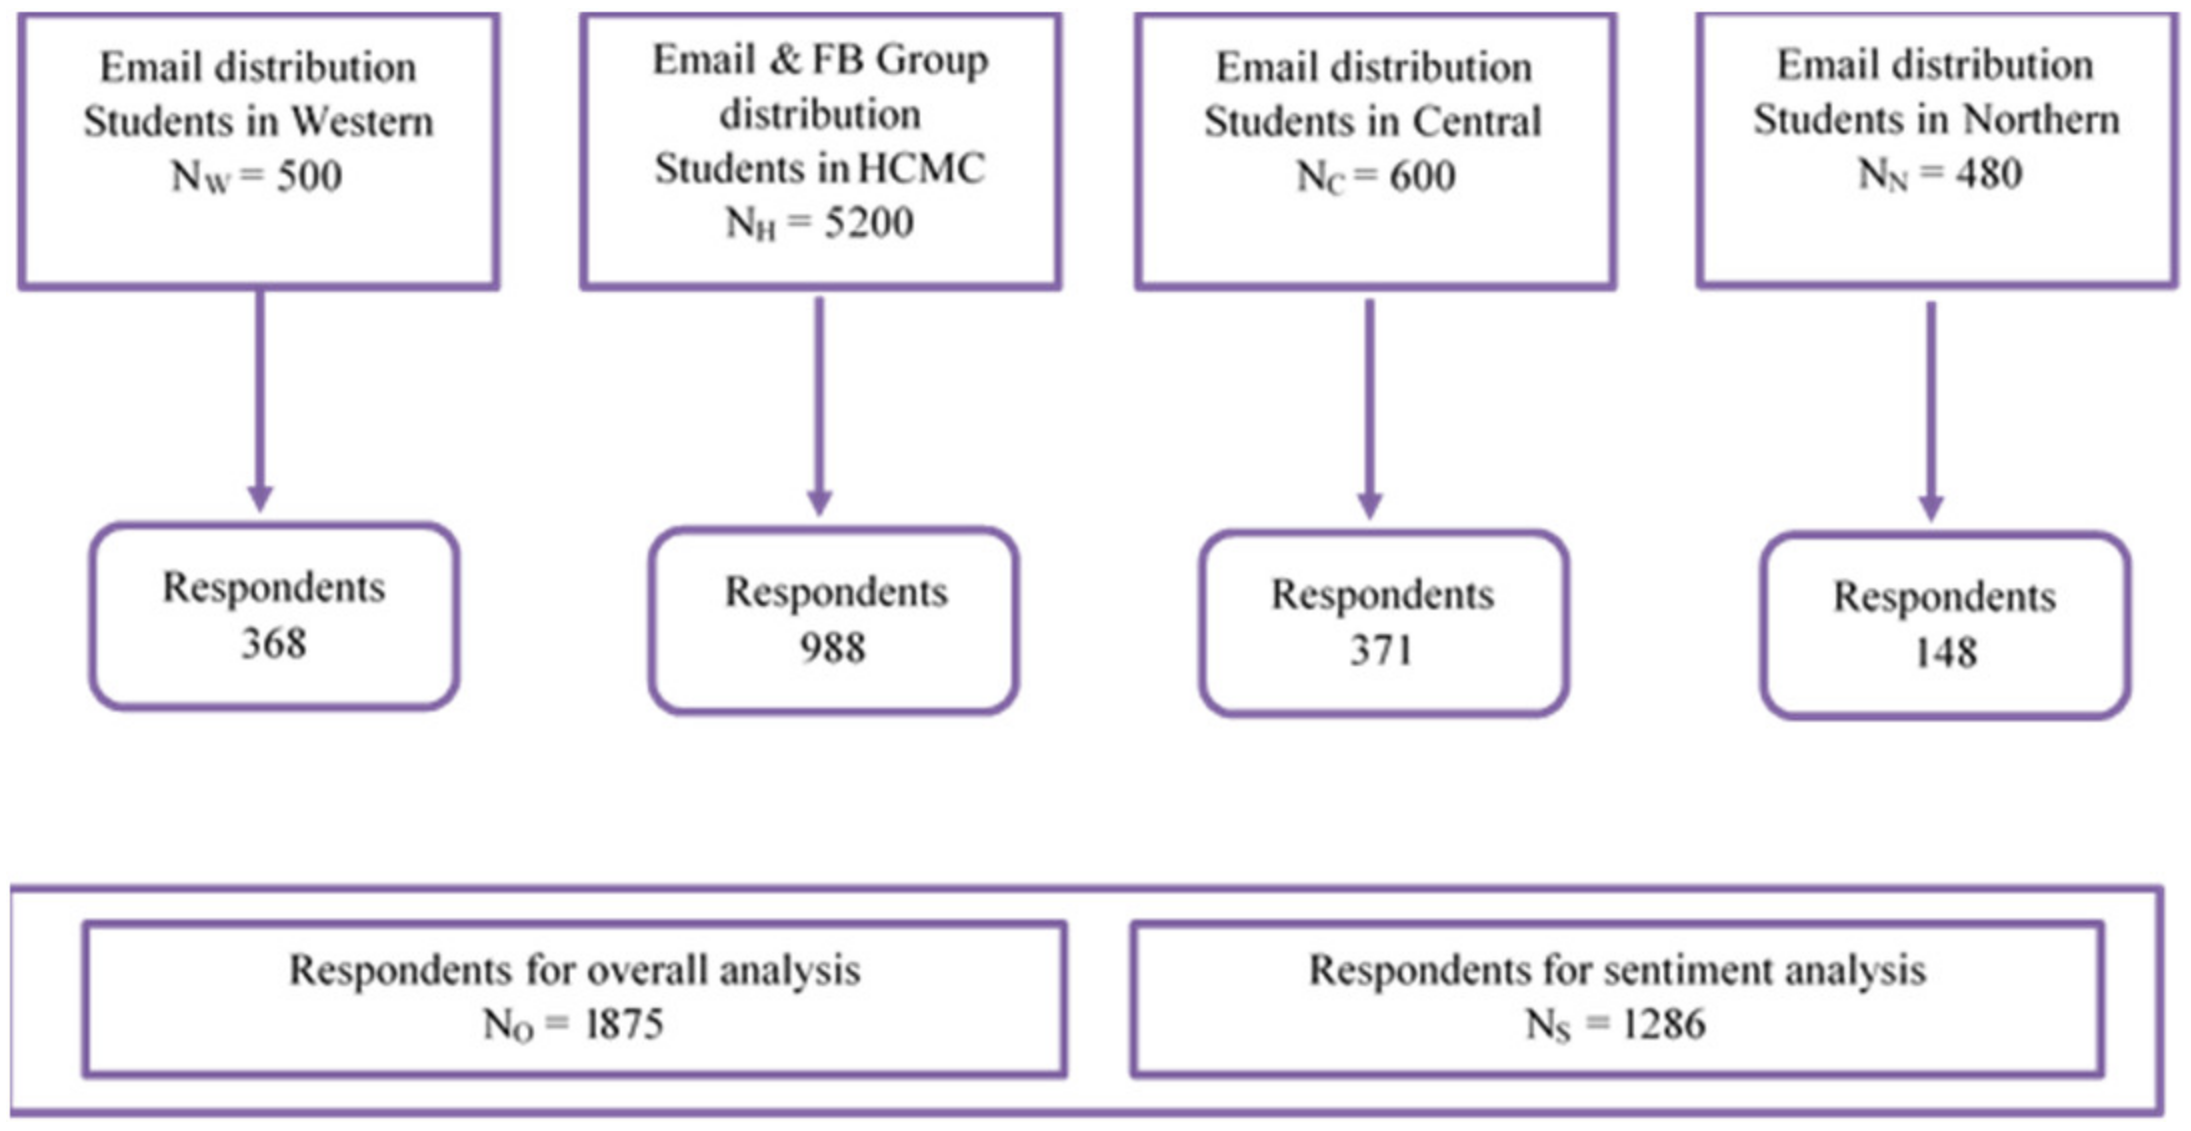
3.2. Data Collection Process

We built the survey form based on Google Forms—an online survey tool that helps create custom forms for surveys and questionnaires. Survey answers were downloaded as a Microsoft Excel sheet. Survey forms were emailed to and shared on several Facebook groups that reached about 10,000 college students in four regions: Ho Chi Minh City, Western, Central, and Northern areas. The forms were open from 31 May 2021 to 9 June 2021.
From 2041 responses initially, we removed unreliable responses due to unreasonable response time or inconsistent inter-question responses. Results obtained comprise 1875 survey samples and 1286 feeling comments of the pandemic. The flowchart of the data collection process is depicted in Figure 2.

3.3. Statistical Analysis

There are both continuous and nominal variables in the data obtained. In this paper, we performed the following statistical tests:
  • Shapiro–Wilk normality test [26] to determine variable distribution.
  • Cronbach Alpha [27] to evaluate the internal consistency (reliability) of the survey scale (measure of scale reliability).
  • Mann–Whitney–Wilcoxon test [28] and Kruskal–Wallis test [29] to assess whether the population distributions are identical among two or more groups, respectively.
  • McNemar test [30] to evaluate the changing of pre-COVID-19 and during COVID-19.
  • Chi-square [31] to evaluate the relationship between categorical variables.
  • The results are significant with p-value < 0.05.
  • We use the R Statistical Package (https://www.r-project.org/ Date accessed 7 June 2021) as our main tool for statistical analysis.

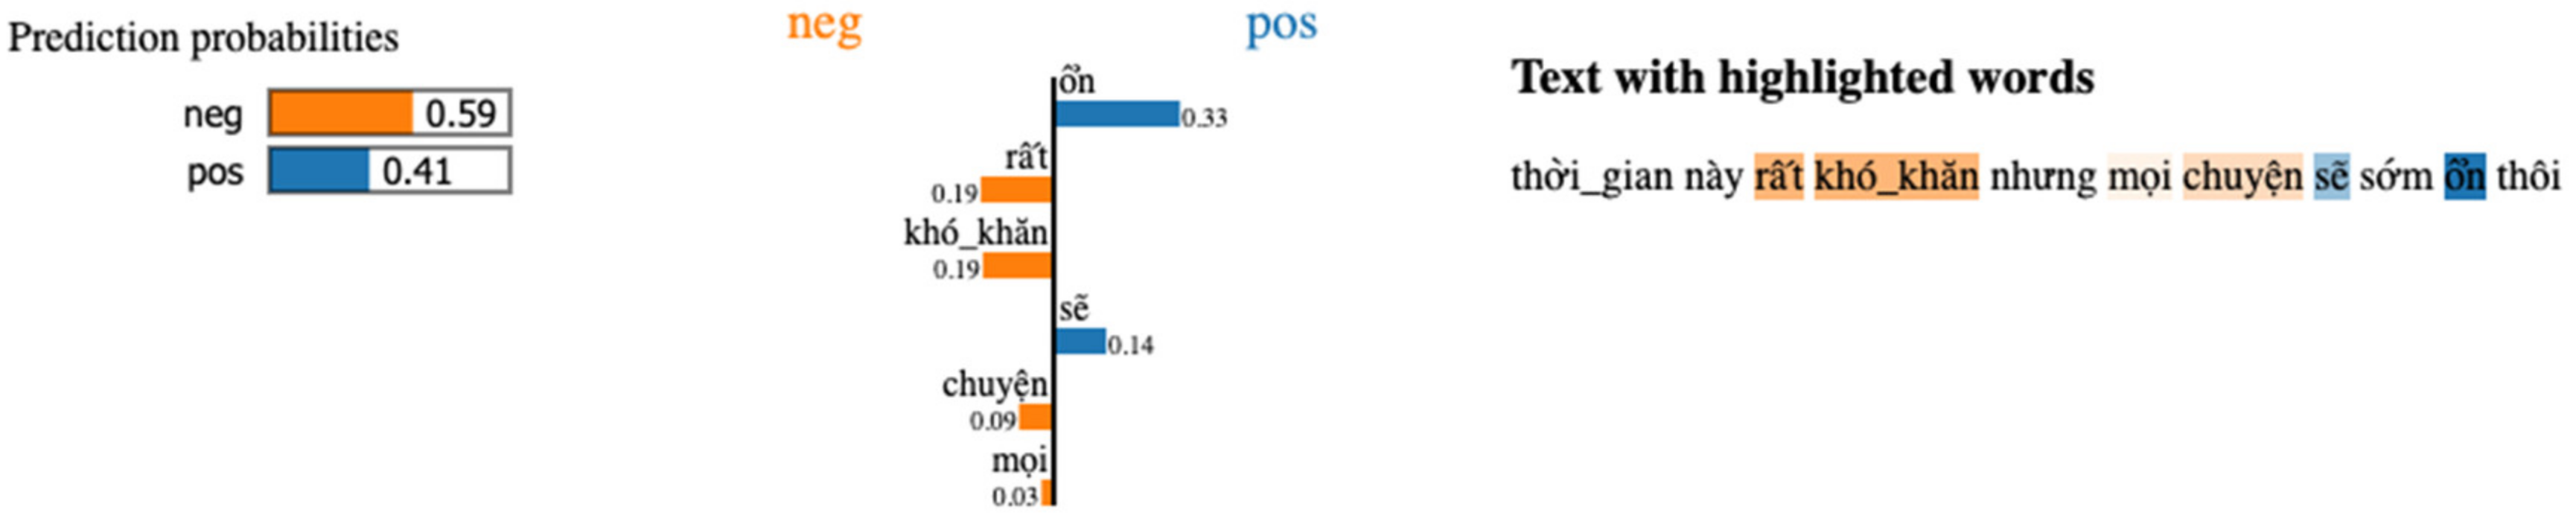
3.4. Sentiment Analysis

In Liu [32], an opinion is defined by a set of five objects by (1):
(ei, aij, hk, tl, sijkl)
where ei is an entity, aij is an aspect of ei, hk is a holder, tl is the time, and sijkl is a sentiment.
In the above definition, sijkl could be positive, negative ei can be a product, service, event, or topic. Based on the definition of opinion, sentiment analysis aims to analyze the five objects of Equation (1), for example, document-level sentiment analysis towards the fifth object (sijkl) without regard to the others. In this paper, we have performed a document-level sentiment analysis based on the students’ comments in the survey.

3.4.1. Dataset

Among 1875 survey responses, 589 people did not record their thoughts, accounting for 31.4%. Among 1286 comments recorded, there are 886 (47.25%) very short comments with fewer than five words. The average length of a comment is 13.33 words. Most of these comments are found to be written in social media styles, teen language, and acronyms.

3.4.2. A Classification System based on A Sentiment Orientation Approach

Intensive deep learning models such as BERT-based models are powerful but time and resource consuming. Due to the data nature of many short sentences, teen language, too small data set, as well as weak practical applicability, we used the sentiment orientation approach instead. The sentiment orientation method accumulates the emotional scores of the words and phrases in the considered and applied sentences. A comment’s result with a total score of positive is evaluated to be a positive comment, otherwise a negative comment. To calculate emotion scores for words and phrases, we used the Vietnamese sentiment dictionary—VNSD [33]—built based on SentiWordnet [34] and applied fuzzy rules proposed by Zadeh [35]. VNSD can calculate scores of single words and phrases associated with them. In this paper, to deal with the cases of social networking and teen language, we manually added, thanks to [36], to the VNSD dictionary named eVNSD, emotional words in the form of social media, which contain 126 variations all together. A dictionary of emotion icons was also created; in our database, all 36 emotion icons appear. Table 1 describes a part of this dictionary.
In addition, cases of sentiment shifting [37] in the sentence are also detected and processed. This work builds rules to catch contrast patterns as follows: “Mặc dù dịch đang hoành hoành kinh khủng nhưng em tin tưởng chúng ta sẽ vượt qua.” (English: “Although the epidemic is raging, I believe we will overcome it.”) or “Thời gian khó khăn đối với tất cả mọi người nhưng mọi chuyện sẽ ổn thôi.” (English: “It’s been a difficult time for everyone, but it’s going to be okay.”). In these two sentences, the word “nhưng” (“but”) has shifted the feeling towards the clause containing it, the whole sentiment of this sentence becomes positive. The whole process is summed up as in Algorithm 1.
Algorithm 1. Sentiment Classifier (sentence, contrast_signal, eVNSD)
Input:
  • sentence
  • constrast_signal: list of contrast words
  • eVNSD: dictionary contains words and corresponsive sentiment scores
Output: sentiment of input sentence (0—negative; 1—positive)
BEGIN
foreach (contrast_word in contrast_signal) do
   if (contrast_word in sentence) then
 // using contrast_word to split sentence into 2 parts.
 sentence_parts = explode(contrast_word, sentence, 2);
 sentence = sentence_parts [1]; // ignore 1st part of input sentence
 break;
   endif
endforeach
tokens = tokenize(sentence);
sentiment_score = 0;
foreach (token in tokens) do
 if (token in eVNSD.keys()) then
   sentiment_score += eVNSD[token];
 endif
endforeach
return (sentiment_score >= 0) ? 1:0
END.

4. Results

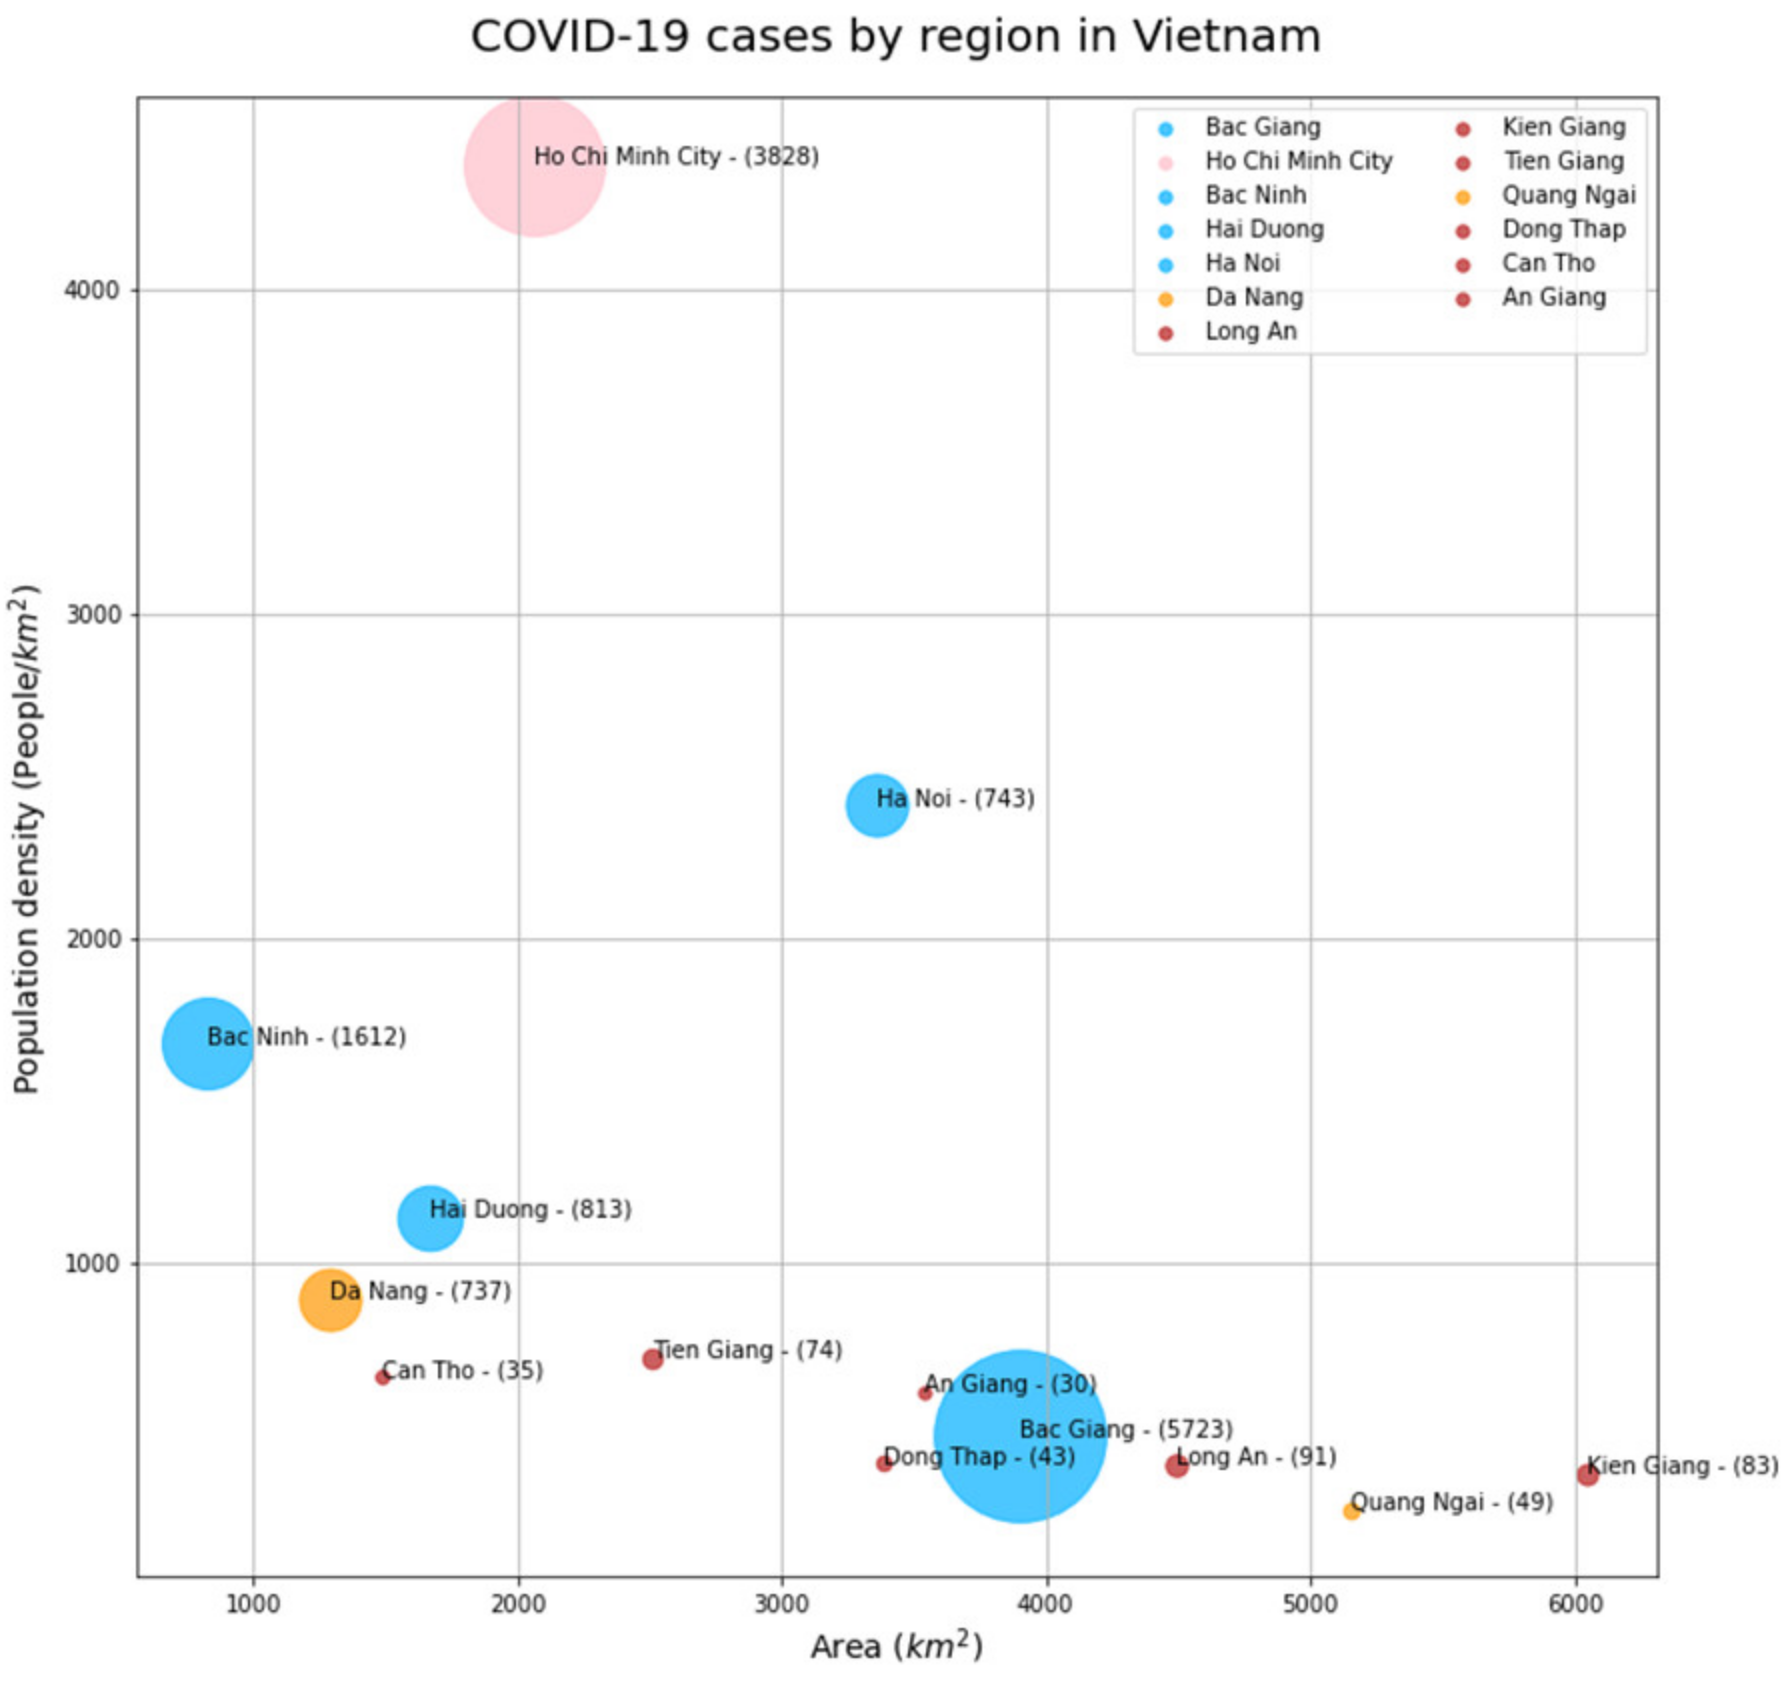
4.1. General Information about Participants

Respondents’ characteristics, including student year, gender, height, weight, and BMI of students from four regions, are given in Table 2.
Ho Chi Minh City (HCMC—South) has the largest number of students participating with 988 students, accounting for 52.69% of the total. The number of female students participating in the survey is higher than that of male students (60.26% compared to 39.74%). There are more freshmen (28.85%) and sophomores (29.12%) than juniors (20.86%) and seniors (21.17%). The majority of students participating in the survey have the Body Mass Index (BMI) in the standard form, compared to the ideal range of 18.5–22.9 (based on the IDI & WPRO classification scale for Asians). The Kruskal–Wallis test shows that BMI in four regions is statistically different (p-value < 0.01). The Mann–Whitney–Wilcoxon test shows that the BMI of males and females are statistically different (p-value < 0.01). This information is evidence for us to believe that the survey results are reliable.

4.2. COVID-19 Has Changed Many Things

The pandemic has changed many things, from sleep and work to almost all daily activities, physically and mentally. Table 3 presents the sleep pattern and part-time work changes during the COVID-19 period. The results from McNemar’s test supports the claim that the students slept more during the pandemic (McNemar’s chi-squared = 307.73, df = 3, p-value < 0.001, and the standardized mean difference (SMD) = 0.473), with more than half of the respondents indicating that they slept more than 9 h a day. Working part-time jobs has decreased (McNemar’s chi-squared = 428.77, df = 6, p-value < 0.001, and SMD = 0.537), the rate of not having part-time work has increased from 61.07% to 85.87%. Moreover, a number of students doing part-time jobs worked only with a very limited number of hours.
Regarding recreational activities, 42.24% of the respondents answered that they exercised less, and only 12.16% of the respondents said that they worked out more during the ongoing pandemic. Statistics show that male students, accounting for 48.32%, worked out less than female students, who represent 38.23% (p-value < 0.001). With respect to eating, 30.88% said they ate more, and only 15.73% said they ate less during COVID-19. By comparison, women of 34.87% consumed more food than men of 24.83% (p-value < 0.001).
As for education, COVID-19 was expected to have a great impact on the profession because 48.53% of students said that the pandemic had and would have a negative impact on their major study, especially those in the hospitality industry who occupied 85.86% and in Eastern culture studies (69.04%). Only 12.16% of students were optimistic, saying that the pandemic was an opportunity for their major to develop. Speaking about online learning and testing, up to 63.31% of respondents said that they themselves did not like online exams, and 64.53% of respondents said that online learning would not be a trend when COVID-19 was over. Thinking of the effectiveness of online learning, 14.4% of respondents said that online learning was not effective at all, 64.8% of respondents said that although online learning was just a little effective and was only a temporary solution, and only a relatively modest number of students thought that learning online was really effective 20.8%. Surveying on the advantages and disadvantages of online learning, we have the following results: in terms of convenience: (i) more comfortably studying 33.76%, (ii) easily reviewing lectures 31.31%, (iii) having tuition fees probably decreased by 17.01%, (iv) understanding the lesson and interacting with classmates from anywhere 6.56%, (v) others 11.36%; in terms of obstacles when learning online: (i) having difficulty in assessing and testing online 37.44%, (ii) not understanding the lesson and interacting with classmates 36.53%, (iii) not having required IT skills for online learning 4.32%, (iv) having no equipment for online learning 2.83%, (v) other 18.88%.
Apropos the concern about COVID-19 shown through watching related news, up to 77.12% of respondents kept track of news hourly and daily. Among them, women were more interested than men, with the corresponding rate of 81.86% and 69.93% (p-value < 0.01). When areas are taken into consideration, it can be seen that students from the South are the most interested, followed by the West, the North, and finally the Central with the corresponding rate of 79.45%, 79.07%, 76.35%, and 69.27%.
Concerning hygiene during the COVID-19 pandemic, the survey results show that people almost lived more cleanly (85.49%), women paid more attention to hygiene than men with the corresponding rate of 88.76% and 80.54% (p-value < 0.05). By region, students from Central, South, North, and West regions were 85.71%, 85.63%, 79.73%, and 79.08%, respectively. With respect to depression, more than a quarter of female students had problems with a high or quite high degree of depression, accounting for 27.65%; the percentage was 21.87% for men. The rate of depression in female students was higher than in male students (p-value < 0.05). We calculated Cronbach’s Alpha to be 0.784, so the internal consistency of this depression survey is “Acceptable.” The 95% confidence interval for Cronbach’s Alpha is [0.768, 0.800].

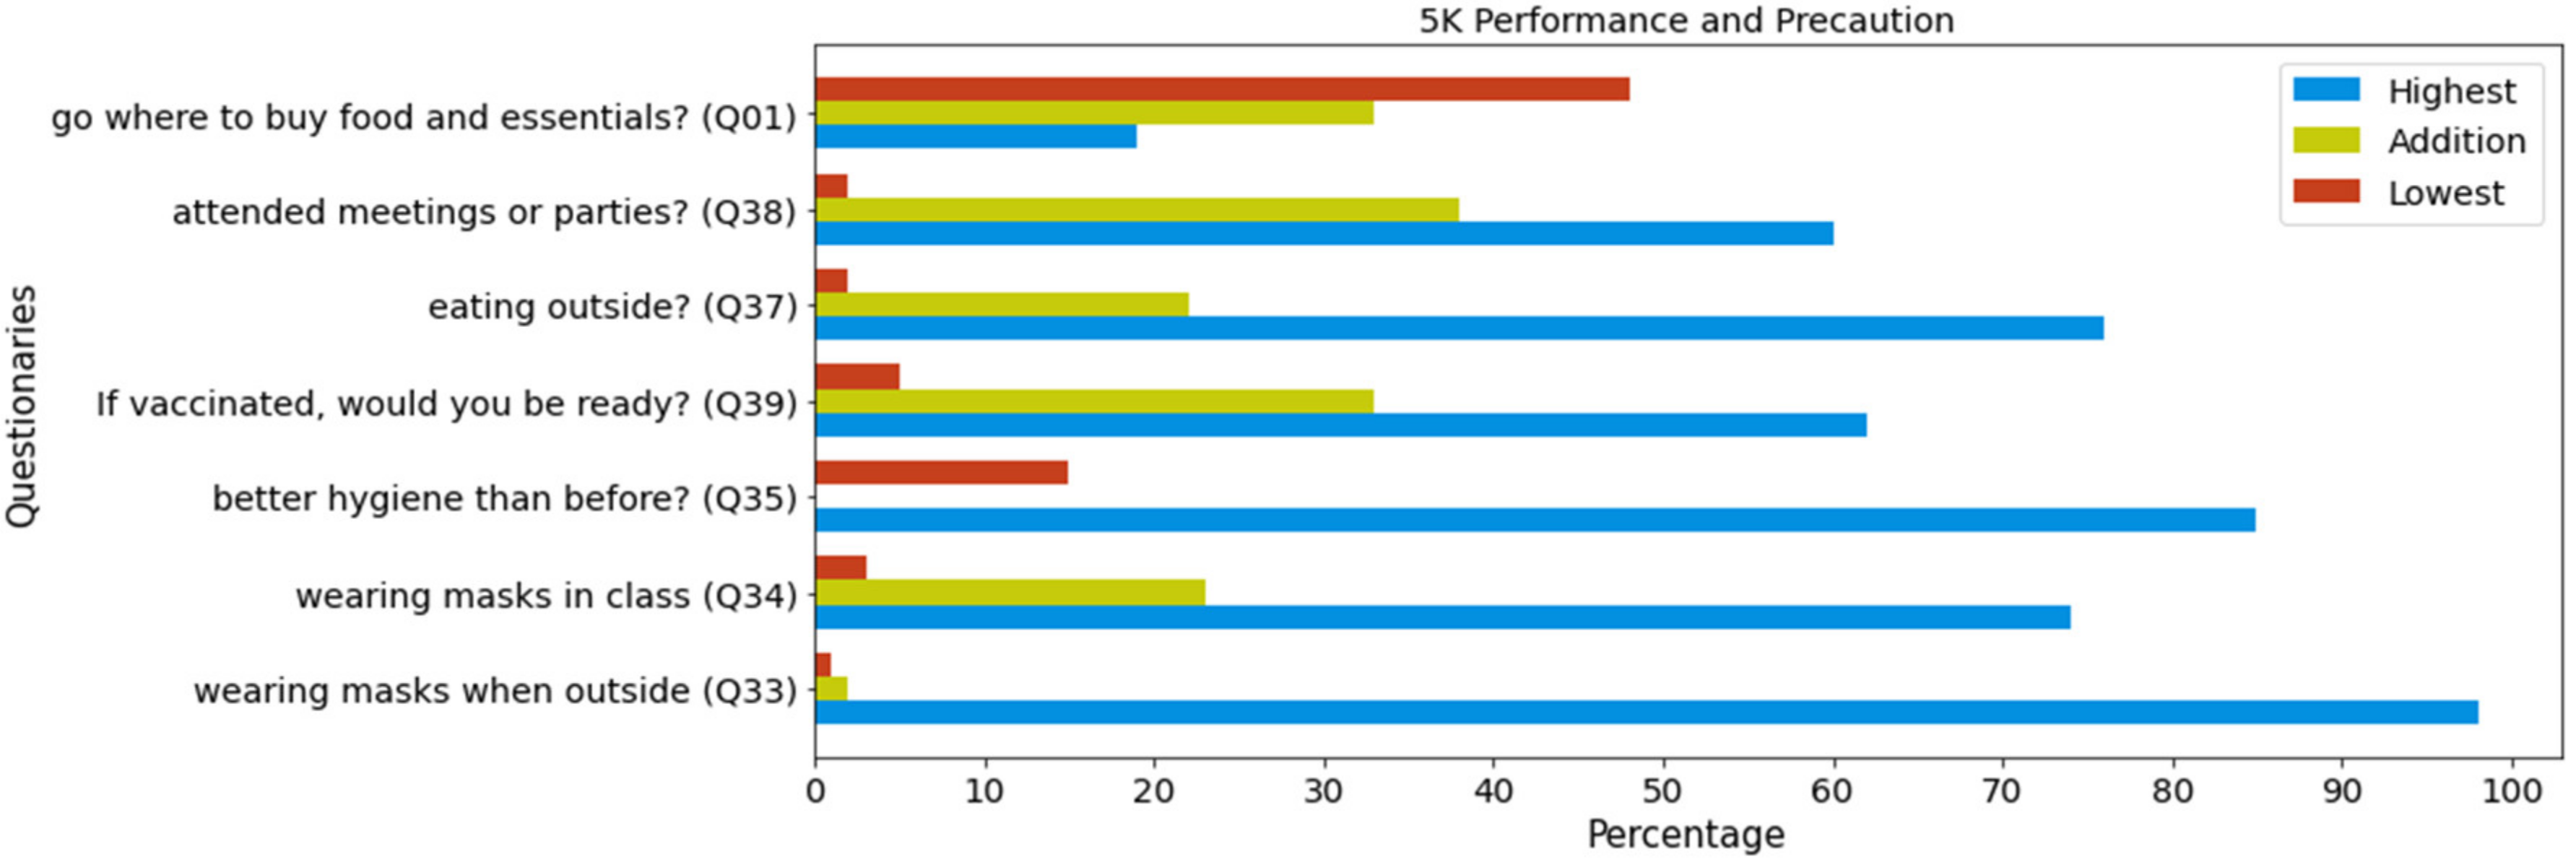
4.3. Prevention and Compliance with State Regulations on COVID-19 Prevention

With reference to students’ compliance with anti-pandemic regulations, generally, students have shown strict compliance with anti-epidemic regulations (p-value < 0.001). Table 4 describes the corresponding statistics for each region, the level of students’ understanding of COVID-19, paying attention to the COVID-19 situation, implementing preventions, and factors of depression. The level of understanding about the pandemic is shown by the results of answering four questions from Q27 to Q30; the results are divided into two groups: low (1–2 correct) and high (3–4 correct). Up to 71.09% of the respondents have a high level of understanding of the pandemic, and 65.87% of them are actually in compliance with the regulations. The concern about the COVID-19 situation is shown through question number Q36: daily and hourly concerns are considered as high and lesser concerns as low. In total, 77.12% of people are concerned about the pandemic at a high level, accounting for 79.50% of people who are said to have complied with epidemic prevention regulations. However, among those who are concerned about the pandemic, only 67.84% really trust and comply with epidemic prevention regulations. Taking measures to prevent infection is shown through three evaluation levels related to six questions from Q33 to Q38 evaluated as high level when all of the following requirements are met: (i) absolute compliance with wearing masks when outside, (ii) regularly wearing masks in class, (iii) better hygiene than before COVID-19, iv) carefully watching daily news, and (v) never entering a restaurant which ignores doing 5K, not attending meetings or parties during the COVID-19 period. Evaluated as average level are the cases when all of the followings are met: (i) usually wearing masks when outside, (ii) often wearing a mask in class, (iii) better hygiene than before COVID-19, (iv) occasionally watching the news, and (v) having restrictions on entering restaurants that do not implement 5K and being less likely to attend meetings or parties during the COVID-19 period than before. The rest are low-level cases. The number of students taking high-level infection prevention measures is 660, accounting for 35.2% of the total number of students, of whom 74.62% have strictly complied with epidemic prevention regulations.
The factors related to 5K practice and precautions are presented in Figure 3. For question Q01, buying online has the highest score, then the supermarket, and finally the traditional market. With questions Q33 and Q34, wearing a mask when outside and in the classroom is said to be the best form of protection. Q35, which is related to being more hygienic than before COVID, has a higher rate. Not eating and drinking in restaurants that do not follow 5K and not going to parties during the pandemic is considered as having the best sense of protection. For Q39, being ready to be vaccinated occupies the highest score. In general, apart from traditional market shopping in Q01, all other activities show that students’ awareness of infection prevention is high.

4.4. During the Pandemic, Nearly Half of Students Experienced Negative Emotions

Using a sentiment classifier based on the VNSD dictionary, we classify 1286 students’ thoughts about the pandemic into positive or negative ones. As a result, 46.5% of the students suffered from a negative mood, which approximately amounts to the results of our manual labeling test. Table 5 shows the results of emotion classification; the recommendation system gives better classification results than other machine learning-based methods, including Naïve Bayes [38], Decision Trees [39], Logistic Regression [40], Multi-Layer Perceptron [41], and Support Vector Machines [42] with TF-IDF feature [43] and 10-fold cross-validation.
We also used LIME to interpret the classification results that cause misidentification errors from the logistic regression method—the method that gives the highest recognition results in the group of machine learning algorithms. Figure 4 presents an example in which LIME is used to figure out which parts of the interpretable input contribute towards the prediction.
In the above example, the sentence “Thời_gian này rất khó_khăn nhưng mọi chuyện sẽ sớm ổn thôi.” (“This is a very difficult time, but everything will be fine soon.”) is classified as negative when negative words in the sentence such as “rất khó_khăn” (“very difficult”), “chuyện” (“everything”, ”problem”) appear to prevail over the positive word “ổn” (“okay”). With the sentiment orientation method, the proposed system can detect and remove the term “Thời_gian này rất khó_khăn“ (“this time is very difficult”) because the contrast keyword “nhưng” (“but”) appears in the sentence, which leads to a positive sentence classification result.
We also synthesized the top most frequent words in the students’ comments as a word cloud, as shown in Figure 5. In addition to the trending words such as “covid”, “dịch bệnh” (“epidemic”), and “ở nhà” (“stay at home”), other top words apparently bear negative meanings like “buồn” (“sad”) but also hopeful like “mong” (“hope”), “qua đi” (“pass away”), “giảm” (“decrease”), and “cảm thấy” (“feel”).

5. Discussion

The Common Era has experienced forty pandemics, ten in the twentieth century and five in the last two decades [44]. The gap between the two consecutive pandemics has gotten shorter and shorter: from a few hundred years to a few decades and now to a few years. The world seems to be entering the Pandemic Era and the Digital Age. In the field of education, UNESCO says that all along the COVID-19 period, more than a billion students worldwide have had their studies interrupted, and hundreds of thousands of educational institutions have had to close temporarily. Online technology has saved secondary and higher education from disturbing the transmission of knowledge. However, the fact that millions of lecture periods in the lecture hall have hurriedly been passed on to the cloud with defective content and resources has caused negative reactions from many students around the world. This article surveyed students in four representative regions in Vietnam, namely, the North, the Central, the South (Ho Chi Minh city), and the West.
With 55 questions divided into five sections, this survey manifested that many students are not interested in online learning and examining; more than two thirds of them do not think that online education would be the upcoming trend. Regarding psychological and emotional issues, nearly one quarter of students felt in a bad mood, and there were also people who showed signs of depression. The paper also attested that there were increasing patterns in sleeping time, body weight, and sedentary lifestyle. However, they maintained a positive attitude towards health protection and compliance with government regulations, as the statistics show the percentage at 65.81%.
The discovery coming from the statistical and sentiment analyses has resulted in the following issues needing attention. Regarding education, students have not appreciated online education yet. There are two main reasons, in our opinion, first of all, studying and taking online exams are not familiar to them. Second, students need to be equipped with six essential skills in the modern world, which are communication, collaboration, creativity, critical thinking, self-reflection, and digital literacy. Regarding working, statistics show that nearly 40% of participants alternately work part-time and study at university, especially those in big cities like Ho Chi Minh city. The pandemic has prevented them from earning money and gaining professional experience. Similarly to the above issue, we see two main reasons for this, namely, businesses’ difficulties caused by the pandemic and the said students’ fear of being infected. Once again, in this pandemic period, the Digital Age is expected to bring about more suitable jobs as online ones are becoming more popular. Relating to lifestyle, the pandemic has forced us to change our lifestyle and activities, as well as our daily routines. Online shopping is considered a safe and smart form of shopping. Hygiene and safety are always a top priority for all individual and community activities. The last thing we wish to mention is the attitude and psychophysiology of the students during the pandemic when a certain number of students failed to feel well. What needs to be done now is to deploy accurate and timely information channels to all sectors of society, avoiding untrue, disturbing, and confusing information.
One limitation of this study is that it only constitutes preliminary research. Because of the study scope, this study has neither detected nor explored latent variables and associations among those variables.

6. Conclusions

In this paper, we have surveyed a relatively large number of students in four main regions in Vietnam. The study has used the most effective and appropriate sampling methods as well as statistical analysis techniques and sentiment analysis. The results of analysis through the data obtained from the survey have helped us to get an overview of the students’ physiological and psychological status throughout the pandemic.
The strength of the paper, so to speak, is that it was conducted in the course of the period when the fourth wave of COVID-19 is violently striking Vietnam, especially in HCMC, from which the number of samples collected is the largest. As a result, the survey data most clearly reflect the status of students under the pandemic. In future work, we plan to expand the number of survey participants as well as increase the questions related to the field of vocational education. We also aim to explore latent variables together with associations among them. The construction of a pandemic information and forecast channel will also be considered because COVID-19 is still raging and does not want to come to an end.

Author Contributions

Data curation, D.-K.N., A.C.T., V.N.-H., H.N.T.T. and S.T.; Formal analysis, H.D., H.N., V.N.-H. and D.H.; Resources, C.K.; Software, H.D.; Supervision, D.-N.L.; Writing—original draft, T.K.T.; Writing—review and editing, T.A.N. All authors have read and agreed to the published version of the manuscript.

Funding

The authors received no specific funding for this study.

Institutional Review Board Statement

The study was conducted according to the guidelines of the Declaration of Helsinki. All participants were fully informed about the study requirements and were required to accept the data sharing and privacy policy before participating in the study.

Informed Consent Statement

Informed consent was obtained from all subjects involved in the study.

Data Availability Statement

The data presented in this study are available on request from the corresponding author. The data are not publicly available due to restrictions e.g., privacy or ethical.

Acknowledgments

We would like to thank Ho Chi Minh City University of Foreign Languages–Information Technology (HUFLIT) for the support of time and facilities for this study.

Conflicts of Interest

The authors declare no conflict of interest.

Appendix A

Questionnaire: STUDENTS QUICK SURVEY ABOUT COVID-19 PANDEMIC
  • Personal Info
  • Q01. You are a 1st, 2nd, 3rd year student, final year, graduated?
  • Q02. Gender: Male/Female
  • Q03. Weight: __ kg
  • Q04. Height: __cm
  • Q05. Region: South, Central, HCMC, or Western
  • Q06. Majors: IT, Foreign Languages, Hospitality Industry, Eastern Cultures, Business Administration, International Relations, Law, Accounting, others
    Q07. You are currently: living with family, living with friends, living alone
  • Lifestyle
  • Q08. Where have you been buying food and essentials during COVID-19?
    • Online
    • Supermarket
    • Market & Other
  • Q09. The way to buy food and necessities has changed compared with before COVID-19:
    • Yes
    • Not at all
  • Q10. How long did you sleep before COVID-19?
    • <7 h per day
    • 7–9 h per day
    • >9 h per day
  • Q11. How long do you sleep now?
    • <7 h per day
    • 7–9 h per day
    • >9 h per day
  • Q12. During this COVID-19 period, have you been changing anything about:
    • Smoking, using more alcoholic drinking
    • Smoking, using less alcoholic drinking
    • NO CHANGES (including if you don’t smoke and use alcoholic drinking)
  • Q13. Did you play sports before COVID-19?
    • No
    • running/swimming/soccer/tennis/martial arts
    • yoga/aerobics
    • other sports
  • Q14. How many times did you play sports a week?
    • I did not do any sports
    • Once–twice a week
    • 3–4 times a week
    • Almost every day
  • Q15. During the COVID-19 period, have you still been practicing?
    • No
    • Practicing at home
    • Practicing as usual
  • Q16. During the COVID-19 period, have you been practicing more or less than before?
    • Less
    • As much as
    • More
  • Q17. During the COVID-19 period, have you been eating more or less?
    • Less
    • As much as
    • More
    • Much more
  • Q18. Have you been gaining weight during COVID-19?
    • No, my weight is STABLE
    • No, I think I HAVE BEEN LOSING weight
    • Yes, but I think I HAVE NOT BEEN GAINING TOO MUCH WEIGHT
    • Yes, I think I HAVE BEEN GAINING A LOT
  • Q19. Did you work part-time before COVID-19?
    • No
    • About <7 h/week
    • 7–14 h/week
    • >14 h/week
  • Q20. Have you been working part-time during COVID-19?
    • No
    • About <7 h/week
    • 7–14 h/week
    • >14 h/week
  • Q21. What is your part-time job?
    • Tutor
    • Service
    • Employee (sales/marketing)
    • Officer
    • Working online
    • Other
  • Education
    • Q22. Has COVID-19 been making you take a break from offline lessons, group lessons:
      • Regularly
      • Sometimes
      • No, I’m still participating in them normally
    • Q23. Have you been studying online during the pandemic?
      • Yes
      • No
    • Q24. Do you think online learning during the COVID-19 period is effective or not?
      • Not at all
      • A little, it’s just a temporary solution
      • Quite effective
      • Very effective
    • Q25. What do you think is the biggest obstacle to online learning?
      • I can’t understand the lesson and interact with classmates
      • I don’t have suitable equipment to study online
      • I’m too bad at IT to learn online
      • It is difficult to evaluate, check students’ qualifications with online method
      • Other
    • Q26. What do you think is the most advantageous thing about online learning?
      • I can still understand the lesson and interact with classmates anywhere
      • I easily review the lecture any time
      • I feel more comfortable while studying online
      • Tuition fees will probably decrease when online learning is officially applied
      • Other
    • Q27. Honestly speaking, do you like to take the test online?
      • Absolutely
      • No, I do not think so
    • Q28. Do you think online learning is a trend even after the COVID-19 epidemic is over?
      • Yes, for sure
      • No, I do not think so
    • Q29. In your opinion, has COVID-19 affected your major?
      • Very influentially, in a POSITIVE direction
      • Very influentially, in the NEGATIVE direction
      • I don’t think it has affected so much
  • Awareness
    • Q30. Do you think you have been complying with the State’s regulations on COVID-19 prevention and control (the higher the number, the better the compliance): Creating radio button 1–10
    • Q31. Are you afraid of being infected with COVID-19 (the higher the number is, the more afraid you are)? Creating radio button 1–10
    • 25. Do you know anyone who has had COVID-19?
      • Yes/No/No idea
    • Q32. Have you heard of COVID-19?
      • Yes/No/No idea
    • Q33. Can you get COVID-19 without any symptoms?
      • Yes/No/No idea
    • Q34. How is COVID-19 transmitted? (Can choose more than one answer): Create check box
      • Through blood
      • Through the droplets from the sick
      • Due to direct contact with sick people/animals
      • By touching contaminated objects or surfaces
      • Due to mosquito bites
      • No idea
    • Q35. What is 5K Implementation? (choose 5 most relevant items): Create check box
      • Wearing mask
      • Not going out unnecessarily
      • Disinfecting
      • Not drinking alcohol while driving
      • Social distancing
      • Not shaking hands when meeting other people
      • Not gathering with many people
      • Health declaration
    • Q36. What kind of vaccine is being used mainly in Vietnam? Create radio buttons
      • Pfizer-BioNTech
      • Moderna
      • AstraZeneca
        Johnson & Johnson’s Janssen
    • Q37. What do you think is the most important thing to do to limit infection? Create radio buttons
      • Implementing 5K
      • Vaccination
      • Community immunization
      • Nothing to do
    • Q38. Do you think your view on COVID-19 is different from those of the people you live with?
      • Always different
      • Different in some cases
      • No
    • Q39. Do you always wear a mask when going out?
      • Always
      • Sometimes, that depends
      • Never
    • Q40. Do you wear a mask in the classroom or at work?
      • Always
      • Sometimes, that depends
      • Never
    • Q41. Do you feel you have safer sanitation genie than before? For example, wash your hands often.
      • Yes
      • No, it’s the same
    • Q42. Do you follow the news about the COVID-19 situation?
      • Hourly
      • Daily
      • Sometimes
      • Almost never
    • Q43. Do you think eating buffets or at restaurants and bars whose staff work without masks will get infected?
      • Yes, but I still eat there. I believe in fate
      • Yes, I never enter such places
      • No, Vietnam is less likely to be infected
    • Q44. In the recent time, have you attended meetings or parties?
      • Absolutely not
      • Less than before
      • As usual, I have still attended them
    • Q45. If vaccinated, would you be ready?
      • Sure
      • That depends on the type of vaccine
      • I don’t want to get vaccinated
  • Depression
  • In the past week:
    • Q46. Feeling depressed?
      • (0: no, 1: a little bit, 2: pretty often, 3: all the time)
    • Q47. Do you find it difficult to do something?
      • (0: no, 1: a little bit, 2: quite often, 3: everything)
    • Q48. Do you have trouble sleeping?
      • (0: no, 1: a little bit, 2: pretty often, 3: every night)
    • Q49. Do you feel happy?
      • (0: no, 1: a little bit, 2: pretty happy, 3: always happy)
    • Q50. Do you feel lonely?
      • (0: no, 1: a little bit, 2: pretty often, 3: all the time)
    • Q51. Do you find your life interesting?
      • (0: no, 1: a little bit, 2: pretty, 3: very interesting)
    • Q52. Do you feel sad?
      • (0: no, 1: a little bit, 2: pretty often, 3: all the time)
    • Q53. Have you ever felt like you do not continue your job?
      • (0: no, 1: a little bit, 2: pretty often, 3: all the time)
    • Q54. Finally, if you were to write 1–3 sentences about how you felt during this period, what would you write?

References

  1. WHO. Weekly Epidemiological Update on Covid-19, 1 June 2021. World Health Organization. Available online: https://www.who.int/publications/m/item/weekly-epidemiological-update-on-covid-19 (accessed on 1 June 2021).
  2. Ke, R.; Romero-Severson, E.; Sanche, S.; Hengartner, N. Estimating the reproductive number R0 of SARS-CoV-2 in the United States and eight European countries and implications for vaccination. J. Theor. Biol. 2021, 517, 110621. [Google Scholar] [CrossRef]
  3. Ribeiro, M.T.; Singh, S.; Guestrin, C. “Why should I trust you?” Explaining the predictions of any classifier. In Proceedings of the ACM SIGKDD International Conference on Knowledge Discovery and Data Mining, San Francisco, CA, USA, 13–17 August 2016; pp. 1135–1144. [Google Scholar] [CrossRef]
  4. Owais, M.; Lee, Y.W.; Mahmood, T.; Haider, A.; Sultan, H.; Park, K.R. Multilevel Deep-Aggregated Boosted Network to Recognize COVID-19 Infection from Large-Scale Heterogeneous Radiographic Data. IEEE J. Biomed. Health Inform. 2021, 25, 1881–1891. [Google Scholar] [CrossRef] [PubMed]
  5. Alotaibi, M.; Alotaibi, B. Detection of COVID-19 using deep learning on X-ray images. Intell. Autom. Soft Comput. 2021, 29, 885–898. [Google Scholar] [CrossRef]
  6. Alam, F.; Almaghthawi, A.; Katib, I.; Albeshri, A.; Mehmood, R. iResponse: An AI and IoT-Enabled Framework for Autonomous COVID-19 Pandemic Management. Sustainability 2021, 13, 3797. [Google Scholar] [CrossRef]
  7. Lin, C.-L.; Chen, J.K.C.; Ho, H.-H. BIM for Smart Hospital Management during COVID-19 Using MCDM. Sustainability 2021, 13, 6181. [Google Scholar] [CrossRef]
  8. Chen, Y.C.; Lu, P.E.; Chang, C.S.; Liu, T.H. A Time-Dependent SIR Model for COVID-19 with Undetectable Infected Persons. IEEE Trans. Netw. Sci. Eng. 2020, 7, 3279–3294. [Google Scholar] [CrossRef]
  9. Dansana, D.; Kumar, R.; Bhattacharjee, A.; Hemanth, D.J.; Gupta, D.; Khanna, A.; Castillo, O. Early diagnosis of COVID-19-affected patients based on X-ray and computed tomography images using deep learning algorithm. Soft Comput. 2020, 1–9. [Google Scholar] [CrossRef] [PubMed]
  10. Jelodar, H.; Wang, Y.; Orji, R.; Huang, S. Deep Sentiment Classification and Topic Discovery on Novel Coronavirus or COVID-19 Online Discussions: NLP Using LSTM Recurrent Neural Network Approach. IEEE J. Biomed. Health Inform. 2020, 24, 2733–2742. [Google Scholar] [CrossRef]
  11. Di-Giuseppe, M.; Nepa, G.; Prout, T.A.; Albertini, F.; Marcelli, S.; Orrù, G.; Conversano, C. Stress, Burnout, and Resilience among Healthcare Workers during the COVID-19 Emergency: The Role of Defense Mechanisms. Int. J. Environ. Res. Public Health 2021, 18, 5258. [Google Scholar] [CrossRef] [PubMed]
  12. Heras-Pedrosa, C.; Sánchez-Núñez, P.; Peláez, J.I. Sentiment Analysis and Emotion Understanding during the COVID-19 Pandemic in Spain and Its Impact on Digital Ecosystems. Int. J. Environ. Res. Public Health 2020, 17, 5542. [Google Scholar] [CrossRef]
  13. Di Renzo, L.; Gualtieri, P.; Pivari, F.; Soldati, L.; Attinà, A.; Cinelli, G.; Leggeri, C.; Caparello, G.; Barrea, L.; Scerbo, F.; et al. Eating habits and lifestyle changes during COVID-19 lockdown: An Italian survey. J. Transl. Med. 2020, 18, 229. [Google Scholar] [CrossRef]
  14. Dang, H.A.H.; Viet-Nguyen, C. Gender inequality during the COVID-19 pandemic: Income, expenditure, savings, and job loss. World Dev. 2021, 140, 105296. [Google Scholar] [CrossRef]
  15. Richter, L.M.; Naicker, S.N. Bridging the digital divide with data-free platforms: Online survey reaching families with young children during the COVID-19 pandemic (Preprint). JMIR Pediatr. Parent. 2020, 4, e26571. [Google Scholar] [CrossRef]
  16. Muto, K.; Yamamoto, I.; Nagasu, M.; Tanaka, M.; Wada, K. Japanese citizens’ behavioral changes and preparedness against COVID-19: An online survey during the early phase of the pandemic. PLoS ONE 2020, 15, e0234292. [Google Scholar] [CrossRef] [PubMed]
  17. Guerrero, M.D.; Vanderloo, L.M.; Rhodes, R.E.; Faulkner, G.; Moore, S.A.; Tremblay, M.S. Canadian children’s and youth’s adherence to the 24-h movement guidelines during the COVID-19 pandemic: A decision tree analysis. J. Sport Health Sci. 2020, 9, 313–321. [Google Scholar] [CrossRef]
  18. Gonzalo, R.M.; Ana, R.G.; Patricia, C.A.; Laura, A.L.; Nathalia, G.T.; Luis, C.; Asuncion, L.; Miguel, R.V.; Benedicto, C.F. Short-term emotional impact of COVID-19 pandemic on Spaniard health workers. J. Affect. Disord. 2021, 278, 390–394. [Google Scholar] [CrossRef]
  19. Mok, K.H.; Xiong, W.; Ke, G.; Cheung, J.O.W. Impact of COVID-19 pandemic on international higher education and student mobility: Student perspectives from mainland China and Hong Kong. Int. J. Educ. Res. 2021, 105, 101718. [Google Scholar] [CrossRef]
  20. Copeland, W.E.; McGinnis, E.; Bai, Y.; Adams, Z.; Nardone, H.; Devadanam, V.; Rettew, J.; Hudziak, J.J. Impact of COVID-19 Pandemic on College Student Mental Health and Wellness. J. Am. Acad. Child Adolesc. Psychiatry 2021, 60, 134–141.e2. [Google Scholar] [CrossRef] [PubMed]
  21. Berg-Beckhoff, G.; Guldager, J.D.; Andersen, P.T.; Stock, C.; Jervelund, S.S. What predicts adherence to governmental COVID-19 measures among Danish students? Int. J. Environ. Res. Public Health 2021, 18, 1822. [Google Scholar] [CrossRef]
  22. Karakose, T.; Yirci, R.; Papadakis, S. Exploring the Interrelationship between COVID-19 Phobia, Work–Family Conflict, Family–Work Conflict, and Life Satisfaction among School Administrators for Advancing Sustainable Management. Sustainability 2021, 13, 8654. [Google Scholar] [CrossRef]
  23. Karakose, T.; Yirci, R.; Papadakis, S.; Ozdemir, T.Y.; Demirkol, M.; Polat, H. Science Mapping of the Global Knowledge Base on Management, Leadership, and Administration Related to COVID-19 for Promoting the Sustainability of Scientific Research. Sustainability 2021, 13, 9631. [Google Scholar] [CrossRef]
  24. Karasar, N. Scientific Research Method: Concepts, Principles, Techniques; Nobel Academic: Ankara, Turkey, 2020. [Google Scholar]
  25. Radloff, L.S. The CES-D Scale: A Self-Report Depression Scale for Research in the General Population. Appl. Psychol. Meas. 1977, 1, 385–401. [Google Scholar] [CrossRef]
  26. Shapiro, S.S.; Wilk, M. An analysis of variance test for normality. Biometrika 1965, 52, 591–611. [Google Scholar] [CrossRef]
  27. Tavakol, M.; Dennick, R. Making sense of Cronbach’s alpha. Int. J. Med Educ. 2011, 2, 53–55. [Google Scholar] [CrossRef] [PubMed]
  28. Neuhäuser, M. Wilcoxon–Mann–Whitney Test. In International Encyclopedia of Statistical Science; Springer: Berlin/Heidelberg, Germany, 2011; pp. 1656–1658. [Google Scholar] [CrossRef]
  29. Kruskal-Wallis Test. In The Concise Encyclopedia of Statistics; Springer: New York, NY, USA, 2008; pp. 288–290. [CrossRef]
  30. Lachenbruch, P.A. McNemar Test. In Wiley StatsRef: Statistics Reference Online; John Wiley & Sons, Inc.: Hoboken, NJ, USA, 2014. [Google Scholar] [CrossRef]
  31. Wuensch, K.L. Chi-Square Tests. In International Encyclopedia of Statistical Science; Springer: Berlin/Heidelberg, Germany, 2011; pp. 252–253. [Google Scholar] [CrossRef]
  32. Liu, B. Sentiment Analysis and Opinion Mining. Synth. Lect. Hum. Lang. Technol. 2012, 5, 1–167. [Google Scholar] [CrossRef] [Green Version]
  33. Tran, T.K.; Phan, T.T. A hybrid approach for building a Vietnamese sentiment dictionary. J. Intell. Fuzzy Syst. 2018, 35, 967–978. [Google Scholar] [CrossRef]
  34. Esuli, A.; Esuli, A.; Sebastiani, F. Sentiwordnet: A Publicly Available Lexical Resource for Opinion Mining. In Proceedings of the 5th Conference on Language Resources and Evaluation, LREC 2006, Genoa, Italy, 22–28 May 2006; pp. 417–422. Available online: http://citeseerx.ist.psu.edu/viewdoc/summary?doi=10.1.1.61.7217 (accessed on 7 June 2021).
  35. Zadeh, L.A. The concept of a linguistic variable and its application to approximate reasoning. Inf. Sci. 1975, 8, 199–249. [Google Scholar] [CrossRef]
  36. Khang, N.V. Ngôn Ngữ Mạng—Biến Thể Ngôn Ngữ Trên Mạng Tiếng Việt (Social Networking Language); Vinabook JSC: Ho Chi Minh City, Vietnam, 2019. [Google Scholar]
  37. Tran, T.K.; Phan, T.T. Capturing Contextual Factors in Sentiment Classification: An Ensemble Approach. IEEE Access 2020, 8, 116856–116865. [Google Scholar] [CrossRef]
  38. Rish, I. An Empirical Study of the Naive Bayes Classifier. In Proceedings of the IJCAI 2001 Workshop on Empirical Methods InArtificial Intelligence; IBM: New York, NY, USA, 2001; pp. 41–46. [Google Scholar]
  39. Quinlan, J.R. Induction of Decision Trees. Mach. Learn. 1986, 1, 81–106. [Google Scholar] [CrossRef] [Green Version]
  40. Engel, J. Polytomous logistic regression. Stat. Neerl. 1988, 42, 233–252. [Google Scholar] [CrossRef]
  41. Pal, S.K.; Mitra, S. Multilayer Perceptron, Fuzzy Sets, and Classification. IEEE Trans. Neural Netw. 1992, 3, 683–697. [Google Scholar] [CrossRef] [PubMed]
  42. Hearst, M.A. Support Vector Machines. IEEE Intell. Syst. 1998, 13, 18–28. [Google Scholar] [CrossRef] [Green Version]
  43. Hiemstra, D. A probabilistic justification for using tf.idf term weighting in information retrieval. Int. J. Digit. Libr. 2000, 3, 131–139. [Google Scholar] [CrossRef]
  44. Huremović, D. Brief History of Pandemics (Pandemics Throughout History). In Psychiatry of Pandemics: A Mental Health Response to Infection Outbreak; Springer Nature Switzerland AG: Cham, Switzerland, 2019; pp. 7–35. [Google Scholar] [CrossRef]
Figure 1. Situation of COVID-19 in some provinces in four Vietnamese regions.
Sustainability 13 10762 g001
Figure 2. The flowchart of data collection process.
Sustainability 13 10762 g002
Figure 3. Chart of 5K practice and precautions.
Sustainability 13 10762 g003
Figure 4. Using LIME to figure out which parts of the interpretable input are contributing towards the prediction.
Sustainability 13 10762 g004
Figure 5. Top frequently appeared words in the students’ comments.
Sustainability 13 10762 g005
Table 1. A part of the dictionary of variations of words and emotion icons on Vietnamese social media.
Emotion Icons/WordsBase Form (Meaning)Score
banh ta lôngnát, không còn nguyên vẹn (broken, no longer entire)−0.75
bánh bèonhõng nhẽo ẻo lả (effeminate, a female characteristic)−0.25
:)vui mừng (enjoyable)0.75
:]vui mừng (enjoyable)0.75
:(buồn (sad)−0.75
<3thả tim (showing one’s love)0.75
Table 2. Participants’ characteristics.
Total Samples
(n = 1875)
Central Vietnam
(n = 371)
HCMC
(n = 988)
Western Vietnam
(n = 368)
Northern Vietnam
(n = 148)
Student Year
1-Freshman
2-Sophomore
3-Junior
4-Senior
541 (28.85%)
546 (29.12%)
391 (20.86%)
397 (21.17%)
190 (51.21%)
98 (26.42%)
42 (11.32%)
41 (11.05%)
261 (26.42%)
261 (26.42%)
230 (23.28%)
236 (23.88%)
47 (12.77%)
160 (43.48%)
91 (24.73%)
70 (19.02%)
43 (29.05%)
27 (18.25%)
28 (18.92%)
50 (33.78%)
Gender (F)1130 (60.26%)214 (57.68%)666 (67.41%)196 (53.26%)54 (36.49%)
Height (cm)163.0 [158.0–170.0] *
163.23 ± 8.18
162.0 [156.0–169.0]
162.5 ± 8.50
162.0 [158.0–169.2]
163.0 ± 7.93
163.0 [158.0–170.0]
163.7 ± 8.24
166.5 [160–171.2]
165.6 ± 8.50
Weight
(kg)
53.00 [48.0–60.0] *
55.54 ± 11.45
51.00 [46.00–58.00]
53.22 ± 10.14
54.00 [48.00–62.00]
56.36 ± 12.09
54.00 [47.00–60.0]
54.88 ± 10.81
56.00 [50.00–64.25]
57.50 ± 10.85
BMI (Kg/m2)20.19 [18.49–22.27] *
20.73 ± 3.24
19.53 [18.07–21.62]
20.07 ± 2.89
20.55 [18.73–22.66]
21.09 ± 3.43
19.91 [18.33–22.03]
20.38 ± 3.03
20.38 [18.67–22.49]
20.87 ± 2.94
The continuous variables are represented by the mean and standard deviation (M ± SD) or median and interquartile range (IQR) in square brackets (M [IQR]). The categorical variables are represented in accordance with number or percentage (n (%)). *: Indicating the variable does not follow a normal distribution according to the Shapiro–Wilk normality test (p < 0.05).
Table 3. Sleep habits and part-time work pre-COVID-19 and during COVID-19.
Sleep Habits pre-COVID-19Sleep Habits during COVID-19
<7 h/day690 (36.8%)397 (21.17%)
=7–9 h/day136 (7.25%)395 (21.07%)
>9 h/day1049 (55.95)1083 (57.76%)
Part-Time Work pre-COVID-19Part-Time Work during COVID-19
01145 (61.07%)1610 (85.87%)
<7 h/week202 (10.77%)82 (4.37%)
=7–14 h/week209 (11.15%)68 (3.63%)
>14 h/week319 (17.01%)115 (6.13%)
Table 4. Students’ compliance with anti-pandemic regulations.
OverallNot Really CompliantReally Compliant *
Total1875 (100%)641 (34.19%)1234 (65.81%)
Area
North
Central
South
West
148 (7.89%)
371 (19.79%)
988 (52.69%)
368 (19.63%)
56 (8.74%)
136 (21.22%)
319 (49.76%)
130 (20.28%)
92 (7.46%)
235 (19.04%)
669 (54.21%)
238 (19.29%)
Understanding about COVID-19
Low
High
542 (28.91%)
1333 (71.09%)
86 (29.02%)
455 (70.98%)
356 (28.85%)
878 (71.15%)
Concerning about COVID-19
Low
High
429 (23.88%)
1446 (77.12%)
176 (27.46%)
465 (72.54%)
253 (20.50%)
981 (79.50%)
Implementing measures to prevent infection
Bad
Average
Good
356 (18.99%)
859 (45.81%)
660 (35.20%)
143 (22.31%)
335 (52.26%)
163 (25.43%)
213 (17.26%)
524 (42.46%)
497 (40.28%)
Depression
Low
High
1506 (80.32%)
369 (19.68%)
516 (80.50%)
125 (19.50%)
990 (80.23%)
244 (19.77%)
*: A student is said to strictly comply with the state’s epidemic prevention and control regulations if choosing the scale in question Q23 from 9 points or more; otherwise, this would not be the case.
Table 5. The results of sentiment classification.
MetricOur SystemNaïve BayesDecision TreesLogistic RegressionMulti-Layer PerceptronSupport Vector Machines
Accuracy0.910.82420.77920.85810.85710.8528
Precision0.910.84940.79550.87690.83680.8673
Publisher’s Note: MDPI stays neutral with regard to jurisdictional claims in published maps and institutional affiliations.

