
Retrofitting Building Envelope Using Phase Change Materials and Aerogel Render for Adaptation to Extreme Heatwave: A Multi-Objective Analysis Considering Heat Stress, Energy, Environment, and Cost


Abstract
:1. Introduction
- (1)
- To investigate and identify the best retrofit combinations using PCM blanket, aerogel render, and insulation in passive and air-conditioned buildings.
- (2)
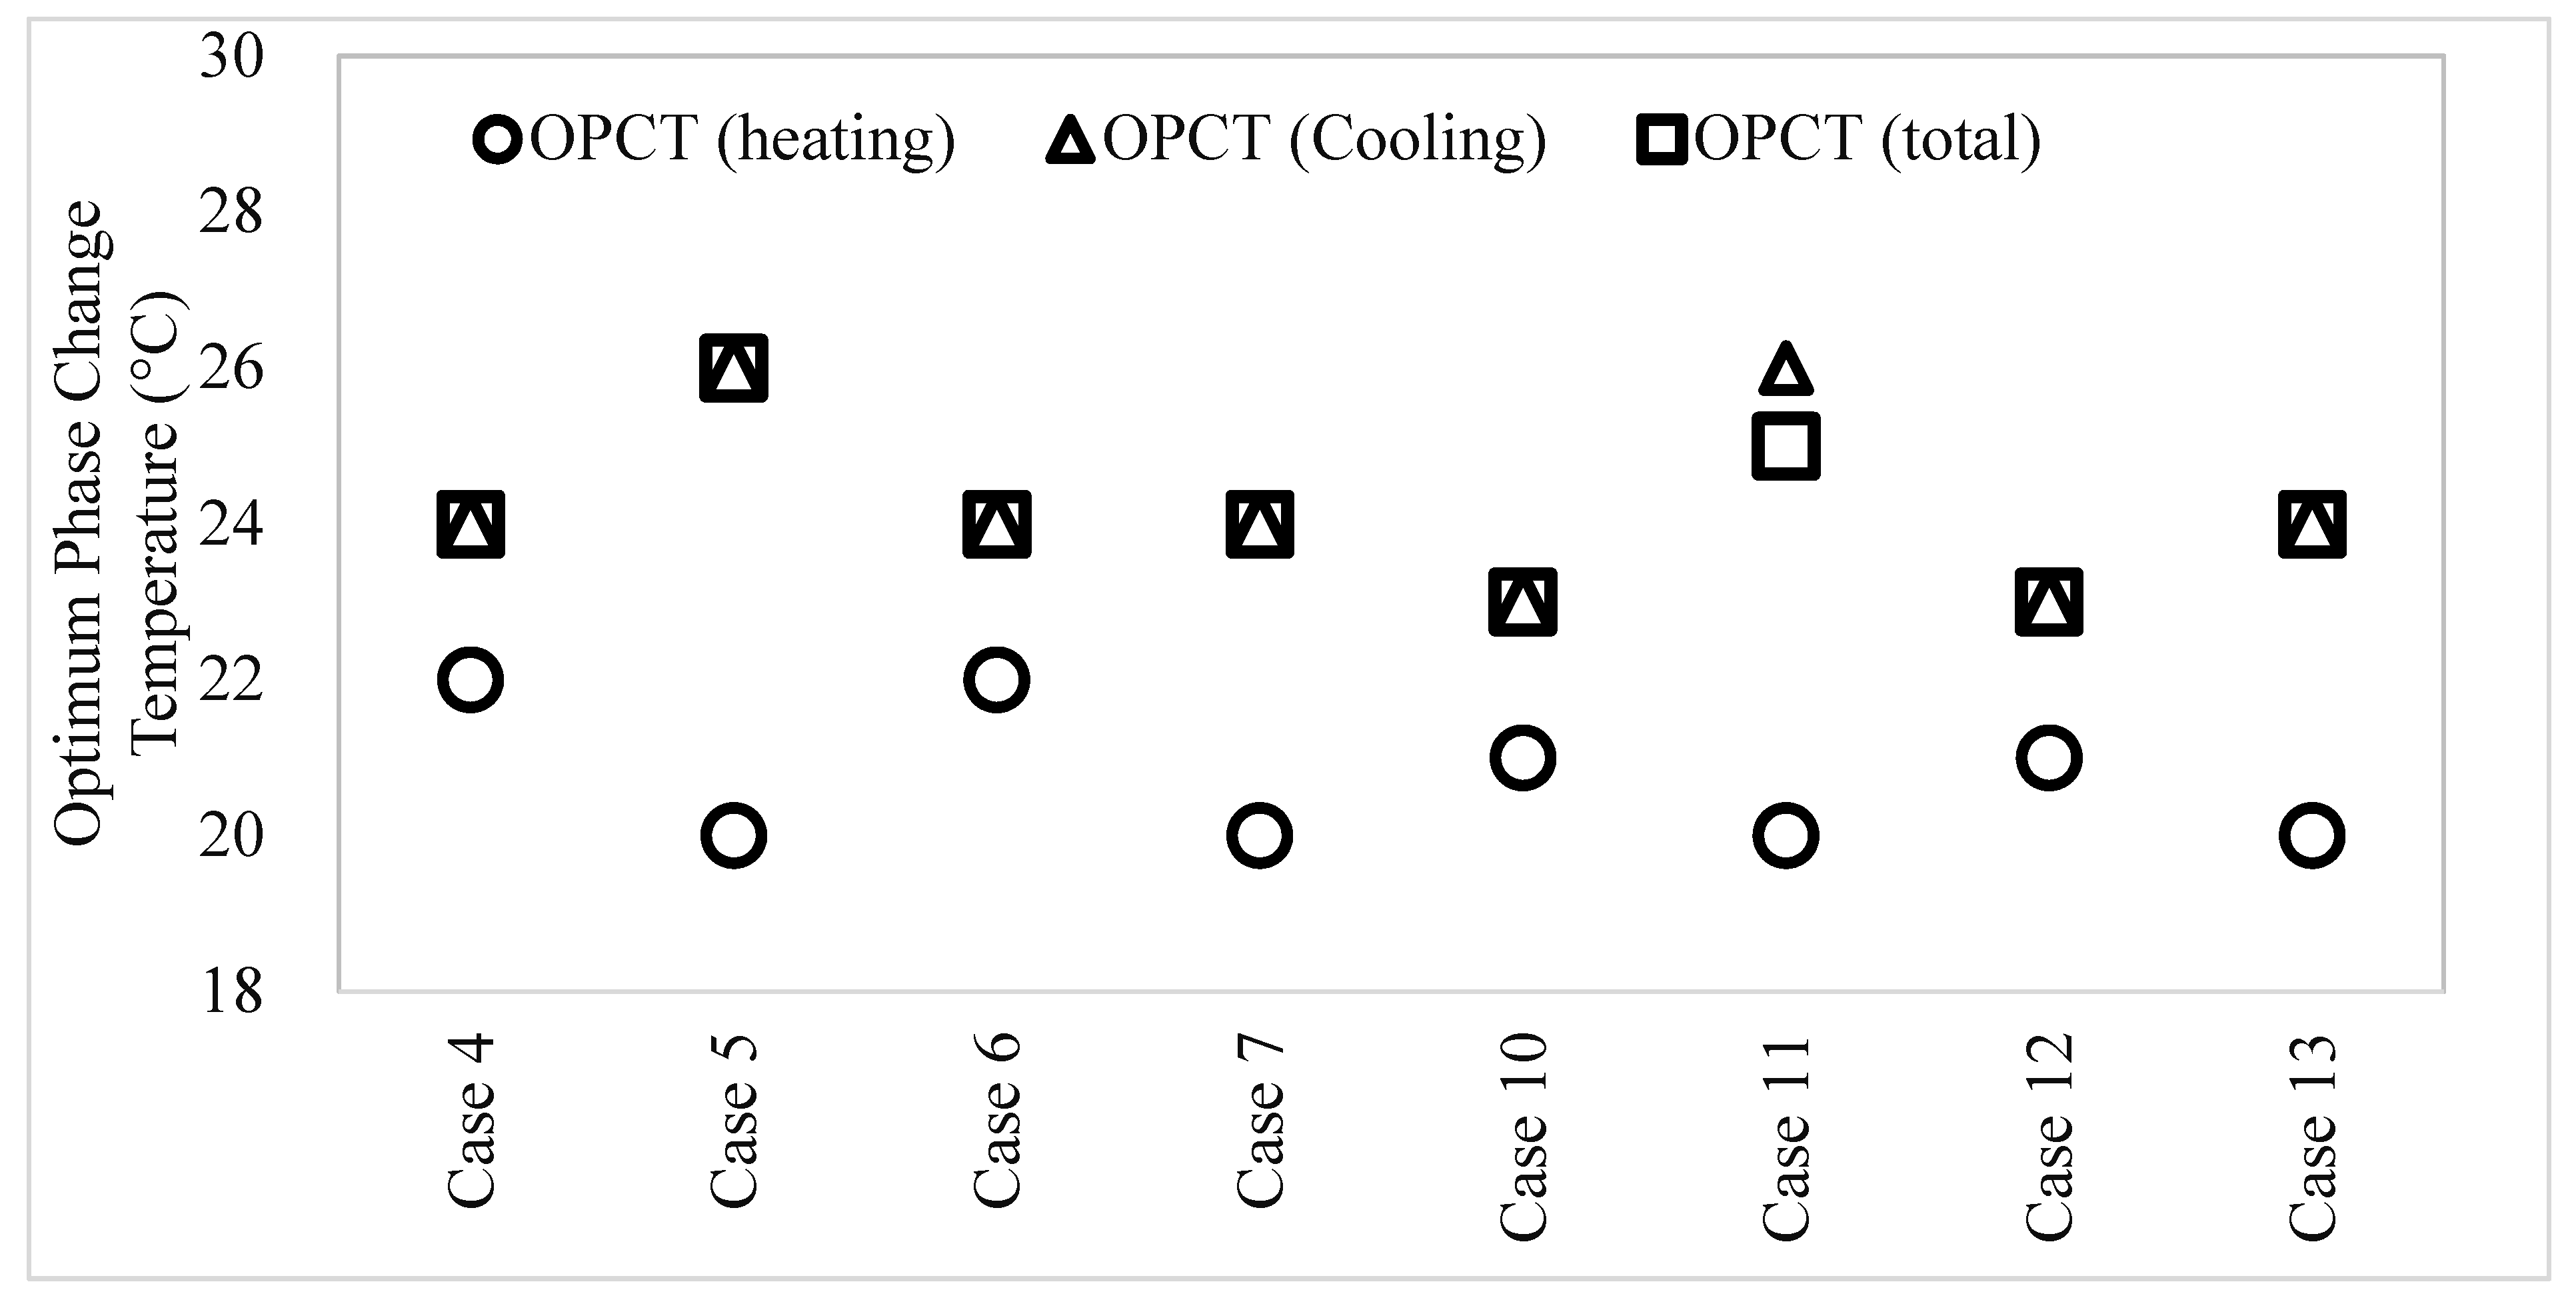
- To determine the optimum PCM temperature, PCM thickness, and aerogel render thickness for the identified best retrofit combination.
2. Methodology
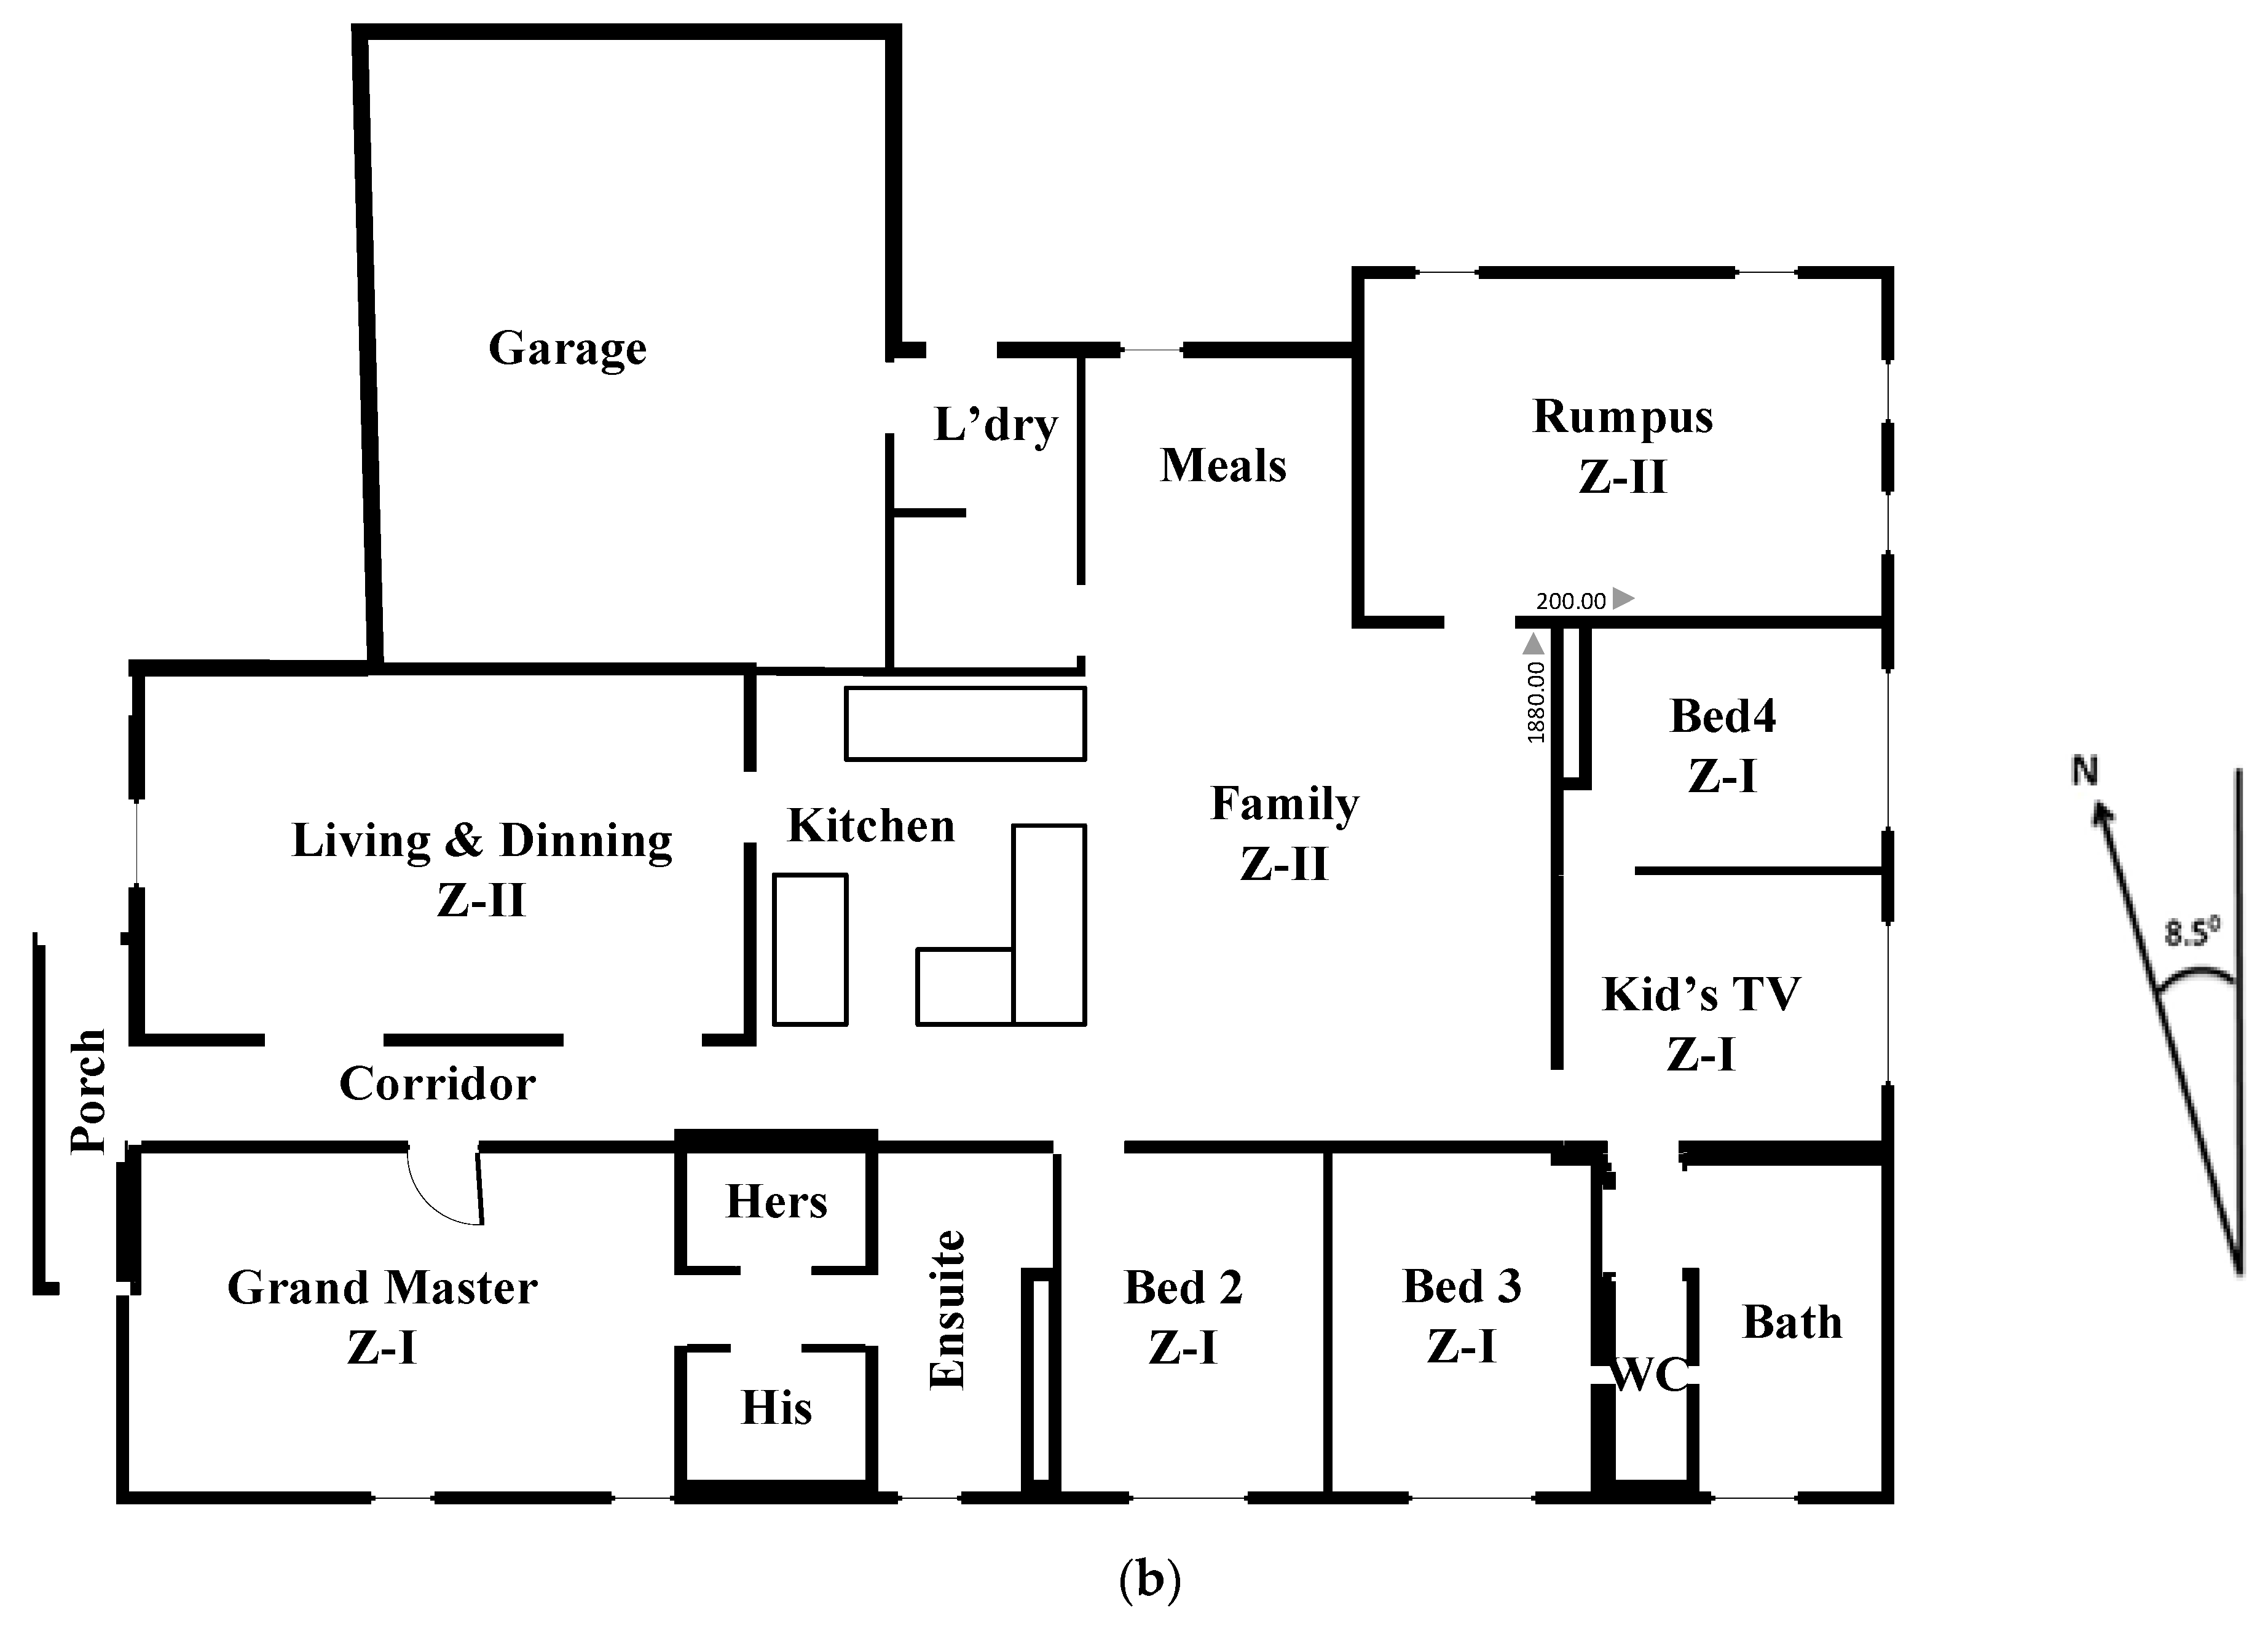
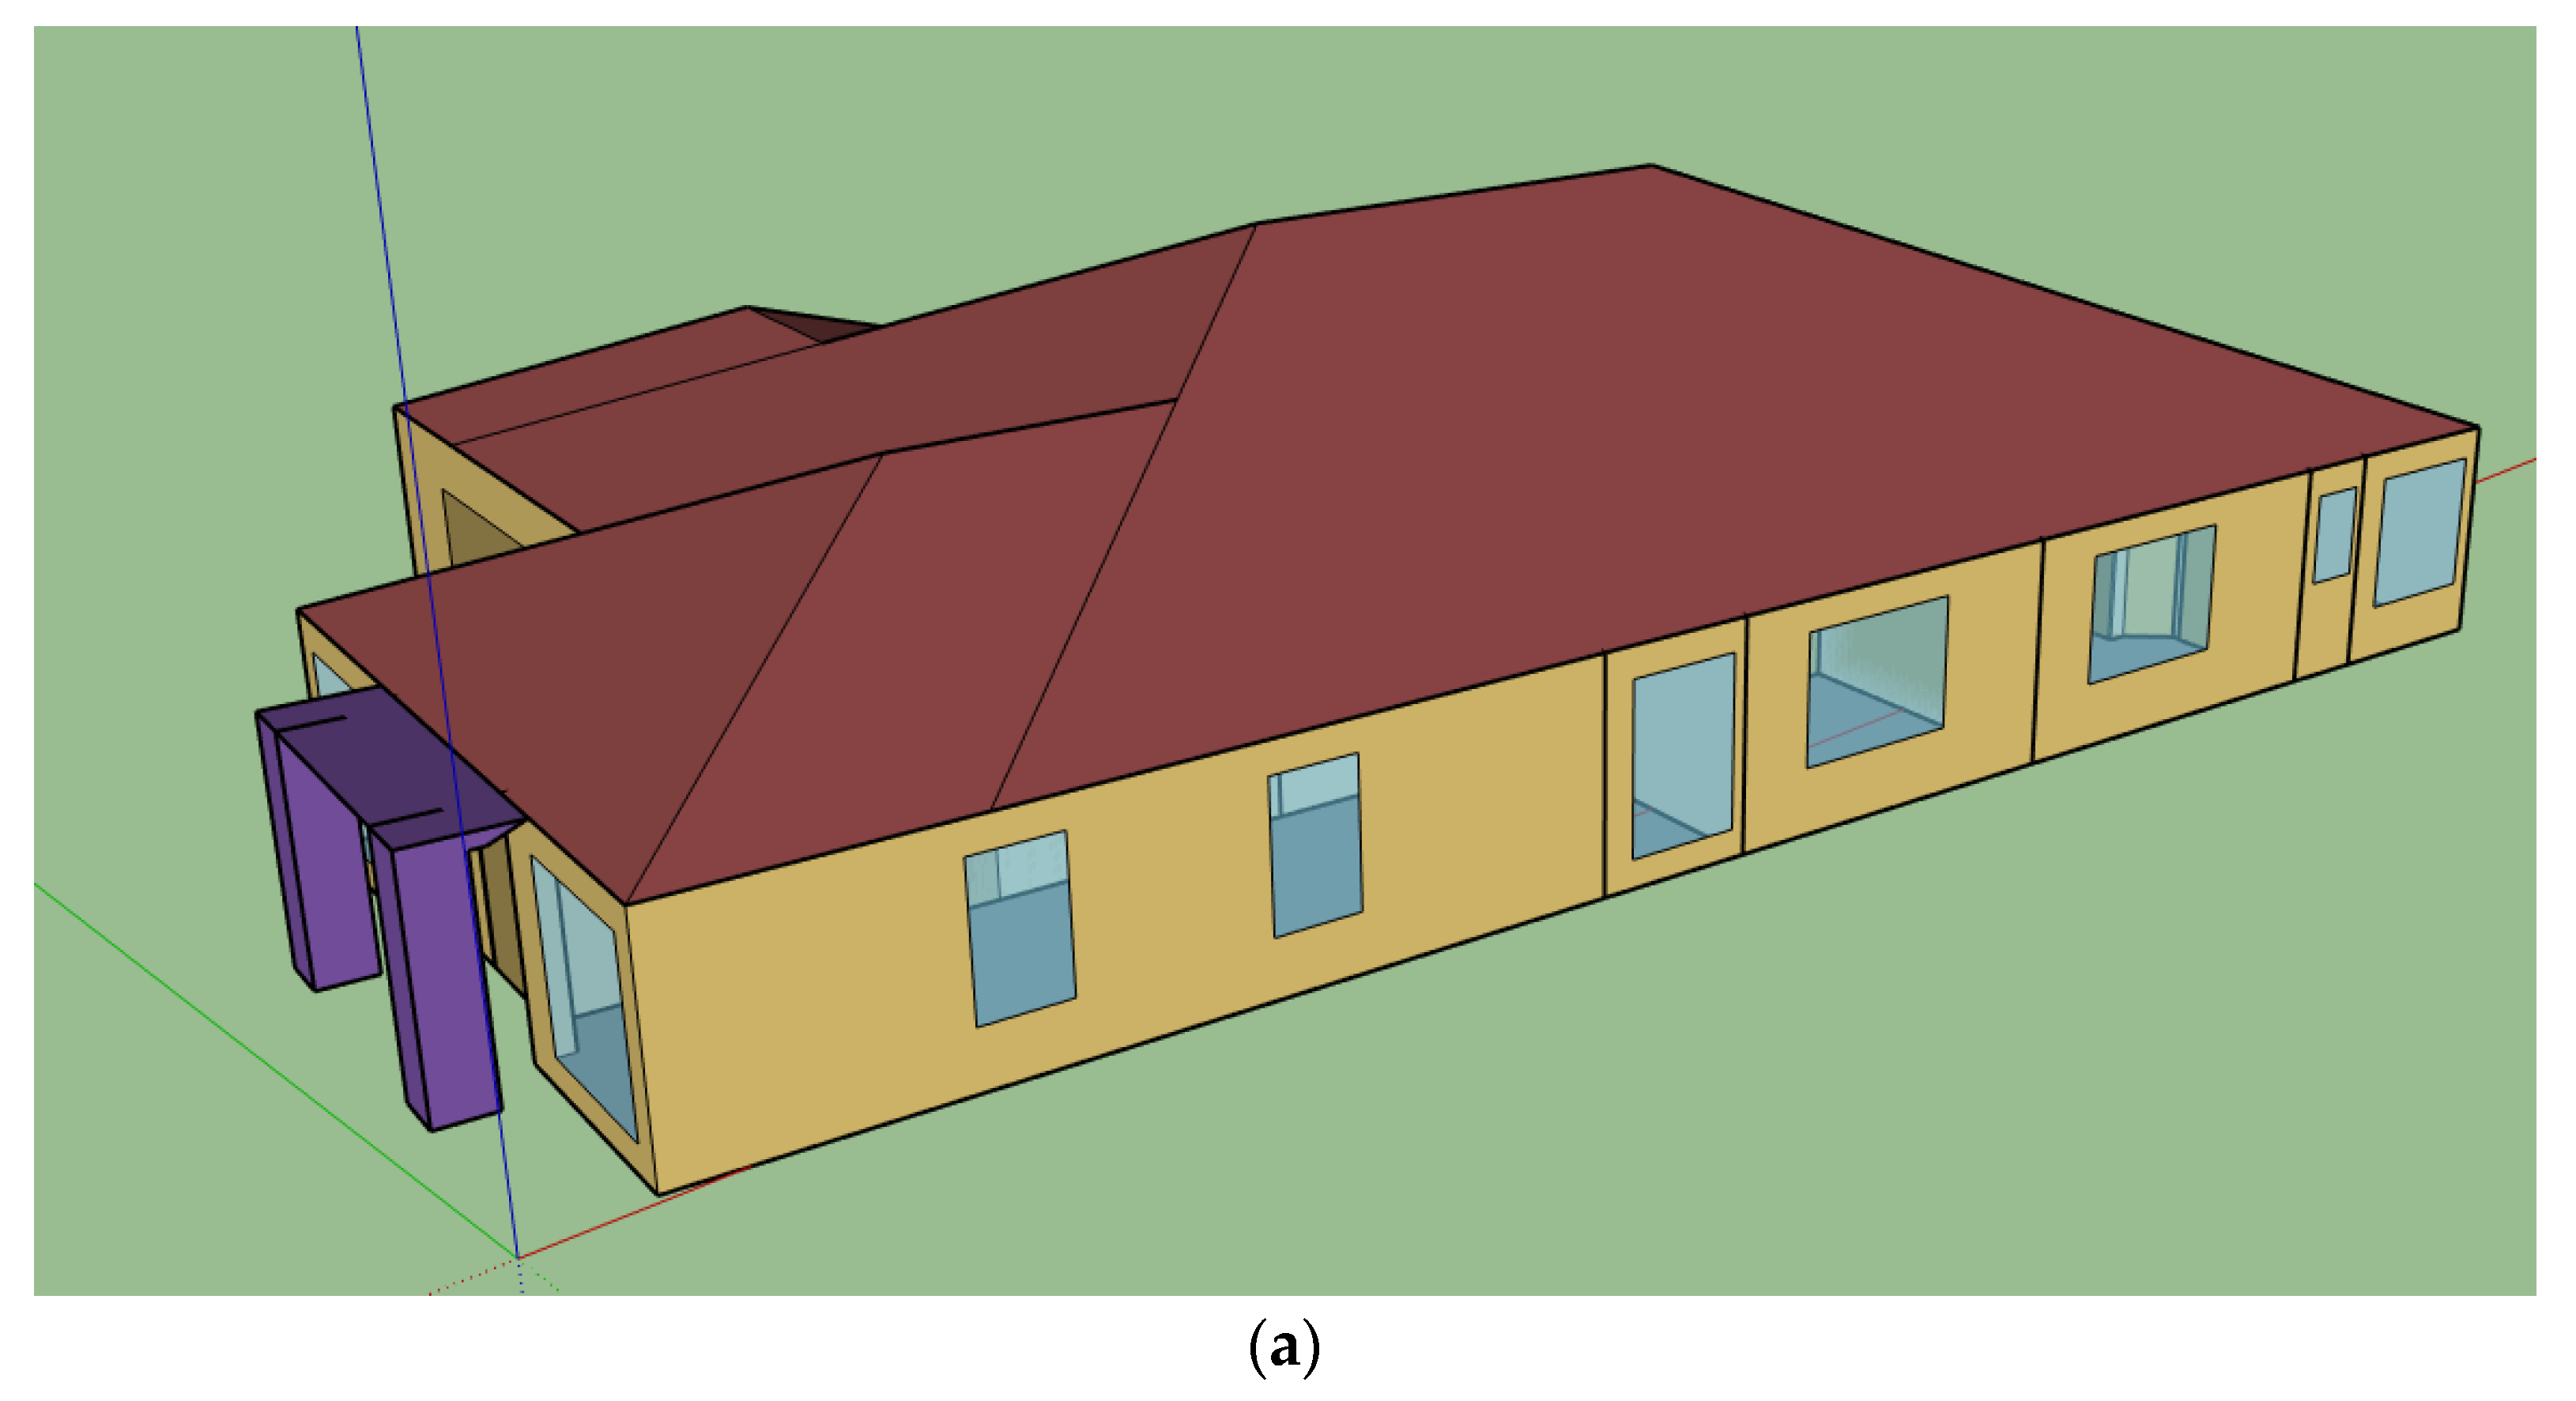
2.1. Case Study Building Description
2.2. Building Energy and Thermal Simulations
- = specific heat capacity of material (kJ/kg K)
- = density of material (kg/m3)
- h = specific enthalpy (kJ/kg)
- T = Temperature (°C)
- b = temperature node, b − 1 and b + 1 are adjacent inner and outer nodes.
- a + 1 and a = simulation time and previous time step
- and = material’s thermal conductivity at a different node.
2.3. Benchmark Studies
2.4. Parametric Studies
2.5. Analysis Methods
2.5.1. Indoor Heat Stress Risk and Thermal Discomfort
2.5.2. Energy Savings
2.5.3. Emission Reduction
2.5.4. Lifecycle Cost Analysis
3. Results
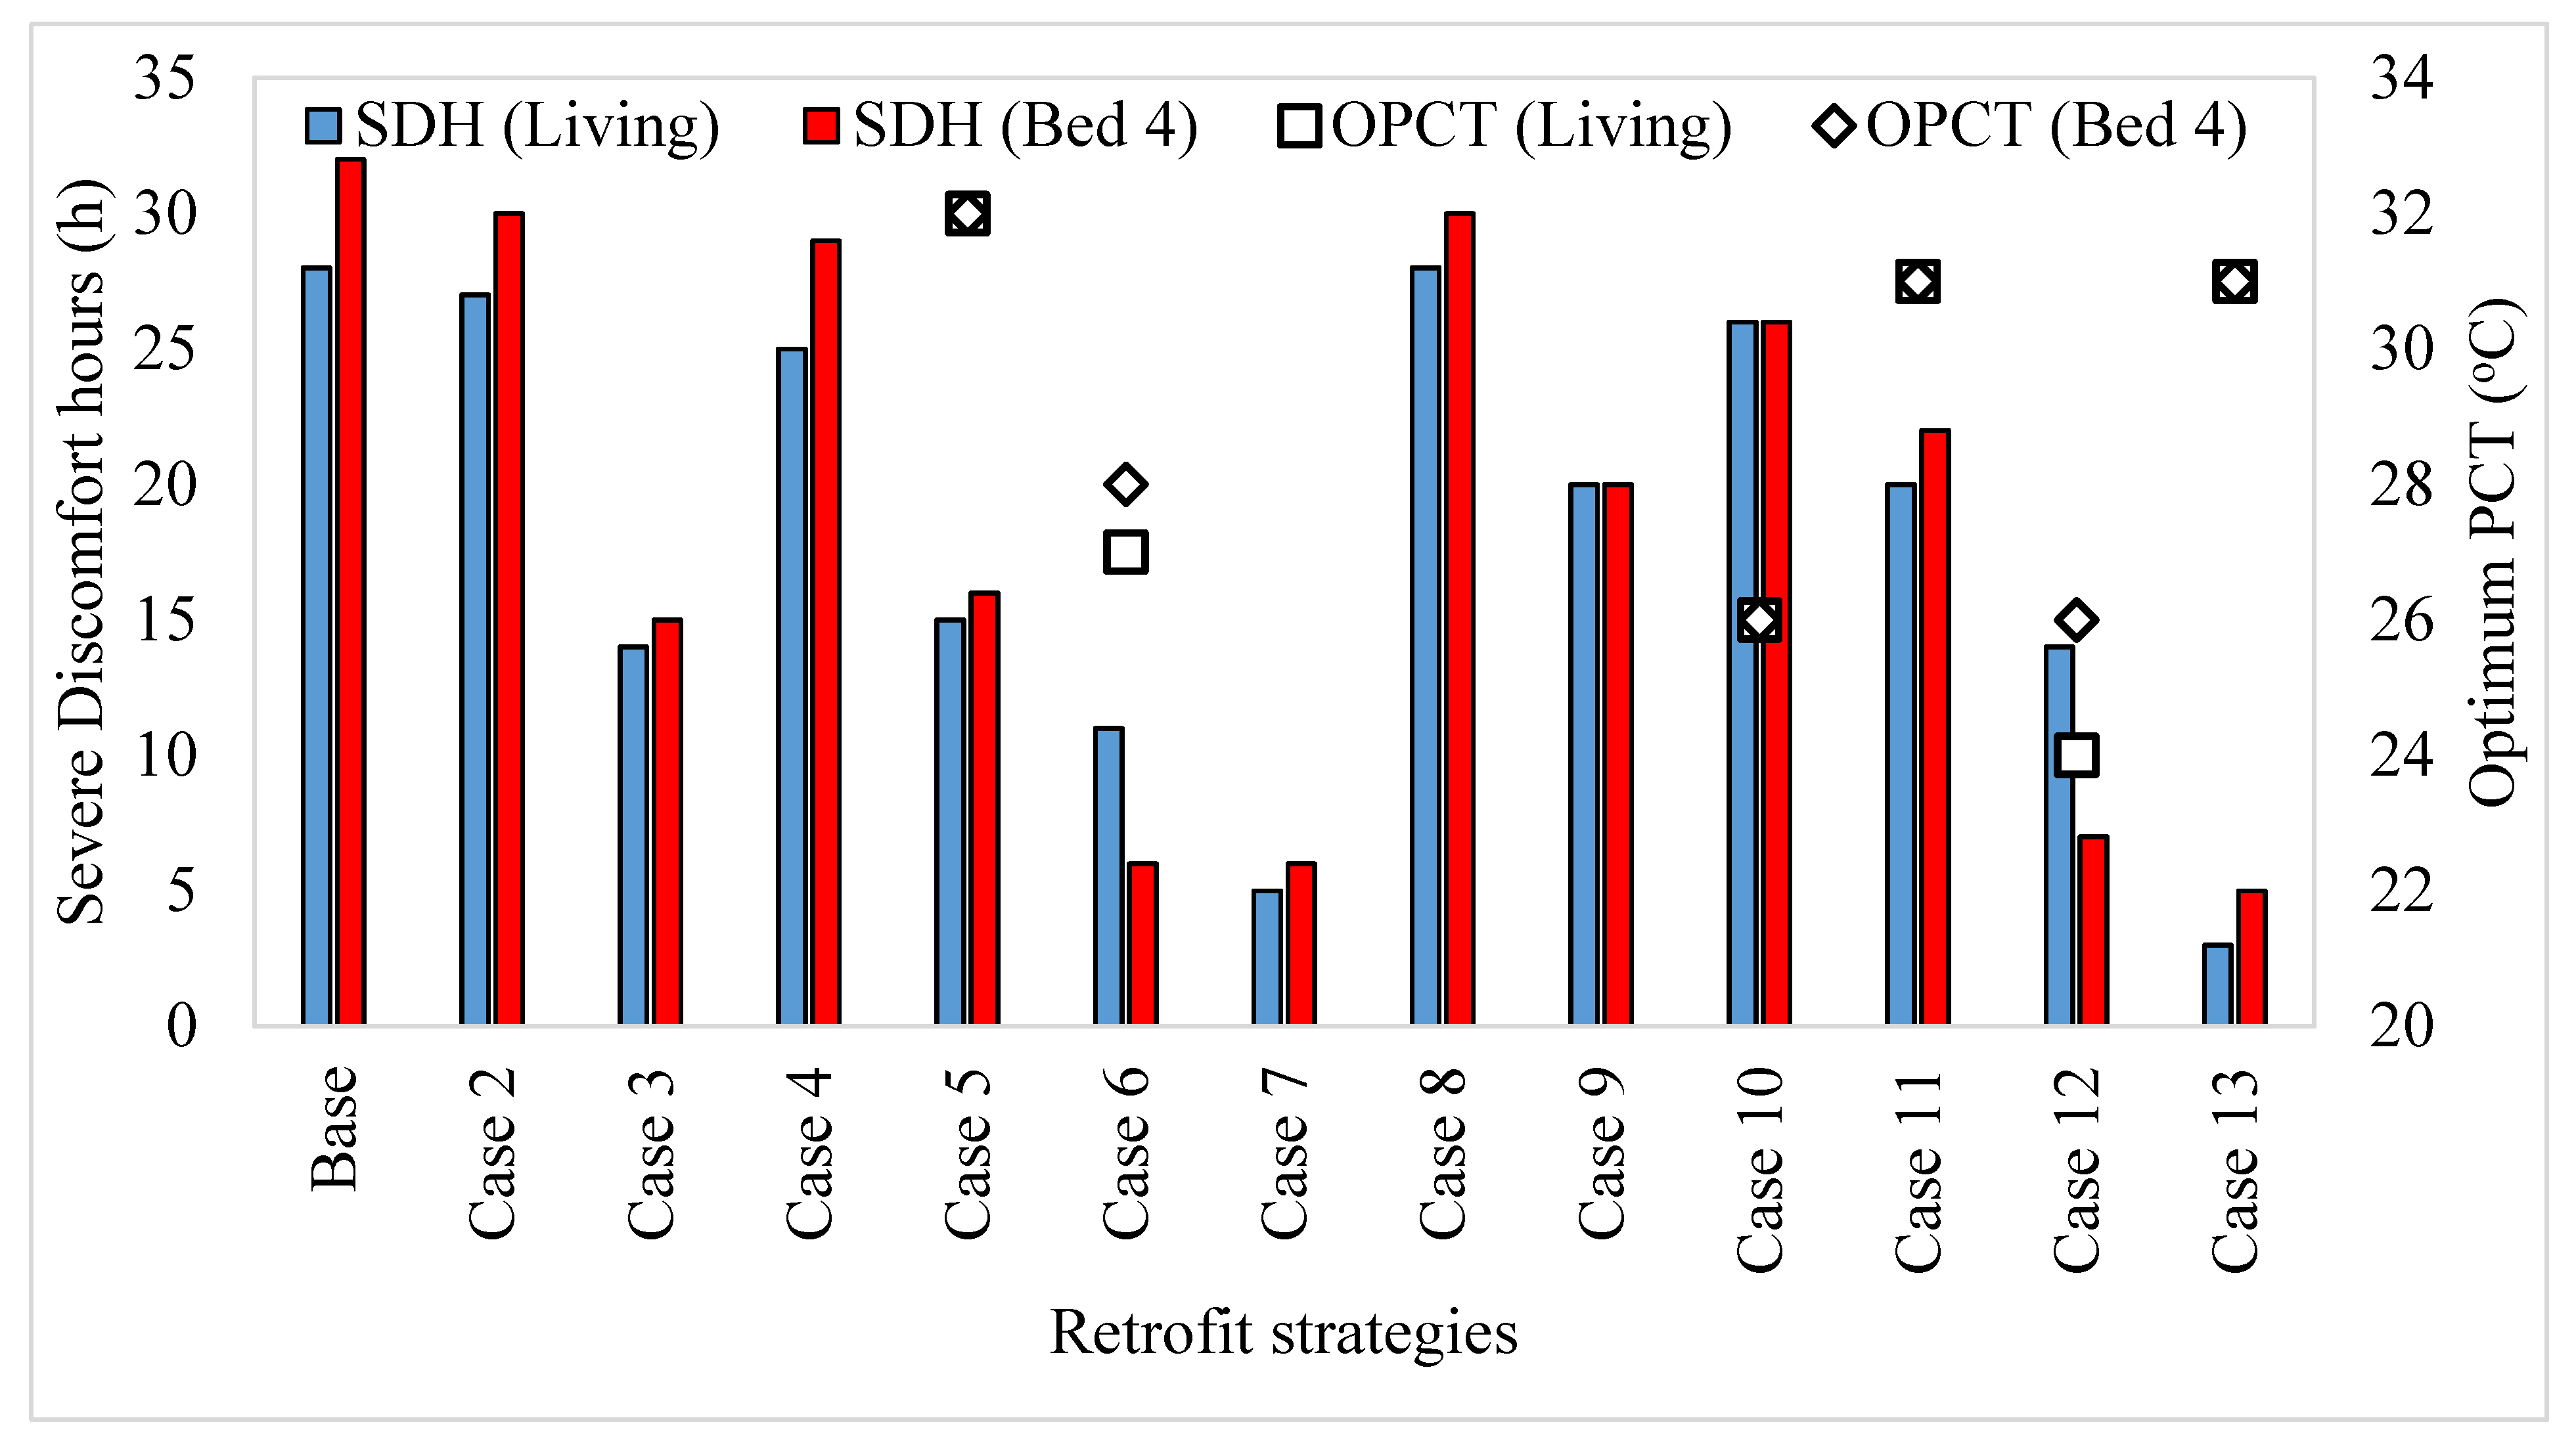
3.1. Performance of the Retrofitting Strategies in Terms of Heat Stress Risk
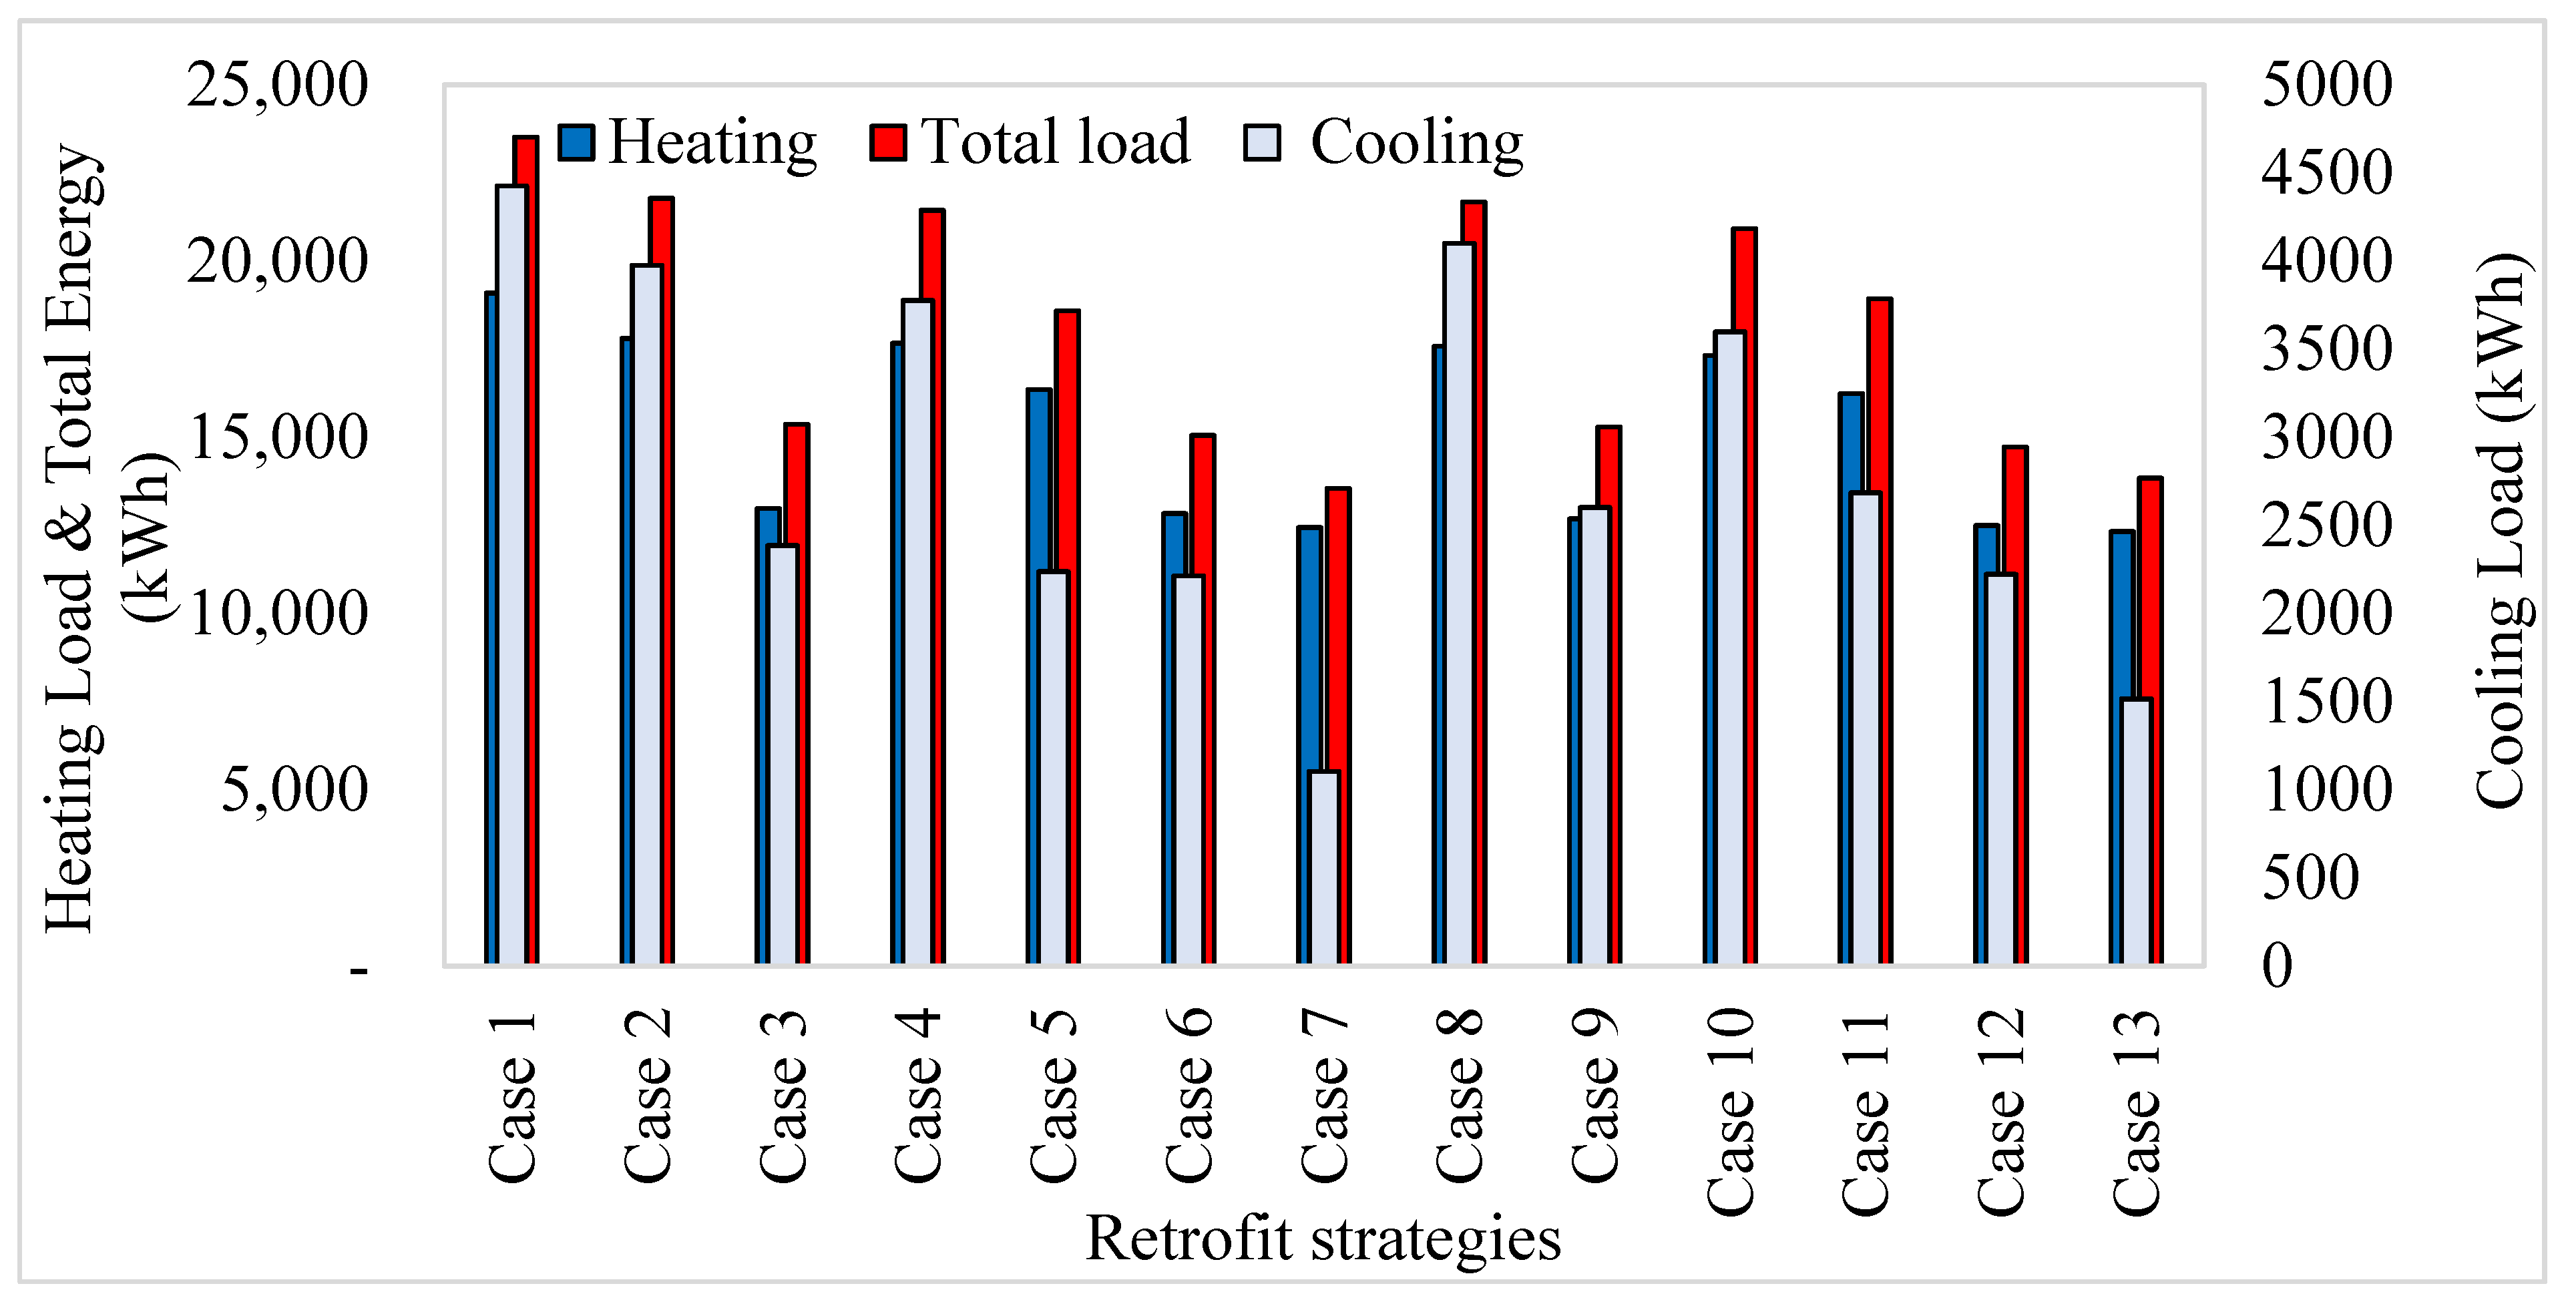
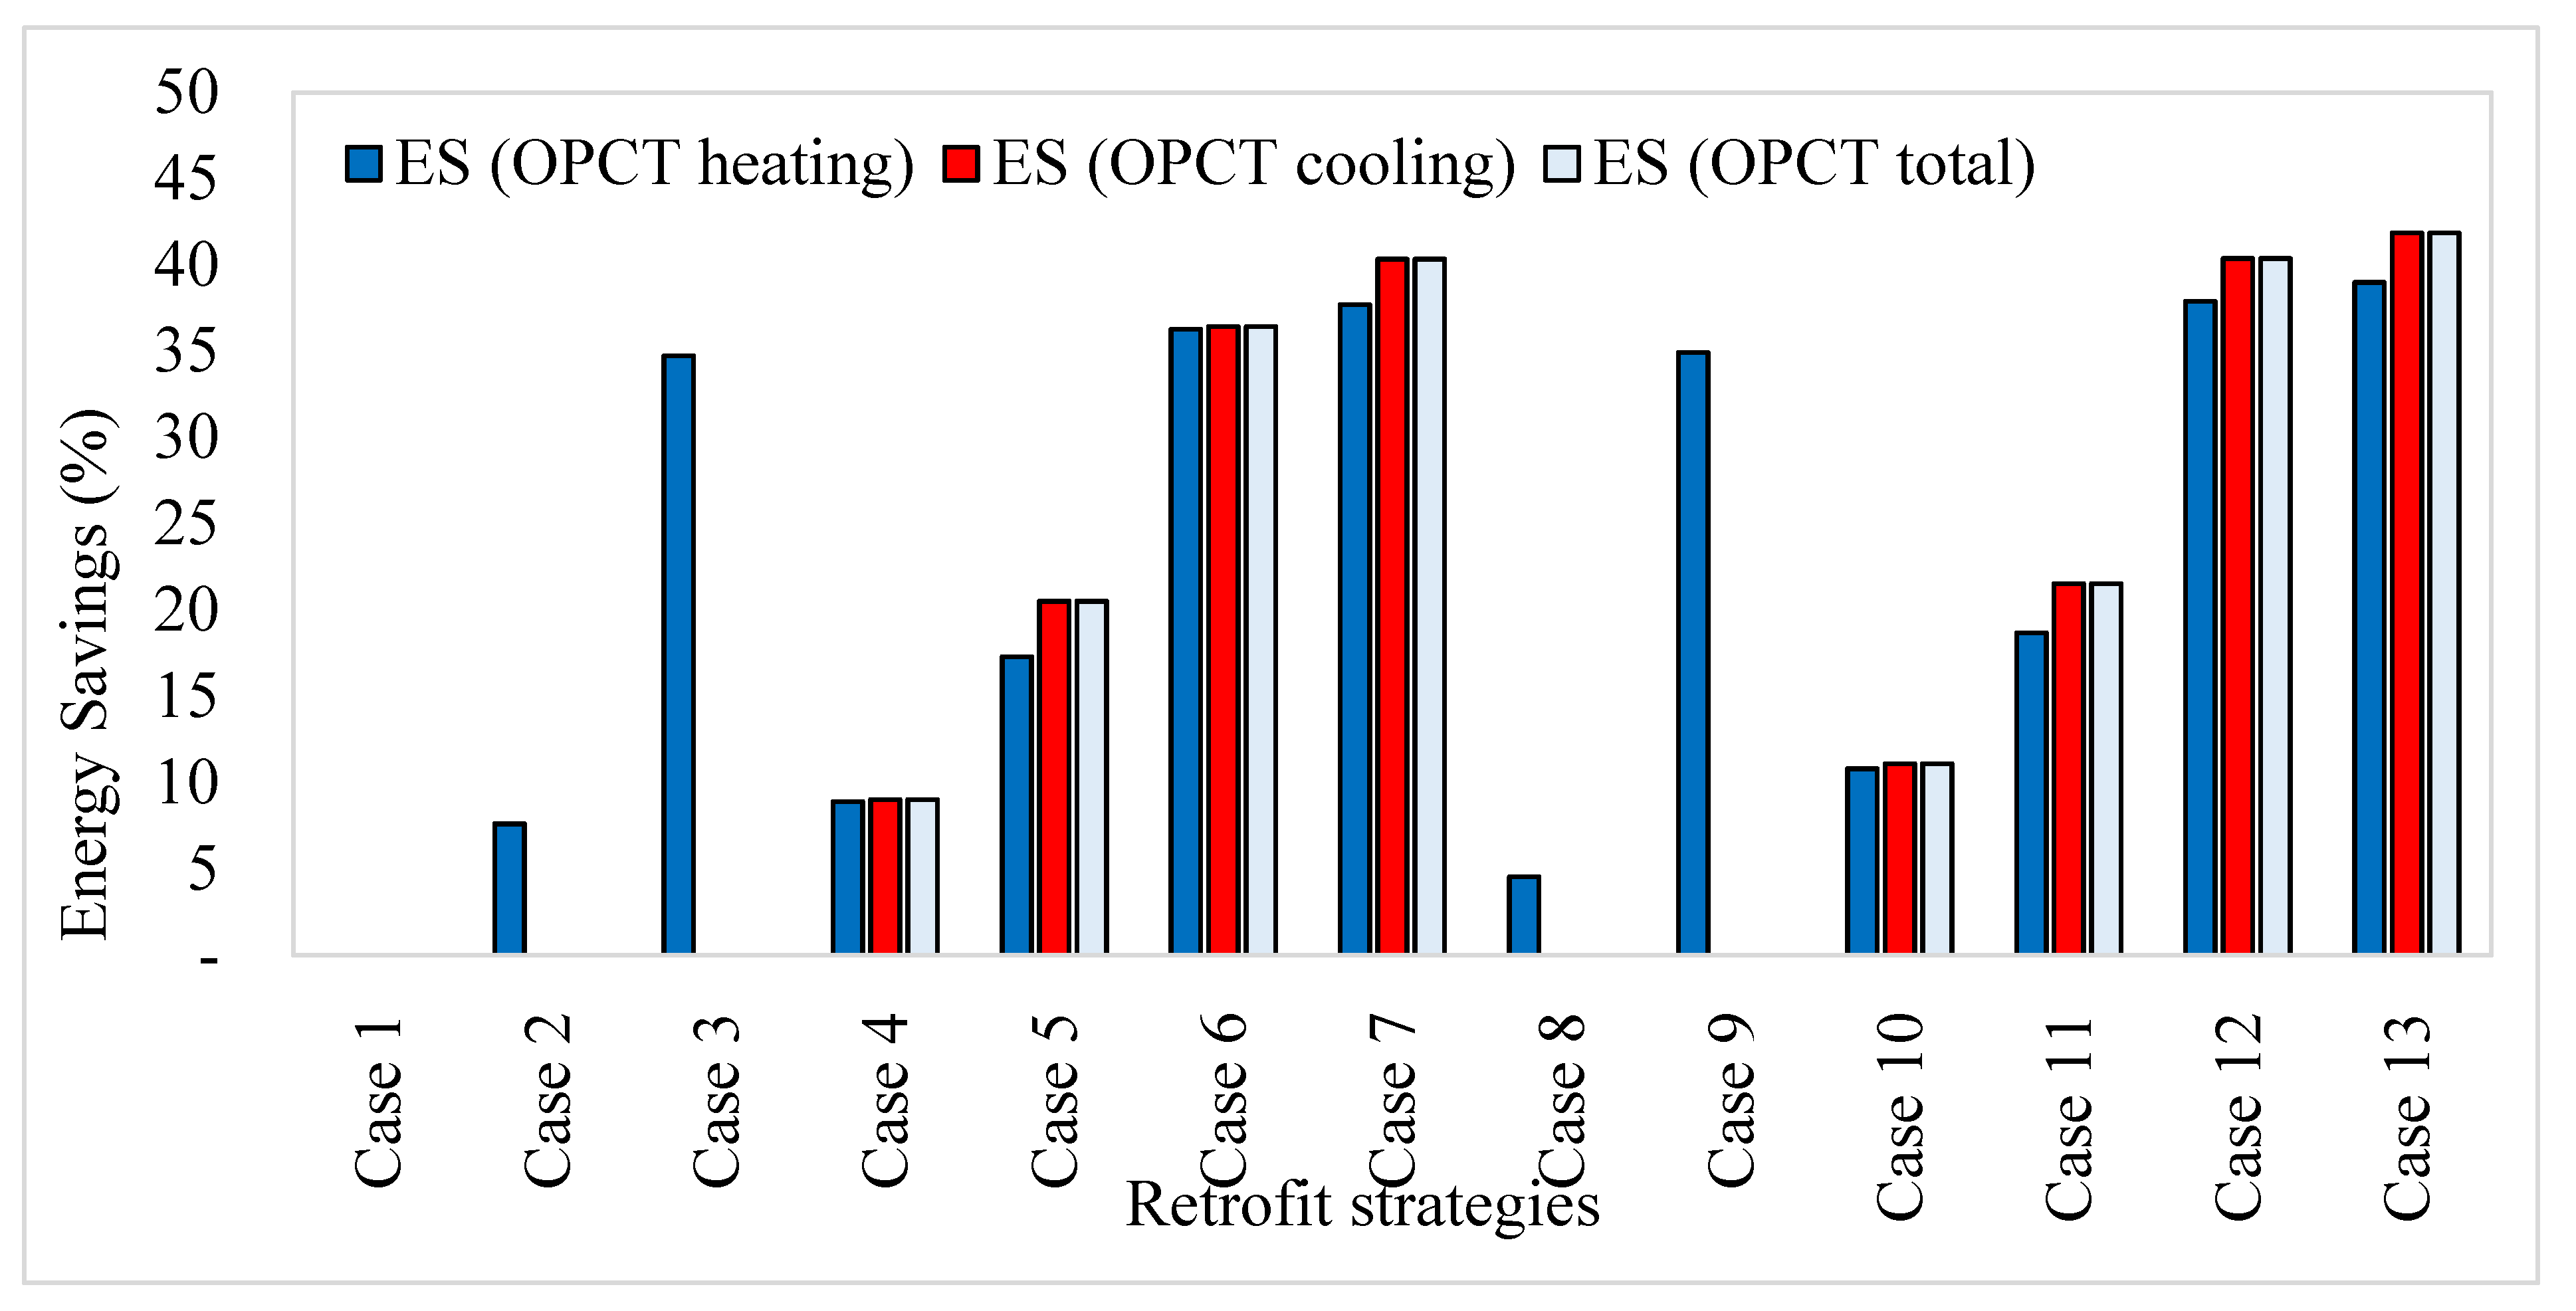
3.2. Performance of Retrofitting Strategies in Terms of Energy Savings
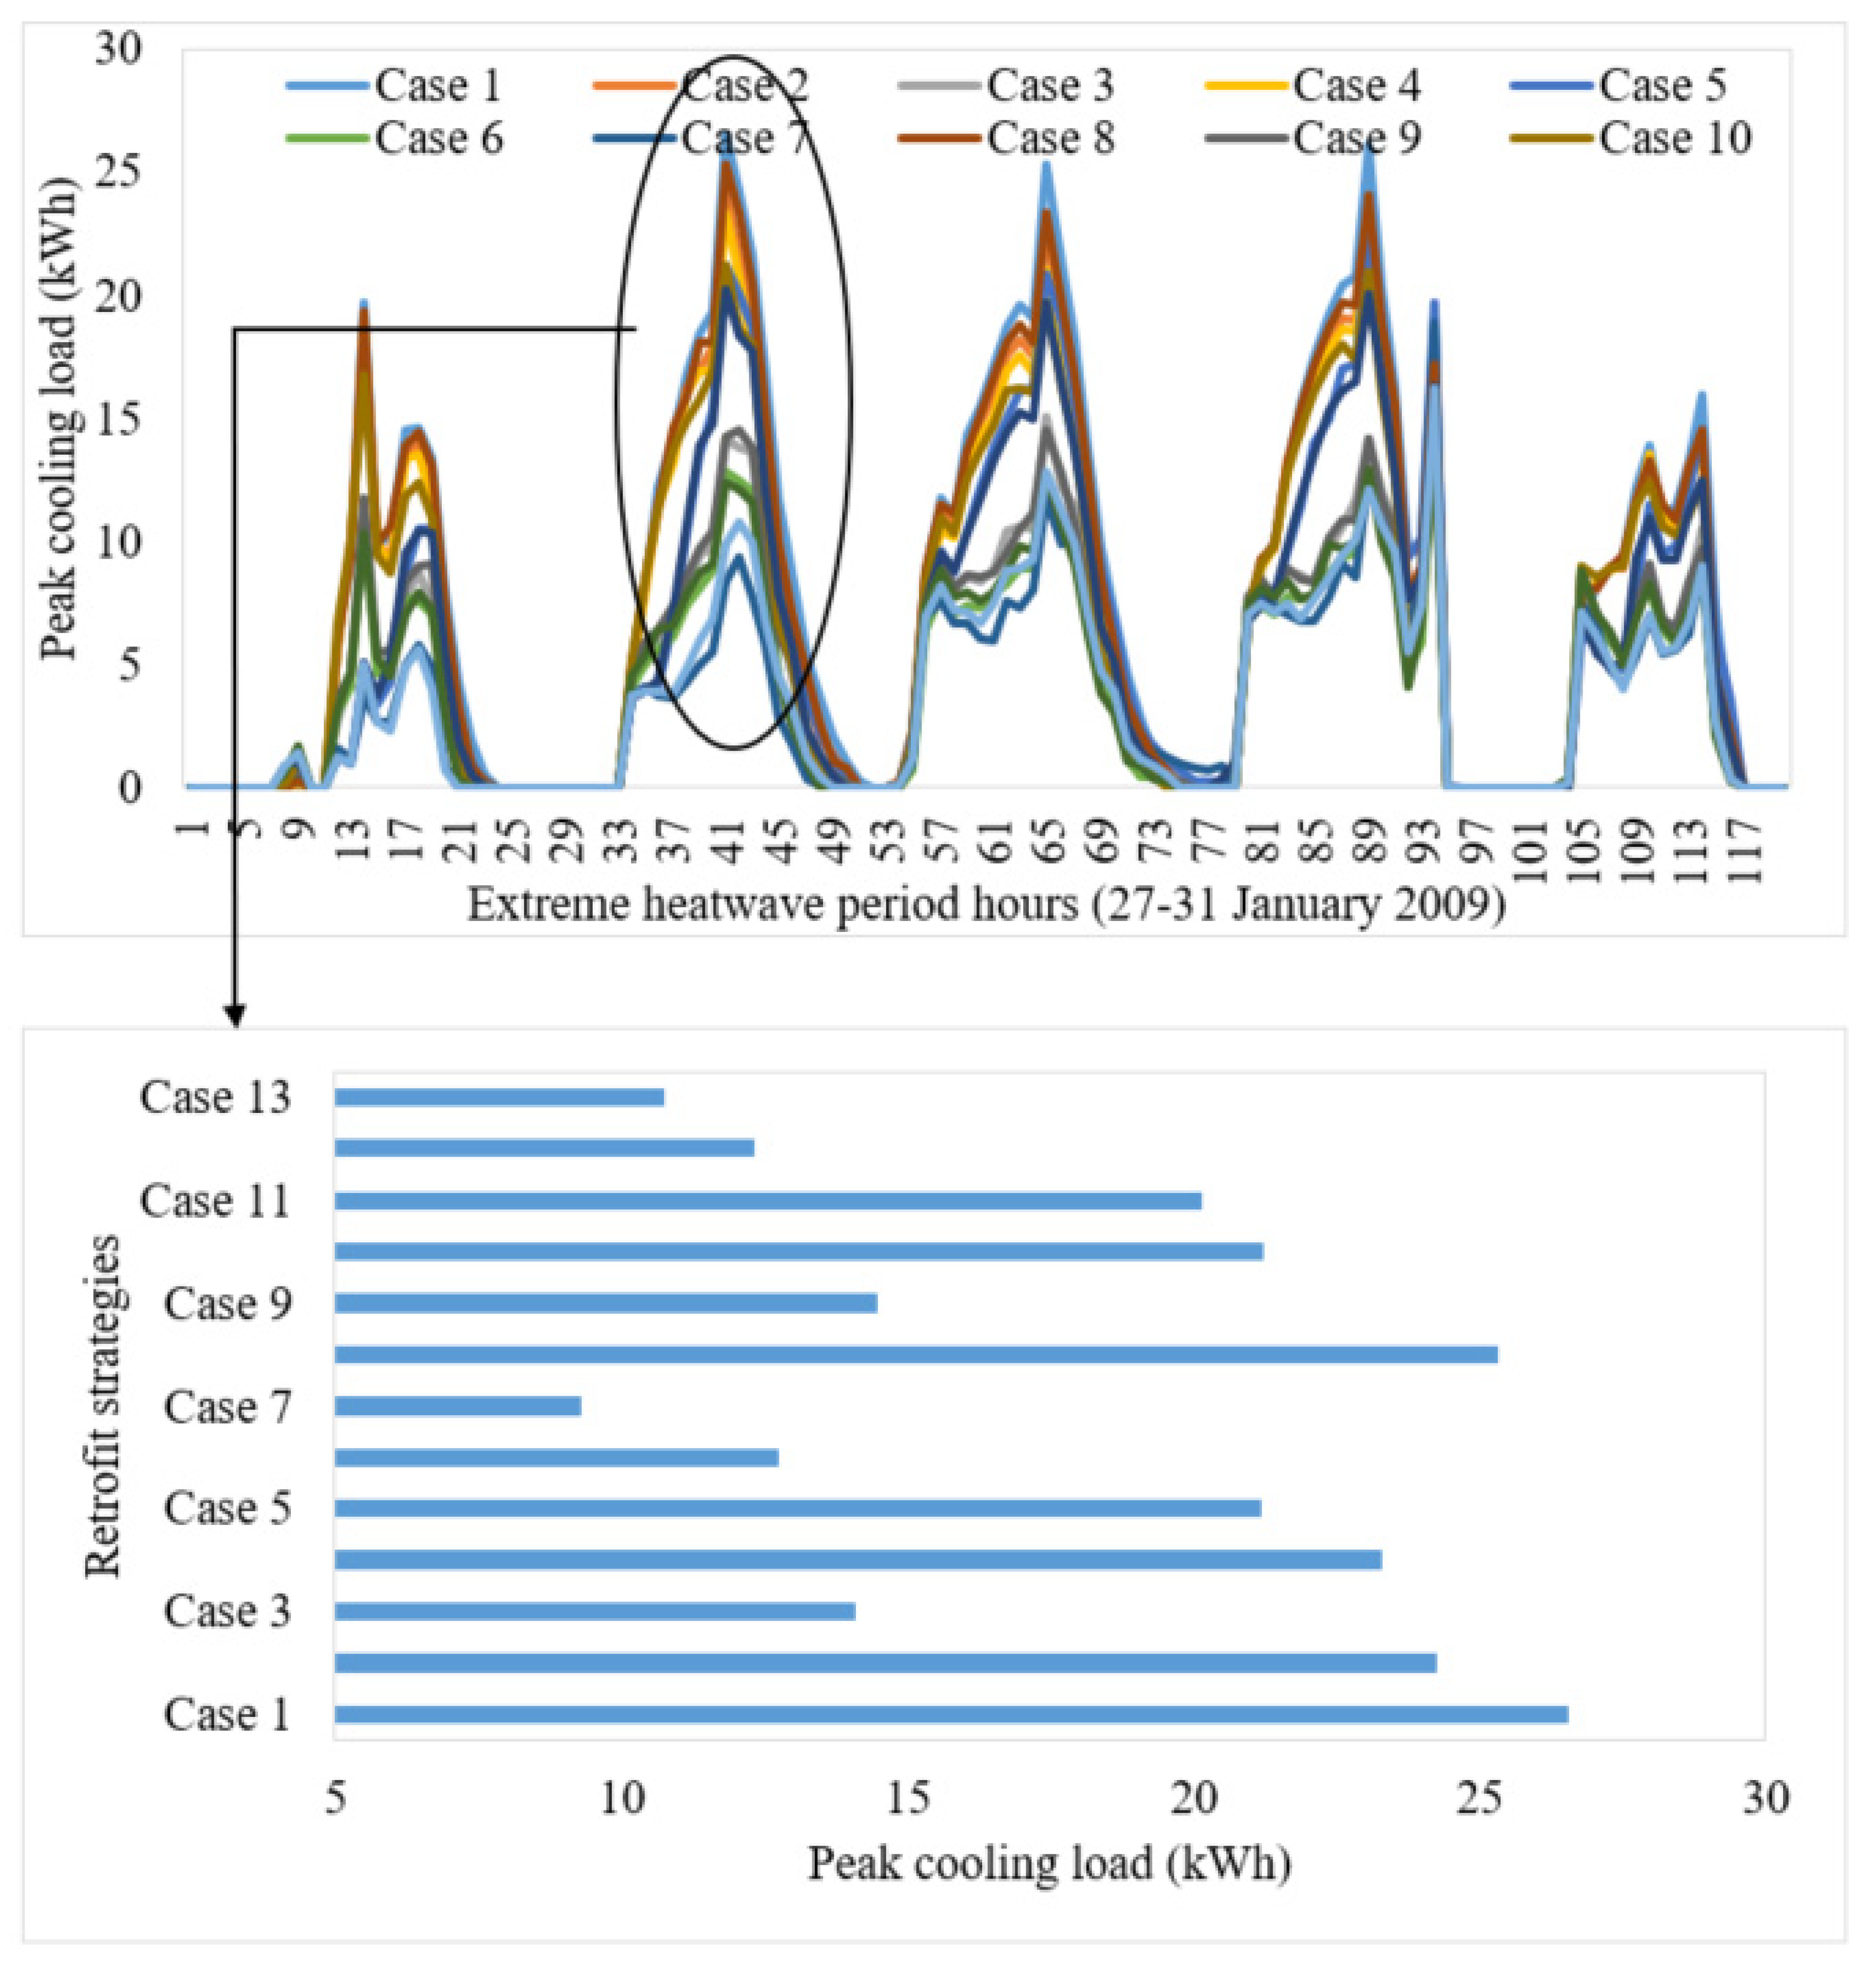
3.3. Peak Cooling Load Reduction
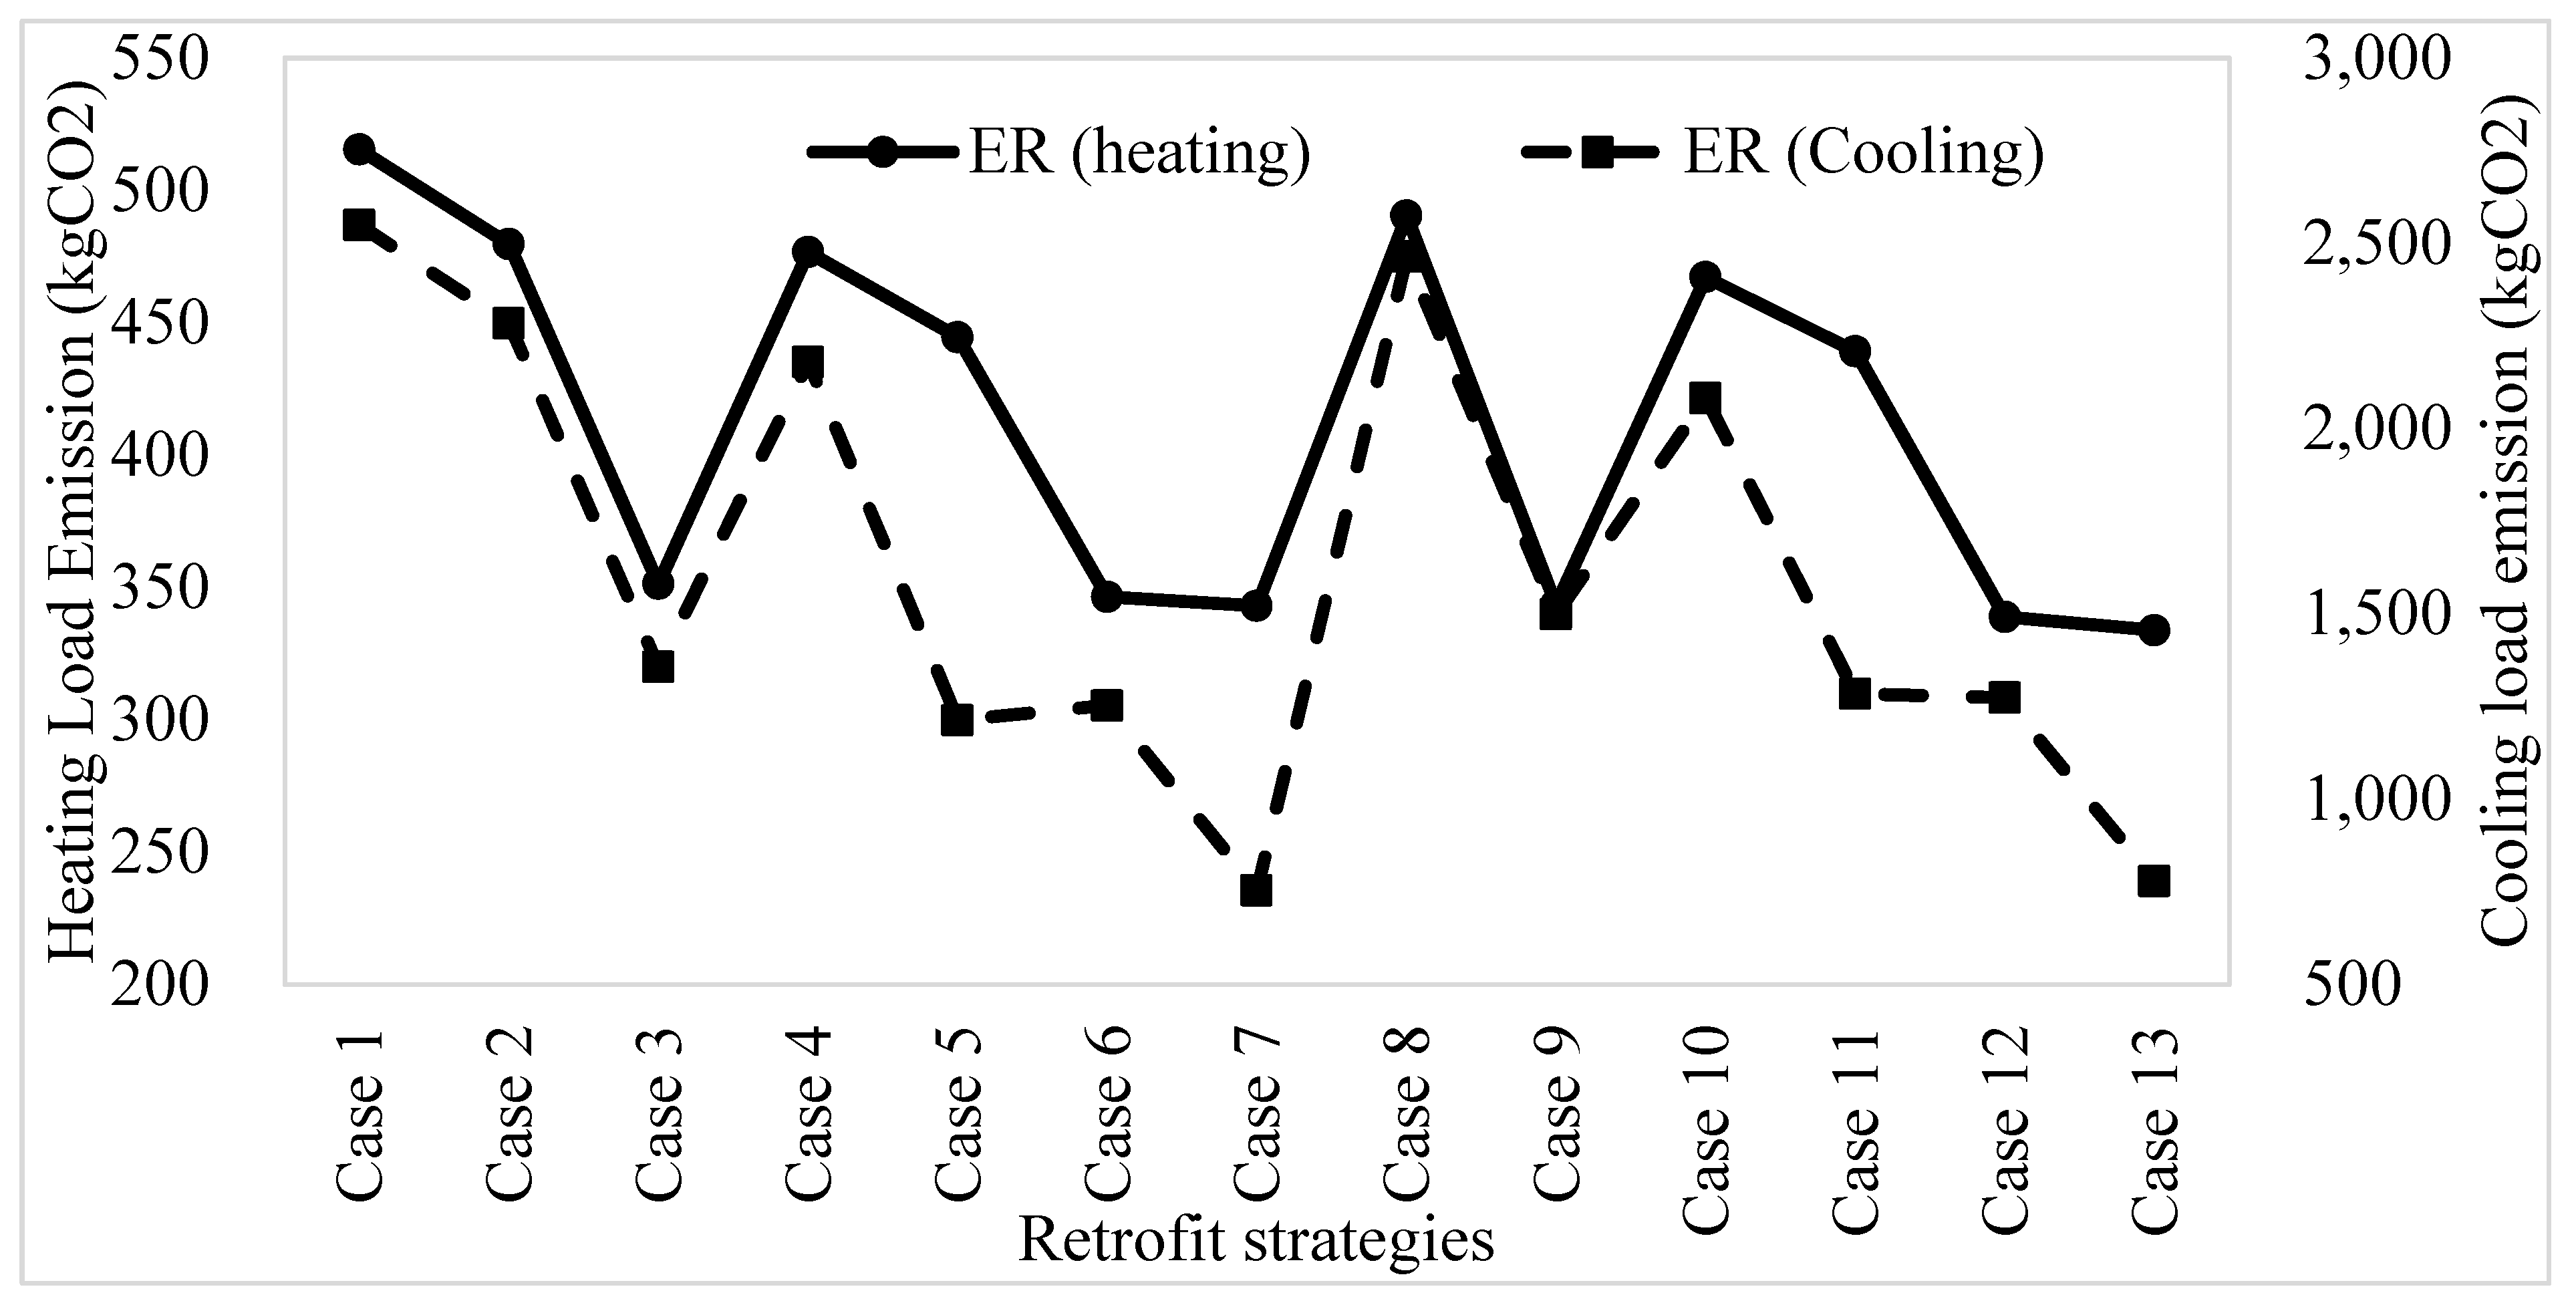
3.4. Performance of Retrofitting Strategies in Terms of Operational Emission
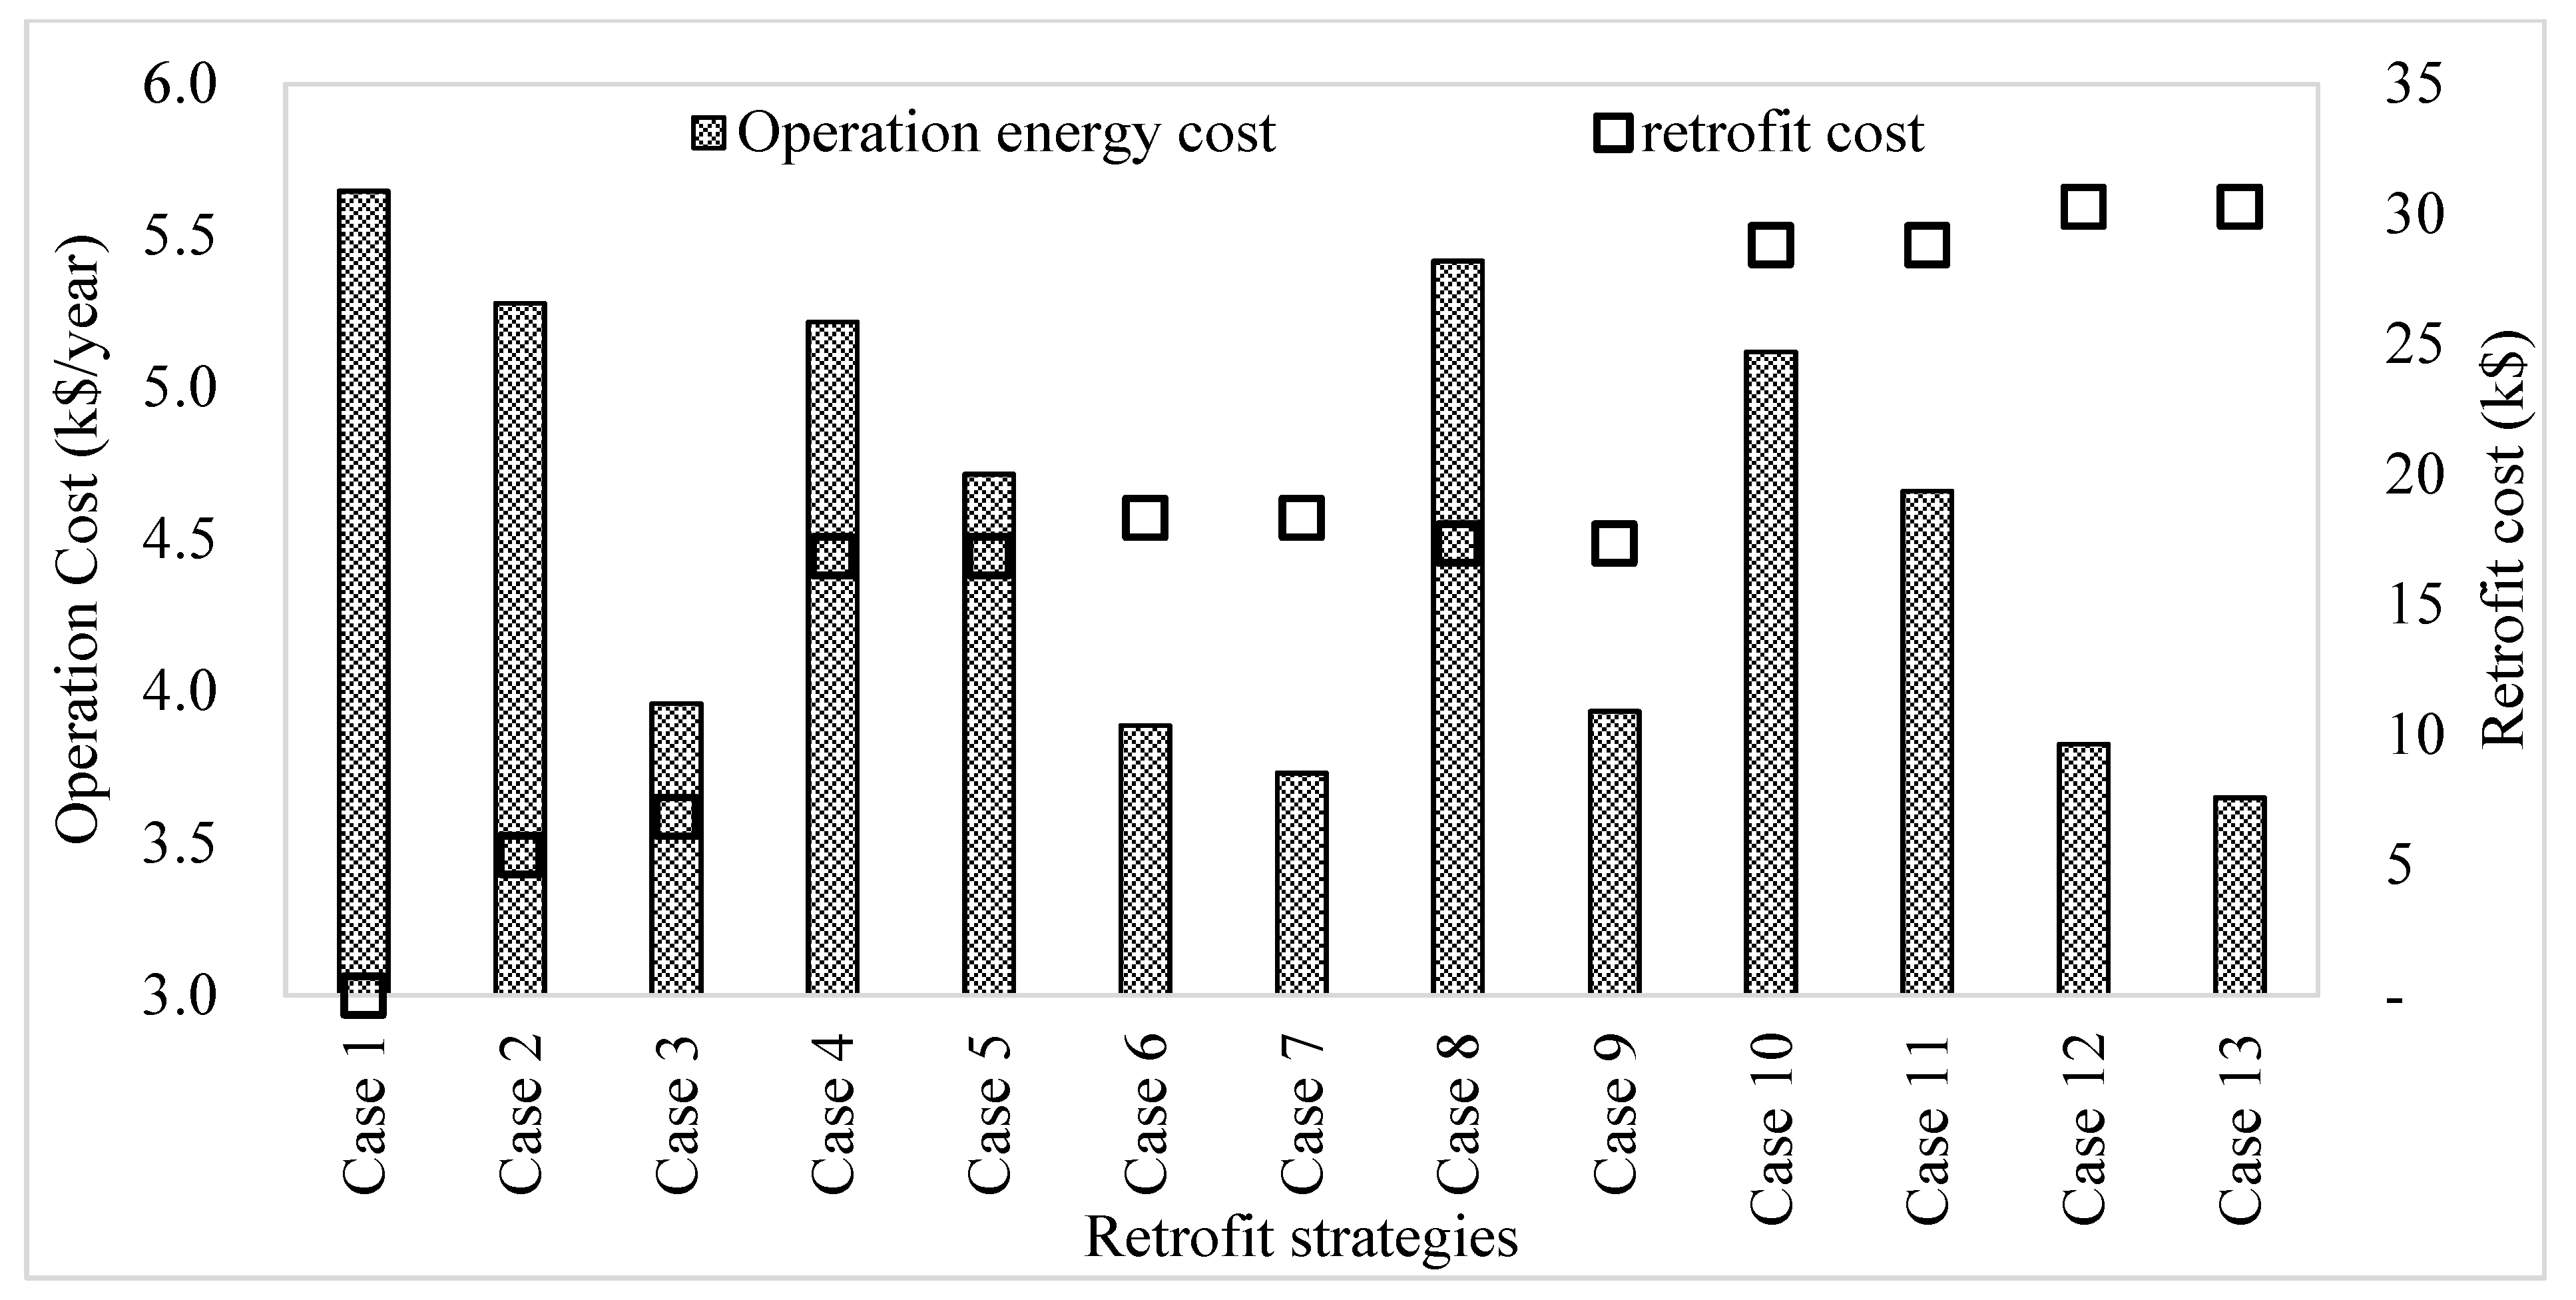
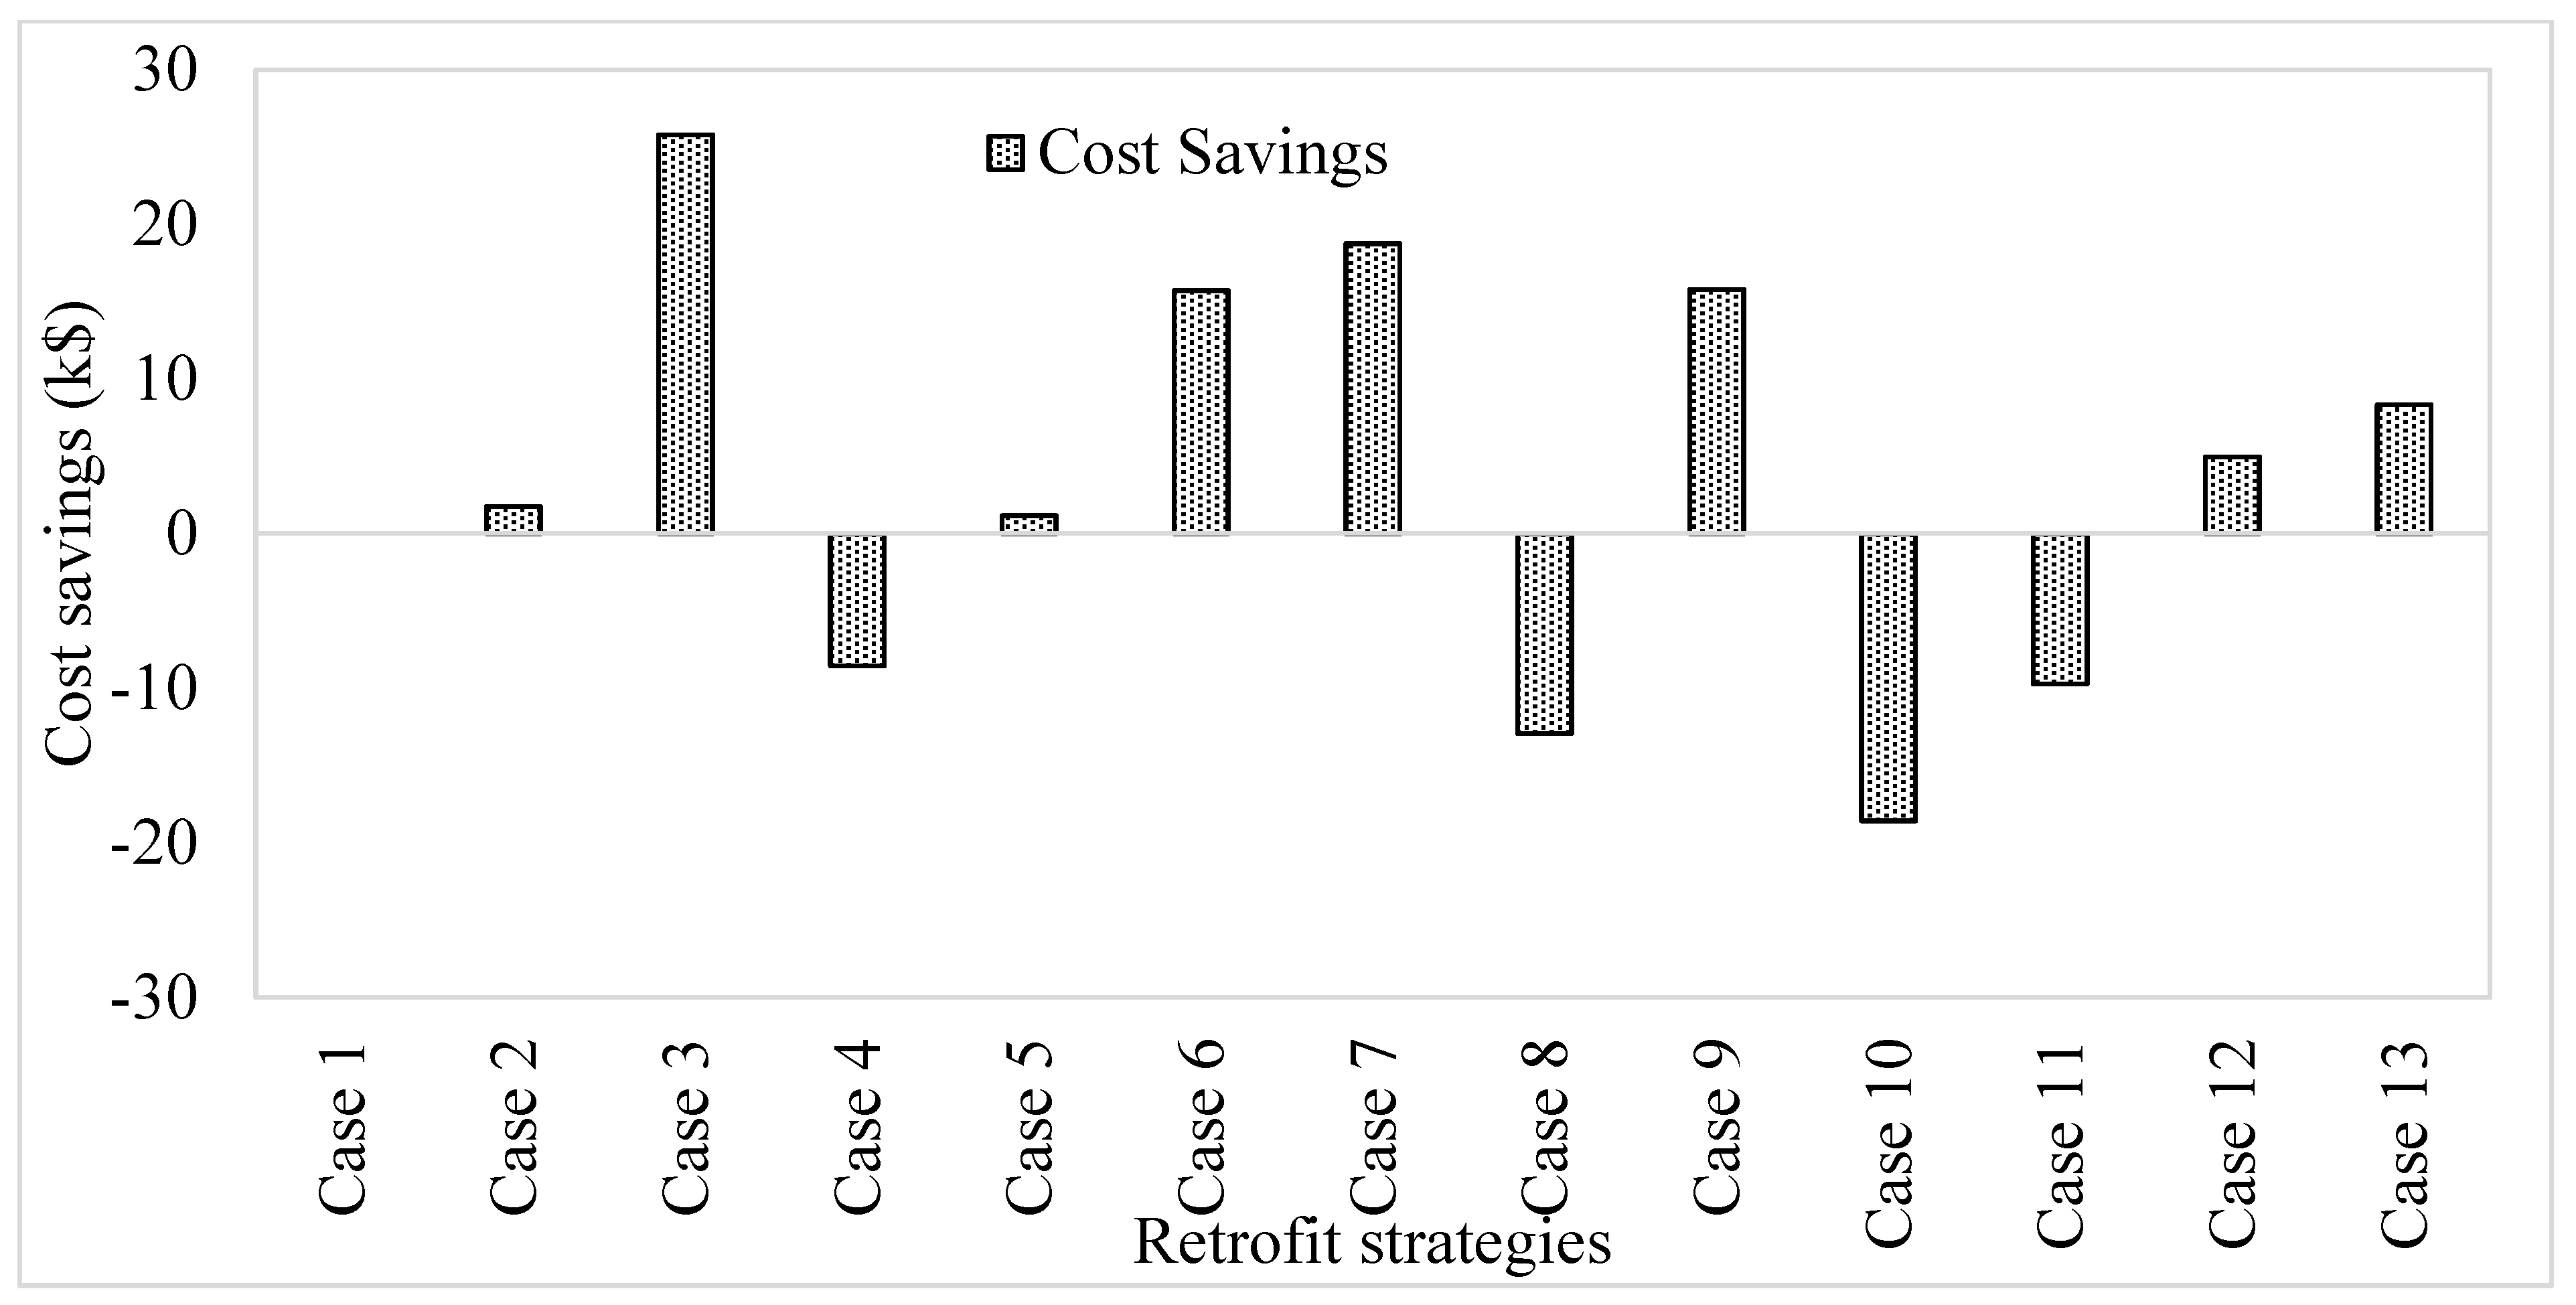
3.5. Performance of the Retrofitting Strategies in Terms of Cost
4. Discussion
4.1. Impact of Phase Change Temperature on Performance Indicators
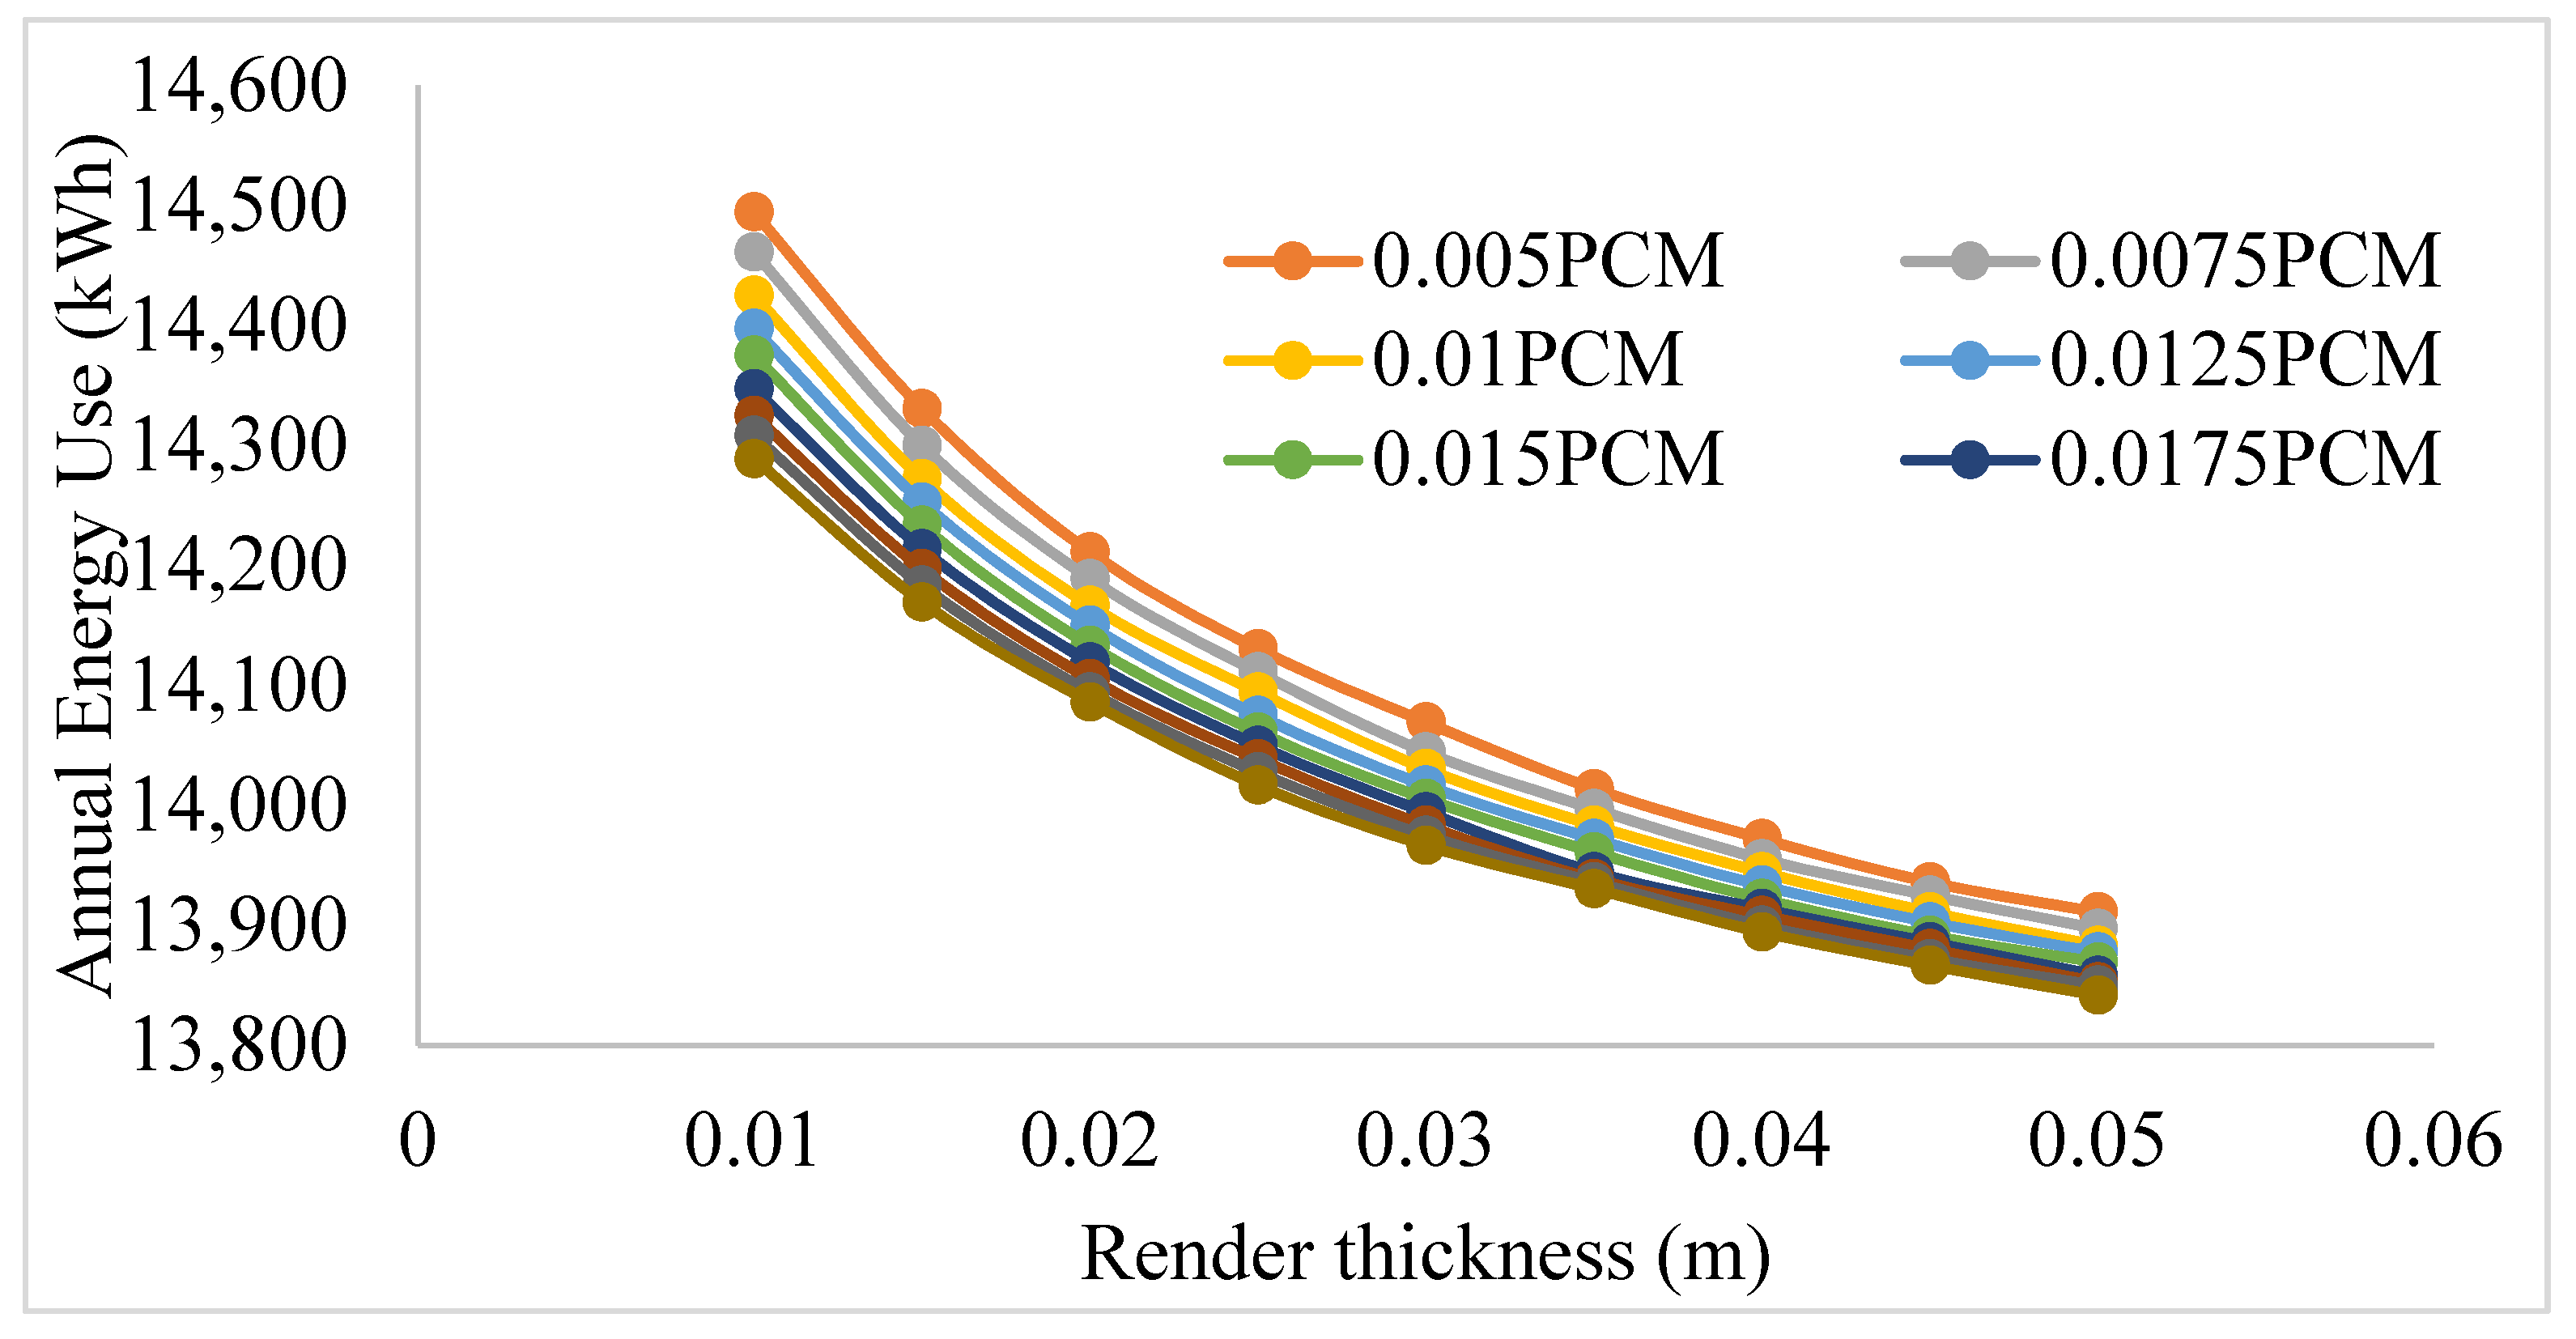
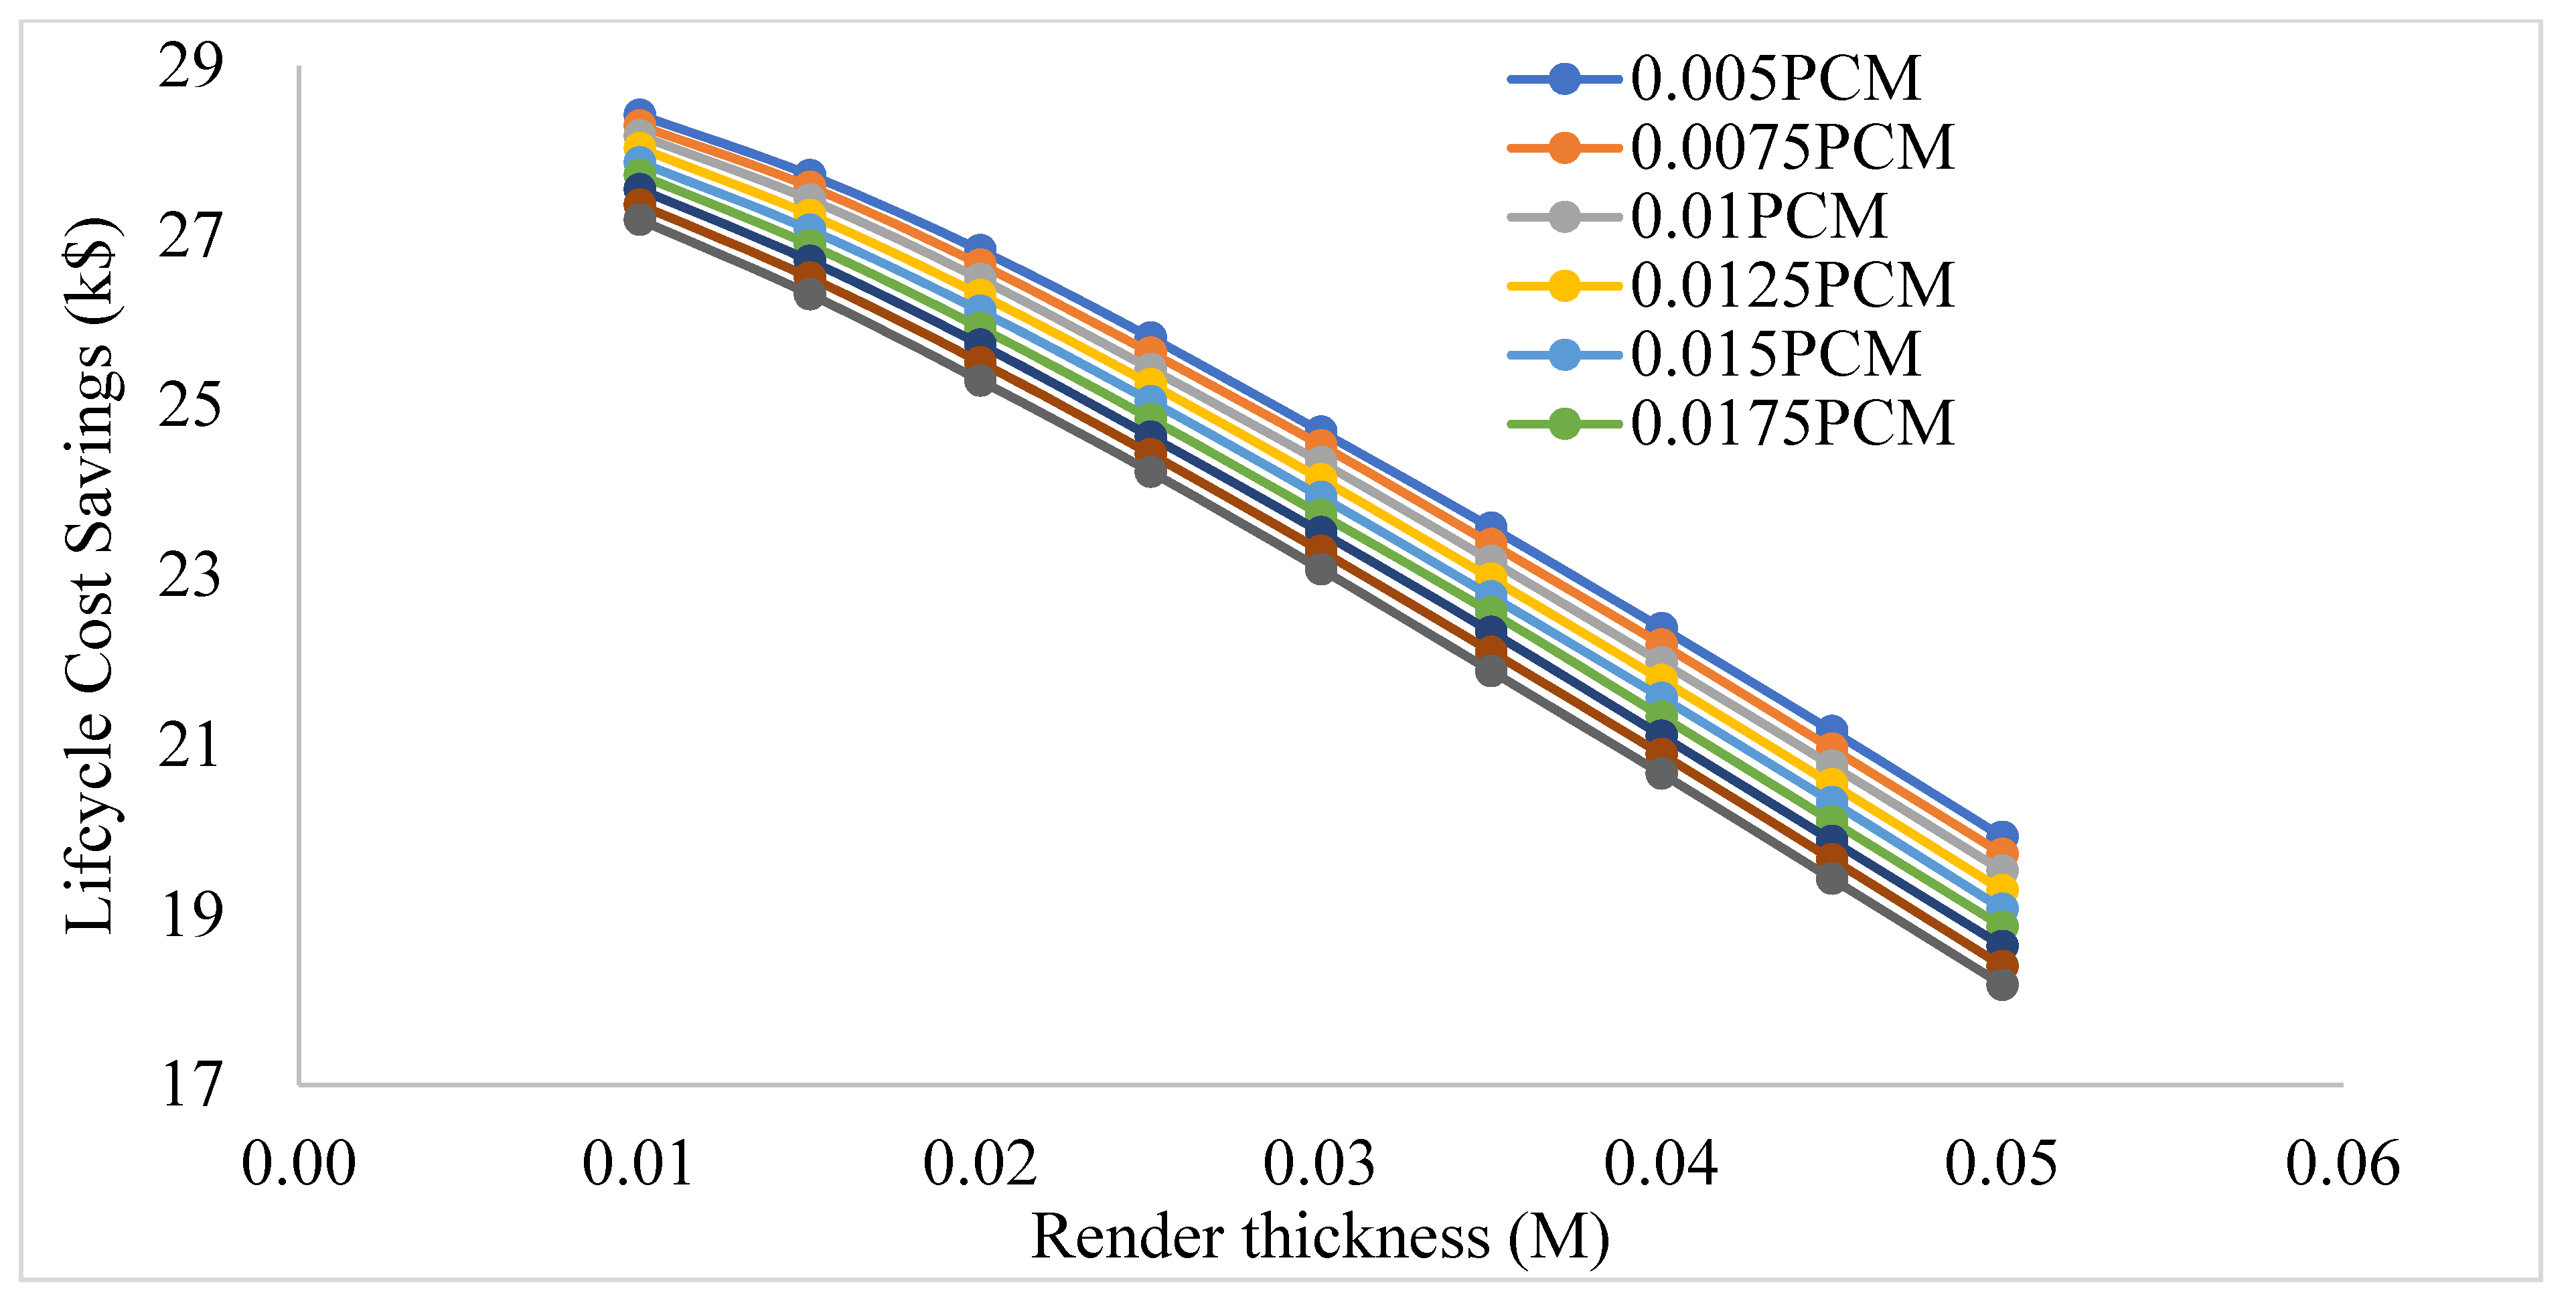
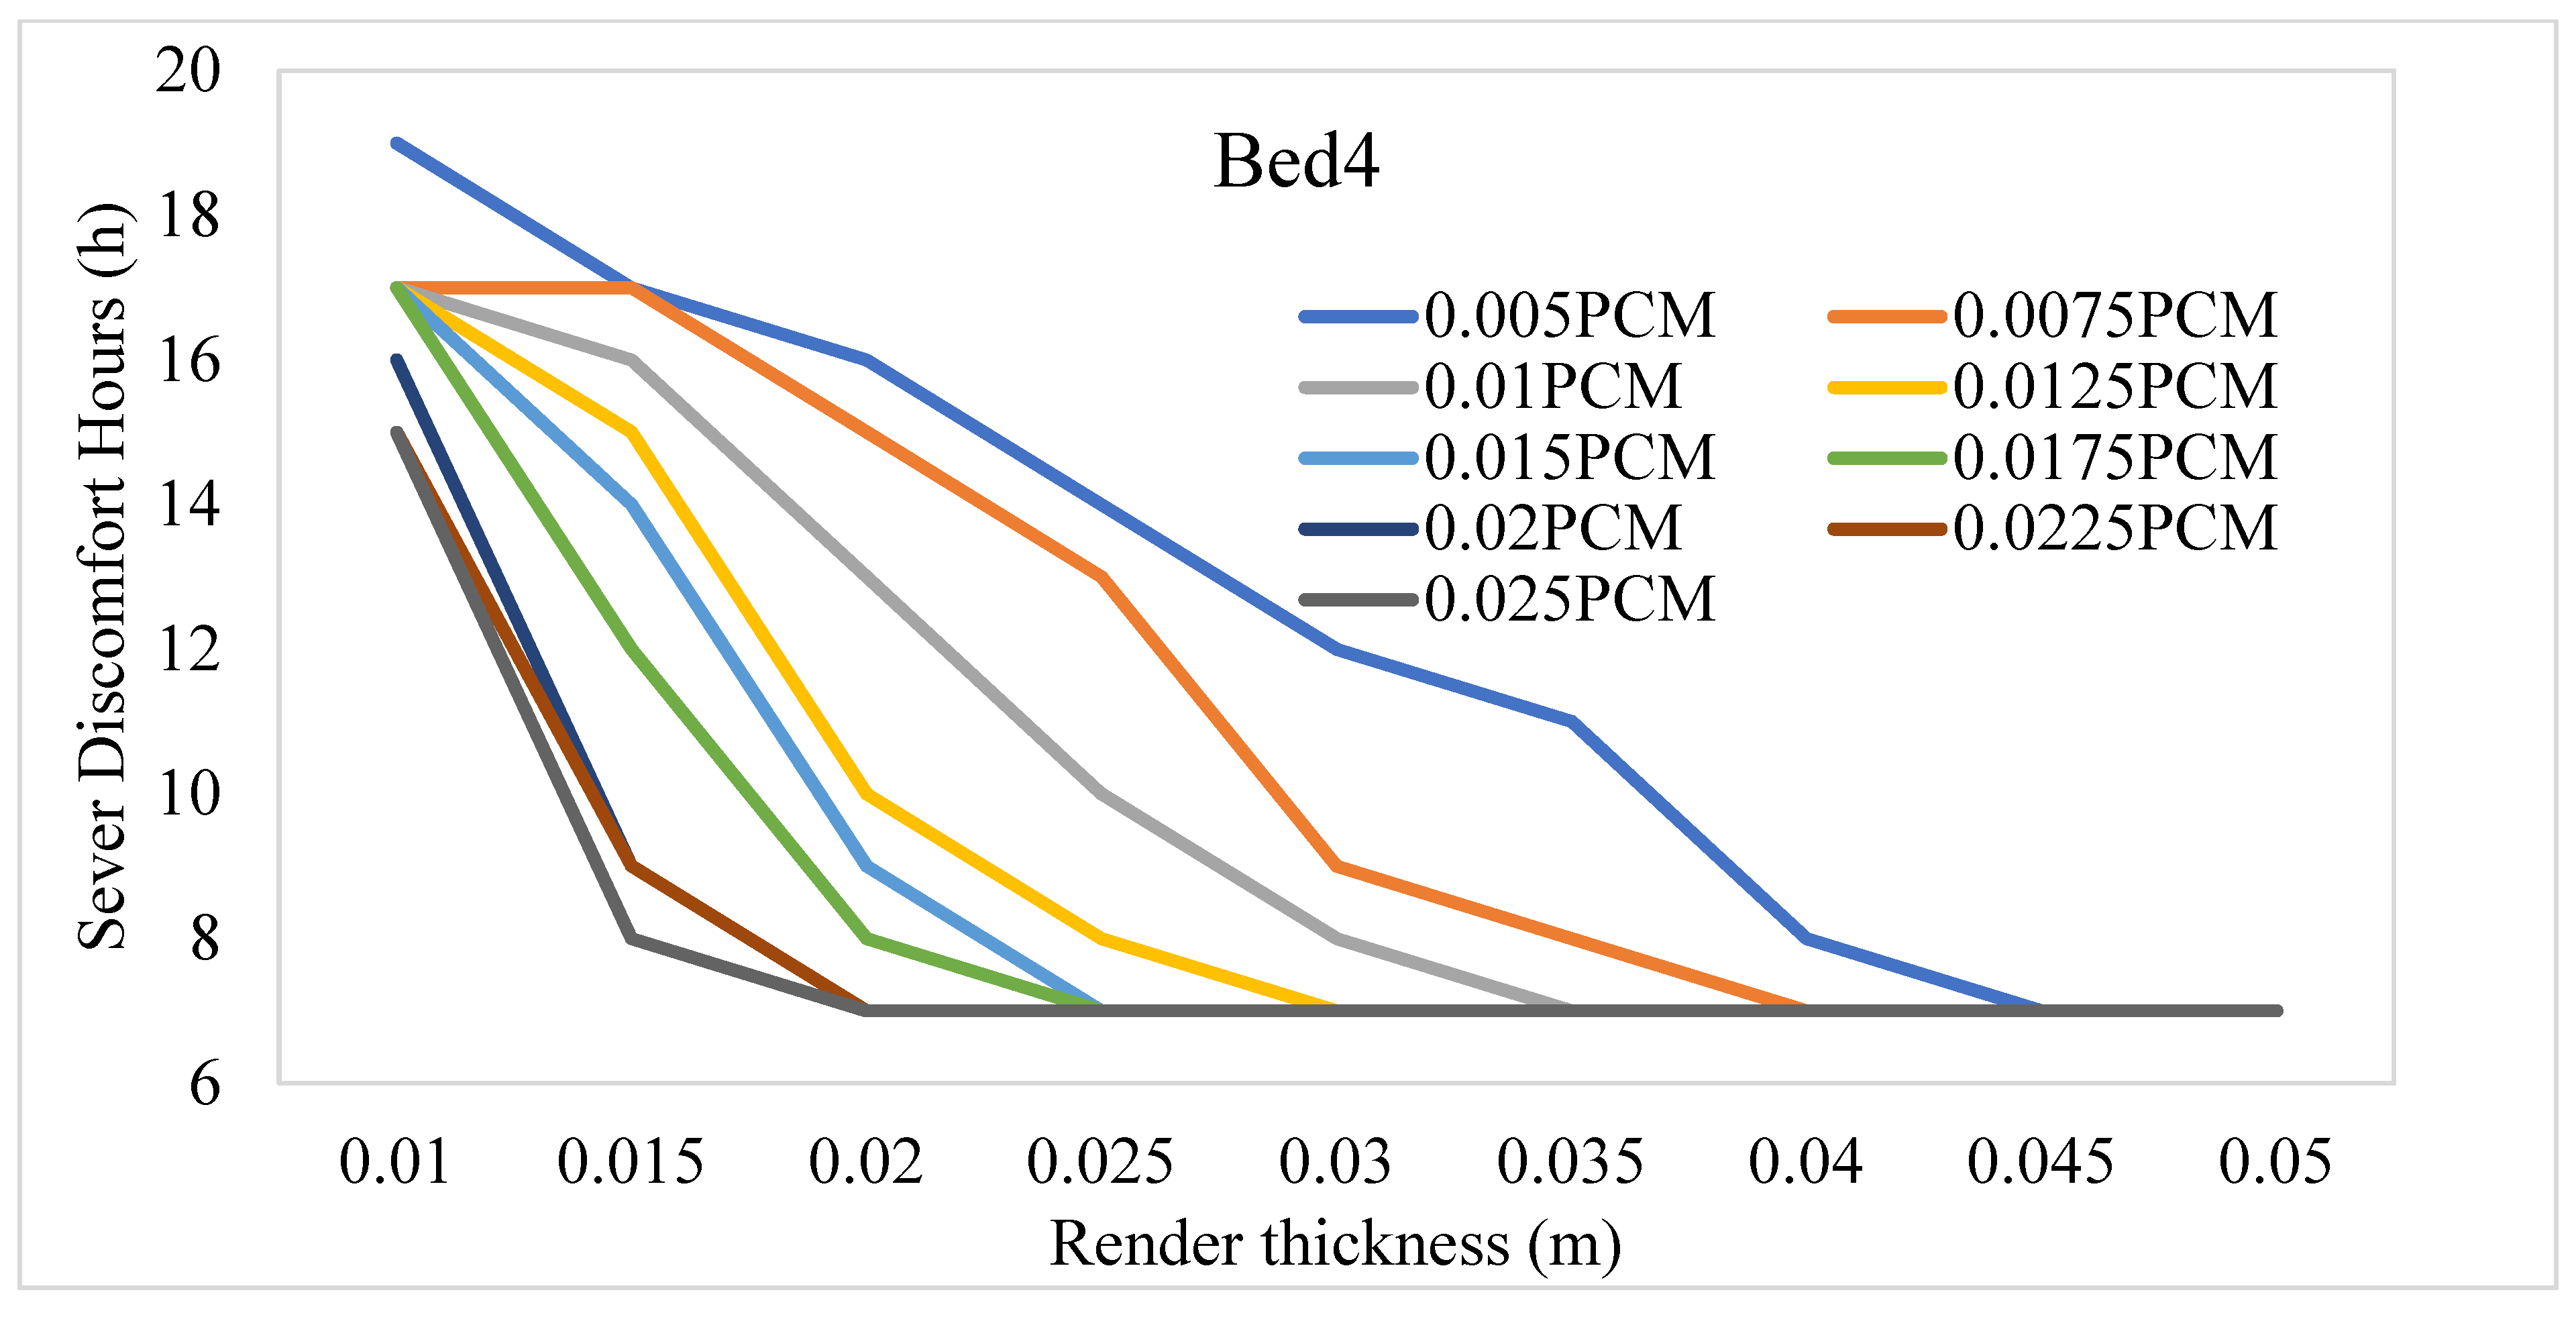
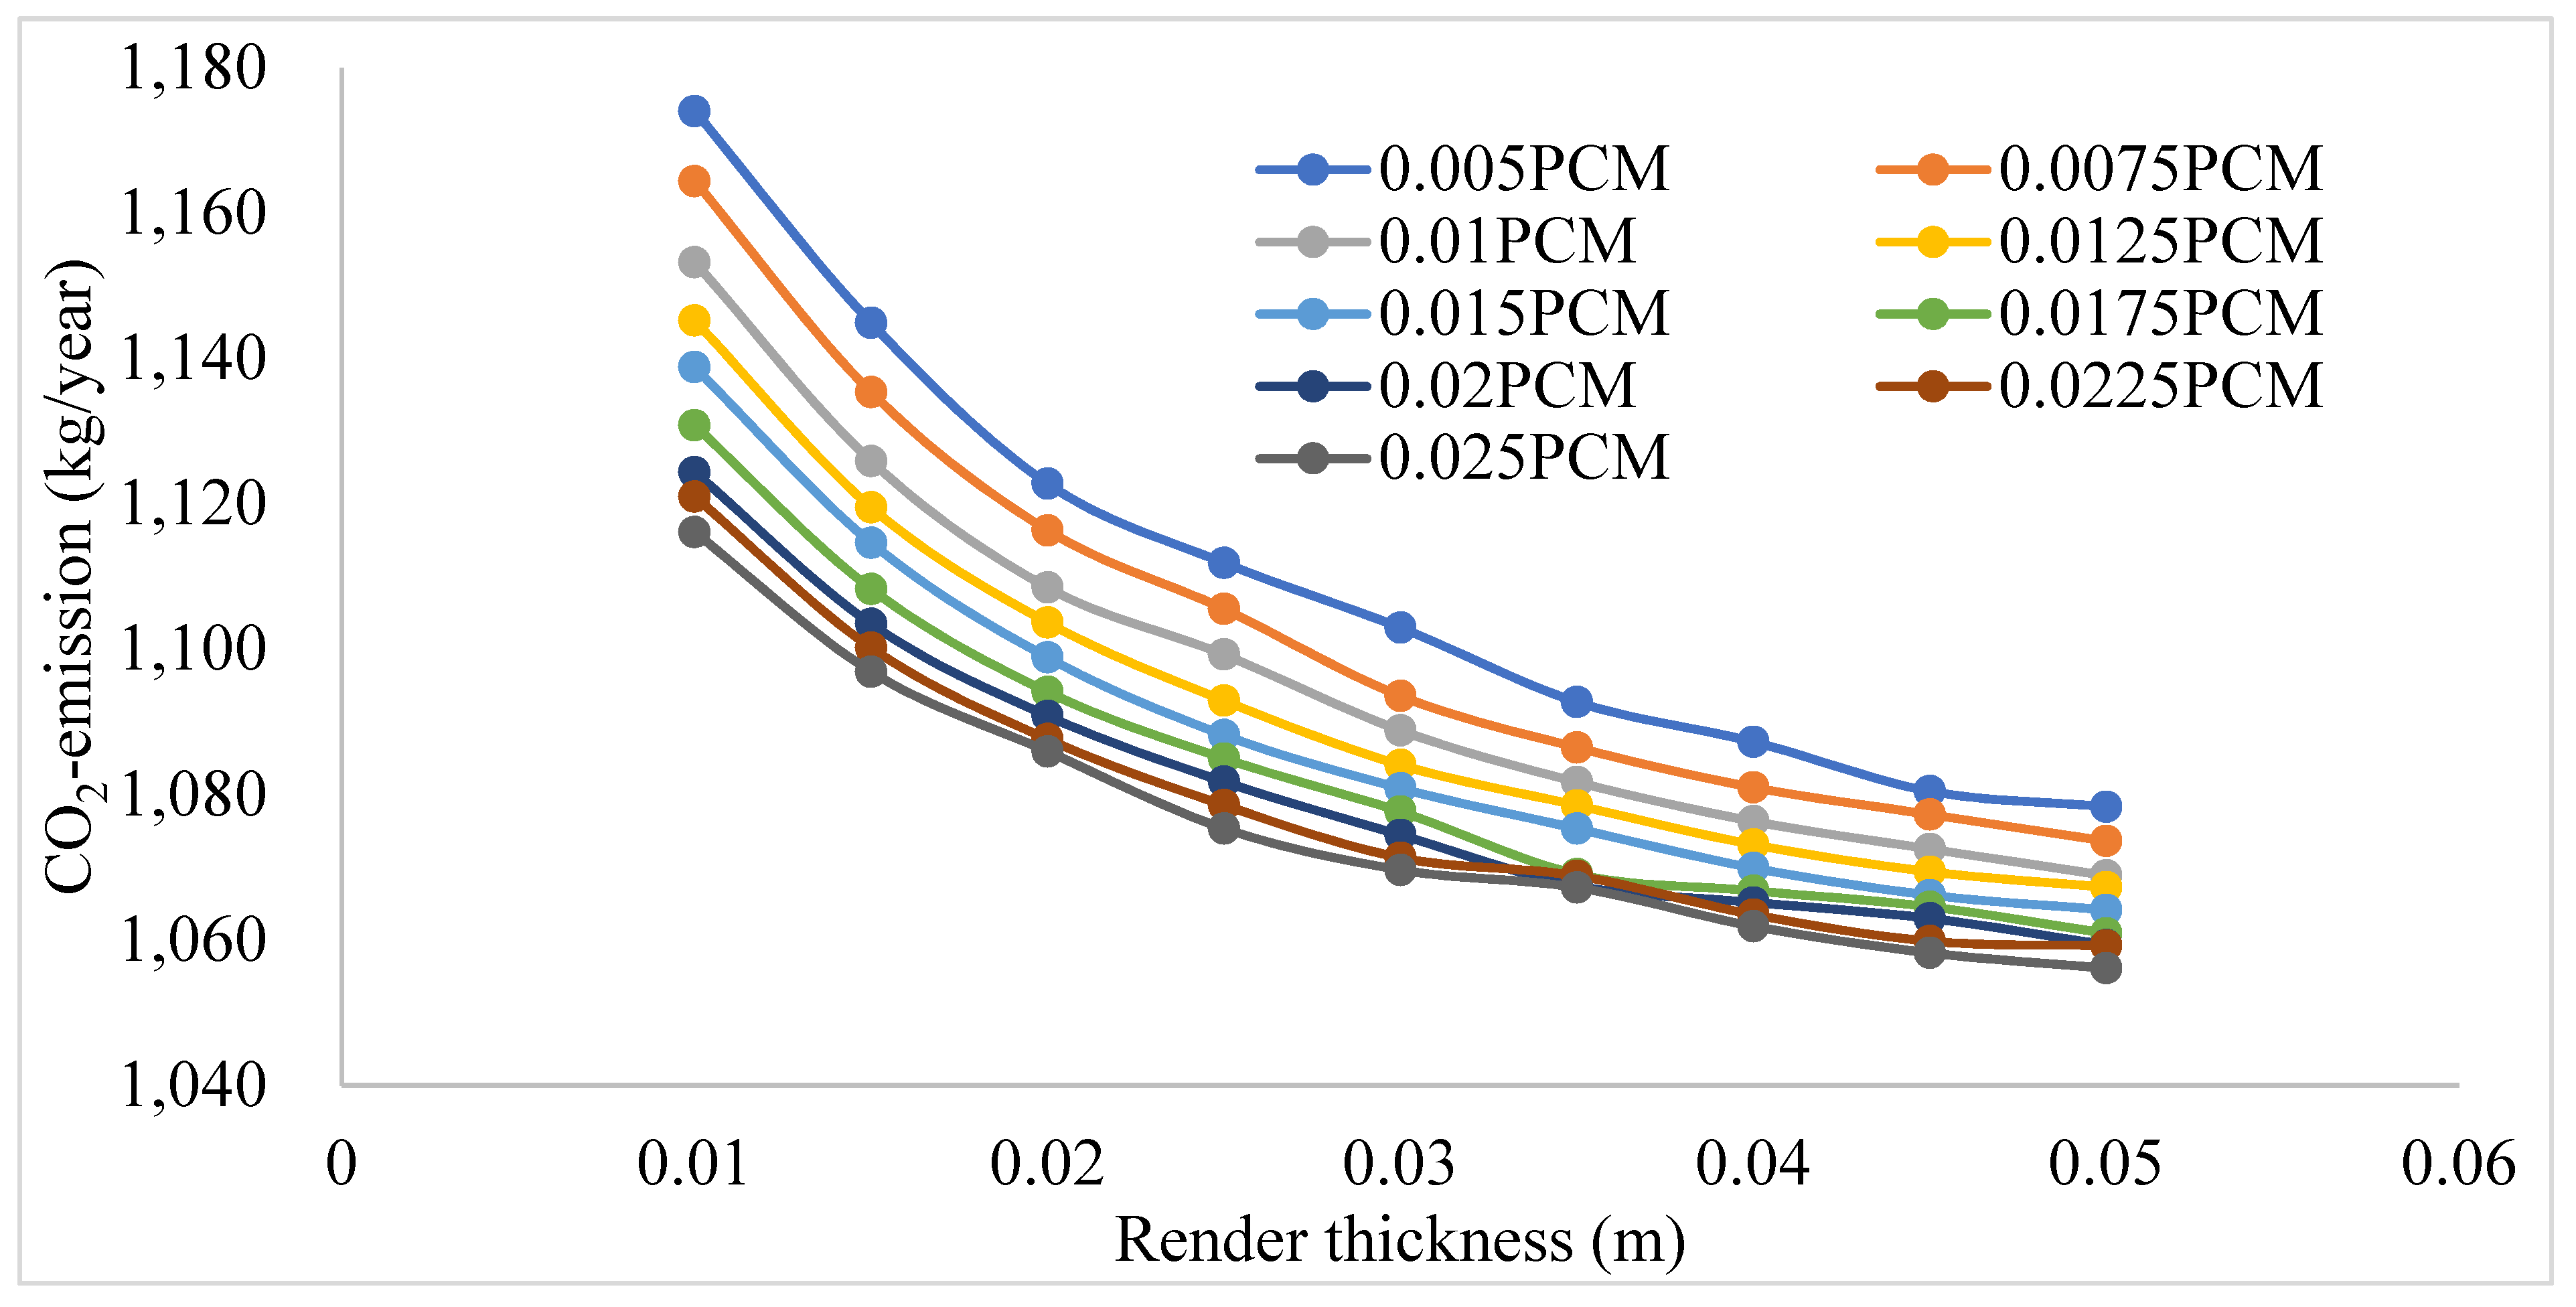
4.2. Impact of PCM and Aerogel Render Thickness on Performance Indicators
5. Conclusions
Author Contributions
Funding
Institutional Review Board Statement
Informed Consent Statement
Data Availability Statement
Acknowledgments
Conflicts of Interest
References
- Berardi, U. A cross-country comparison of the building energy consumptions and their trends. Resour. Conserv. Recycl. 2017, 123, 230–241. [Google Scholar] [CrossRef]
- Sovetova, M.; Memon, S.A.; Kim, J. Thermal performance and energy efficiency of building integrated with PCMs in hot desert climate region. Sol. Energy 2019, 189, 357–371. [Google Scholar] [CrossRef]
- Kumar, D.; Zou, P.X.W.; Memon, R.A.; Alam, M.M.; Sanjayan, J.G.; Kumar, S. Life Cycle Cost Analysis of Building wall and insulation materials. J. Build.Phys. 2020, 43, 428–455. [Google Scholar] [CrossRef]
- Ascione, F.; Bianco, N.; Mauro, G.M.; Napolitano, D.F. Building envelope design: Multi-objective optimization to minimize energy consumption, global cost and thermal discomfort. Application to different Italian climatic zones. Energy 2019, 174, 359–374. [Google Scholar] [CrossRef]
- Li, D.; Zhang, C.; Li, Q.; Liu, C.; Arıcı, M.; Wu, Y. Thermal performance evaluation of glass window combining silica aerogels and phase change materials for cold climate of China. Appl. Therm.Eng. 2020, 165. [Google Scholar] [CrossRef]
- Hoseinzadeh, S. Thermal Performance of Electrochromic Smart Window with Nanocomposite Structure Under Different Climates In Iran. Micro Nanosyst. 2019, 11, 154–164. [Google Scholar] [CrossRef]
- Kumar, D.; Alam, M.; Zou, P.X.W.; Sanjayan, J.G.; Memon, R.A. Comparative analysis of building insulation material properties and performance. Renew. Sustain. Energy Rev. 2020, 131, 110038. [Google Scholar] [CrossRef]
- Sustainablity Victoria Victorian Household Energy Reports, Sustainability Victoria, Melbourne. 2014. Available online: http://www.sustainability.vic.gov.au/services-and-advice/households/energy-efficiency/toolbox/reports (accessed on 14 October 2020).
- Victoria, S. Cavity Wall Insulation Retrofit Trial, Melbourne, Australia. 2016. Available online: https://www.sustainability.vic.gov.au/About-us/Research/Household-retrofit-trials (accessed on 14 October 2020).
- Cuce, E.; Cuce, P.M.; Wood, C.J.; Riffat, S.B. Optimizing insulation thickness and analysing environmental impacts of aerogel-based thermal superinsulation in buildings. Energy Build. 2014, 77, 28–39. [Google Scholar] [CrossRef]
- Berardi, U. Aerogel-enhanced systems for building energy retrofits: Insights from a case study. Energy Build. 2018, 159, 370–381. [Google Scholar] [CrossRef]
- Achard, P.; Rigacci, A.; Echantillac, T.; Bellet, A.; Aulagnier, M.; Daubresse, A. Insulating silica xerogel plaster. WIPO patent WO/083174, 14 July 2011. [Google Scholar]
- Ibrahim, M.; Biwole, P.H.; Achard, P.; Wurtz, E. Aerogel-Based Materials for Improving the Building Envelope’s Thermal Behavior: A Brief Review with a Focus on a New Aerogel-Based Rendering. In Energy Sustainability Through (Green Energy); Springer: New Delhi, India, 2015; pp. 163–188. [Google Scholar]
- Fantucci, S.; Fenoglio, E.; Grosso, G.; Serra, V.; Perino, M.; Marino, V.; Dutto, M. Development of an aerogel-based thermal coating for the energy retrofit and the prevention of condensation risk in existing buildings. Sci. Technol. Built Environ. 2019, 25, 1178–1186. [Google Scholar] [CrossRef] [Green Version]
- Pedroso, M.; Flores-Colen, I.; Silvestre, J.D.; Gomes, M.G.; Silva, L.; Ilharco, L. Physical, mechanical, and microstructural characterisation of an innovative thermal insulating render incorporating silica aerogel. Energy Build. 2020, 109793. [Google Scholar] [CrossRef]
- Ibrahimb, M.; Nocentinic, K.; Stipeticd, M.; Dantzd, S.; Caiazzoe, F.G.; Sayegha, H.; Bianco, L. Multi-field and multi-scale characterization of novel super insulating panels/systems based on silica aerogels: Thermal, hydric, mechanical, acoustic, and fire performance. Build. Environ. 2019, 151, 30–42. [Google Scholar] [CrossRef]
- Nosrati, R.H.; Berardi, U. Hygrothermal characteristics of aerogel-enhanced insulating materials under different humidity and temperature conditions. Energy Build. 2018, 158, 698–711. [Google Scholar] [CrossRef]
- Al-Yasiri, Q.; Szabó, M. Incorporation of phase change materials into building envelope for thermal comfort and energy saving: A comprehensive analysis. J. Build. Eng. 2021, 36, 102122. [Google Scholar] [CrossRef]
- Berardi, U.; Gallardo, A.A. Properties of concretes enhanced with phase change materials for building applications. Energy Build. 2019, 199, 402–414. [Google Scholar] [CrossRef]
- Sukontasukkula, P.; Sangpetb, T.; Newlands, M.; Yood, D.-Y.; Tangchirapate, W.; Limkatanyuf, S.; Chindaprasirt, P. Thermal storage properties of lightweight concrete incorporating phase change materials with different fusion points in hybrid form for high temperature applications. Heliyon 2020, 6, e04863. [Google Scholar] [CrossRef]
- Rao, V.V.; Parameshwaran, R.; Ram, V.V. PCM-mortar based construction materials for energy efficient buildings: A review on research trends. Energy Build. 2018, 158, 95–122. [Google Scholar] [CrossRef]
- Cunha, S.; Aguiar, J.B.; Ferreira, V.; Tadeu, A. Influence of Adding Encapsulated Phase Change Materials in Aerial Lime Based Mortars. Adv. Mater. Res. 2013, 687, 255–261. [Google Scholar] [CrossRef]
- Michel, B.; Glouannec, P.; Fuentes, A.; Chauvelon, P. Experimental and numerical study of insulation walls containing a composite layer of PU-PCM and dedicated to refrigerated vehicle. Appl. Therm. Eng. 2017, 116, 382–391. [Google Scholar] [CrossRef] [Green Version]
- Wieprzkowicz, A.; Heim, D. The characteristics of temperature fluctuations in thermal insulation covered with layer of PCM. In IOP Conference Series: Materials Science and Engineering; Institute of Physics: Krakow, Poland, 2018; Volume 415, p. 012017. [Google Scholar] [CrossRef]
- Bakri, M.M.A.; Jamaludin, A.L.; Abdullah, A.; Razak, R.A.; Hussin, K. Study on Properties and Morphology of Kaolin Based Geopolymer Coating on Clay Substrates; Trans Tech Publications Ltd.: Kapellweg, Switzerland, 2014. [Google Scholar]
- Jamil, H.; Alam, M.; Sanjayan, J.; Wilson, J. Investigation of PCM as retrofitting option to enhance occupant thermal comfort in a modern residential building. Energy Build. 2016, 133, 217–229. [Google Scholar] [CrossRef]
- Ramakrishnan, S.; Sanjayan, J.; Wang, X. Experimental Research on Using Form-stable PCM-Integrated Cementitious Composite for Reducing Overheating in Buildings. Buildings 2019, 9, 57. [Google Scholar] [CrossRef] [Green Version]
- Cui, H.; Memon, S.A.; Liu, R. Development, mechanical properties and numerical simulation of macro encapsulated thermal energy storage concrete. Energy Build. 2015, 96, 162–174. [Google Scholar] [CrossRef]
- Kośny, J.; Fallahi, A.; Shukla, N.; Kossecka, E.; Ahbari, R. Thermal load mitigation and passive cooling in residential attics containing PCM-enhanced insulations. Sol. Energy 2014, 108, 164–177. [Google Scholar] [CrossRef]
- Rathore, P.K.S.; Shukla, S.K. An experimental evaluation of thermal behavior of the building envelope using macroencapsulated PCM for energy savings. Renew. Energy 2019, 149, 1300–1313. [Google Scholar] [CrossRef]
- Mahmoudan, A.; Samadof, P.; Hosseinzadeh, S.; Garcia, D.A. A multigeneration cascade system using ground-source energy with cold recovery: 3E analyses and multi-objective optimization. Energy 2021, 233, 121185. [Google Scholar] [CrossRef]
- Hoseinzadeh, S.; Ghasemi, M.H.; Heyns, S. Application of hybrid systems in solution of low power generation at hot seasons for micro hydro systems. Renew. Energy 2020, 160, 323–332. [Google Scholar] [CrossRef]
- Gilani, H.A.; Hoseinzadeh, S.; Karimi, H.; Karimi, A.; Hassanzadeh, A.; Garcia, D.A. Performance analysis of integrated solar heat pump VRF system for the low energy building in Mediterranean island. Renew. Energy 2021, 174, 1006–1019. [Google Scholar] [CrossRef]
- Economics, C.f.I. Proposal to Revise Energy Efficiency Requirements of the Building Code of Australia for Residential Buildings, Australian Building Codes Board, Canberra. 2009. Available online: https://www.abcb.gov.au/-/media/Files/Resources/Consultation/RIS-Energy-Efficiency-Residential-Building-Final-Decision-BCA-2010.pdf (accessed on 14 April 2021).
- ABS Census of Population and Housing. 2016. Available online: https://quickstats.censusdata.abs.gov.au/census_services/getproduct/census/2016/quickstat/036 (accessed on 14 April 2021).
- Stahl, T.; Brunner, S.; Zimmermann, M. Thermally Insulating Aerogel Based Rendering Materials. Patent WO 2014/090790 Al, 05 November 2014. [Google Scholar]
- Ibrahim, M.; Biwole, P.H.; Achard, P.; Wurtz, E.; Ansart, G. Building envelope with a new aerogel-based insulating rendering: Experimental and numerical study, cost analysis, and thickness optimization. Appl. Energy 2015, 159, 490–501. [Google Scholar] [CrossRef]
- Ramakrishnan, S.; Wang, X.; Sanjayan, J.; Wilson, J. Thermal performance of buildings integrated with phase change materials to reduce heat stress risks during extreme heatwave events. Appl. Energy 2017, 194, 410–421. [Google Scholar] [CrossRef]
- Muruganatham, K. Application of Phase Change Materials in Buildings: Field Data vs EnergyPlus Simulation. Master’s Thesis, Science Arizona State University, Tempe, AZ, USA, 2010. [Google Scholar]
- Harkouss, F.; Fardoun, F.; Biwole, P.H. Passive design optimization of low energy buildings in different climates. Energy 2018, 165, 591–613. [Google Scholar] [CrossRef]
- Alam, M.; Rajeev, P.; Sanjayan, J.; Zou, P.X.W.; Wilson, J. Mitigation of heat stress risks through building energy efficiency upgrade: A case study of Melbourne, Australia. Aust. J. Civ. Eng. 2018, 16, 64–78. [Google Scholar] [CrossRef]
- Tabares-Velasco, P.C.; Christensen, C.; Bianchi, M. Verification and validation of EnergyPlus phase change material model for opaque wall assemblies. Build. Environ. 2012, 54, 186–196. [Google Scholar] [CrossRef]
- ABCB. Protocol for House Energy Rating Software; Australian Building Codes Board: Canberra, Australia, 2006.
- I. ASHRAE. ASHRAE Handbook: Fundamentals; American Society of Heating, Refrigeration and Air-Conditioning Engineers: Atlanta, GA, USA, 2009. [Google Scholar]
- Alam, M.; Jamil, H.; Sanjayan, J.; Wilson, J. Energy saving potential of phase change materials in major Australian cities. Energy Build. 2014, 78, 192–201. [Google Scholar] [CrossRef]
- Moore, T.; Morrissey, J. Lifecycle costing sensitivities for zero energy housing in Melbourne, Australia. Energy Build. 2014, 79, 1–11. [Google Scholar] [CrossRef]
- Ramakrishnan, S.; Wang, X.; Alam, M.; Sanjayan, J.; Wilson, J. Parametric analysis for performance enhancement of phase change materials in naturally ventilated buildings. Energy Build. 2016, 124, 35–45. [Google Scholar] [CrossRef]
- Current Residential Electricity & Gas Tariffs. 2020. Available online: https://www.originenergy.com.au/content/dam/origin/residential/docs/new-connections/multi-site-pricing-booklet.pdf (accessed on 14 October 2020).
- National Greenhouse Accounts Factors: Australian National Greenhouse Accounts; Department of Climate Change: Canberra, Australia, 2018.
- Islam, H.; Jollands, M.; Setunge, S.; Ahmed, I.; Haque, N. Life cycle assessment and life cycle cost implications of wall assemblages designs. Energy Build. 2014, 84, 33–45. [Google Scholar] [CrossRef]
- Morrissey, J.; Horne, R.E. Life cycle cost implications of energy efficiency measures in new residential buildings. Energy Build. 2011, 43, 915–924. [Google Scholar] [CrossRef]
- Kumar, D.; Ali, I.; Hakeem, M.; Junejo, A.; Harijan, K. LCC Optimization of Different Insulation Materials and Energy Sources Used in HVAC Duct Applications. Arab. J. Sci. Eng. 2019, 44, 5679–5696. [Google Scholar] [CrossRef]
- OBPR. Cost-Benefit-Analysis; Office of the Best Practice Office Regulation, Department of Prime Minister and Cabinet: Canberra, Australia, 2016.
- Solgi, E.; Hamedani, Z.; Fernando, R.; Kari, B.M. A parametric study of phase change material characteristics when coupled with thermal insulation for different Australian climatic zones. Build. Environ. 2019, 163, 106317. [Google Scholar] [CrossRef]
- Medina, M.A.; King, J.B.; Zhang, M. On the heat transfer rate reduction of structural insulated panels (SIPs) outfitted with phase change materials (PCMs). Energy 2008, 33, 667–678. [Google Scholar] [CrossRef]
- Alam, M.; Sanjayan, J.; Zou, P.X.W.; Stewart, M.G.; Wilson, J. Modelling the correlation between building energy ratings and heat-related mortality and morbidity. Sustain. Cities Soc. 2016, 22, 29–39. [Google Scholar] [CrossRef]
- Epstein, Y.; Moran, D.S. Thermal comfort and the heat stress indices. Indusrial Health 2006, 44, 388–398. [Google Scholar] [CrossRef] [Green Version]
- U.S Department of Energy. Application Guide for EMS-EnergyPlus™ Version 9.2.0 Documentation; U.S Department of Energy: Washington, DC, USA, 2019; p. 21.
- Australian Bureau of Statistics. Environmental Issues: Energy Use and Conservation. 2014. Available online: https://www.abs.gov.au/AUSSTATS/abs@.nsf/Lookup/4602.0.55.001Main+Features1Mar%202014?OpenDocument (accessed on 7 September 2021).
- Najjar, M.K.; Figueiredo, K.; Hammad, A.W.A.; Tam, V.W.Y.; Evangelista, A.C.J.; Haddad, A. A framework to estimate heat energy loss in building operation. J. Clean.Prod. 2019, 235, 789–800. [Google Scholar] [CrossRef]
- Földváry, V.; Bekö, G.; Langer, S.; Arrhenius, K.; Petráš, D. Effect of energy renovation on indoor air quality in multifamily residential buildings in Slovakia. Build.Environ. 2017, 122, 363–372. [Google Scholar] [CrossRef] [Green Version]
- Tettey, U.Y.A.; Gustavsson, L. Energy savings and overheating risk of deep energy renovation of a multi-storey residential building in a cold climate under climate change. Energy 2020, 202, 117578. [Google Scholar] [CrossRef]
- Alam, M.; Zou, P.X.W.; Stewart, R.A.; Bertone, E.; Sahin, O.; Buntine, C.; Marshall, C. Government championed strategies to overcome the barriers to public building energy efficiency retrofit projects. Sustain. Cities Soc. 2019, 44, 56–69. [Google Scholar] [CrossRef]
- Moreles, E.; Huelsz, G.; Barrios, G. Hysteresis effects on the thermal performance of building envelope PCM-walls. Build. Simul. 2018, 11, 519–531. [Google Scholar] [CrossRef]
- Zastawna-Rumin, A.; Kisilewicz, T.; Berardi, U. Novel Simulation Algorithm for Modeling the Hysteresis of Phase Change Materials. Energies 2020, 13, 1200. [Google Scholar] [CrossRef] [Green Version]


| Building Materials | Thermo-Physical Properties | |||
|---|---|---|---|---|
| Thickness (m) | Conductivity (W/m K) | Density (kg/m3) | Specific Heat (J/kg K) | |
| Concrete | 0.100 | 1.42 | 2400 | 880 |
| Brick veneer | 0.110 | 0.61 | 1690 | 878 |
| Roof insulation | 0.044 | 0.044 | 12 | 883 |
| Roof tiles | 0.02 | 1.42 | 2400 | 880 |
| plasterboard | 0.013 | 0.17 | 847 | 1090 |
| Carpet | 0.02 | 0.0465 | 104 | 1420 |
| Timber doors | 0.05 | 0.16 | 1122 | 1260 |
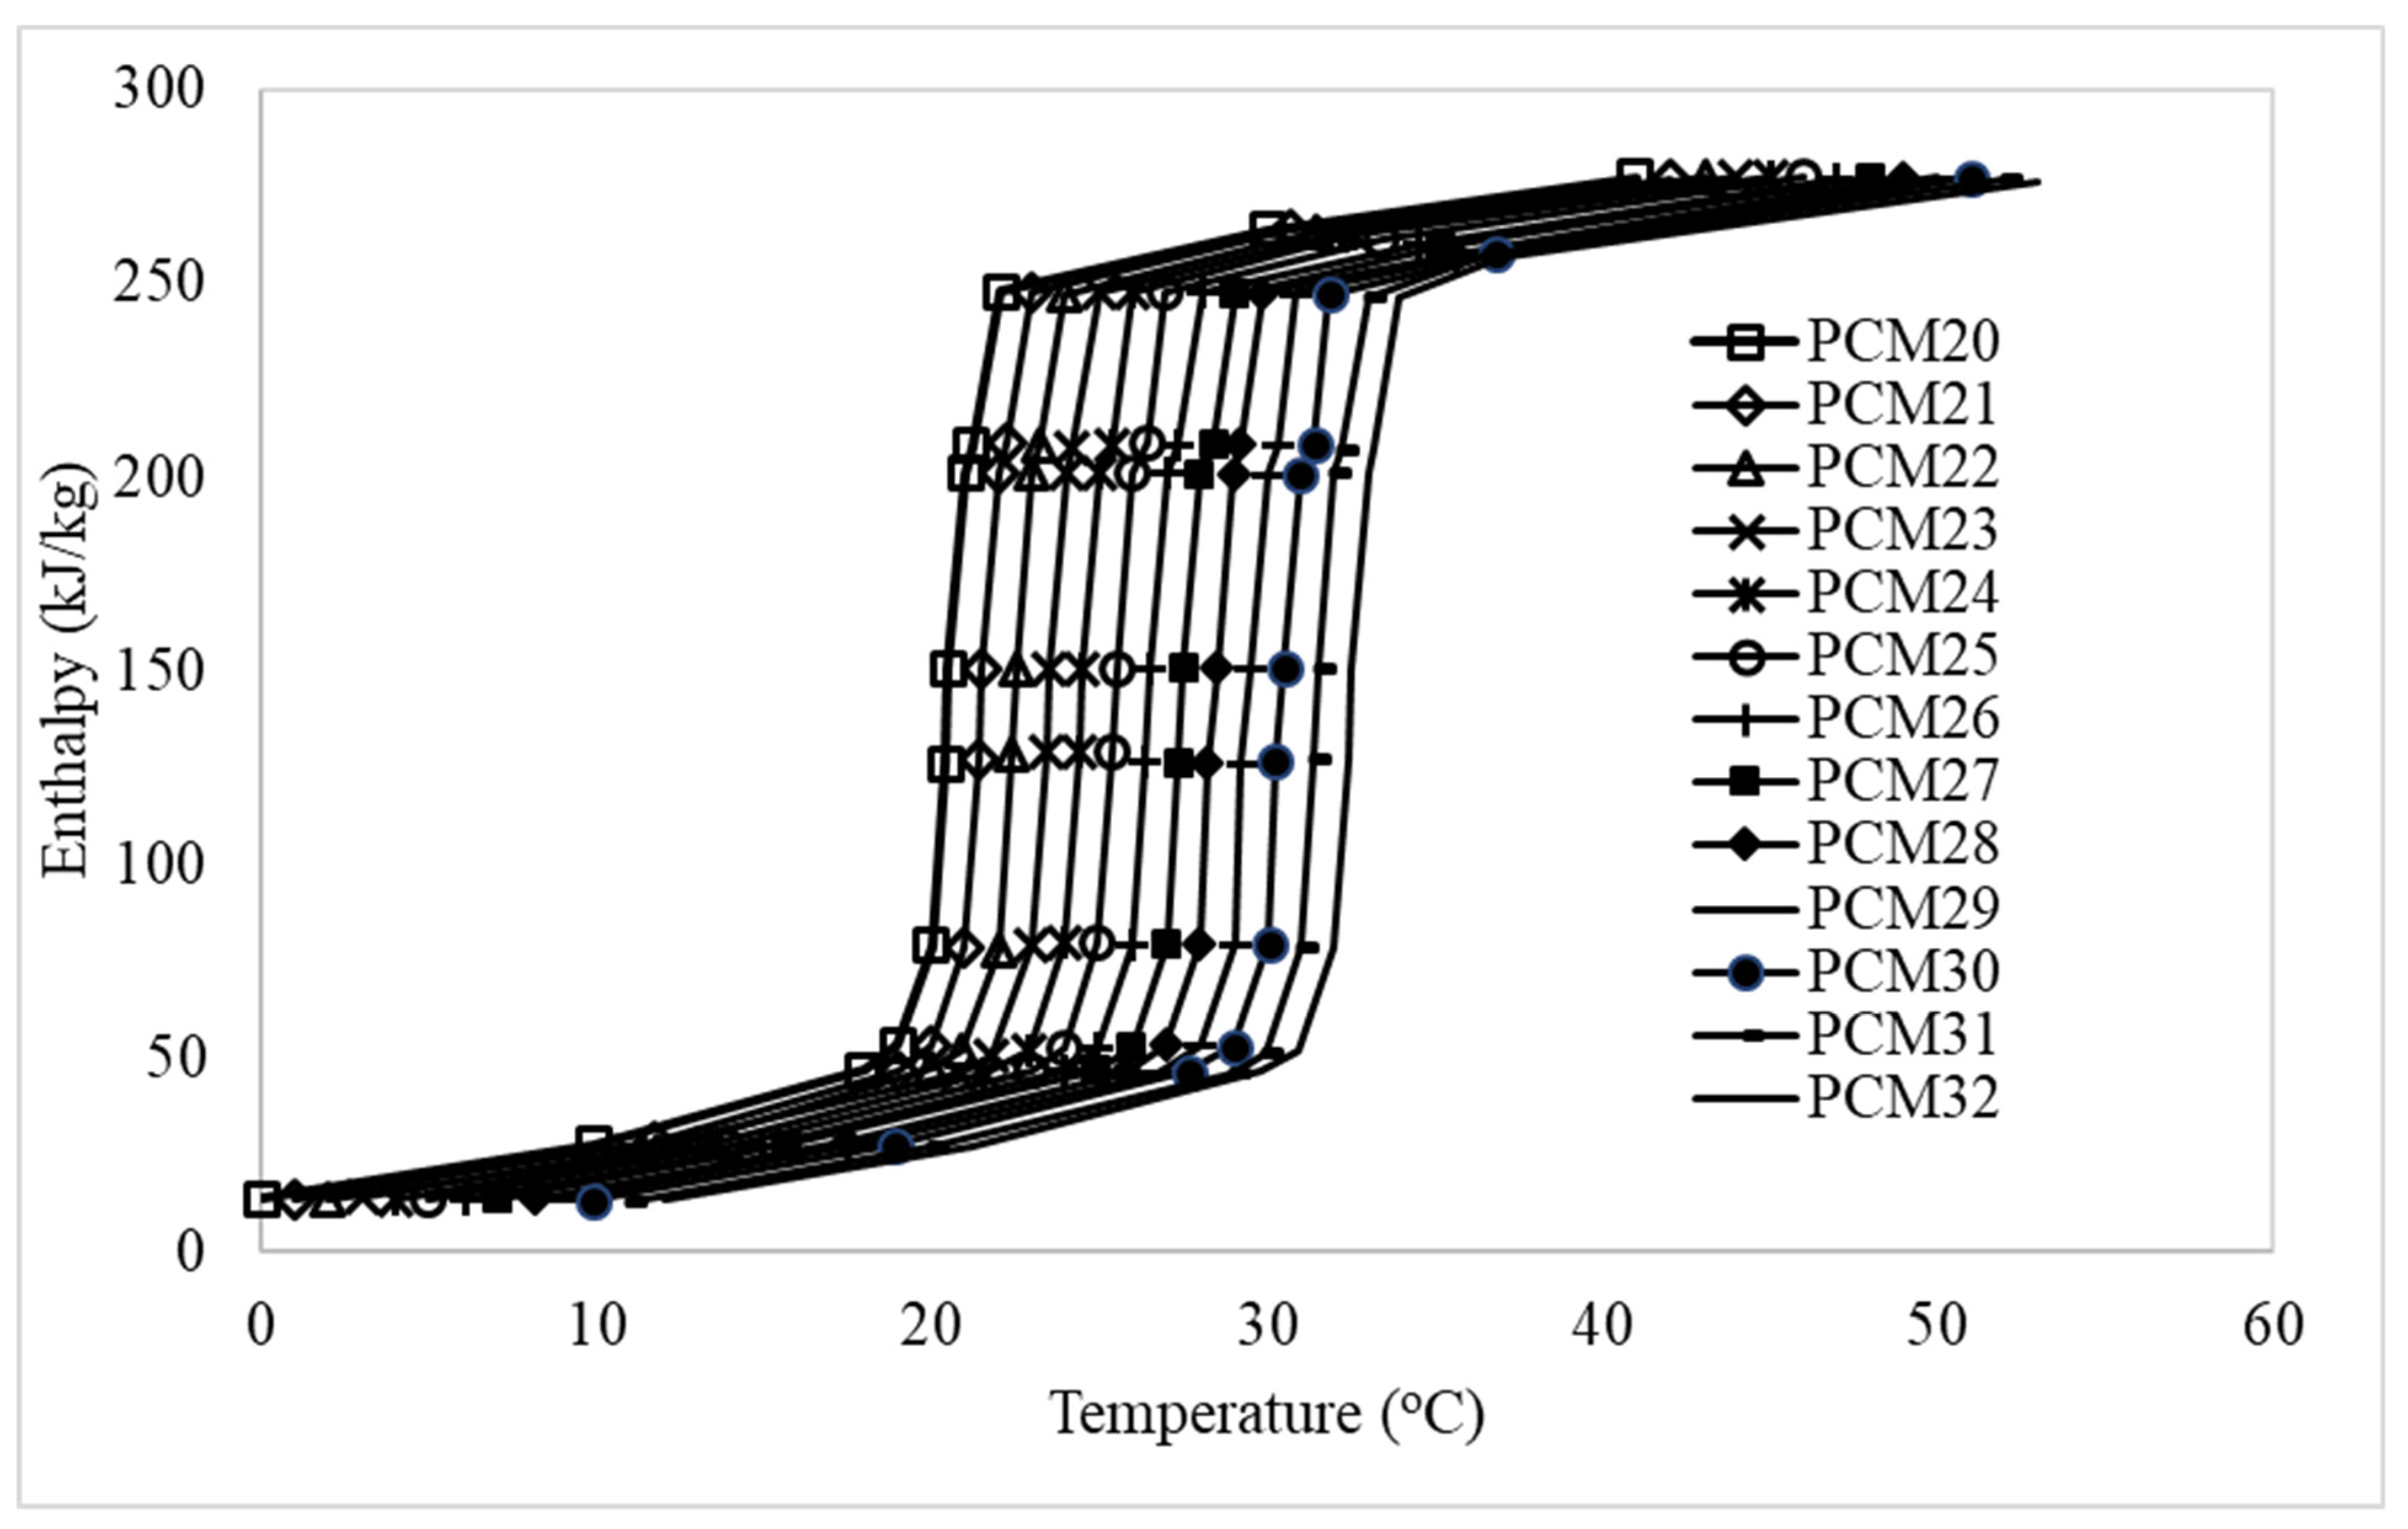
| PCM | See Table 4 | 0.2 | 235 | 2400 |
| Aerogel render [36,37] | 0.02 | 0.024 | 100 | 1000 |
| Operating Conditions | Value | Standard |
|---|---|---|
| Time step | 3 min | Tabares-Velasco et al. [42] |
| Thermostat setpoints | The house energy rating standards of Australia [43] | |
| Heating (°C) | 20 | (00:00–8:00 and 16:00–24:00 h) |
| Cooling (°C) | 24 | |
| People (person) | 4 | |
| Metabolic rate (W/person) | ASHRAE [44] | |
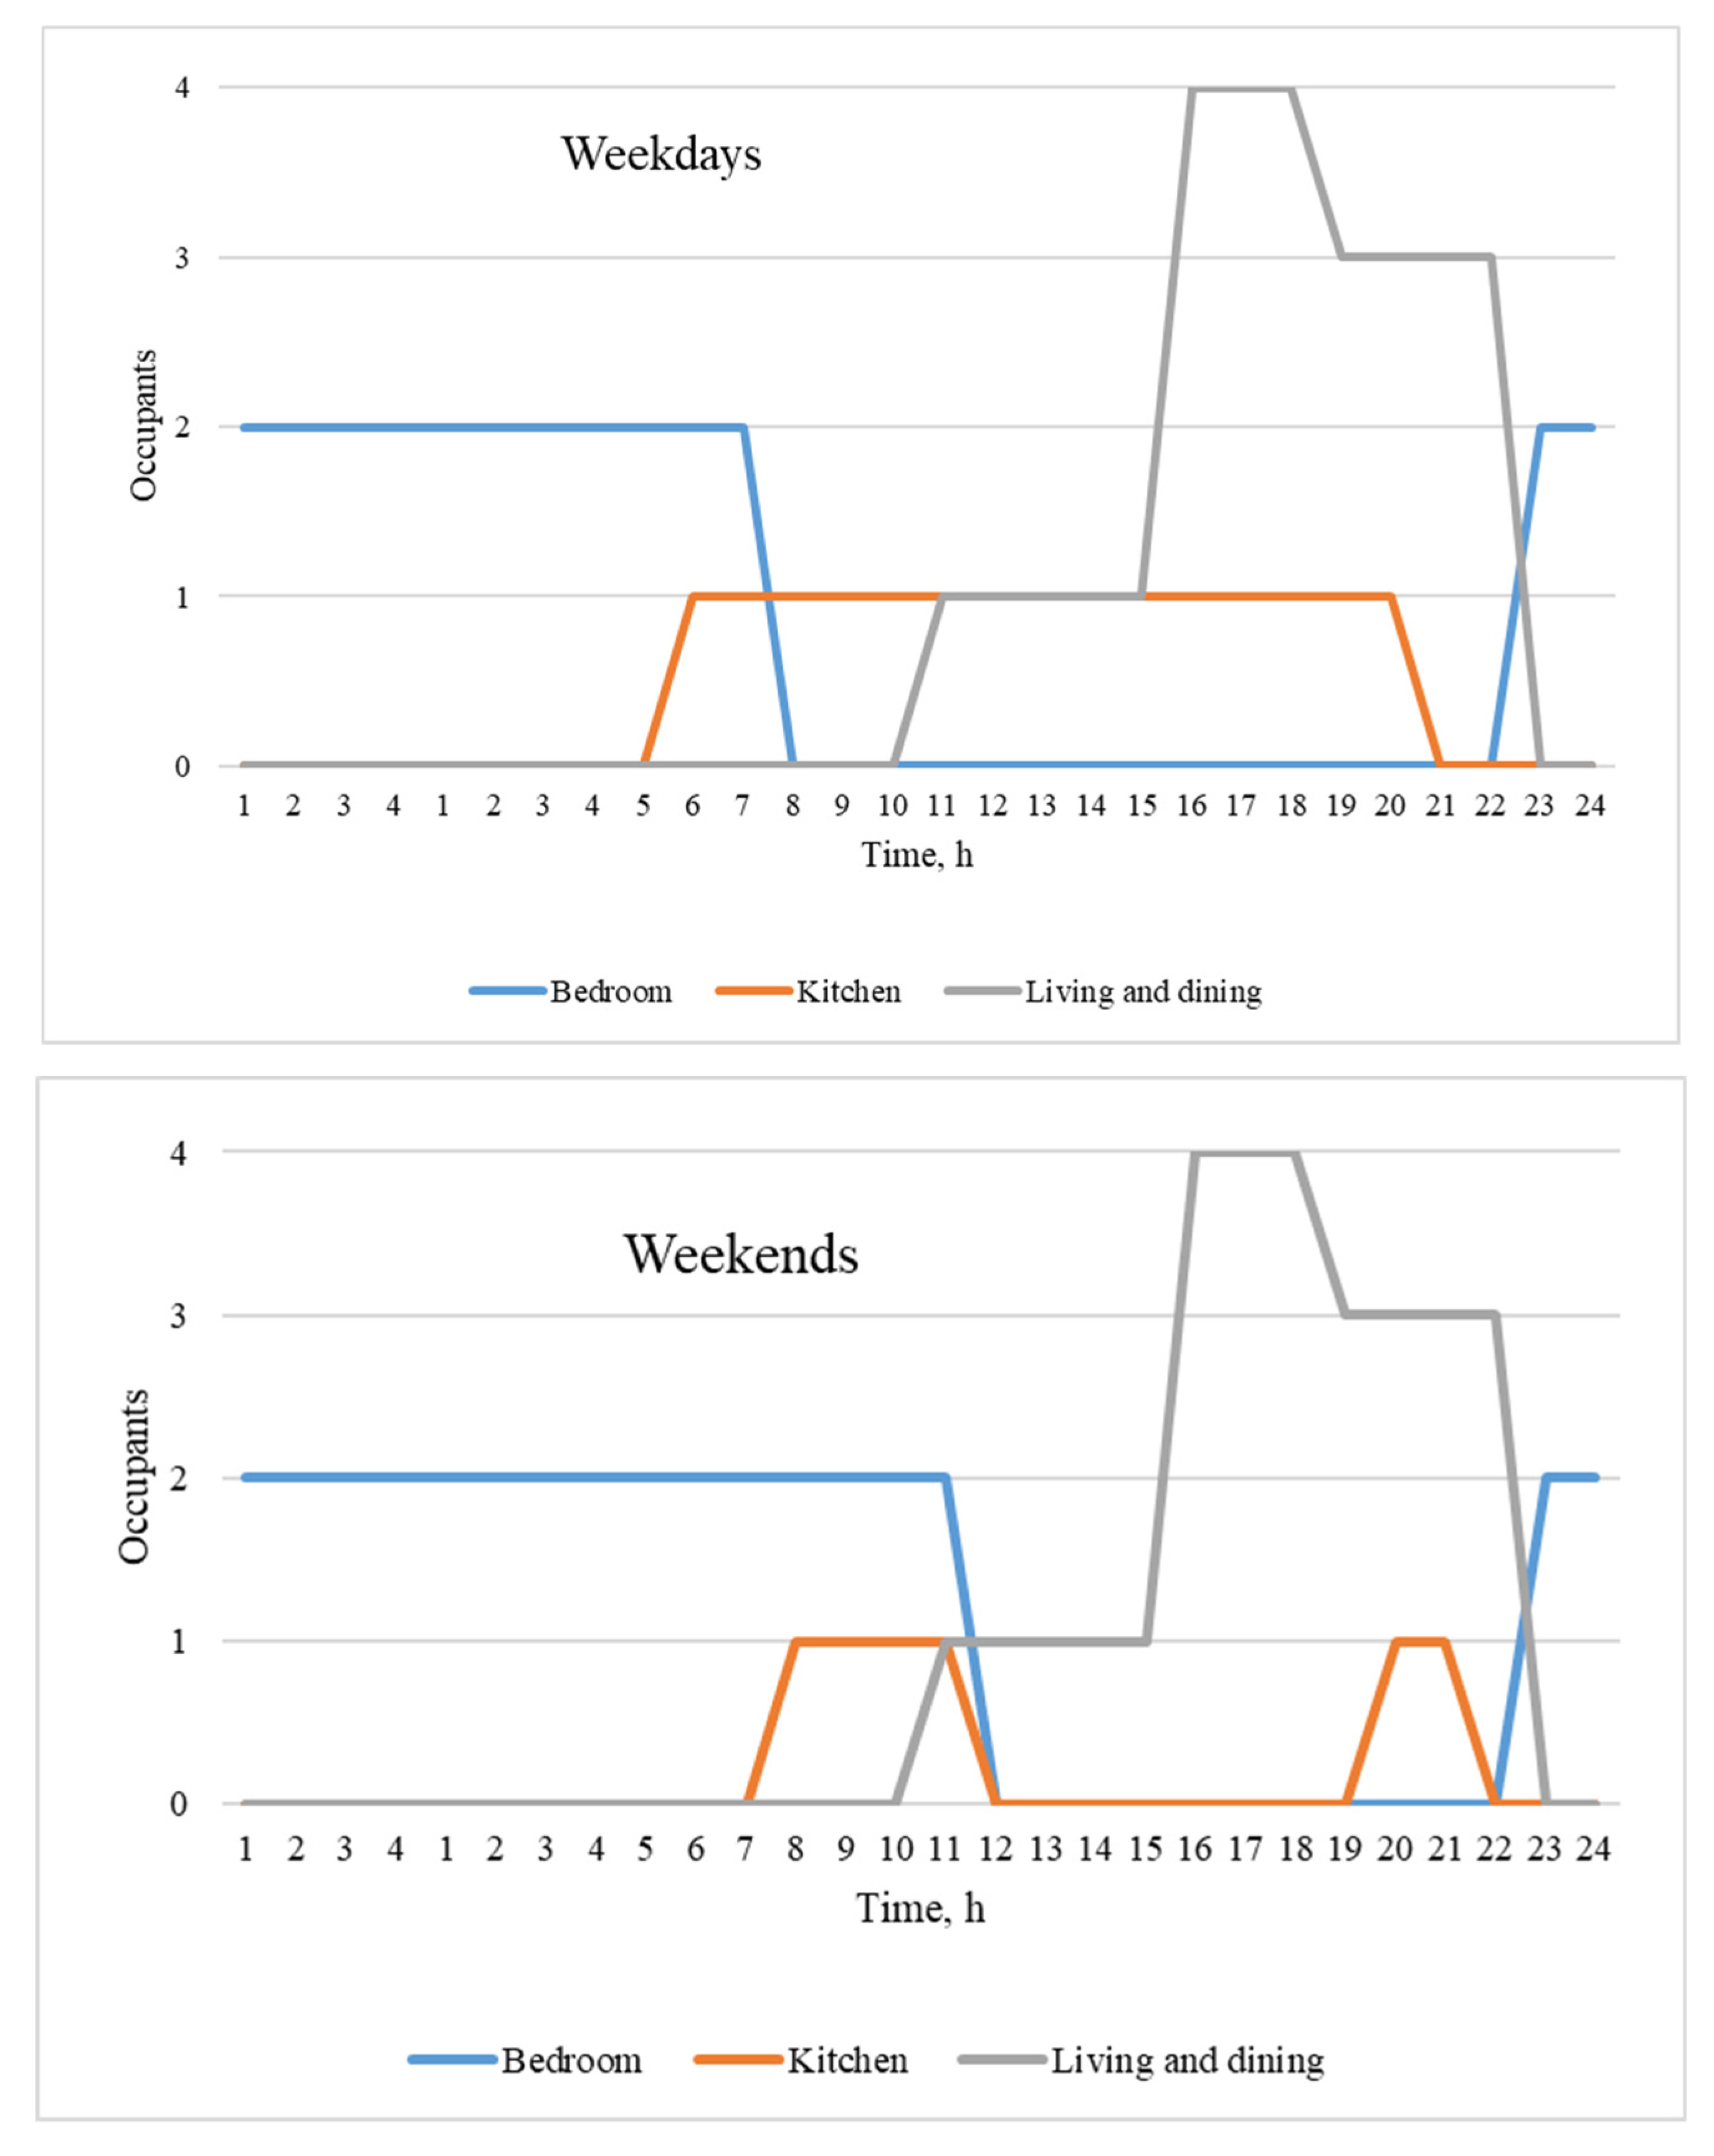
| Writing, seating, standing | 108 | See Figure 5 |
| Cooking, cleaning | 171 | |
| Reading, relaxing | 108 | |
| Lighting (W/m2) | 2.5 | Australian building code boards [45] |
| Electric equipment (W/m2) | 1.875 | |
| Economic Parameter | ||
| Ceiling insulation | 5.93 AUD/m2 | [46] |
| PCM | 4.33 AUD/kg | [47] |
| Aerogel render (AG) | 50–62 AUD/kg | ENERSEN, France [14] |
| Electricity usage rates | 0.31 AUD/kWh | Energy Australia [48] |
| Electricity supply charges | 1.1408 AUD/day | |
| Natural gas usage rate | 0.115 AUD/kWh | |
| Natural gas supply charges | 0.759 AUD/day | |
| Electricity Emission Factor | 1.08 kgCO2-eq/kWh | Australian national greenhouse accounts [49] |
| Natural gas emission factor | 3.9 kgCO2-eq/GJ | |
| Ducted cooling system (COPeq) | 1.96 | [50] |
| Ducted gas heating system (η) | 52.5% | [51] |
| Conversion Factor: Electricity | 3.6 × 10⁶ J/kWh | [52] |
| Heating Value natural gas | 34.526 × 10⁶ J/m3 | [52] |
| Inflation rate () | 1.93% | Office of Best Practice Regulation [53] |
| Interest rate (d) | 6% | |
| Lifetime (LT) | 40 years | Australian building code boards [45] |
| Retrofit Cases | Description | Ceiling | External Walls | Internal Walls | ||||||||||||
|---|---|---|---|---|---|---|---|---|---|---|---|---|---|---|---|---|
| Layer 1 | Layer 2 | Layer 3 | Layer 1 | Layer 2 | Layer 3 | Layer 4 | Layer 1 | Layer 2 | Layer 3 | Layer 4 | Layer 5 | Layer 6 | Layer 7 | |||
| Case 1 | Baseline (Uninsulated wall and ceiling) | Ceiling Plasterboard | Brick Veneer | Wall Plasterboard | Wall Plasterboard | Air gap | Wall Plasterboard | |||||||||
| Case 2 | Applying render on the outer parts of the external wall | Rendered wall and uninsulated ceiling | Ceiling Plasterboard | Aerogel Render | Brick Veneer | Wall Plasterboard | Wall Plasterboard | Air gap | Wall Plasterboard | |||||||
| Case 3 | Rendered wall and insulated ceiling | Insulation | Ceiling Plasterboard | Aerogel Render | Brick Veneer | Wall Plasterboard | Wall Plasterboard | Air gap | Wall Plasterboard | |||||||
| Case 4 | Rendered wall coupled with PCM and uninsulated ceiling | Ceiling Plasterboard | Aerogel Render | PCM | Brick Veneer | Wall Plasterboard | Wall Plasterboard | Air gap | Wall Plasterboard | |||||||
| Case 5 | Rendered wall coupled with PCM and uninsulated ceiling coupled with PCM | PCM | Ceiling Plasterboard | Aerogel Render | PCM | Brick Veneer | Wall Plasterboard | Wall Plasterboard | Air gap | Wall Plasterboard | ||||||
| Case 6 | Rendered wall coupled with PCM and insulated ceiling | Insulation | Ceiling Plasterboard | Aerogel Render | PCM | Brick Veneer | Wall Plasterboard | Wall Plasterboard | Air gap | Wall Plasterboard | ||||||
| Case 7 | Rendered wall coupled with PCM and insulated ceiling coupled with PCM | Insulation | PCM | Ceiling Plasterboard | Aerogel Render | PCM | Brick Veneer | Wall Plasterboard | Wall Plasterboard | Air gap | Wall Plasterboard | |||||
| Case 8 | Applying render on the inner parts of the exterior and interior wall | Rendered wall and uninsulated ceiling | Ceiling Plasterboard | Brick Veneer | Wall Plasterboard | Aerogel Render | Aerogel Render | Wall Plasterboard | Air gap | Wall Plasterboard | Aerogel Render | |||||
| Case 9 | Rendered wall and insulated ceiling | Insulation | Ceiling Plasterboard | Brick Veneer | Wall Plasterboard | Aerogel Render | Aerogel Render | Wall Plasterboard | Air gap | Wall Plasterboard | Aerogel Render | |||||
| Case 10 | Rendered wall coupled with PCM and uninsulated ceiling | Ceiling Plasterboard | Brick Veneer | Wall Plasterboard | PCM | Aerogel Render | Aerogel Render | PCM | Wall Plasterboard | Air gap | Wall Plasterboard | PCM | Aerogel Render | |||
| Case 11 | Rendered wall coupled with PCM and uninsulated ceiling coupled with PCM | PCM | Ceiling Plasterboard | Brick Veneer | Wall Plasterboard | PCM | Aerogel Render | Aerogel Render | PCM | Wall Plasterboard | Air gap | Wall Plasterboard | PCM | Aerogel Render | ||
| Case 12 | Rendered wall coupled with PCM and insulated ceiling | Insulation | Ceiling Plasterboard | Brick Veneer | Wall Plasterboard | PCM | Aerogel Render | Aerogel Render | PCM | Wall Plasterboard | Air gap | Wall Plasterboard | PCM | Aerogel Render | ||
| Case 13 | Rendered wall coupled with PCM and insulated ceiling coupled with PCM | Insulation | PCM | Ceiling Plasterboard | Brick Veneer | Wall Plasterboard | PCM | Aerogel Render | Aerogel Render | PCM | Wall Plasterboard | Air gap | Wall Plasterboard | PCM | Aerogel Render | |
| Discomfort Index (DI) | Classification of Heat Stress |
|---|---|
| DI < 22 | No heat stress is encountered. |
| 22 < DI < 24 | A mild sensation of heat stress. |
| 24 < DI < 28 | Moderate heat stress, people feel very hot, and physical work may be performed with some difficulties. |
| DI > 28 | Heat stress is severe; people engaged in physical work are at increased risk for heat exhaustion and heatstroke. |
Publisher’s Note: MDPI stays neutral with regard to jurisdictional claims in published maps and institutional affiliations. |
© 2021 by the authors. Licensee MDPI, Basel, Switzerland. This article is an open access article distributed under the terms and conditions of the Creative Commons Attribution (CC BY) license (https://creativecommons.org/licenses/by/4.0/).
Share and Cite
Kumar, D.; Alam, M.; Sanjayan, J.G. Retrofitting Building Envelope Using Phase Change Materials and Aerogel Render for Adaptation to Extreme Heatwave: A Multi-Objective Analysis Considering Heat Stress, Energy, Environment, and Cost. Sustainability 2021, 13, 10716. https://doi.org/10.3390/su131910716
Kumar D, Alam M, Sanjayan JG. Retrofitting Building Envelope Using Phase Change Materials and Aerogel Render for Adaptation to Extreme Heatwave: A Multi-Objective Analysis Considering Heat Stress, Energy, Environment, and Cost. Sustainability. 2021; 13(19):10716. https://doi.org/10.3390/su131910716
Chicago/Turabian StyleKumar, Dileep, Morshed Alam, and Jay G. Sanjayan. 2021. "Retrofitting Building Envelope Using Phase Change Materials and Aerogel Render for Adaptation to Extreme Heatwave: A Multi-Objective Analysis Considering Heat Stress, Energy, Environment, and Cost" Sustainability 13, no. 19: 10716. https://doi.org/10.3390/su131910716
APA StyleKumar, D., Alam, M., & Sanjayan, J. G. (2021). Retrofitting Building Envelope Using Phase Change Materials and Aerogel Render for Adaptation to Extreme Heatwave: A Multi-Objective Analysis Considering Heat Stress, Energy, Environment, and Cost. Sustainability, 13(19), 10716. https://doi.org/10.3390/su131910716