Article

Optimization of Safety System Structures in Railway Transport

Institute of Combustion Engines and Transport, Poznan University of Technology, Pl. Marii Skłodowskiej-Curie 5, 60-965 Poznań, Poland
*
Author to whom correspondence should be addressed.
Sustainability 2021, 13(19), 10700; https://doi.org/10.3390/su131910700
Submission received: 18 August 2021 / Revised: 20 September 2021 / Accepted: 23 September 2021 / Published: 26 September 2021

Abstract

:
One of the basic strategies for reacting to unacceptable risk is introducing new elements to the analyzed domain. These elements and the relations between them can be treated as a safety system. Although expanding the safety system usually reduces the risk of specific hazards, it often leads to new problems resulting from its excessive development: the system becomes costly and difficult to understand. One of the methods of avoiding the negative issues is to apply an approach described in this paper, which is based on an optimization method making use of the results of risk analysis. The article contains a detailed mathematical description of an optimal solution search algorithm, enabling the selection of a configuration of safety system components that will be the most appropriate in terms of the degree of risk reduction and the related costs. The theoretical part was supplemented with a working example concerning railway traffic control systems. Using the proposed method, it is possible to obtain an optimal structure of a safety system, ensuring at least a tolerated level of risk, adequate to the identified hazards.

1. Introduction

In his book about the normal accident theory, Charles Perrow [1] talks about how normal accidents are related to the complexity of the systems resulting, among others, from the safety devices added to them. Although the theory itself has often been criticized [2], pointing out the potential consequences of adding more elements to the safety system seems to be reasonable. It is even said that the majority of the complex systems seen in science, technology, and economy lack complete and unambiguous information about their structure and behavior [3,4]. On the other hand, an active approach to reducing the risk of identified hazards often leads to the creation of complex safety systems with many relations among their elements and among the elements of the domains for which the safety systems are intended.
Already several years ago, it was noticed that an irrational approach to the development of safety systems leads to their excessive expansion and significant operating costs. What is worse, system expansion does not always guarantee that the value of risk will come down to the acceptable range.
It would seem that irrational expansion of safety systems is a result of the current legislative approach or technological development; however, this problem was observed already several years ago. In his work, Głodek [5] gives an example of the Shell Global Solutions company, which carried out an analysis of the safety measures used based on the IEC 61508 standard [6]. As a result of this analysis, the company found that 65% of these safety measures are overinvested. Summers [7] found that in order to avoid problems with the acceptance of safety, many companies introduce measures with the highest level of operational reliability without conducting proper analyses. In his work, Vincoli [8] points out that efforts related to system safety sometimes exceed the minimum compliance standards in order to ensure the highest level of safety (i.e., the lowest level of risk) possible to achieve for the given system. Moreover, system safety has often been used to demonstrate that some compliance requirements can be excessive while providing insufficient risk reduction to justify the costs incurred.
A risk-based approach to optimization of safety systems in rail transport is not a commonly undertaken decision-making problem. Only a dozen publications on this problem can be found in the literature on the issue. We have also indicated some of them later in this article (Section 5), where we show the relation of these publications to the results obtained by us.
The association of decision-making problems generated in rail transport with risk associated with them results rather from the specificity of this area of transport and the nature of transport services provided in it (that are obviously related to safety). Optimization models that arise for such areas usually do not apply directly to safety systems. For example, optimization methods are used to select a rail network route [9,10] or to optimize the construction and maintenance of rolling stock [11,12], as well as railway infrastructure [13,14]. In such cases, as indicated by Zhang et al. [9], in order to conduct a comprehensive analysis and determine an appropriate design plan, not only economics, but also safety factors should be taken into account. Moreover, according to Wang et al. [10], accurate approximation on train running time and headway time is needed, and hence the results suggest that the number of seriously impacted trains and total delay time can be reduced significantly subject to little cost and risk.
As is clear from the literature cited above, the optimization of operating systems is a particularly frequently undertaken research issue. Here, the problem of risk-based optimization of safety systems in rail transport can be seen, as the operation systems can be treated as safety systems.
A close relationship between the optimization problem and safety systems was shown by Mahboob et al. [15]. In the article, they used the LQI (Life Quality Index) approach to quantify the social benefits of a number of safety management plans for a railway facility such as level crossing. They used influence diagrams to obtain a solution, combining the problems of probabilistic inference, economic utility values and decision alternatives. As a result, they obtained the optimal decision, which maximizes total benefits to society for the level crossing. A similar problem was solved by Gabbar et al. [16], who presented a new approach to the problem of allocating federal resources and identifying modernization projects to improve safety of railroad crossings in Canada. A key aspect of their proposed optimization model is the mathematical programming used to formalize the process of allocating resources with a clear focus on the expected benefits, i.e., reduction of risk and costs of project implementation. We adopted a similar idea of the form of the objective function in our article.
The decision maker (an entity carrying out the safety policy, managing risk, a transport company) faces the choice of the appropriate structure of the safety system in the specific conditions. Above all, a safety system needs to be compliant with the legislative requirements and usually, such requirements recommending specific safety measures are in effect, e.g., the IEC 61508 series of standards [6] or those related directly to railway systems [17,18]. The structure of a safety system and changes thereto should be reasonable, i.e., financially attractive for the entities implementing them (without excessively engaging human resources, using easily available configuration tools enabling quick adaptation to the changing conditions), while at the same time ensuring an acceptable level of risk. This condition draws attention to the need to formulate specifications of system requirements based on risk analysis or assessment results, which are (or will be) available for each entity in the form of hazard registers [19]. The last condition for the selection of the structure of a safety system refers not so much to system efficiency (usually including the financial aspect) as to its efficacy (understood as in [20]). In this context, safety system elements are not perfect. In other words, their efficacy depends on the invariable and variable attributes of system elements (their properties and characteristics, respectively [21]), as well as the susceptibility of hazard sources to the impact of these elements.
The decision-making problem therefore consists in the selection of a safety system structure (elements of this system) ensuring reasonable reduction of the value of risk to an acceptable, or at least tolerable, level. The first issue concerning a model of such decision-making problem is the size of the choice set and the form of the choices. Elements of the set (options) can be the possible configurations of the safety system. Taking into consideration typical safety systems in railway transport (examples can be found, among others, in [22]), it will be a set small enough to enable the application of systematic methods of searching the choice set.
The second issue is the need to map the complex interrelationships resulting from the functioning of safety systems and to properly include them in the optimization model. The problems of such relationships were confronted, among others, by the authors of [23], who mapped the complex interrelationships between interventions (e.g., maintenance, renewal, improvement, and extension), intervention costs, and services provided by the railway infrastructure network. An advantage of the model they developed is, among others, the fact that it enables construction of optimization models using mixed integer linear programs that can find the optimal sets of interventions without the help of heuristics, e.g., with the Branch-and-Bound and Simplex algorithms [24,25]. It should be added that in the case of safety systems, the complex relationships regarding their functioning will concern [21]:
  • relationships between elements belonging to different categories of safety system components, for instance, the relationships between safety system elements and the elements of their environment;
  • relationships between elements of the same categories, for instance, the relationships between safety system elements within a single safety function.
As demonstrated in [26], matrix mappings work well for presenting relationships regarding safety systems and their inclusion in the optimization model.
Another issue is the type of the optimization model. In the simplest form, the problem of optimization of the safety system structure is a task of linear programming. Yet, due to the distinctive form of the elements of the choice set and the need to take into account additional conditions (causing nonlinearity of the model), it is more convenient to use linear search or sequential search models.
In connection with the decision-making problem mentioned above, the following purpose of the article was formulated: to develop and present a decision-making model regarding the configuration of safety system structure with the use of the optimization method based on risk analysis results.
In the next section, the adopted definition of safety systems was presented and the manner of implementing risk analysis results in the procedures of the developed model was discussed. Section 3 contains a description of the optimization procedure along with the algorithm for generating the optimal solution. Section 4 presents an example of applying the developed method for the configuration of a safety system in railway transport, concerning communication, data processing, and traffic control systems. Section 5 presents the final remarks with elements of discussion.

2. Problem Definition

2.1. Definition of a Safety System

According to system theory, a system exists when there are interdependent but related components achieving a valued pre-set objective or a purpose or a function [27]. Systems may be further supported by principles and based on theories and information applicable to the situation. Therefore, a safety system can be defined as a set of cooperating elements, which forms a purpose-oriented unit [21]:
S = E ( C , A , R ) ,   C = [ C 1 , , C n ] ,   A = [ A 1 , , A m ] ,   R = [ R 1 , , R r ] ,
where C is a set of safety system components, A is a set of attributes (properties), R is a set of relationships between the components and the attributes, E is an entity—an existing whole (not necessarily space-time, often in the world of ideas or symbols). The author of [8] provides a definition of a system by pointing out what its elements can be: “A combination of people, procedures, facilities, and/or equipment all functioning within a given or specified working environment to accomplish a specific task or set of tasks”.
We can therefore speak of a safety system when:
  • the purpose of the system is the rationalization of risk in the analysis areas, so as to ensure an acceptable or tolerable level of risk for the identified hazards;
  • elements of this system can perform certain specific functions, so-called safety functions.
In practice, this consists in the elements of the safety system having an impact on the hazard sources (HS), i.e., factors whose presence, state or properties cause the formation of hazards (Hs). This impact can be manifested in different ways. For instance, when defining safety functions, Harms-Ringdahl [28,29] states that “A safety function is a technical, organizational or combined function that can reduce the probability and/or consequences of accidents and other unwanted events in a system”. The result of the impact of safety system elements is therefore a reduction of one or two values (effect or probability) included in the mathematical models of risk measures. For this reason, safety system elements will hereinafter be referred to as risk reduction measures (RRMs). It should be noted here that the impact of risk reduction measures on hazard sources usually comes down to:
  • eliminating hazard sources, this being the perfect situation, which can be mapped in optimization modes as the maximum efficacy of risk reduction measures;
  • breaking the hazard source impact pathway, i.e., isolating the hazard source or isolating the receiver of exposures impacted by this source;
  • detecting hazard source activity and informing about it.
As pointed out before, the relationships occurring within the safety system are very complex. Eliminating one hazard source might make it possible to avoid several events, and additionally, one risk reduction measure may impact several hazard sources. This is the so-called overlapping of safety functions [30], which is a desirable system feature. As Cempel puts it in his work [4], “thanks to those dependencies and cooperation, one achieves high safety system efficiency”. In connection with this feature of safety systems, the effect of synergy should be considered with reference to their functioning.
Based on the presented determinants of the functioning of safety systems, it can be assumed that their potential is usually higher than the potential of exposures generated by hazard sources against which the safety systems were implemented. This confirms the rightness of searching for the optimal safety system structure.

2.2. Processing Risk-Related Data

The result of risk analysis is the hazard record (HR) and risk values estimated for each hazard according to the adopted risk model. Let H be a set of hazards identified within the area of analysis of interest to us and included in the hazard register:
H = { h 1 , h 2 , , h l } ,
For decision-making purposes related to the optimization of the safety system structure, a risk measure form is adopted as the value:
R : H V
which assigns values from a certain subset V of a set of real numbers to hazards from set .
The mathematical risk measure model usually includes several components whose values (levels) are determined in the process of risk analysis according to specific criteria. In accordance with the typical risk measure models [8,21,22,31], its components usually belong to two groups—a group of components expressing the possibility of so-called hazard activation/materialization and a group of components expressing losses after hazard activation. When the levels of all the risk components are determined, the total risk of the k th ( k = 1 , 2 , , l ) hazard can be expressed as follows:
R ( h k ) = f 1 ( r 1 ( h k ) , r 2 ( h k ) , , r m ( h k ) ) ,   k = 1 , 2 , , l ,
where r i ( h k ) is the i th component of the risk of the k th hazard.
During the development of the formal model, the following general assumptions resulting from the information collected in the hazard register were taken into account:
  • risk reduction measures are known;
  • hazard sources which might occur in the area of analysis are known;
  • the efficacy of risk reduction measures is known and expressed in the form of numerical measures;
  • a risk reduction measure impacts a hazard source present within the area of analysis;
  • the impact of a risk reduction measure takes on values from the set of binary numbers or values from any subset of real numbers, e.g., from the range (0; 1).
Let a i j mean the degree of impact of the i th risk reduction measure on the j th hazard source present within the area of analysis. In the easiest form of the decision problem, when little information is available, a i j takes on values from set Ω of binary numbers:
Ω = { 0 ; 1 } ,
then:
  • the 0 value means no impact (zero degree of risk reduction related to the hazard source);
  • the 1 value means full impact (elimination of the hazard source).
In the case discussed in this article, to make the working example more general, a i j takes on values from the subset of real numbers, i.e., real numbers from the range ( 0 ;   1 ) . It should be noted that perfect impact and a i j equal to 1 can occur only theoretically.
Now, let matrix A be a rectangular matrix whose elements are a i j , that is:
A = [ a i j ] m × n ,   i = 1 , 2 , , m ;   j = 1 , 2 , , n
There are specific relationships between hazard sources and hazards. They can be expressed with the chain HS–H–UE (described in detail, among others, in [20,21,26]). In these relationships, a concept of hazard factor (hazard source) coincidence is adopted. This means that in order for a state called a hazard to occur, more than one factor (or a group of factors) is necessary. Based on such reasoning, a certain matrix P can be defined, reflecting the relationships between elements HS and H, in the following form:
P = [ p j k ] n × l ,   j = 1 , 2 , , n ;   k = 1 , 2 , , l
Elements p j k of matrix P can be expressed in different forms, but for the optimization procedure presented in Section 3, numerical form is needed. Therefore, it was assumed that these will be the values of probability of the presence/occurrence of the j th hazard source within the area of application of the safety system. If the given hazard source (HS) is not the reason for formulating hazard h k , then value p j k of an element of matrix P equals zero. If the given hazard source is present in the area of analysis and is the reason for formulating the k th hazard (HS is part of H), then an element of matrix P takes on value p j k , and it is assumed that it is the same for all the hazards coming from this source. This assumption can be expressed as follows:
k = 1 , 2 , l   p j k = p j | HS j h k .
For the purpose of determining the value of risk, the following vector S was defined, which contains the values of the effects of hazard activation (i.e., damage or losses expressed with the appropriate measure, e.g., a point measure):
S = [ s 1 ; s 2 ; ; s l ]
Assuming a typical form of the risk function (4), value R j k can be determined—of a fraction of risk related to the presence of the j th hazard source:
R j k = f ( p j k , s k ) R j k = p j k s k ;   j = 1 , 2 , , n ;   k = 1 , 2 , , l
If the demand for risk reduction with reference to the kth hazard was expressed as follows:
Δ R k = g ( R j k ) = j = 1 n R j k R k T ;   R k T < R j k
where R k T is the tolerable value of risk related to the kth hazard, then the total demand for risk reduction by the safety system is determined based on the following dependency:
Δ R = k = 1 l Δ R k
In practical applications, demand for risk reduction can be modified due to the so-called risk appetite of the decision maker. It can be expressed through a coefficient α that takes on values from the range of ( 0 ; 1 ) . The greater the value of this indicator, the higher the risk appetite or risk retention, resulting in the acceptance of a safety system with the risk reduction potential below demand. The risk appetite phenomena has been included in the optimization model described in Section 3.
The remaining task is to determine the capability for risk reduction by risk reduction measures in a similar way. Let matrix B be the matrix of the value of the fraction of risk related to the activity of the j th hazard source, i.e.,:
B = [ b j k ] n × l ,   b i j = { 0 when p i j = 0 R j k when p i j 0 .
Using elements of matrix A and matrix B , a certain matrix C can be created, of the capability for risk reduction by the safety system:
C = A × B .
Elements c i k of matrix C are the values of risk reduction caused by the individual risk reduction measures with reference to the k th hazard. The sum of values c i k from all the matrix columns constitutes the total value of risk reduction realised by the i th risk reduction measure. It can be used in formulating indicators of risk reduction measure efficacy.

2.3. Risk Reduction Measure Efficacy

In order to make a rational choice of a risk reduction measure matching the identified hazard sources, indicator E i expressing the share of individual risk reduction measures in the total value of risk reduction provided by the safety system is defined. This indicator can be interpreted as efficacy expressed with the degree of risk reduction, not the cost of implementing the risk reduction measure. Using elements of matrix C and dependency (12), the following form of indicator E i was adopted:
E i = k = 1 l c i k Δ R ; i = 1 , 2 , , m
The numerator of formula (15) can be called the degree of risk reduction realized by the i th risk reduction measure. The sum of values of the degrees of risk reduction can exceed value Δ R of the demand for risk within the area of system application.
If needed, a different form of indicators used in different areas of system application can be used. For instance, the authors of [32] showed the Efficacy Index to objectively quantify the effective implementation of an Occupational Health and Safety Management System. A manner of determining efficacy understood in probabilistic categories as a combination of the probability that the risk reduction measure is functioning and vulnerability of the hazard source to the given risk reduction measure was presented in [20].
The indicator defined in dependency (15) can be further developed in order to take into consideration the costs of implementing the safety system, through adding a relation to the variable of the cost of application of the given type of measures incurred in project budgets. The cost of implementing a safety system consisting of the m th number of risk reduction measures per unit of the degree of risk reduction can therefore be expressed as follows:
E F = i m K i i m E i ;   i = 1 , 2 , , m
where K i is the cost incurred in connection with the implementation of the i th risk reduction measure.

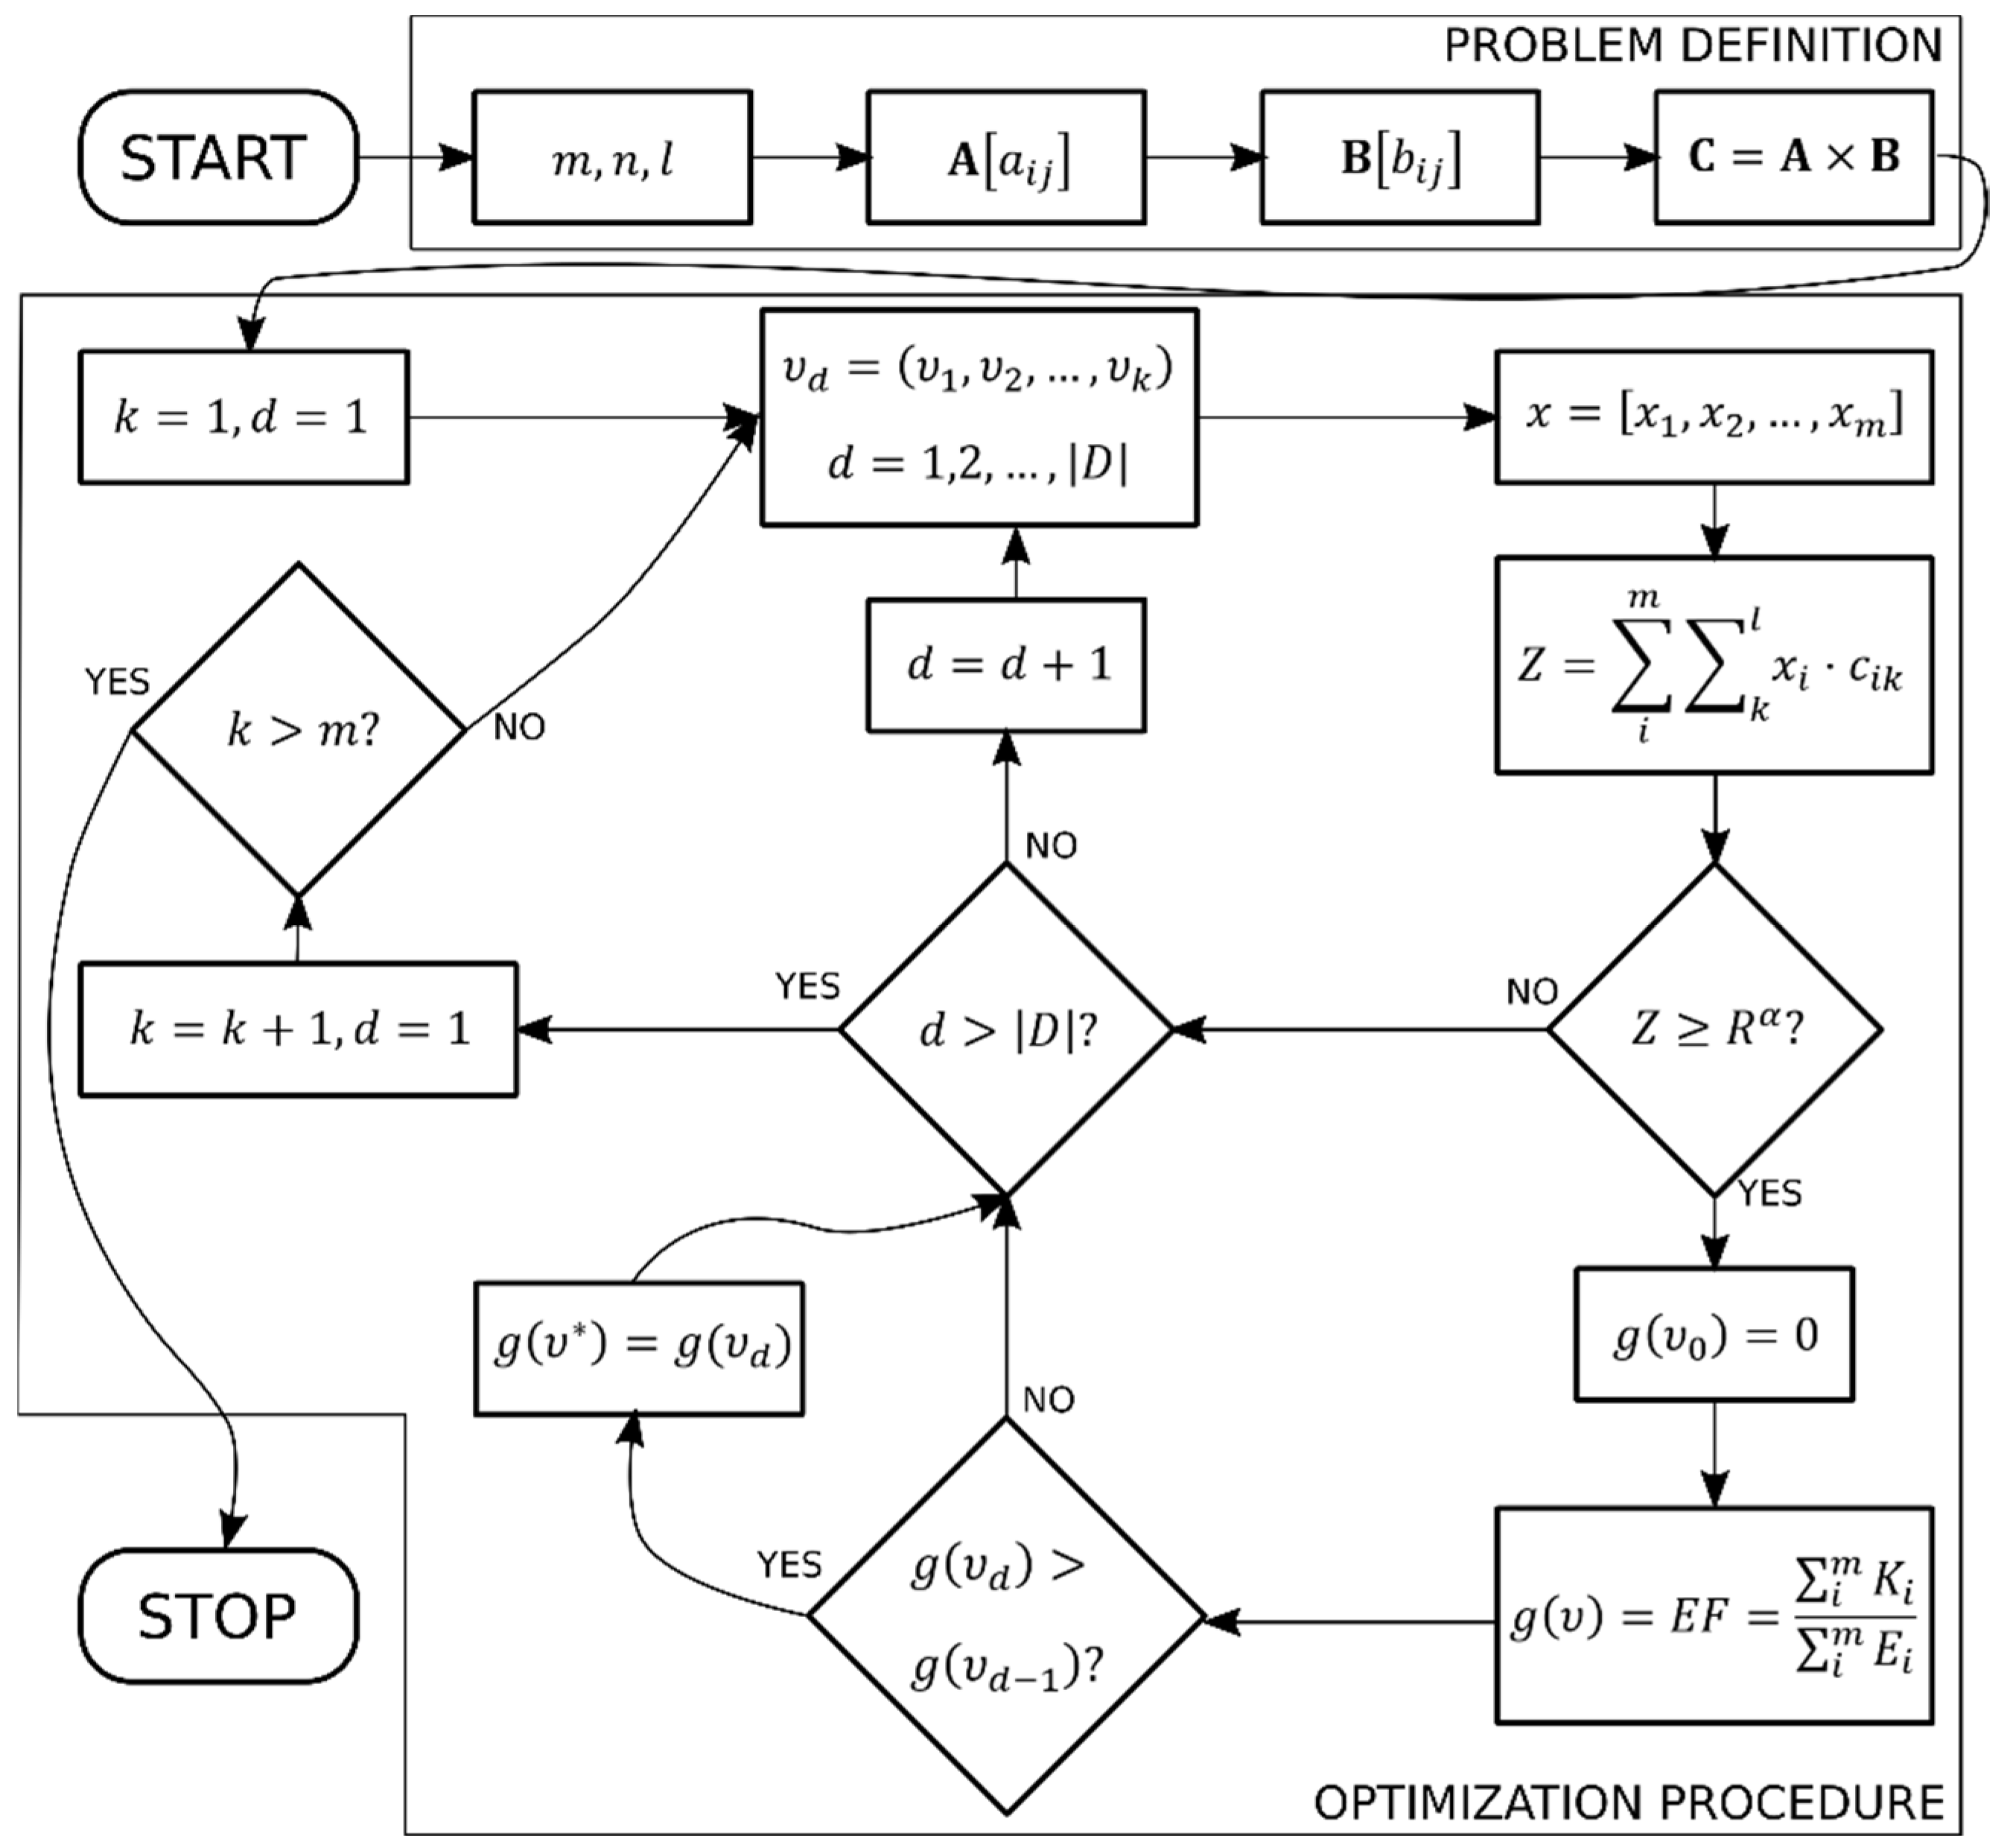
3. Safety System Optimization Procedure

Let υ = ( υ 1 , υ 2 , , υ k ) be any given -element combination without repetitions of the m -element set of natural numbers 1 , 2 , , m . Assuming that numbers 1 , 2 , , m are the consecutive numbers of risk reduction measures, a certain binary vector x = [ x i ] ,   i = 1 , 2 , m can be notated, whose i th element takes on the value of “1” when the risk reduction measure was included in the particular combination υ or it takes on the value of “0” if it was not, i.e.,:
x i = { 0 when i υ 1 when i υ .
The aim of calculations presented in this section is the selection of the optimal solution. Therefore, let matrix C be the so-called payment matrix (benefit matrix, etc.) in the optimisation model. An element of matrix c i j means a payment (benefit) for the decision maker in the form of risk reduction value obtained in the case of selecting the i th risk reduction measure with reference to the j th hazard source. Taking into account the previously defined matrix C (Equation (14)) and vector x, the following constraints were assumed:
k = 1 , 2 , , l   i m x i c i k Δ R k .
This means that risk reduction by the safety system needs to be at least equal to the demand for this reduction resulting from the identified hazards. Additionally, indicator α of risk appetite can be included in limitation (18), and then:
i m x i c i k ( 1 α ) Δ R k i m x i c i k Δ R k α
Now, let D represent a set of all the combinations υ , and function g ( υ ) be the cost or profit from creating a safety system consisting of risk reduction measures whose numbers are present in set υ = ( υ 1 , υ 2 , , υ k ) . Such combination υ * should therefore be found that:
g ( υ * ) = min { g ( υ ) | υ D }   or   g ( υ * ) = max { g ( υ ) | υ D }
Objective function g ( υ ) can have different forms. For the purpose of this work, the indicator formulated in dependency (16) was used:
g ( υ ) = i m K i i m E i min
Each combination υ is an acceptable solution of the problem if dependency (19) is fulfilled. However, after taking into account dependency (21), it is possible to achieve the optimal solution. It is a combination of risk reduction measures which, when used in a safety system (with reference to the hazard sources present in the area of system application), fulfil the purpose of the safety system. In this case, they minimize the cost of ensuring at least a tolerable level of risk or maximize the total value of the indicators of the efficacy of risk reduction.
For the purpose of iterative generation of the optimal solution, designation υ d = ( υ 1 , υ 2 , , υ k ) is introduced as the next ( d = 1 , 2 , , | D | ) combination υ = ( υ 1 , υ 2 , , υ k ) from set D . The algorithm of the procedure of safety system optimisation was presented schematically in Figure 1.

4. Working Example

Organization of a safety system concerning communication, data processing, and railway traffic control systems was selected as an example of the possibility of application of the method. The safety system was intended for the control of hazards generated by so-called systematic hazard factors. These primarily include so-called systematic failures, i.e., factors mainly caused by human errors at various stages of the product life cycle. Therefore, systematic failures are mainly treated by the application of appropriate processes, methods, and organization [18].
In order to meet the legislative requirements, the application of safety measures recommended by the EN 50129 standard [17] is planned. Elements of the organized safety system are mainly organizational measures. They are also characterized by the fact that each of these measures impacts several hazard sources identified within the area of application of the safety system. For this reason, all the available measures are not always needed in order to achieve an acceptable risk level, but their properly selected combination is often enough (which is also indicated in the guidelines of the EN 50129 standard [17]). Usually, in order to achieve an acceptable level of risk, even with the highest safety integrity level (SIL), three or four risk reduction measures are recommended at most.
Therefore, the provided context of the development of a safety system creates a decision-making problem, possible to solve with this method. The names of the risk reduction measures which can be applied were provided in Table 1, and the names of systematic factors impacted by these measures—in Table 2.
Information about the connection between risk reduction measures and hazard sources was presented in matrix form—dependency (22). The matrix fields contain the values of the efficacy of the impact of the ith risk reduction measure on the jth hazard source.
A = [ 0.5 0 0.5 0 0.1 0.5 0 0 0.5 0.5 0 0 0.5 0.5 0.5 0 0 0 0.5 0.5 0 0.9 0.9 0 0.9 0 0 0 0.5 0.5 0 0.5 0 0 0.5 0 0.5 0 0.5 0.5 0.1 0.1 0 0.1 0.1 0.5 0.5 0 0.5 0.5 0 0 0.9 0 0.9 0.5 0 0.5 0 0.5 ]
In connection with each hazard source, at least one hazard can be formulated whose seriousness or criticality is assessed with the use of risk value. The list of hazards, which in this case are related to a railway system, was provided in Table 3.
Although the formulated hazards may also be caused by other hazard sources (than those provided in Table 2), we assume that they will be:
  • hazard sources from outside of the applied system (out of the scope of responsibility of the designer of the safety system) or
  • hazard sources which are derivatives of the sources discussed herein, which will thus be eliminated by one of the expected risk reduction measures.
For the calculations, point measures of the degree of loss were adopted, used, among others, in the FMEA method [33]. Due to the fact that the safety system concerns railway traffic control, the maximum value of losses for each hazard was assumed, i.e., vector (9) takes on the following form:
S = [ 10 ; 10 ; 10 ; 10 ] .
The results of risk value estimation are presented by matrix B —dependency (24), and in accordance with dependencies (10) and (13), the fields of this matrix contain the value of the fraction of risk related to the given hazard source. For the calculation of the value of these fractions of risk, the value of the probability of human error p 5 k = 0.05 (typical of situations of decision-making based on rules) and p 1 k = p 4 k = 0.05 as the assumed 5% error in the requirements and instructions were assumed, among others.
With the assumption of (23), the same values in the lines of matrix (24) mean that the probability of the j th hazard source is not dependent on and does not change depending on the hazard (see formula (8)). Moreover, in accordance with the previously adopted assumptions, a hazard may be caused by more than one hazard source, which was demonstrated in the individual columns of matrix (24). For instance, for the activation of the first hazard (the first column), the occurrence of hazard sources numbered 3, 4, and 5 is required.
B = [ 0 0.5 0.5 0.5 0 0.1 0.1 0.1 0.001 0.001 0.001 0.001 0.5 0.5 0.5 0.5 0.5 0 0 0 ]
In accordance with the algorithm of the method, matrix C is determined (dependency (25)), containing the values of risk reduction caused by the individual risk reduction measures. Assuming that all twelve measures will make up the safety system, matrix C takes on the following form:
C = [ 0.0505 0.2505 0.2505 0.2505 0.5000 0.5000 0.5000 0.5000 0.5005 0.2505 0.2505 0.2505 0.5000 0.2500 0.2500 0.2500 0.4509 0.0909 0.0909 0.0909 0.5000 0.2500 0.2500 0.2500 0.2500 0.0500 0.0500 0.0500 0.5000 0.3000 0.3000 0.3000 0.1000 0.1100 0.1100 0.1100 0.5000 0.5500 0.5500 0.5500 0.4509 0.0009 0.0009 0.0009 0.2505 0.2505 0.2505 0.2505 ]
The costs of implementation and functioning of the analyzed risk reduction measures depend on the size of the project as part of which the safety system is being developed. For this reason, it was decided that (instead of the costs expressed in monetary units) hypothetical percentage shares of the costs of the application of this type of measures incurred in project budgets will be provided. These costs are as follows: 3% (1st RRM), 3% (2nd RRM), 1% (3rd RRM), 11% (4th RRM), 15% (5th RRM), 4% (6th RRM), 10% (7th RRM), 5% (8th RRM), 3% (9th RRM), 12% (10th RRM), 13% (11th RRM), 20% (12th RRM).
The realization of the algorithm of the method for the assumed data made it possible to obtain eight solutions acceptable for three risk reduction measures (Table 4). The results of searching for the optimal solution for the individual configurations of the system are presented in Table 5.
Table 4 provides the results of calculations for eight acceptable solutions (i.e., system configuration meeting the limitations of the model of the decision-making problem). The suboptimal solution was underscored, marked by realization number 62. The solution is characterized by the lowest value of the efficacy function in the case of a three-element system structure. The remaining calculation results, along with the indication of the optimal system structure, were provided in Table 5.
Table 5 provides the numbers of risk reduction measures which, used in a safety system, make it possible to achieve optimal values of the efficacy function (achieved among the “12 choose 4” combinations) and several suboptimal solutions, where the value of the efficacy function achieves the minimum, but only within the range of the given m choose k combination.
From the point of view of the organization of a safety system, what is significant is its structure threshold where the number of acceptable solutions is equal to the number of combinations. This threshold was reached here at the “12 choose 8” combination, which means that eight risk reduction measures, regardless of which measures these are, will ensure an acceptable level of risk. In the system of 12 risk reduction measures, there is therefore no need to consider the “12 choose 9”, “12 choose 10”, and “12 choose 11” combinations when searching for the optimal solution. It should be noted, however, that the share of acceptable solutions depends on the adopted indicator of the level of risk tolerance α (in the calculations, the value of this indicator was assumed to be 0.8).
Therefore, the optimal solution obtained consists in implementing a safety system consisting of the following risk reduction measures:
  • RRM2: Verification of the correctness and consistency of project requirements;
  • RRM3: Software version control;
  • RRM6: Service personnel training;
  • RRM9: Activities involving communication of the risk (raising awareness related to technical safety and cybersecurity).

5. Discussion and Conclusions

The decision-making problem presented here is, in essence, a problem of the selection of risk reduction measures matching the hazard sources identified within the area of application of the safety system. It usually consists of choosing a combination of measures, the use of which in a safety system will ensure that this system will meet a specific objective. It is assumed that the purpose of a safety system is the rationalization of risk within the areas of its application in such a way as to ensure at least a tolerable level of risk.
The selection of risk reduction measures can be made in a number of different ways. Sometimes, intuition, experience, and/or knowledge of the safety system designer is enough. In other cases, it is worth formalizing this process, and thus making use of the advantages of a procedural and systematic search for a solution. In this regard, good engineering practice can additionally be taken into account, and mandatorily—the regulations and guidelines contained in safety standards need to be included.
The manners of selecting risk reduction measures can generally be divided into conformist (resulting from the legislative approach and assuming a relative stability of methods and measures) and creative ones [34]—oriented towards searching for innovative activities capable of eliminating hazard sources. The model of selecting risk reduction measures based on the assessment of their efficacy can be applied in both these approaches.
The decision-making problem presented here is, in the simplest form, a task of linear programming. It can be solved with known methods—using the Simplex algorithm with constraints for variables or the Branch-and-Bound method. These methods are implemented in the Solver type software add-ons, for instance in MS Excel. The problem of obtaining the optimal structure of a safety system appears, however, when, for instance:
  • the efficacy of risk reduction measures is a non-linear time-dependent function;
  • the use of one risk reduction measure excludes the use of another;
  • elements/items of the choice set are predefined sets of risk reduction measures;
  • a certain combination of measures affects the efficacy of the others.
In such cases, safety system structure optimization is a specific non-linear problem which needs dedicated models in order to be worked out. They usually require considerable labor input and knowledge to be prepared. As we have demonstrated in this article, it is possible to use a sequential search with distinctively specified elements of the decision-making space or the so-called choice set. This is manifested in the examples of the use of such models in more complex decision-making problems, e.g., [35,36,37,38]. The authors of [38] discussed the problem of linear search over multiple sequences in order to identify one sequence with a desired statistical feature. Bearden and Connolly [37] describe empirical and theoretical results from two multi-attribute sequential search tasks. Decision makers must frequently choose among options that they encounter sequentially, and whose values are initially revealed only imperfectly. A two-agent model of a sequential search and choice with a concept similar to the one presented in this article was proposed by Mauring in [39]. However, she expands the standard search model (sequential search models with recall), allowing the preferences according to which the final choice is made to differ from the preferences based on which the search is carried out. In the model presented here, two stages of calculations can also be distinguished, yet the preferences of the decision maker are stable (they were listed earlier as the conditions for the choice of the safety system structure). The difference also consists in determining the choice set, the individual elements of which are not single items, but sets of safety system elements generated as combinations without repetitions from a finite (predefined) set of the so-called risk reduction measures (safety measures).
The selection of the optimization criterion remains an open issue. By assumption, it should be a simple model, so that the entities using it (enterprises) can quickly adapt it to the changing conditions, usually having limited resources and information at their disposal. Moreover, in accordance with the assumed purpose of the article, the model needs to take into account the results of the risk analysis—quantitative data, i.e., risk values.
This article shows how to:
  • formulate a decision-making problem concerning the optimization of safety system structure, which is an original decision-making problem due to the specific manner of functioning of these systems;
  • prepare a mathematical model for the optimization of safety system structure in the matrix form;
  • develop an algorithm for searching for the optimal solution, which—if needed—makes it possible to take into account additional conditions of the decision-making situation causing nonlinearity of the model.
The advantages of the developed model of a decision-making problem include the matrix mapping of the dependencies concerning the functioning of safety systems. This makes it easy to derive aggregate decision-making variables, such as the efficacy indicator or the risk reduction potential indicator. Moreover, instead of efficacy expressed in a binary way, its values can be provided in the form of any given numerical measures, obtained according to any given concept, e.g., the efficacy concept presented in [20] or in the guidelines of the EN 50126-2 standard [18].
The structure of the model of the sequential search type expressed in the form of a computer algorithm makes it possible to take into consideration different cases of the occurrence of nonlinearity through the implementation of simple conditional instructions. The model ensures that a solution will be found without the Branch-and-Bound or Simplex type of heuristics. Elements/items of the choice set are generated as combinations without repetitions, which can be replaced e.g., with sets of measures recommended by regulations, for instance with measures recommended in order to achieve a specific safety integrity level (SIL).
Among the potential flaws of the proposed model, the possible burden on computer resources and the time needed to find the solution should be listed. However, the current computing power of average personal computers seems to point to the small significance of this problem, especially—as the author of [40] points out—as a linear search is the fastest algorithm for data searching. Certainly, the solutions obtained will be correct in so far as the assumed model parameters will correspond to reality.

Author Contributions

Conceptualization, A.G.; methodology, A.G.; software, A.G.; writing, A.G. and P.S. All authors have read and agreed to the published version of the manuscript.

Funding

This research was funded from the resources under the statutory activities of the Faculty of Civil Engineering and Transport, Poznan University of Technology.

Institutional Review Board Statement

Not applicable.

Informed Consent Statement

Not applicable.

Data Availability Statement

Not applicable.

Conflicts of Interest

The authors declare no conflict of interest. The funders had no role in the design of the study; in the collection, analyses, or interpretation of data; in the writing of the manuscript, or in the decision to publish the results.

References

  1. Perrow, C. Normal Accidents: Living with High-Risk Technologies; Princeton University Press: Princeton, NJ, USA, 1984. [Google Scholar]
  2. Le Coze, J.C. 1984–2014. Normal Accidents. Was Charles Perrow Right for the Wrong Reasons? J. Contin. Crisis Manag. 2015, 23, 275–286. [Google Scholar] [CrossRef]
  3. Liu, S.; Lin, Y. Grey System Theory and Application; Emerald Publishing: Bingley, UK, 2011; ISBN 978-1-61284-490-9. [Google Scholar]
  4. Cempel, C. Teoria szarych systemów—Nowa metodologia analizy i oceny złożonych systemów: Przegląd możliwości. Zesz. Nauk. Politech. Poznańskiej. Organ. Zarządzanie 2014, 63, 9–20. [Google Scholar]
  5. Głodek, W. Automatyka zabezpieczeniowa w przemyśle procesowym—Przegląd unormowań. Warsztaty SIPI61508 2003, 3, 1–10. [Google Scholar]
  6. International Electrotechnical Commission. IEC 61508 Functional Safety of Electrical/Electronic/Programmable Electronic Safety-Related Systems; International Electrotechnical Commission: Geneva, Switzerland, 2010. [Google Scholar]
  7. Summers, A.E. Introduction to layers of protection analysis. J. Hazard. Mater. 2003, 104, 163–168. [Google Scholar] [CrossRef]
  8. Vincoli, J.W. Basic Guide to System Safety; John Wiley & Sons, Inc.: Hoboken, NJ, USA, 2014; ISBN 9781118904589. [Google Scholar]
  9. Zhang, H.; Yuan, M.; Liang, Y.; Wang, B.; Zhang, W.; Zheng, J. A risk assessment based optimization method for route selection of hazardous liquid railway network. Saf. Sci. 2018, 110, 217–229. [Google Scholar] [CrossRef]
  10. Wang, L.; Qin, Y.; Xu, J.; Jia, L. A Fuzzy Optimization Model for High-Speed Railway Timetable Rescheduling. Discret. Dyn. Nat. Soc. 2012, 2012, 827073. [Google Scholar] [CrossRef]
  11. Dinmohammadi, F. A risk-based modelling approach to maintenance optimization of railway rolling stock. J. Qual. Maint. Eng. 2019, 25, 272–293. [Google Scholar] [CrossRef]
  12. Mousavi-Bideleh, S.M.; Berbyuk, V. Multiobjective optimisation of bogie suspension to boost speed on curves. Veh. Syst. Dyn. 2016, 54, 58–85. [Google Scholar] [CrossRef]
  13. Podofillini, L.; Zio, E.; Vatn, J. Risk-informed optimisation of railway tracks inspection and maintenance procedures. Reliab. Eng. Syst. Saf. 2006, 91, 20–35. [Google Scholar] [CrossRef]
  14. Vatn, J.; Aven, T. An approach to maintenance optimization where safety issues are important. Reliab. Eng. Syst. Saf. 2010, 95, 58–63. [Google Scholar] [CrossRef]
  15. Mahboob, Q.; Schöne, E.; Maschek, U.; Trinckauf, J. Investment into Human Risks in Railways and Decision Optimization. Hum. Ecol. Risk Assess. Int. J. 2015, 21, 1299–1313. [Google Scholar] [CrossRef]
  16. Gabbar, H.A.; Suzuki, K.; Shimada, Y. Design of plant safety model in plant enterprise engineering environment. Reliab. Eng. Syst. Saf. 2001, 73, 35–47. [Google Scholar] [CrossRef]
  17. European Standards. EN 50129 Railway Applications—Communication, Signalling and Processing Systems—Safety-Related Electronic Systems for Signalling; European Standards: Pilsen, Czech Republic, 2018. [Google Scholar]
  18. European Standards. EN 50126-2 Railway Applications. The Specification and Demonstration of Reliability, Availability, Maintainability and Safety (RAMS) Systems Approach to Safety; European Standards: Pilsen, Czech Republic, 2017. [Google Scholar]
  19. European Commission. Commission Implementing Regulation (EU) No 402/2013 of 30 April 2013 on the Common Safety Method for Risk Evaluation and Assessment and Repealing Regulation (EC) No 352/2009; European Commission: Brussels, Belgium, 2013. [Google Scholar]
  20. Gill, A.; Smoczyński, P. Layered model for convenient designing of safety system upgrades in railways. Saf. Sci. 2018, 110B, 168–176. [Google Scholar] [CrossRef]
  21. Gill, A. Layered Models of Safety Systems for Rail Transport Applications; Wydawnictwo Politechniki Poznańskiej: Poznań, Poland, 2018; ISBN 978-83-7775-517-4. [Google Scholar]
  22. Mahboob, Q.; Zio, E. Handbook of RAMS in Railway Systems: Theory and Practice; CRC Press: Boca Raton, FL, USA, 2018; ISBN 1351978799. [Google Scholar]
  23. Burkhalter, M.; Adey, B.T. Modelling the Complex Relationship between Interventions, Interventions Costs and the Service Provided When Evaluating Intervention Programs on Railway Infrastructure Networks. Infrastructures 2020, 5, 113. [Google Scholar] [CrossRef]
  24. Mehlhorn, K.; Sanders, P. Algorithms and Data Structures; Springer: Berlin/Heidelberg, Germany, 2008; ISBN 978-3-540-77977-3. [Google Scholar]
  25. Eiselt, H.A.; Sandblom, C.-L. Operations Research; Springer Texts in Business and Economics; Springer: Berlin/Heidelberg, Germany, 2012; ISBN 978-3-642-31053-9. [Google Scholar]
  26. Gill, A.; Smoczyński, P. Adaptation of the Rules of the Models of Games with Nature for the Design of Safety Systems BT—Information Technology in Disaster Risk Reduction; Murayama, Y., Velev, D., Zlateva, P., Eds.; Springer International Publishing: Cham, Switzerland, 2019; pp. 67–80. [Google Scholar]
  27. Hughes, B.P.; Anund, A.; Falkmer, T. System theory and safety models in Swedish, UK, Dutch and Australian road safety strategies. Accid. Anal. Prev. 2015, 74, 271–278. [Google Scholar] [CrossRef] [PubMed]
  28. Harms-Ringdahl, L. Analysis of safety functions and barriers in accidents. Saf. Sci. 2009, 47, 353–363. [Google Scholar] [CrossRef] [Green Version]
  29. Harms-Ringdahl, L. Guide to Safety Analysis for Accident Prevention; IRS Riskhantering AB: Stockholm, Sweden, 2013; ISBN 9789163731648. [Google Scholar]
  30. Harms-Ringdahl, L. Investigation of barriers and safety functions related to accidents. In Safety and Reliability, Proceedings of the ESREL 2003 Conference, Maastricht, The Netherlands, 15–18 June 2003; Routledge: London, UK, 2003; pp. 1–8. [Google Scholar]
  31. Kadziński, A. Study on Selected Dependability Aspects of Systems and Rail Vehicles Objects; Wydawnictwo Politechniki Poznańskiej: Poznań, Poland, 2013; ISBN 9788377752890. [Google Scholar]
  32. Bianchini, A.; Donini, F.; Pellegrini, M.; Saccani, C. An innovative methodology for measuring the effective implementation of an Occupational Health and Safety Management System in the European Union. Saf. Sci. 2017, 92, 26–33. [Google Scholar] [CrossRef]
  33. International Electrotechnical Commission. EN IEC 60812 Failure Modes and Effects Analysis (FMEA and FMECA); International Electrotechnical Commission: Geneva, Switzerland, 2010. [Google Scholar]
  34. Studenski, R. Organization of Safe Work in the Enterprise; Wydawnictwo Politechniki Śląskiej: Gliwice, Poland, 1996. [Google Scholar]
  35. Mak, V.; Rapoport, A.; Seale, D.A. Sequential search by groups with rank-dependent payoffs: An experimental study. Organ. Behav. Hum. Decis. Process. 2014, 124, 256–267. [Google Scholar] [CrossRef]
  36. Li, L.; Khan, F.; Pesavento, M.; Ratnarajah, T.; Prakriya, S. Sequential search based power allocation and beamforming design in overlay cognitive radio networks. Signal Process. 2014, 97, 221–231. [Google Scholar] [CrossRef]
  37. Bearden, J.N.; Connolly, T. Multi-attribute sequential search. Organ. Behav. Hum. Decis. Process. 2007, 103, 147–158. [Google Scholar] [CrossRef]
  38. Heydari, J.; Tajer, A.; Poor, H.V. Quickest Linear Search over Correlated Sequences. IEEE Trans. Inf. Theory 2016, 62, 5786–5808. [Google Scholar] [CrossRef]
  39. Mauring, E. A two-agent model of sequential search and choice. J. Econ. Behav. Organ. 2016, 123, 122–137. [Google Scholar] [CrossRef] [Green Version]
  40. Limoncelli, T.A. 10 optimizations on linear search. Commun. ACM 2016, 59, 44–48. [Google Scholar] [CrossRef]
Figure 1. Algorithm for generating the optimal solution.
Sustainability 13 10700 g001
Table 1. A set of selected risk reduction measures for application in a safety system in railway transport used to control hazards generated by systematic factors and based on the EN 50129 standard [17].
RRM IDRisk Reduction Measures
RRM1Audit of tasks as safety planning and quality assurance activities
RRM2Verification of the correctness and consistency of project requirements
RRM3Software version control
RRM4Operator/maintainer-friendly design features
RRM5Post-assembly and final tests with appropriate reports
RRM6Service personnel training
RRM7Supervision of the performance of installation work
RRM8Audits/periodic device inspections
RRM9Activities involving communication of the risk (raising awareness related to technical safety and cybersecurity)
RRM10Computer-aided specification tools
RRM11Program sequence monitoring
RRM12Failure and hazard analysis using RBD, cause–consequence diagrams or ETA methods
Table 2. Systematic failure categories based on EN 50126 [18].
HSSystematic Failure Categories (Hazard Sources)
HS1Errors in the requirements, including inherent weaknesses
HS2Design and realization inadequacies in all phases of product life cycle
HS3Software errors
HS4Operating instruction deficiencies
HS5Human errors
Table 3. List of hazards related to the area of application of the safety system.
HHazard
H1The possibility of the train driving along an unguarded category A level crossing
H2The possibility of two trains driving along one track in opposite directions
H3The possibility of two trains driving along one track in the same direction
H4The possibility of the train driving with excessive speed across an area with a speed limit
Table 4. The results of the realization of the algorithm of the method for a system comprising three of the twelve risk reduction measures (RRM).
Realization NumberRRM NumbersValue of Risk Reduction by the System *Cost (% of Project Budgets)Sum of Risk Reduction Indicators (Ei)Efficacy Function (EF) Values
81, 2, 104.95223%2.301115240.0999515
622, 3, 105.40214%2.510223050.0557719
702, 4, 105.424%2.509293680.0956444
772, 5, 104.87427%2.264684020.1192219
832, 6, 105.417%2.509293680.0677481
922, 8, 105.5518%2.578996280.0697946
952, 9, 104.5816%2.128252790.0751790
992, 10, 125.15231%2.394052050.1294876
* the value was determined as the sum of the degrees of risk reduction by risk reduction measures. Underline: it indicates the suboptimal solution, which is characterized by the lowest value of the efficacy function in the case of a three-element system structure.
Table 5. A summary of selected characteristics of safety system optimization concerning communication, data processing, and railway traffic control.
Designation of the m choose k combinationNumbers of Risk Reduction MeasuresNumber of CombinationsNumber of Acceptable SolutionsTotal Value of Risk ReductionEfficacy Function (EF) Values
12 choose 2--660----
12 choose 32, 3, 1022085.4020.0557719
12 choose 42, 3, 6, 94951434.9320.0436334
12 choose 51, 2, 3, 6, 87925056.7040.0706205
12 choose 61, 2, 3, 6, 8, 99248087.1340.0754135
12 choose 71, 2, 3, 6, 8, 9, 107927729.2840.0834468
12 choose 81, 2, 3, 4, 6, 8, 9, 1049549510.5340.0960167
12 choose 91, 2, 3, 4, 6, 7, 8, 9, 1022022010.9340.1102177
12 choose 101, 2, 3, 4, 6, 7.8, 9, 10, 11666611.3880.1285047
Underline: it indicates the suboptimal solution, which is characterized by the lowest value of the efficacy function in the case of a three-element system structure.
Publisher’s Note: MDPI stays neutral with regard to jurisdictional claims in published maps and institutional affiliations.

