Abstract
In this study, three full-scale experiments and a series of numerical simulations were conducted to investigate the influence of subway platform height and atrium ceiling height of subway stations on smoke control by mechanical exhausting systems. The smoke temperature variation with time, maximum temperature distribution, and smoke stratification were discussed. Results showed that the atrium had capacity to store smoke, especially at the early stage of smoke spread. However, the efficiency of smoke extraction did not increase simply with the rise in platform height and atrium ceiling height, and favorable smoke exhaust velocity was crucial for smoke elimination. The optimal smoke exhaust velocity was studied by numerical simulation and it was found that the area of smoke diffusion in subway stations with a higher platform was significantly smaller under the optimal smoke exhaust velocity. In addition, a prediction model of optimal smoke exhaust velocity with subway platform height was proposed. This study could provide on-site data and smoke spread characteristics for smoke control design, operation, and, significantly, guide safety evacuation of the exhaust system of subway stations.
1. Introduction
As a significant means of transportation in the modern city, the subway system has been developed rapidly due to the advantages of large transportation, high velocity, punctuality, and low energy consumption. There has been a dramatic growth in Chinese subway systems with incredible velocity and scale in the past thirty years. By the end of 2020, a total of 6300 kilometers of subway lines had been built in China. Due to the closed environment of the underground space and consistently high pedestrian flow, one of the key issues for subway security are fire accidents that could lead to overwhelming injuries and casualties [1,2,3]. Statistics have shown that about 85% of the casualties were attributed to the toxic smoke during fire accidents rather than the flame [4,5]. In Baku, Azerbaijan’s capital, a large fire occurred in the subway station and there were 289 people killed and 265 people injured [6]. Studies on smoke control could help reduce casualties and property loss, and provide guidance for evacuation of people once fire occurs.
Many studies have focused on ventilation and smoke control problems in subway stations, through scale-model experiments, numerical simulations, and full-scale experiments. Hu et al. [7,8] found the use of air curtains could confine smoke diffusion and carbon monoxide experimentally and numerically. Nguyen et al. [9] presented a realistic model to optimize evacuation strategies, taking the level of visibility into consideration. They confirmed the dramatic impact of smoke and blind evacuation strategy on the casualties. Giachetti et al. [10] carried out experiments to research smoke movement in case of island platform fire. Rie et al. [11] analyzed the optimal emergency mode of operating a comprehensive smoke ventilation system both numerically and experimentally and achieved good results. The influence of relative position between mechanical exhaust and fire was investigated by Vauquelin and Mégret [12]. They concluded that the position of ceiling extraction regarding fire position had a quite negligible effect on smoke removal in a tunnel. In addition, some scholars [13,14,15,16] have concentrated on the effect of the burning area, side wall, and smoke screen on the maximum smoke temperature distribution. Through small-scale experimental and numerical studies, Wang et al. [17] researched a hybrid ventilation system in a large subway depot and proposed a critical velocity range to maintain the temperature at the bottom layer. Ivanov et al. [18] proposed a sustainable new hybrid design combining the advantages of static and dynamic systems, which could result in a lower smoke temperature and higher smoke-layer interface height. The approach for assessing various smoke control methods has been outlined by Yao et al. [19], and an effective smoke exhaust strategy was suggested. Juraeva et al. [20] produced a two-equation turbulence model for train-induced unsteady flow and focused on computational analysis for the improvement of the tunnel ventilation and the environment control system of the subway. Some scholars [21,22,23] used different ventilation modes to investigate the effect of smoke confinement and discussed the influence of piston wind on the smoke flow in the platform fire scenarios. The effects of the number of accesses and ventilation modes on smoke diffusion in subway stations were studied by Giachetti et al. [24]. Meng et al. [25] analyzed the effect of smoke screen height on temperature distribution of fire-induced flow beneath platform ceilings of subway stations. Results showed that the temperature profile could be well correlated by an exponential decay function. Jae Seong Roh [26] simulated the process of smoke diffusion in a three-story subway station, and found that fire-proof doors and ventilation systems were also beneficial to personnel evacuation. Ou Yang [27] combined theoretical analysis with numerical simulation to study possible ventilation modes for smoke exhaust systems in metro station fires, and different smoke exhaust effects in different fire scenarios were conducted. Liu et al. [28] discussed the ventilation mode by Fire Dynamics Simulator (FDS) numerical simulation and full-scale experiments. They found the semi-hybrid ventilation mode could provide a safe evacuation environment to the greatest extent, by utilizing the co-operation of tunnel ventilation fans (TVFs), jet flow, and downstream ceiling extraction.
Several researchers have concentrated on smoke spread in atrium-type subway stations. Chow et al. [29] investigated the smoke distribution in three types of atrium spaces by using two types of deterministic fire models: zone models and field models. Results showed that, compared to field models, using zone models could give more detailed information on fire-induced flow and temperature fields while requiring much more computing time. Huo et al. [30] determined an important equation for predicting smoke-layer height through a series of full-scale burning tests in atria. Gao et al. [31] studied the effects of ventilation form, fire source location, and heat release rate on platform fires. Results indicate that mechanical ventilation could confine smoke spread in a horizontal direction effectively. Liu et al. [32] investigated the ceiling temperature, smoke-layer thickness, and temperature distribution in subway stations by experiment and numerical simulation. Wu et al. [33] conducted numerical simulation to research the ceiling temperature distribution of an atrium subway station under different fire locations. Results showed that smoke spread quickly on the platform at the initial stage and then it entered the staircase once the smoke exhaust system was absent.
As mentioned above, existing research on smoke control in subway station fires mainly focused on the influence of different smoke exhaust modes or parameters. However, few studies have been conducted on the influence of platform height and the atrium-type station ceiling height on smoke control. Since smoke exhaust tubes are installed under the ceiling, the ceiling height is crucial to investigating the optimal smoke exhaust strategy and safety evacuation in the platform fire scenario. Therefore, it is worthwhile to address this issue.
In this study, full-scale experiments and Fire Dynamics Simulator (FDS) simulation were carried out to research the smoke exhaust effect in subway stations with different platform heights and atrium ceiling heights. The smoke temperature variation with time, maximum temperature distribution, and smoke stratification were analyzed. The aim of this study was to investigate the relationship between the platform height and atrium ceiling height with optimal smoke exhaust velocity. It would provide reference for the design and control the exhaust system of subway stations.
2. Full-Scale Model Experiments
In order to study the influence of different subway station platforms and atrium heights on smoke control, three subway stations were selected for full-scale experiments through investigation. Due to the high cost and danger of the full-scale fire experiment, only three groups of experimental data were used for analysis in this study.
2.1. The Experimental Subway Station
A series of full-scale tests were carried out in three subway stations with different platform heights. Two of them were atrium-type stations. The schematic diagrams of three experimental subway stations are shown in Figure 1, Figure 2 and Figure 3.

Figure 1.
The schematic diagram of experimental station A.

Figure 2.
The schematic diagram of experimental station B.

Figure 3.
The schematic diagram of experimental station C.
Station A was an island-type station. The dimensions of the platform were 132 m length × 12 m width × 5.6 m height, and the net dimensions of the station hall concourse were 132 m × 12 m × 4.9 m. The middle part of the platform was a public area. Two groups of escalators and stairs were symmetrically arranged.
The platform height of station B was 5.4 m. It was located on the second floor of the basement, with dimensions of 158 m × 14 m. The concourse was at basement 1 with the same length and width. The platform was equipped with four escalators. An atrium with a height of 9.4 m and an area of 696 m2 was set at the center of station B. The atrium area on the platform floor and the common area on the station concourse were in the same smoke compartment.
At station C, there was an atrium of 13.5 m height and 512 m2 area. The platform geometry was 219.1 m long, 20.9 m wide, and 5.2 m high. There were two sets of ascending escalators and stairs at the platform.
2.2. Instruments and Measurements
2.2.1. Fire Source and Exhaust Plan
Prior to these full-scale experimental tests, the equipment and the ventilation system of the station were already completed. In the full-scale experiments, ethanol (95%) was used as the fuel of the pool fire, and the area of the oil pan was set to be 0.5 m2. As shown in Figure 4, a smoke generator was employed to consistently produce smoke for better observation of the smoke movement. The common platform fire was caused by luggage. The safety of the full-scale experimental subway stations was taken into consideration. The heat release rates of the fire source in the three tests were all set 0.7 MW based on a previous study [34]. The details of the test conditions are shown in Table 1.
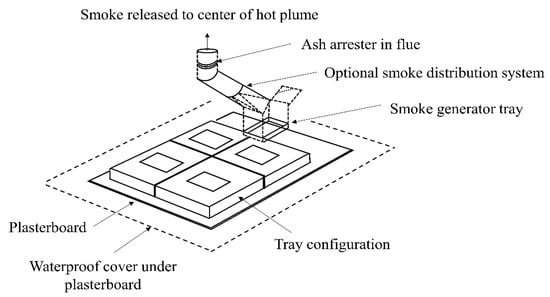
Figure 4.
Schematic diagram of the hot smoke test device.

Table 1.
Full-scale experimental conditions.
The movement of smoke in an atrium has been discussed in details for three different fire source locations [15,27,31]. Considering the unfavorable fire conditions, the fire source was placed near the inlet of the escalator at platform. In addition, to investigate the influence of atrium height on smoke control, the fire source of station B and station C was placed inside the atrium, as shown in Figure 5, Figure 6 and Figure 7.
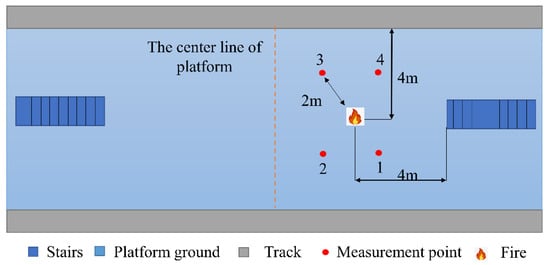
Figure 5.
The location of the fire source at station A.

Figure 6.
The location of the fire source at station B.

Figure 7.
The location of the fire source at station C.
2.2.2. Apparatus and Test Parameters
Two methods were used to measure the settlement of the smoke layer [21]. One way was to settle an air-sampling instrument at the platform to estimate the change in smoke concentration. Another method was to judge smoke-layer descent by measuring the temperature change at different positions of the thermocouple tree. In the tests, measurement systems were set as follows: (1) For station B and station C, with a high atrium, a K-type thermocouple tree was used to record the temperature from 2.5 m to 9.0 m height above the fire source. Thermocouple measurement range has been found to be 0–1300 °C with accuracy of ±0.75%. From 2.5 m to 4.0 m above the fire source, the vertical distance between each two sets of thermocouples was 0.5 m. To obtain the temperature at the height of human eyes and the platform ceiling, the vertical interval was set as 1.0 m in a 4.0–9.0 altitude range, as shown in Figure 8b,c. Two measurement points were set in the platform and hall, respectively, to record the environment temperature change, at 2 m height. (2) For station A with a 5.6 m-height platform, four measuring points (points 1–4) were symmetrically arranged around the fire source, as in Figure 5. The longitudinal distance between the four measurement points and the fire source was 2 m. Each measuring point was arranged with six thermocouples in the vertical direction, with the height ranging from 1.5 m to 3.0 m, as shown in Figure 8a.

Figure 8.
Schematic diagram of smoke temperature measurement points: (a) Measurement points of station A; (b) Measurement points of station B; (c) Measurement points of station C.
3. Numerical Simulation
3.1. Numerical Model Setup
As shown in Figure 9, Figure 10 and Figure 11, the numerical simulation models of subway stations were established by Fire Dynamics Simulator (FDS) software. Figure 9 shows the atrium-type station simulation model. The concourse was 182 m × 22 m × 3.5 m in size, and the dimensions of the platform were 155 m × 15 m × 5.4 m, with a 9.4 m atrium height. There were three subway entrances and three escalators. The dimensions of the platform shown in Figure 10 were 132 m × 12 m × 3.8 m, and the size of the concourse was 97 m × 13 m × 3.8 m, with three escalators and one ladder. The subway model in Figure 11 presents a 132 m × 12 m × 5.5 m platform, and a 132 m × 13 m × 3.8 m station hall, with two escalators. The station entrances were set as “SUPPLY”, and the exhaust vents were arranged symmetrically with the dimensions of 1 m × 1 m and set to be “EXHAUST”. The structural materials of wall, ceiling, and floor were all set as “INERT”. In addition, the initial conditions were as follows: the temperature was 20 °C, the pressure was 1.01 × 10⁵ Pa, and the smoke concentration was 0 mol/mol.

Figure 9.
Subway station simulation model with a 9.4 m atrium.

Figure 10.
An island subway station simulation model with a 3.8 m platform.
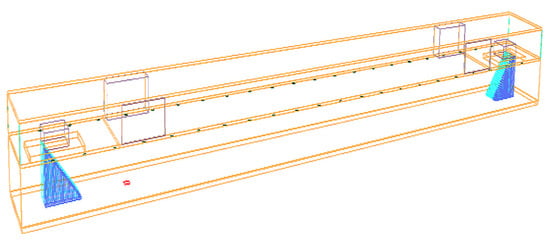
Figure 11.
An island subway station simulation model with a 5.5 m platform.
3.2. Sensitive Study on Grid System
In LES numerical simulation, the Prandtl number (Pr) and the Schmidt number (Sc) are two important values that must be ensured. Pr (from 0.2 to 0.7) and Sc (from 0.1 to 0.8) were adjusted to obtain suitable values for simulation in the current research [2,31,35]. The value of Pr was set to be 0.4 and Sc varied from 0.1 to 0.8 (0.1, 0.2, 0.3, 0.4, 0.5, 0.6, 0.7, 0.8). The predicted results agreed well with the experimental data when Sc = 0.4. Next, different Pr values were set to see if there was a better Pr value when Sc = 0.4. Above all, the value of Pr and Sc were selected to be 0.4 and 0.4, respectively, in this study.
Grid-system generation is often considered the most time-consuming aspect, and it plays a significant role in determining the quality of the numerical results. The range of dimensionless quantity D*/δx was from 4 to 16 in previous studies [31,35,36,37]. The fire D* can be expressed as:
where D* is the characteristic grid length (m), Q is the heat release rate (kW), ρa is the ambient air density (kg/m3), cp is the specific heat of air at constant pressure (kJ/(kg‧K)), Ta is the ambient temperature (K), and g is the gravitational acceleration (m/s2).
In this study, the mesh size was set as 0.125 m × 0.125 m × 0.125 m near the fire area (within 60 m away from the fire source) and 0.25 m × 0.25 m × 0.25 m in other regions. In addition, the value of D*/δx was 5.07 near the fire area and the value of D*/δx was 10.14 in other regions.
Some studies [35,36] showed that the fire source area was the most sensitive to the grid density, the buoyancy plume area was the second most sensitive area, and the smoke-layer area was less sensitive. In order to control the calculation time, the encrypted fire area grid could effectively improve the calculation accuracy. Due to the relatively large temperature and velocity change near the fire source, the grid system was refined near the fire source (within 60 m away from the fire source), and three grid sizes were selected near the fire source. The grid in other regions was defined as the grid size of the other simulation areas. The grid settings are shown in Table 2.
Table 2.
Grid systems.
Smoke temperature under the platform ceiling in the near-fire area and other regions of above grid sizes are shown in Figure 12 and Figure 13. Part of calculation results could achieve convergence. Considering the requirement of saving calculation time as much as possible, the grid size near the fire source was selected as 0.125 m × 0.125 m × 0.125 m while the grid size in other areas was 0.25 m × 0.25 m × 0.25 m.

Figure 12.
Smoke temperature beneath the platform ceiling near-fire area for the three grid systems.

Figure 13.
Smoke temperature beneath the platform ceiling in other regions for the three grid systems.
3.3. Simulated Conditions
For different heights of subway platforms, by changing the arrangement of the smoke vents, various smoke exhausting velocities could be obtained. The maximum heat release rate in passenger luggage fire is generally considered to not exceed 2 MW [19,21]. When fire occurs on a subway platform, the effect of the subway smoke exhaust system is closely related to the fire heat release rate. In order to ensure the effectiveness of the smoke exhaust effect, a 2 MW fire heat release rate was identified as the most unfavorable condition of the subway platform fire in this study. In addition, by changing the number of smoke vents with the same size 1 m × 1 m, various smoke exhausting velocities could be realized for the same air volume rate. The numerical conditions of fire design are shown in Table 3.
Table 3.
Numerical conditions of fire design.
3.4. Validation of Numerical Simulation
Taking the fire-limiting conditions into consideration, a further study on the smoke diffusion of subway station fires was carried out by numerical simulation. In order to verify the accuracy of the model simulation results in this study, a numerical model identical to Test 1 was firstly established. Next, a comparison between the full-scale tests and simulation result was obtained. As shown in Figure 14, the four temperature measurement points obtained in Test 1 and numerical results were compared. They had a good consistency, although there were some errors (2%, 8.7%, 7%, 4.3%, respectively). From the good agreement, the reliability of the results obtained from the numerical analysis was verified. Therefore, numerical simulation could be used for further research.

Figure 14.
Comparison of experimental and simulation results of temperature distribution.
4. Results and Discussion
4.1. Experiment Results and Analyses
4.1.1. Smoke Diffusion
It can be seen from the full-scale experimental phenomena at 300 s after the ignition from Figure 15, Figure 16 and Figure 17, that there were large differences in the efficiency of smoke control among them.

Figure 15.
The smoke diffusion in Test 1 at station A.

Figure 16.
The smoke diffusion in Test 2 at station B.
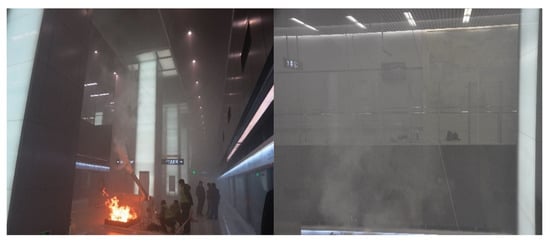
Figure 17.
The smoke diffusion in Test 3 at station C.
At 120 s after the ignition in Test 1 at station A, the production of smoke was steady. As shown in Figure 15, the clear smoke stratification formed vertically in the subway platform, owing to the comprehensive effect of smoke buoyance force [18,30,33]. High-temperature smoke would flow upward under the influence of the stack effect, and the smoke layer would change with the variation of the height between smoke and fresh air. At 300 s, smoke reached the platform ceiling then descended to a certain extent, and the smoke-layer height was about 2.5 m above the ground.
In Test 2, Figure 16 shows the smoke accumulation in the station B atrium. There was no obvious smoke accumulation in the public area of the station atrium, and the smoke mainly gathered in the vertical direction above the fire source. The upward diffusion rate was high, and the smoke layer was quickly formed on the top of the platform and effectively removed through the upper smoke vents. Different from that of Test 2, smoke rose vertically in Test 3 until it impinged on the platform ceiling and diffused in a horizontal direction, then descended to a certain extent on different locations. It can be observed from Figure 17 that the smoke accumulation was obvious in the station atrium, the station floor, and the public area of the platform. Meanwhile, the visibility was very low, causing great difficulties for evacuation. Due to the low exhaust velocity, the exhaust system failed to extract the smoke effectively.
4.1.2. Temperature Distribution
To discuss the heat accumulation in subway stations, it is necessary to compare the smoke layer maximum temperature Ti, max, which changes with the height. The maximum temperature of the four measurement points in Test 1 (T1, max, T2, max, T3, max, T4, max) are presented in Figure 18. The smoke maximum temperature had a stratification above the fire caused by the stable smoke layer formed at different heights. The smoke spread on both sides of the fire, and continuously entrained heat to the surrounding air, thereby reducing heat accumulation in the smoke layer. The smoke maximum temperature decreased as the height increased in certain regions. Although the same horizontal distance 2 m between measurements and the fire source, the maximum ceiling temperatures at points 1–4 were 19 °C, 45 °C, 26.2 °C, and 18 °C, respectively. Smoke rose upward under the influence of buoyancy force, and, after hitting the platform ceiling, it spread along the platform horizontal direction. Due to the influence of the air inlet at the platform stairs, smoke movement caused uneven temperature distribution in a horizontal direction.

Figure 18.
Maximum temperature at different heights in Test 1.
Figure 19 illustrates the maximum temperature of smoke layers with different heights above the fire source in Test 2 and Test 3. With an increase in measuring height, the maximum temperature decreased gradually. Both Test 2 and Test 3 had the same temperature descent trend. Temperature dropped down quickly from 2.5 m to 7.0 m (2.4 m below the atrium ceiling of station B) and from 2.5 m to 5.0 m (8.8 m below the atrium ceiling of station C), respectively. Subsequently, the temperature tended to be stable, 55 °C and 30 °C, respectively. It was attributed to the fact that the lower thermocouples were directly affected by the flame, while the upper space formed a stable smoke layer. In addition, lower temperature was caused by the smoke storage capacity of higher atrium, which inhibited smoke deposition into lower height.

Figure 19.
Maximum temperature at different heights in Test 2 and Test 3.
Figure 20 shows the temperature variations at 2 m height of the platform and hall in Test 2 and Test 3. In Test 2, temperature at 2 m height of pedestrians was maintained at about 16 °C. In Test 3, the temperature was on an upward trend and the peak temperature reached 8 °C higher than the station initial ambient temperature. This may have been influenced by the large height of the atrium. When the temperature inside the station gradually rose, the inverted stack effect was produced by the atrium cold roof in winter, which inhibited smoke extraction and caused heat accumulation.
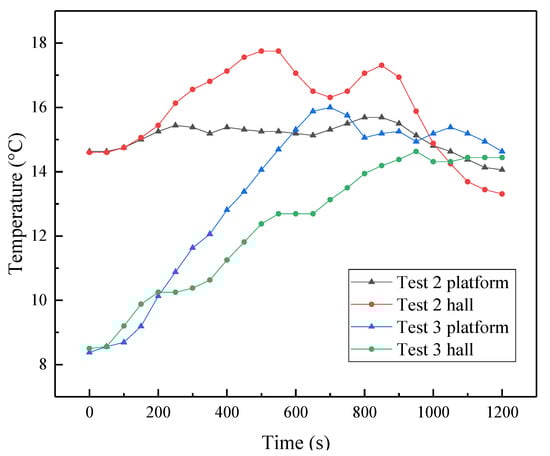
Figure 20.
Temperature at 2 m height above the floor in Test 2 and Test 3.
From the experiment results, the station atrium was beneficial for accumulating the smoke then exhausting it at the early stage. In previous studies, some scholars confirmed that a higher atrium could improve the efficiency of smoke extraction significantly [18,30,31]. Larger atrium space could strengthen the capacity for smoke storage, and also enhances the stack effect. It can drive the smoke flow upward quickly to the vents. However, although the atrium space was large, the experimental results showed that fire-induced smoke could rapidly diffuse in the whole subway station within a few minutes.
4.2. Simulation Results and Discussion
In this study, temperature at 2 m height in platforms was obtained to discuss the optimal smoke exhaust velocity for atrium subway stations with a fixed power fire. The exhaust velocity at 0.3 m height under the ceiling was researched for non-atrium subway stations. The horizontal temperature distribution was also acquired by measuring the temperature along the horizontal centerline at the steady state. It can be considered that the ventilation and smoke exhaust system was more effective with small temperature rise in subway station fires.
Figure 21 shows the variation of horizontal maximum temperature at 9.4 m height-atrium subway stations. The horizontal maximum temperature rose rapidly, mainly concentrated in the area of 5 m away from the fire source. The temperature range in other areas was relatively stable, about 10 °C. It may have been influenced by the high space of the atrium. Smoke mainly spread in the vertical direction near the fire source [30,31,32]. The smoke in a horizontal direction spread more slowly and formed a stable smoke layer above the fire source. The rise in horizontal smoke maximum temperature could be controlled at a relatively low level under 7.0 m/s, and the peak temperature was around 180 °C.
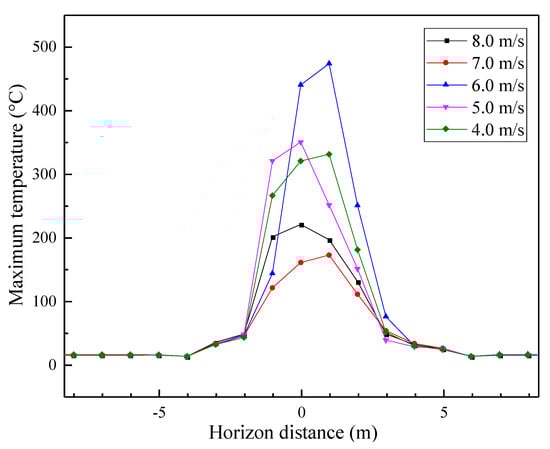
Figure 21.
Horizontal maximum temperature in a 9.4 m atrium subway station under different exhaust velocities.
It can be seen from Figure 22 that when the exhaust velocities were 7.3 m/s and 10.0 m/s, respectively, the temperature could be controlled at a relatively low level in the 3.8 m-platform island subway station. Figure 23 shows the horizontal maximum temperature variation along the length of the platform. Within 15 m away from the fire source, the maximum temperature was higher than other regions. This was a result of smoke accumulation in this area leading to heat assembling. Under 7.3 m/s, the peak temperature reached 260 °C and about 70 °C lower than that of 10.0 m/s.

Figure 22.
Temperature at 0.3 m under the ceiling in a 3.8 m-platform island subway station under different exhaust velocities.
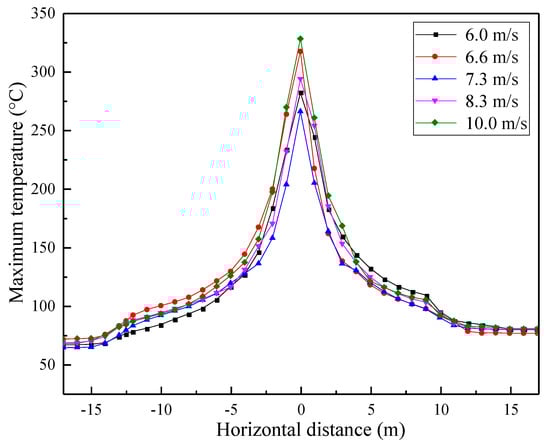
Figure 23.
Horizontal maximum temperature in a 3.8 m-platform island subway station under different exhaust velocities.
Figure 24 illustrates the ceiling temperature variations under different exhaust velocities in a 5.5 m-height-platform subway station. In the first 200 s, temperature rose gradually, then remained fluctuating within the range of 60–70 °C. As shown in Figure 25, the maximum temperature along the platform could be controlled at a relatively low level in case 6.6 m/s by comparison. The peak temperature reached 130 °C, 50 °C lower than that of 8.3 m/s. This means that under 6.6 m/s exhaust velocity, the smoke could be discharged better in a 5.5 m height subway platform.
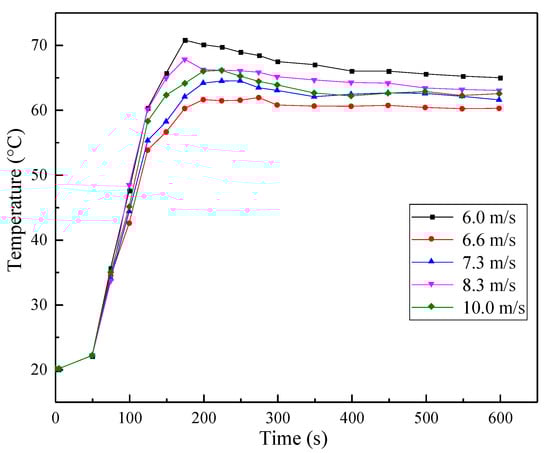
Figure 24.
Temperature at 0.3 m under the ceiling in a 5.5 m-platform island subway station under different exhaust velocities.

Figure 25.
Horizontal maximum temperature in a 5.5 m-platform island subway station under different exhaust velocities.
For a better observation of the smoke propagation in the subway stations, Figure 26, Figure 27 and Figure 28 show the smoke density of the three numerical stations at 100 s, 200 s, and 500 s under the optimal smoke exhaust velocity. In Figure 26, it can be seen that the station atrium could store large amounts of smoke after 200 s of ignition, and little smoke could spread out of the atrium. This is vitally important because the smoke under this condition could not spread to the area of safety escape. At 500 s after the ignition, smoke nearly filled the platform and concourse. This means that during the first 200 s period of the subway fire scenario, the atrium had a strong ability to store smoke. The vertical height space was conducive to suppressing the diffusion of smoke along the horizontal direction. The first six minutes after the fire would be the prime time for personnel to disperse, and the station atrium could greatly improve the efficiency of evacuation.

Figure 26.
Smoke density contour in a 9.4 m atrium station under 7.0 m/s exhaust velocity: (a) 100 s after ignition; (b) 200 s after ignition; (c) 500 s after ignition.

Figure 27.
Smoke density contour in a 3.8 m-height platform station under 7.3 m/s exhaust velocity: (a) 100 s after ignition; (b) 200 s after ignition; (c) 500 s after ignition.

Figure 28.
Smoke density contour in a 5.6 m-height platform station under 7.0 m/s exhaust velocity: (a) 100 s after ignition; (b) 200 s after ignition; (c) 500 s after ignition.
By comparing Figure 27 and Figure 28, the vertical dispersion of smoke was limited by the platform ceiling. The area of smoke propagation in subway stations with a higher platform was significantly smaller under the optimal smoke exhaust velocity. For example, at 100 s after ignition, the area of smoke propagation was obviously smaller in a 5.5 m-height platform than a 3.8 m-height platform. The same phenomenon appeared at 200 s. After 500 s, both 3.8 m and 5.5 m platforms were filled with smoke. However, the smoke density of a 5.6 m-height platform station was much lower than that of the station with a 3.8 m-height platform, as shown in Figure 27c and Figure 28c. Low smoke density indicates low toxicity and high visibility in the subway station, which is beneficial for evacuation.
Based on the above analysis, another four subway numerical models with 3.0 m, 4.5 m-, 6.8 m-, and 8.2 m-height platforms were established for simulation. Favorable exhaust velocities were also determined, 8.3 m/s, 6.8 m/s, 6.2 m/s, and 6.3 m/s, respectively. Figure 29 presents the fitting curve of the optimal smoke exhaust velocity with different platform heights. The R-squared was 0.96. This means that the coincidence degree of the fitting curve was good. The prediction model of the optimal smoke exhaust velocity with subway platform height can be expressed as:
where, V* is the optimal smoke exhaust velocity (m/s), and H is the subway platform height (m).
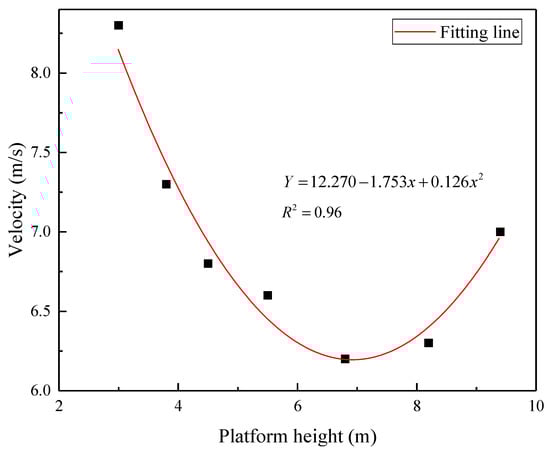
Figure 29.
Optimal smoke exhaust velocity fitting curve.
5. Conclusions
Three full-scale experiments and a series of numerical simulations were carried out to investigate smoke diffusion and temperature distribution in stations with different-height platforms. To verify the reliability of the simulation, a comparison between experimental results and numerical results was studied and achieved good agreement. Conclusions from the research are drawn as follows:
(1) For the full-scale experiments, temperature distributions above the fire source of three tests were obtained. It can be concluded that the higher the position above the fire source, the lower the maximum temperature would obtain. This was due to the fact that the lower thermocouples were directly affected by the flame, while the upper space formed a stable smoke layer. In Test 2 (station B) and Test 3 (station C), a stable smoke layer was formed at heights of 7.0–9.0 m in the atrium and temperature difference was slight between two tests. The environment maximum temperatures in the station halls were 17.8 °C and 16 °C.
(2) By comparing the experimental results of Test 1 (station A) and Test 2 (station B), the smoke storage capacity of the atrium in Test 2 was conducive to smoke removal at the early stage. Higher vertical space was also conducive to suppressing the diffusion of smoke along the horizontal direction. However, due to the low exhaust velocity in Test 3 (station C), the effect of smoke extraction was worse than that of Test 1 and Test 2. This phenomenon indicates that favorable exhaust velocity is crucial for smoke removal.
(3) Through the numerical simulation, results showed that the atrium could concentrate smoke within a 5 m area near the fire source and could confine the diffusion of smoke. The optimal smoke exhaust velocity of simulation stations was determined. It can be found that the area of smoke diffusion in subway stations with a higher platform was significantly smaller under the optimal smoke exhaust velocity. In addition, a prediction model of optimal smoke exhaust velocity with subway platform height was proposed.
Author Contributions
Conceptualization, D.X. and Y.L.; methodology, D.X. and Y.L.; software, D.X. and J.L. (Jiaxin Li); validation, D.X., Y.L., and J.L. (Junmei Li); formal analysis, D.X.; investigation, D.X. and J.Z.; resources, Y.L.; data curation, D.X. and J.Z.; writing—original draft preparation, D.X.; writing—review and editing, D.X. and Y.L.; supervision, Y.L.; funding acquisition, Y.L. All authors have read and agreed to the published version of the manuscript.
Funding
This research was funded by Beijing Natural Science Foundation (Grant No: 8172006) and Natural Science Foundation of China (Grant No: 51378040).
Institutional Review Board Statement
Not applicable.
Informed Consent Statement
Not applicable.
Data Availability Statement
The data presented in this study is available on request from the authors.
Acknowledgments
Great gratitude is extended to the experts for their opinion on the smoke control in subway fire.
Conflicts of Interest
The authors declare no conflict of interest.
References
- Qin, J.W.; Liu, C.C.; Huang, Q. Simulation on fire emergency evacuation in special subway station based on Pathfinder. Case Stud. Therm. Eng. 2020, 21, 100677. [Google Scholar] [CrossRef]
- Li, J.X.; Li, Y.F.; Li, J.M.; Li, X.J.; Huang, Y.B. Study on smoke control under mechanical exhaust strategy in a cross-type interchange subway station. Tunn. Undergr. Space Technol. 2021, 112, 103897. [Google Scholar] [CrossRef]
- Long, Z.; Liu, C.; Yang, Y.X.; Qiu, P.Y.; Tian, X.L.; Zhong, M.H. Full-scale experimental study on fire-induced smoke movement and control in an underground double-island subway station. Tunn. Undergr. Space Technol. 2020, 103, 103508. [Google Scholar] [CrossRef]
- Zhou, Z.P.; Irizarry, J.; Zhou, J.L. Development of a database exclusively for subway construction accidents and corresponding analyses. Tunn. Undergr. Space Technol. 2021, 111, 103852. [Google Scholar] [CrossRef]
- Yang, D.; Huo, R.; Zhang, X.L.; Zhu, S.; Zhao, X.Y. Comparative study on carbon monoxide stratification and thermal stratification in a horizontal channel fire. Build Environ. 2012, 49, 1–8. [Google Scholar] [CrossRef]
- Tsukahara, M.; Koshiba, Y.; Ohtani, H. Effectiveness of downward evacuation in a large-scale subway fire using Fire Dynamics Simulator. Tunn. Undergr. Space Technol. 2011, 26, 573–581. [Google Scholar] [CrossRef]
- Hu, L.H.; Zhou, J.W.; Huo, R.; Peng, W.; Wang, H.B. Confinement of fire-induced smoke and carbon monoxide transportation by air curtain in channels. J. Hazard. Mater. 2008, 156, 327–334. [Google Scholar] [CrossRef]
- Hu, L.H.; Fong, N.K.; Yang, L.Z.; Chow, W.K.; Li, Y.Z.; Huo, R. Modeling fire-induced smoke spread and carbon monoxide transportation in a long channel: Fire Dynamics Simulator comparisons with measured data. J. Hazard. Mater. 2007, 140, 293–298. [Google Scholar] [CrossRef] [PubMed]
- Nguyen, M.H.; Ho, T.V.; Zucker, J.D. Integration of Smoke Effect and Blind Evacuation Strategy (SEBES) within fire evacuation simulation. Simul. Model. Pract. Theory 2013, 36, 44–59. [Google Scholar] [CrossRef]
- Giachetti, B.; Couton, D.; Plourde, F. Smoke spreading analysis from an experimental subway scale model. Fire Saf. J. 2016, 86, 75–82. [Google Scholar] [CrossRef]
- Rie, D.H.; Hwang, M.W.; Kim, S.J.; Yoon, S.W. A study of optimal vent mode for smoke control of subway station fire. Tunn. Undergr. Space Technol. 2006, 21, 300–301. [Google Scholar] [CrossRef]
- Vauquelin, O.; Mégret, O. Smoke extraction experiments in case of fire in a tunnel. Fire Saf. J. 2002, 37, 525–533. [Google Scholar] [CrossRef]
- Meng, N.; Wang, Q.; Liu, Z.X.; Li, X.X.; Yang, H. Smoke flow temperature beneath tunnel ceiling for train fire at subway station: Reduced-scale experiments and correlations. Appl. Therm. Eng. 2017, 115, 995–1003. [Google Scholar] [CrossRef]
- Liu, Y.Q.; Liu, F.; Weng, M.C.; Obadi, I.; Geng, P.Q. Research on thermal-driven smoke control by using smoke curtains during a subway platform fire. Int. J. Therm. Sci. 2022, 72, 107255. [Google Scholar] [CrossRef]
- Ji, J.; Zhong, W.; Li, K.Y.; Shen, X.B.; Zhang, Y.; Huo, R. A simplified calculation method on maximum smoke temperature under the ceiling in subway station fires. Tunn. Undergr. Space Technol. 2011, 26, 490–496. [Google Scholar] [CrossRef]
- Chen, C.K.; Wng, W.Y.; Kang, H.; Shi, C.L.; Liu, H.Y. Experimental and numerical simulation analysis of temperature field of tunnel fire under different fire source areas. Highw. Transp. 2018, 31, 235–243. [Google Scholar]
- Wang, Z.L.; Zhu, L.; Guo, X.X.; Pan, X.H.; Zhou, B.; Yang, J.; Jiang, J.C.; Hua, M.; Feng, L. Reduced-scale experimental and numerical study of fire in a hybrid ventilation system in a large underground subway depot with superstructures under fire scenario. Tunn. Undergr. Space Technol. 2019, 88, 98–112. [Google Scholar] [CrossRef]
- Ivanov, M.L.; Peng, W.; Wang, Q.; Chow, W.K. Sustainable Smoke Extraction System for Atrium: A Numerical Study. Sustainability 2021, 13, 7406. [Google Scholar] [CrossRef]
- Yao, B.; Zuo, J.; Li, Y.Z.; Huang, P. Study of smoke control for a complex subway station. Fire Saf. J. 2006, 15, 172–180. [Google Scholar] [CrossRef]
- Juraeva, M.; Lee, J.H.; Song, D.J. A computational analysis of the train-wind to identify the best position for the air-curtain installation. J. Wind Eng. Ind. Aerodyn. 2011, 99, 554–559. [Google Scholar] [CrossRef]
- Zhang, J.; Li, Y.F.; Dai, B.Q.; Li, X.J.; Huang, Y.B. The Effect of Exhaust Velocity on Smoke Exhaust in Subway Platform Fire. Proc. Eng. 2018, 211, 1018–1025. [Google Scholar] [CrossRef]
- Zhou, Y.; Bu, R.W.; Xu, Z.S.; Chen, H.J.; Gong, J.H. Numerical Simulation of Smoke Control Effectiveness with Different Exhaust Mod es in a Large Subway Station. Proc. Eng. 2018, 211, 1065–1074. [Google Scholar] [CrossRef]
- Wang, Z.; Zhou, D.; Krajnovic, S.; Liu, H.K. Moving model test of the smoke movement characteristics of an on-fire subway train running through a tunnel. Tunn. Undergr. Space Technol. 2020, 96, 103211. [Google Scholar] [CrossRef]
- Giachetti, B.; Couton, D.; Plourde, F. Smoke spreading analyses in a subway fire scale model. Tunn. Undergr. Space Technol. 2017, 70, 233–239. [Google Scholar] [CrossRef]
- Meng, N.; Hu, L.; Zhu, S.; Yang, L. Effect of smoke screen height on smoke flow temperature profile beneath platform ceiling of subway station: An experimental investigation and scaling correlation. Tunn. Undergr. Space Technol. 2014, 43, 204–212. [Google Scholar] [CrossRef]
- Roh, J.S.; Ryou, H.S.; Park, W.H.; Jang, Y.J. CFD simulation and assessment of life safety in a subway train fire. Tunn. Undergr. Space Technol. 2009, 24, 447–453. [Google Scholar] [CrossRef]
- Ouyang, Q.; Zhu, Y.X. Ventilation Mode Analysis of Exhaust Smoke System for Subway Station. Fire J. Saf. Environ. 2004, 5, 1592–1596. [Google Scholar]
- Liu, C.; Zhong, M.H.; Tian, X.L.; Zhang, P.H.; Li, S.W. Study on emergency ventilation for train fire environment in metro interchange tunnel. Build. Environ. 2019, 147, 267–283. [Google Scholar] [CrossRef]
- Chow, W.K. A comparison of the use of fire zone and field models for simulating atrium smoke-filling processes. Fire Saf. J. 1995, 25, 337–353. [Google Scholar] [CrossRef]
- Huo, R.; Chow, W.K.; Jin, X.X.; Li, Y.Z.; Fong, N.K. Experimental studies on natural smoke filling in atrium due to a shop fire. Build. Environ. 2005, 40, 1185–1193. [Google Scholar] [CrossRef]
- Gao, R.; Li, A.G.; Hao, X.P.; Lei, W.J.; Deng, B.S. Prediction of the spread of smoke in a huge transit terminal subway station under six different fire scenarios. Tunn. Undergr. Space Technol. 2012, 31, 128–138. [Google Scholar] [CrossRef]
- Liu, F.; Liu, Y.Q.; Xiong, K.; Weng, M.C.; Wang, J. Experimental and numerical study on the smoke movement and smoke control strategy in a hub station fire. Tunn. Undergr. Space Technol. 2020, 96, 103177. [Google Scholar] [CrossRef]
- Wu, F.; Jiang, J.C.; Zhou, R. Smoke flow temperature beneath the ceiling in an atrium-style subway station with different fire source locations. Proc. Eng. 2018, 211, 794–800. [Google Scholar] [CrossRef]
- Li, D.Y.; Zhu, G.Q. Effect of Platform Screen Doors on Mechanical Smoke Exhaust in Subway Station Fire. Proc. Eng. 2018, 211, 343–352. [Google Scholar] [CrossRef]
- Ji, J.; Gao, Z.H.; Fan, C.G.; Sun, J.H. Large Eddy Simulation of stack effect on natural smoke exhausting effect in urban road tunnel fires. Int. J. Heat Mass Transf. 2013, 66, 531–542. [Google Scholar] [CrossRef]
- McGrattan, K.; McDermott, R.; Weinschenk, C.; Forney, G. Fire Dynamics Simulator, Technical Reference Guide, 6th ed.; National Institute of Standards and Technology: Gaithersburg, MD, USA, 2013. [Google Scholar]
- Huang, Y.B.; Li, Y.F.; Dong, B.Y.; Li, J.M.; Liang, Q. Numerical investigation on the maximum ceiling temperature and longitudinal decay in a sealing tunnel fire. Tunn. Undergr. Space Technol. 2018, 72, 120–130. [Google Scholar] [CrossRef]
Publisher’s Note: MDPI stays neutral with regard to jurisdictional claims in published maps and institutional affiliations. |
© 2021 by the authors. Licensee MDPI, Basel, Switzerland. This article is an open access article distributed under the terms and conditions of the Creative Commons Attribution (CC BY) license (https://creativecommons.org/licenses/by/4.0/).