
Employment or Development in a Semi-Peripheral Region: The Roadrunner Paradigm


Abstract
:1. Introduction
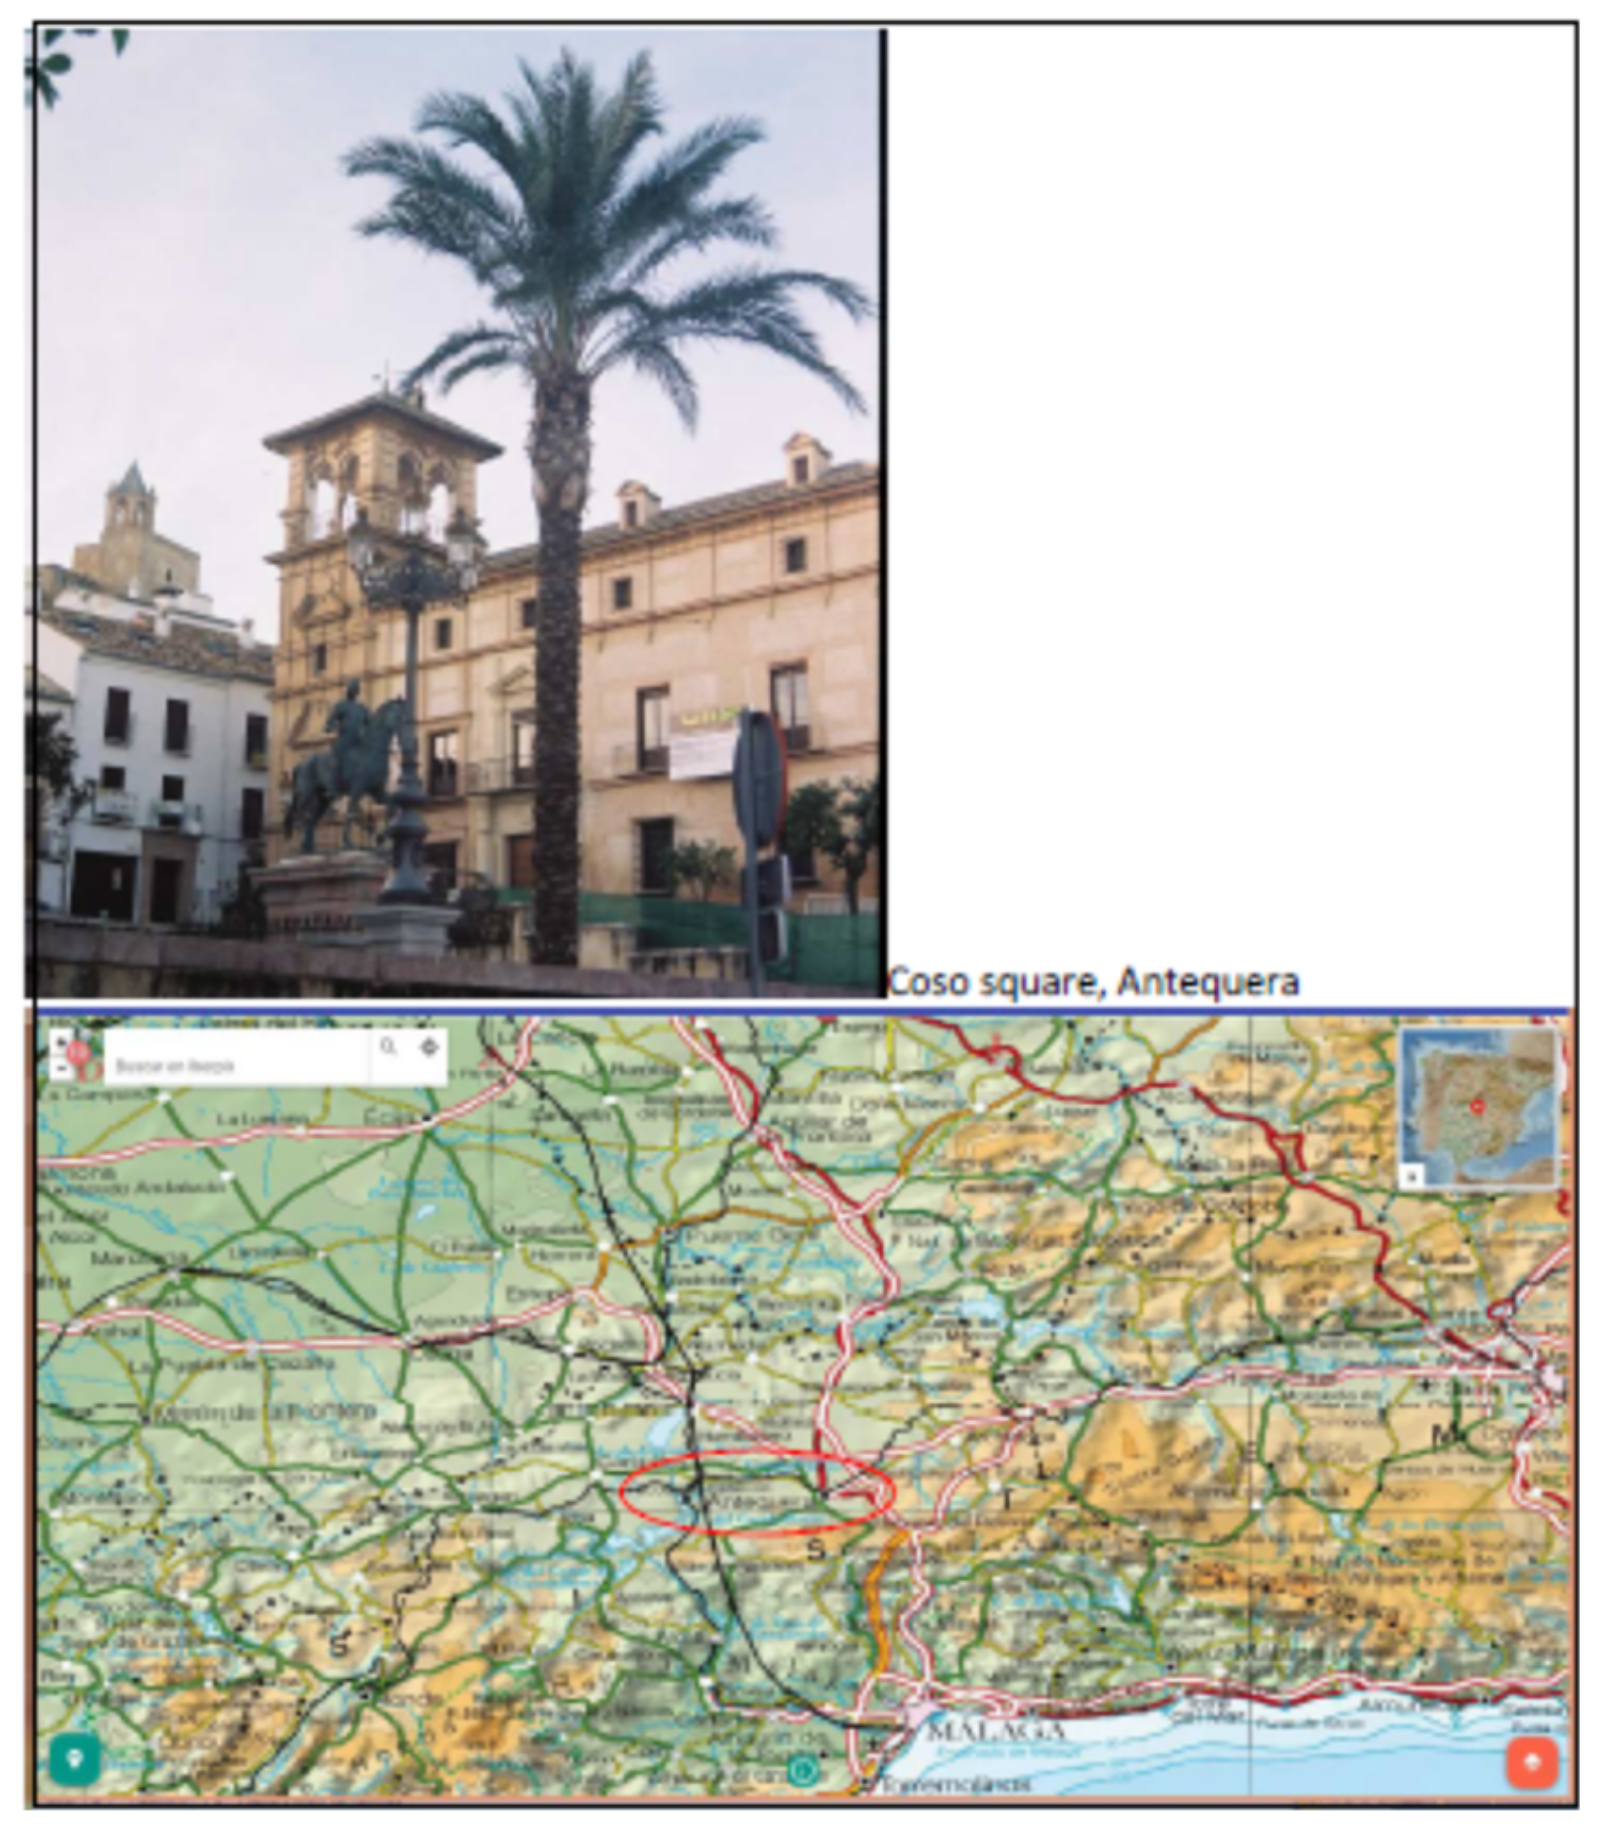
1.1. The Context: Andalusia (Spain), an Extractive Economy with Low-Quality Institutional Capital
- In order to identify the factors that might explain the continuing presence of unemployment and, therefore, the ineffectiveness of the employment policies applied, a detailed analysis is needed of the evolution of the local productive fabric. In this regard:
- 1.1.
- The basic elements of the spatial-temporal matrix [11] (Taylor) can appropriately be used to contextualise the local-scale response to changes in the economic cycle.
- 1.2.
- It is these responses by local agents that determine the effectiveness of public employment policies.
- In the last 20 years, the theoretical framework of local development has focused on the dependence of local development on an innovative business culture. However, this orientation must be complemented with the efficient incorporation of other processes that characterise the least innovative territories in the semi-peripheral regions of the European Union, which are precisely those where there is a predominance of economic activities with little need of skilled human resources or innovative business methods. Among others, the following processes should be considered:
- 2.1.
- The incidence of cohesion policies (at their corresponding scales and manifestations) based on the publicly financed provision of equipment and infrastructure in the evolution of the productive fabric and on the generation of employment;
- 2.2.
- Other recent effects of globalisation on the quality of employment, such as immigration, the real estate bubble and the growing impact of tourism activities.
1.2. Current State of Research: Local Development and Employment
- There has been a progressive distancing from the view that local development constitutes a means of reducing unemployment (for which purpose it arose spontaneously). Instead, it more closely resembles an instrument that is capable of generating high-quality employment in conjunction with innovation, institutional quality and business culture as co-factors strengthening the competitiveness of companies and hence that of the territories in which they are located.
- In parallel, the changes in working conditions and in the supply of labour (i.e., via increased immigration), as a consequence of globalisation, have provoked a dissociation between workers’ geographic origin, current residence and worksite, thus modifying the coherence of local employment policies and initiatives.
- The effectiveness of employment policies addressing the goals identified in paragraph 1, above, is subject to the response of social agents to external stimuli. However, these stimuli are less influenced by local policies than by factors such as the quality of employment, institutional capital and the presence of a development-oriented culture. Indeed, our study reveals the drag of inertia on the productive fabric in the study area, hindering innovation, as observed, too, by Arenas for the region of Andalusia. This inertia is reflected in the low presence of quality employment and in the entry of the immigrant workforce into unskilled activities.
2. Materials and Methods
2.1. Premises
2.2. Sources and Analytical Procedures
2.2.1. Analysis of Grey Literature Related to Public Policies
2.2.2. The Statistical Sources and Data Analysis Methods
Natural and Spatial Demographic Dynamics
Economically Active Workforce and Unemployment
Population Censuses
- Rates of employment and unemployment
- b.
- The repercussions of immigration
- c.
- Relationship between residence and worksite
Public Sector Employment Services. Registered Unemployment
The Evolution of the Productive Fabric and the Resulting Characterisation
The Distribution of Economic Activity, by Subsectors
- A methodological observation: the evolution of the Spanish Classification of Economic Activities (CNAE)
- b.
- The most detailed information used corresponds to the working population classified by the employer’s area of activity, which is stipulated to a level of one, two or three digits. However, in these cases, too, the data availability is variable. Thus, the 1991 Census [36] only classifies to one digit (numerical), lacking the taxonomy (the three-digit branch code) provided in the 2001 and 2011 censuses. Moreover, due to the confidentiality provisions applied and the sampling procedure employed, a two-digit classification could not be systematically derived, since in the 2011 Census [38] when there are less than five sampling units the numbers are replaced by asterisks. Accordingly, the taxonomy of this source (the population censuses) was used as the basis for establishing equivalences to be applied to other sources. The systematisation criteria applied for the continuity of these classifications are presented as Supplementary Materials Variables, sources and procedures.
- Working population classified by the employer’s area of activity, classified by one, two or three digits (Population censuses)
- ii.
- Business activity
- (a)
- The Agrarian Census, which has sufficient periodicity and spatial scale to provide the municipal data needed for the period 1962 to 2009 [44,45,46,47,48,49]. From this source, the following variables and ratios were obtained: the evolution of farm structures by size and the relationship between labour supply and demand (Annual Working Units (AWUs), Agrarian Censuses), as expressed by the number of persons available for employment and actually employed in the agricultural sector during the years for which data are available [38,39], otherwise, only those actually employed. Both values reflect the effects of agrarian reform.
- (b)
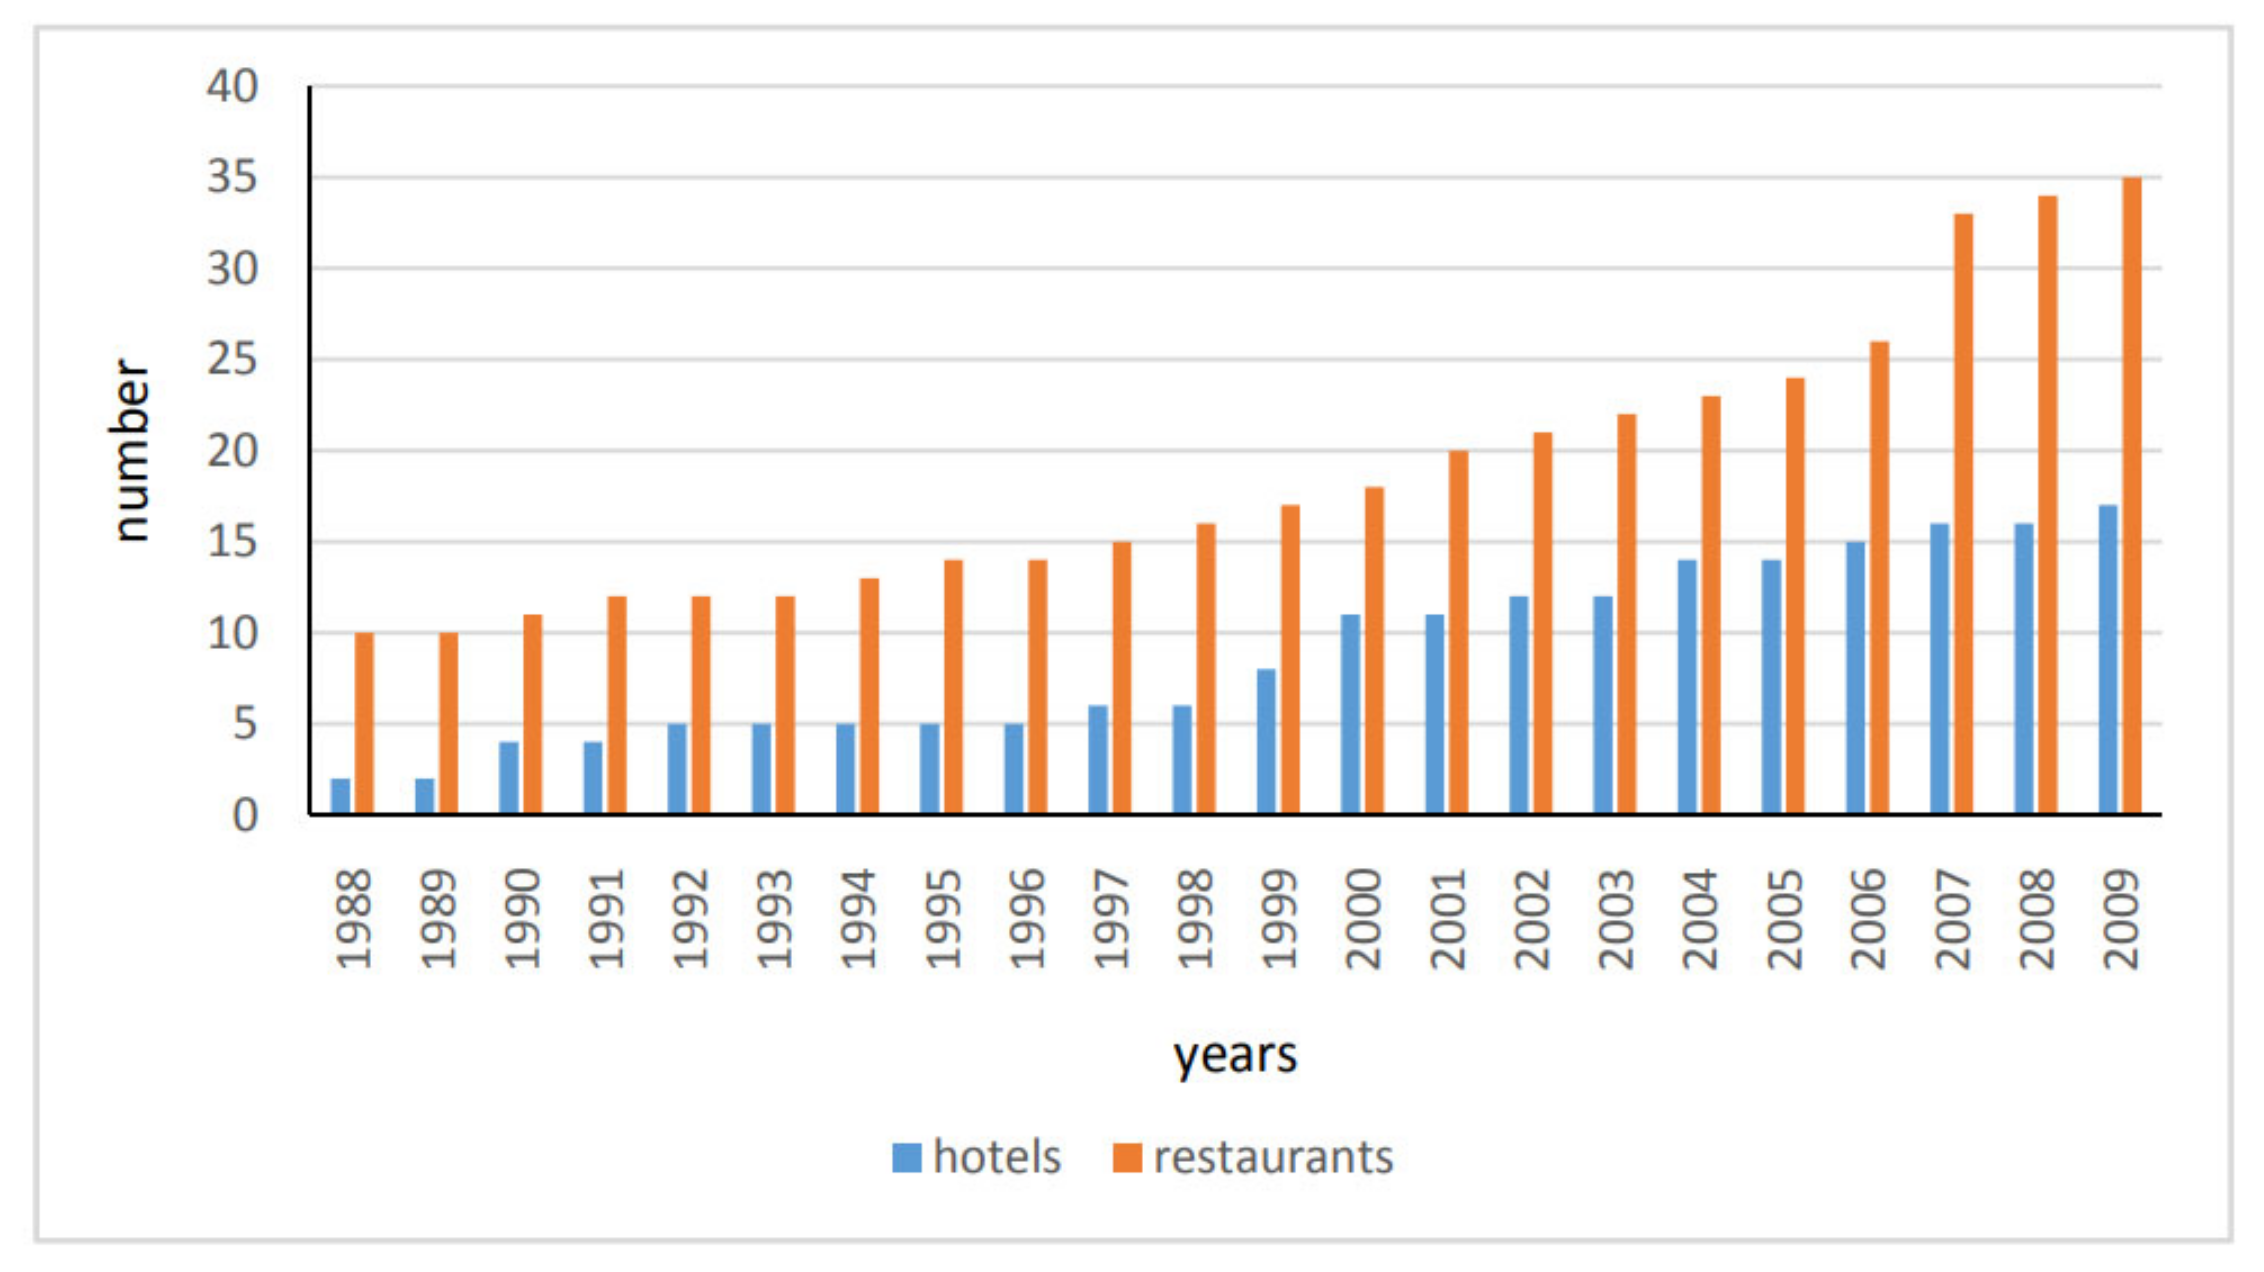
- Characterisation of tourism-related variables. For this purpose, we had access to detailed information at the municipal level, namely, the statistics on hotel and catering establishments published by the Regional Ministry of Tourism, Commerce and Sports [50].
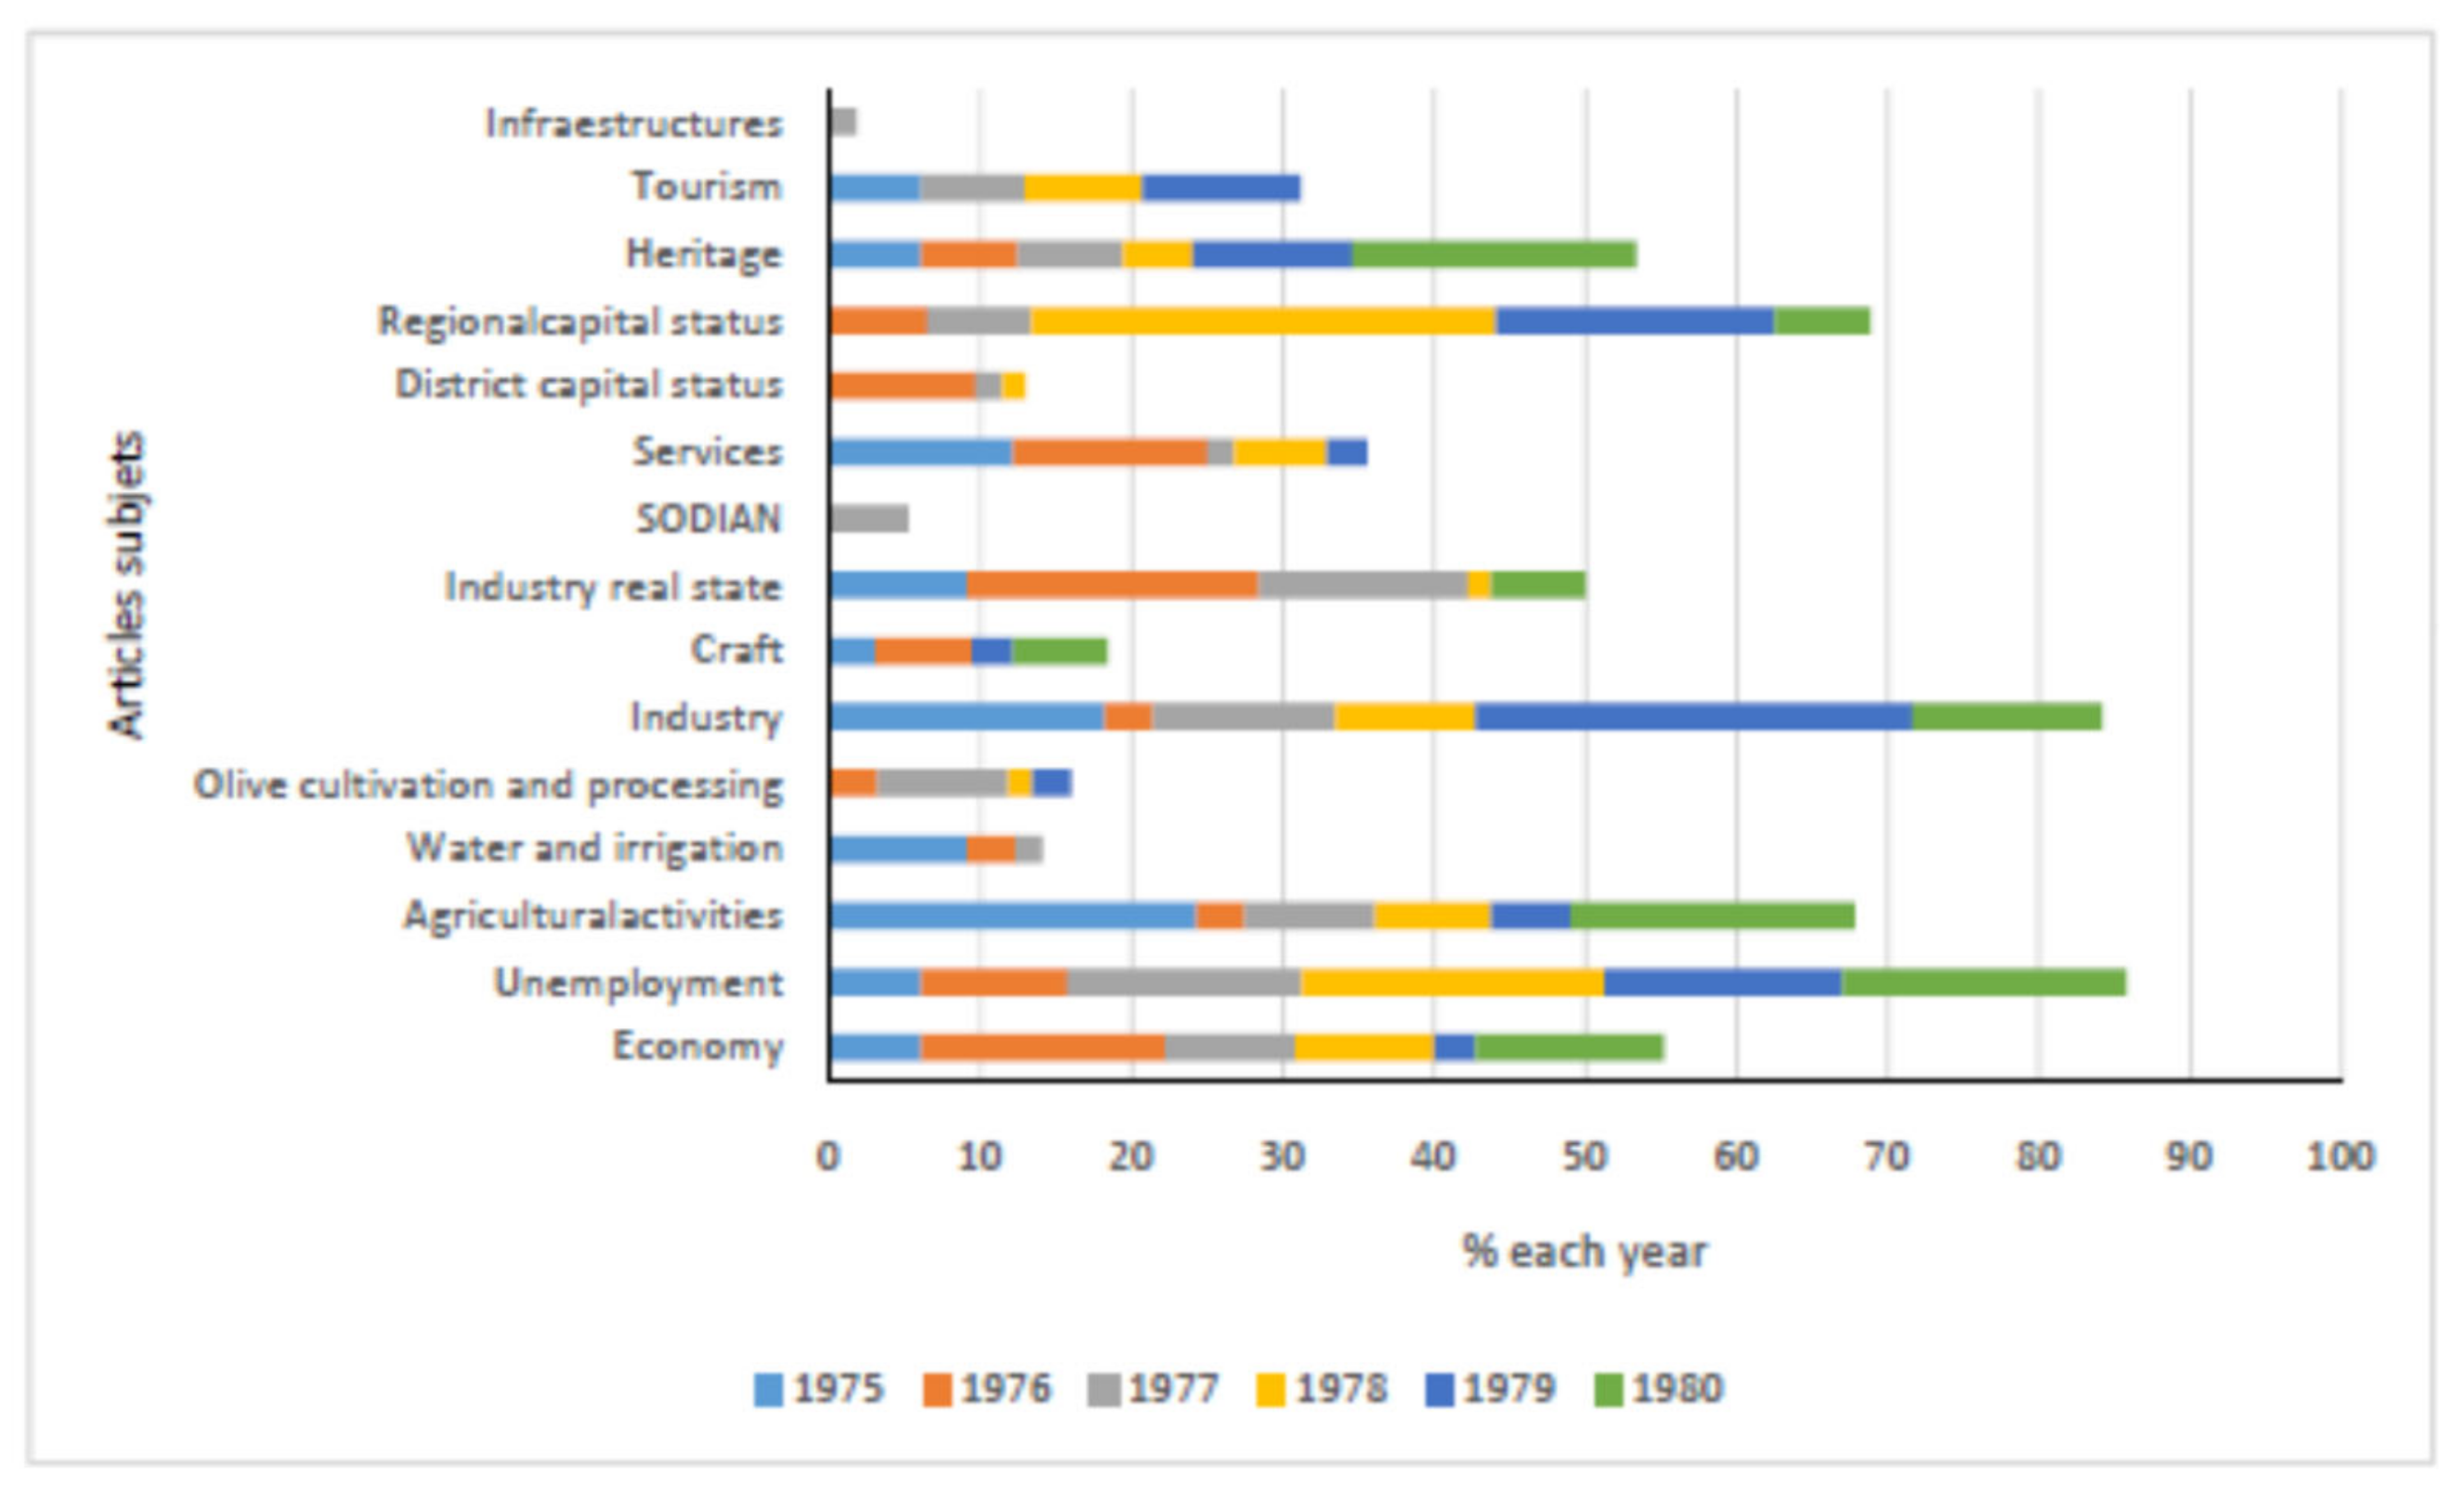
2.2.3. The Press
3. Results
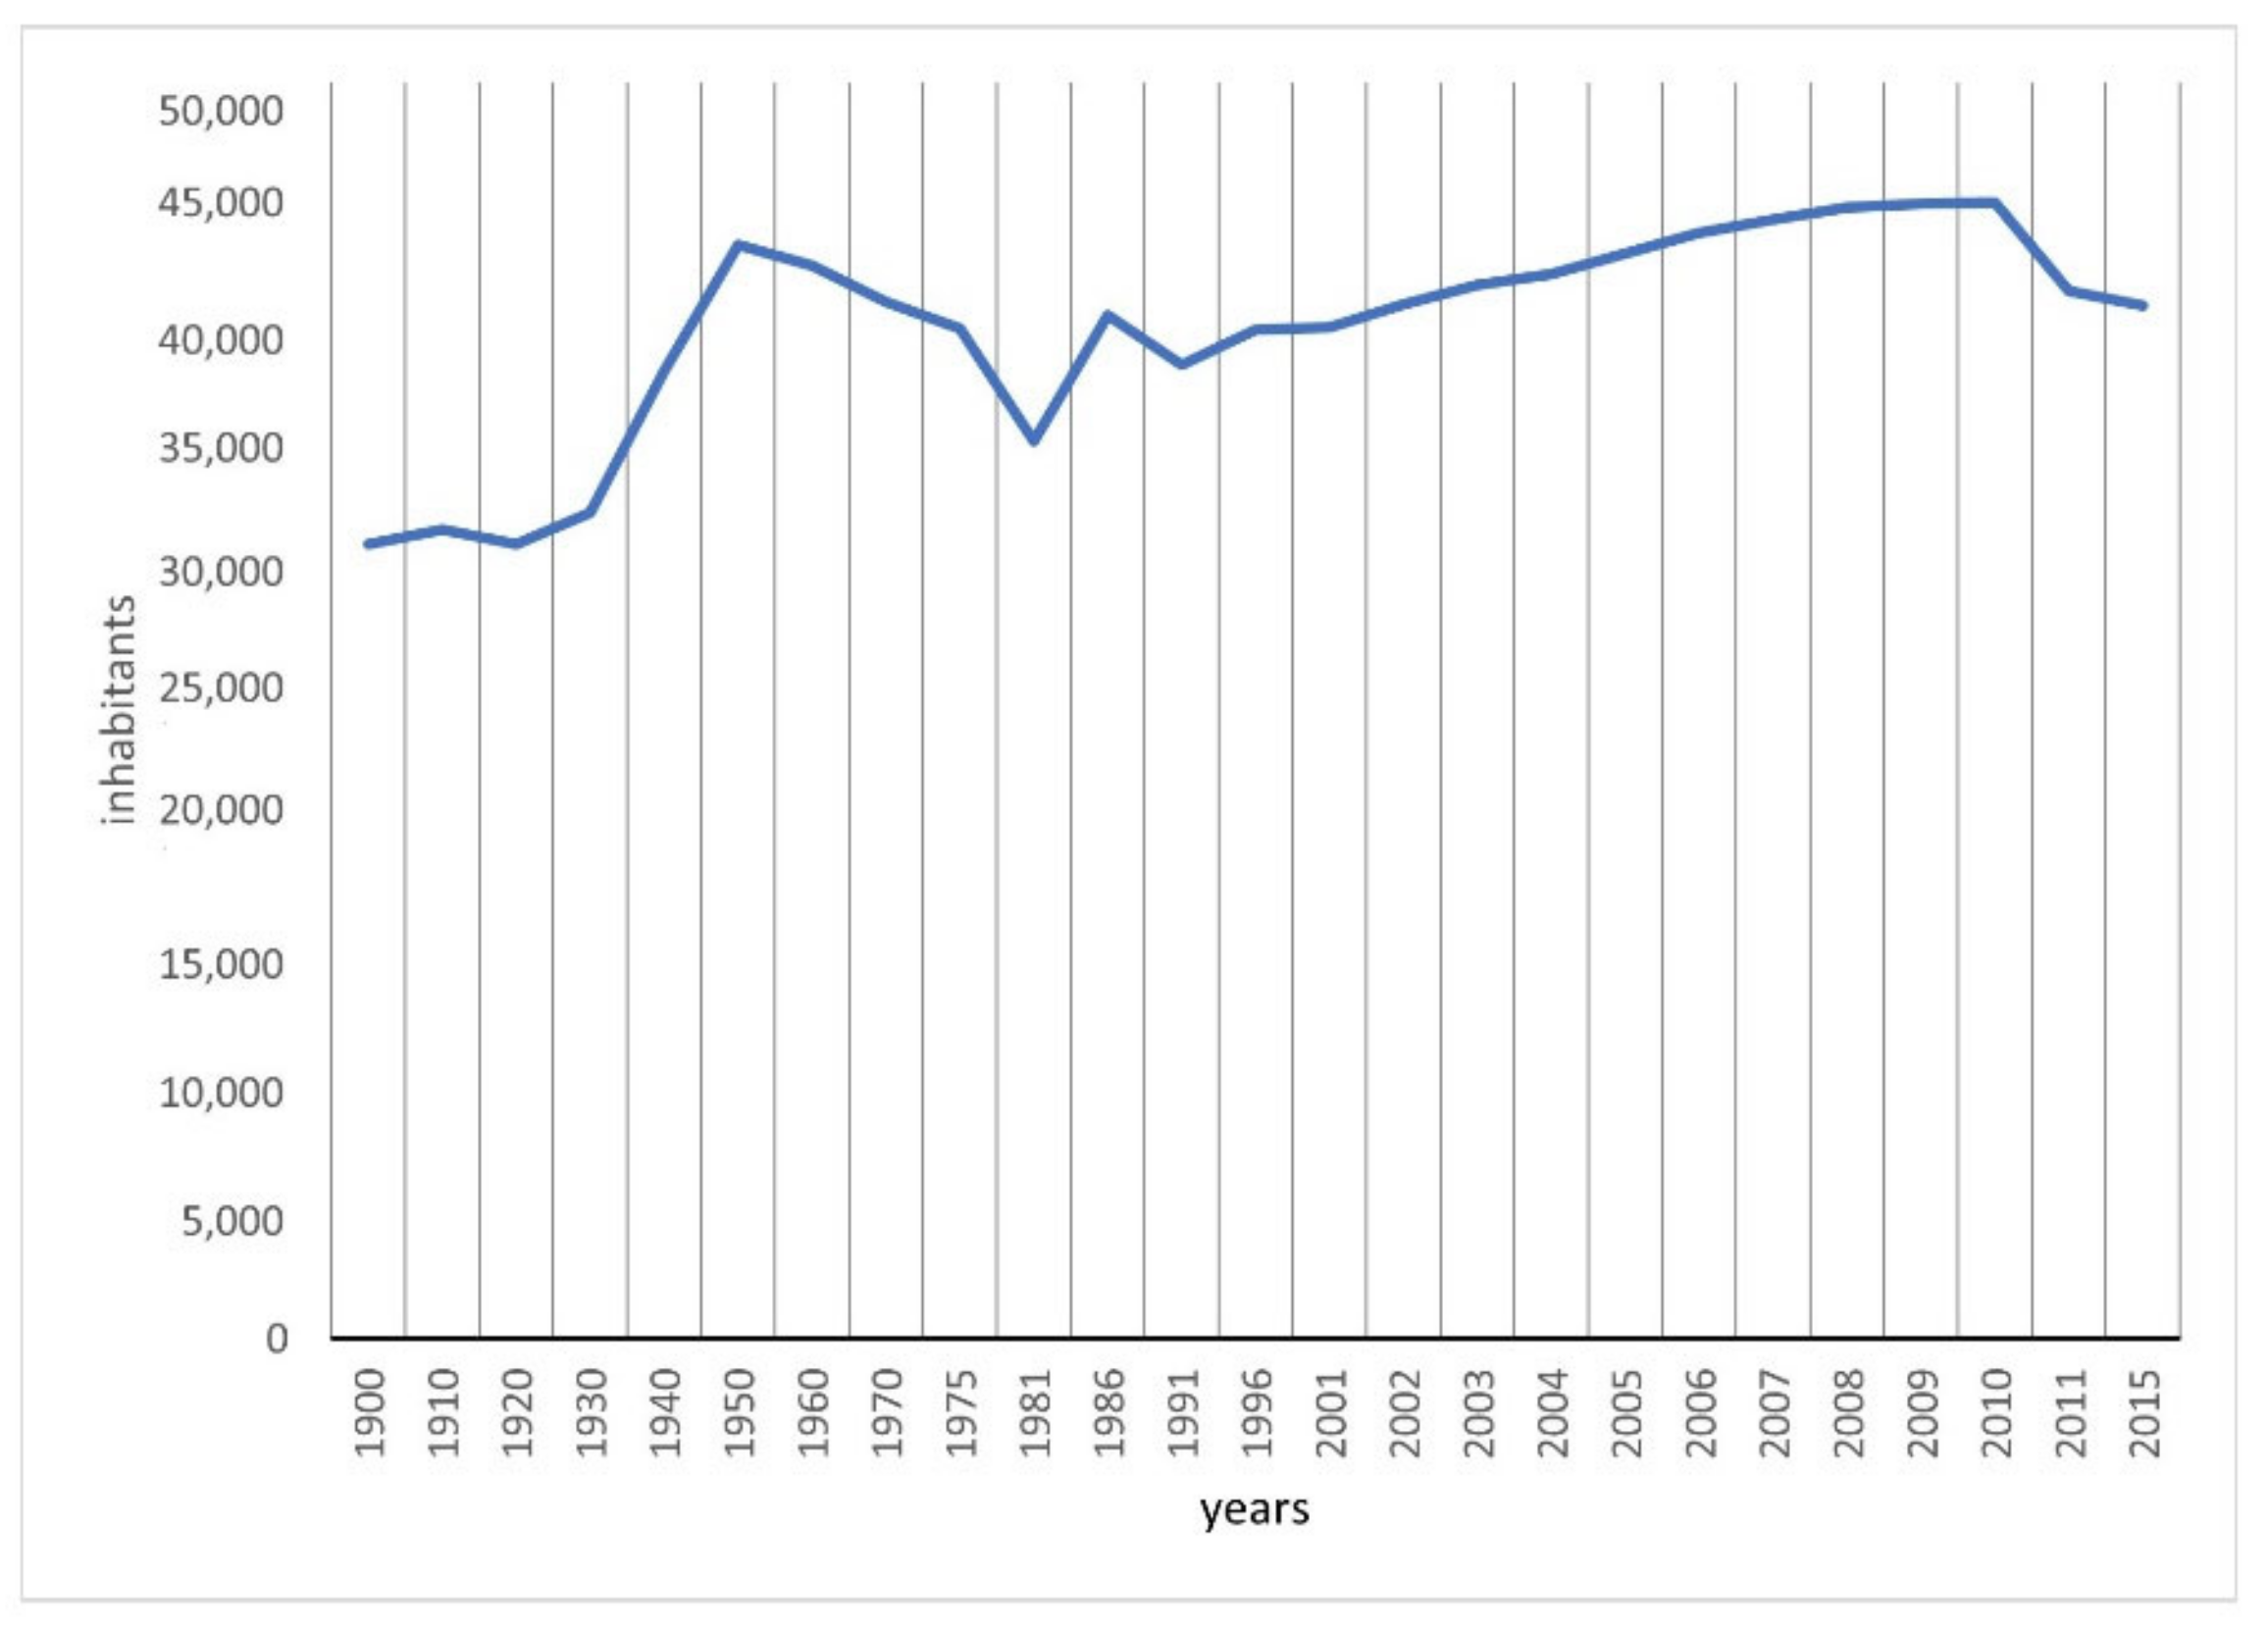
3.1. A Mediterranean Agro-Town
3.2. Background 1975–1980: The Democratic Transition—Welcome Mr. Marshall (Welcome Mr. Marshall (Original Title: Bienvenido, Mister Marshall) Was Directed by Luis García Berlanga in 1953 and Is Considered One of the Masterpieces of Spanish Cinema. It Satirised a Recurrent Problem in Spain: The Investment Passivity Frequently Displayed, as Small Local Communities Hope for Windfalls from External Sources, an Expectation That Is Often Disappointed)
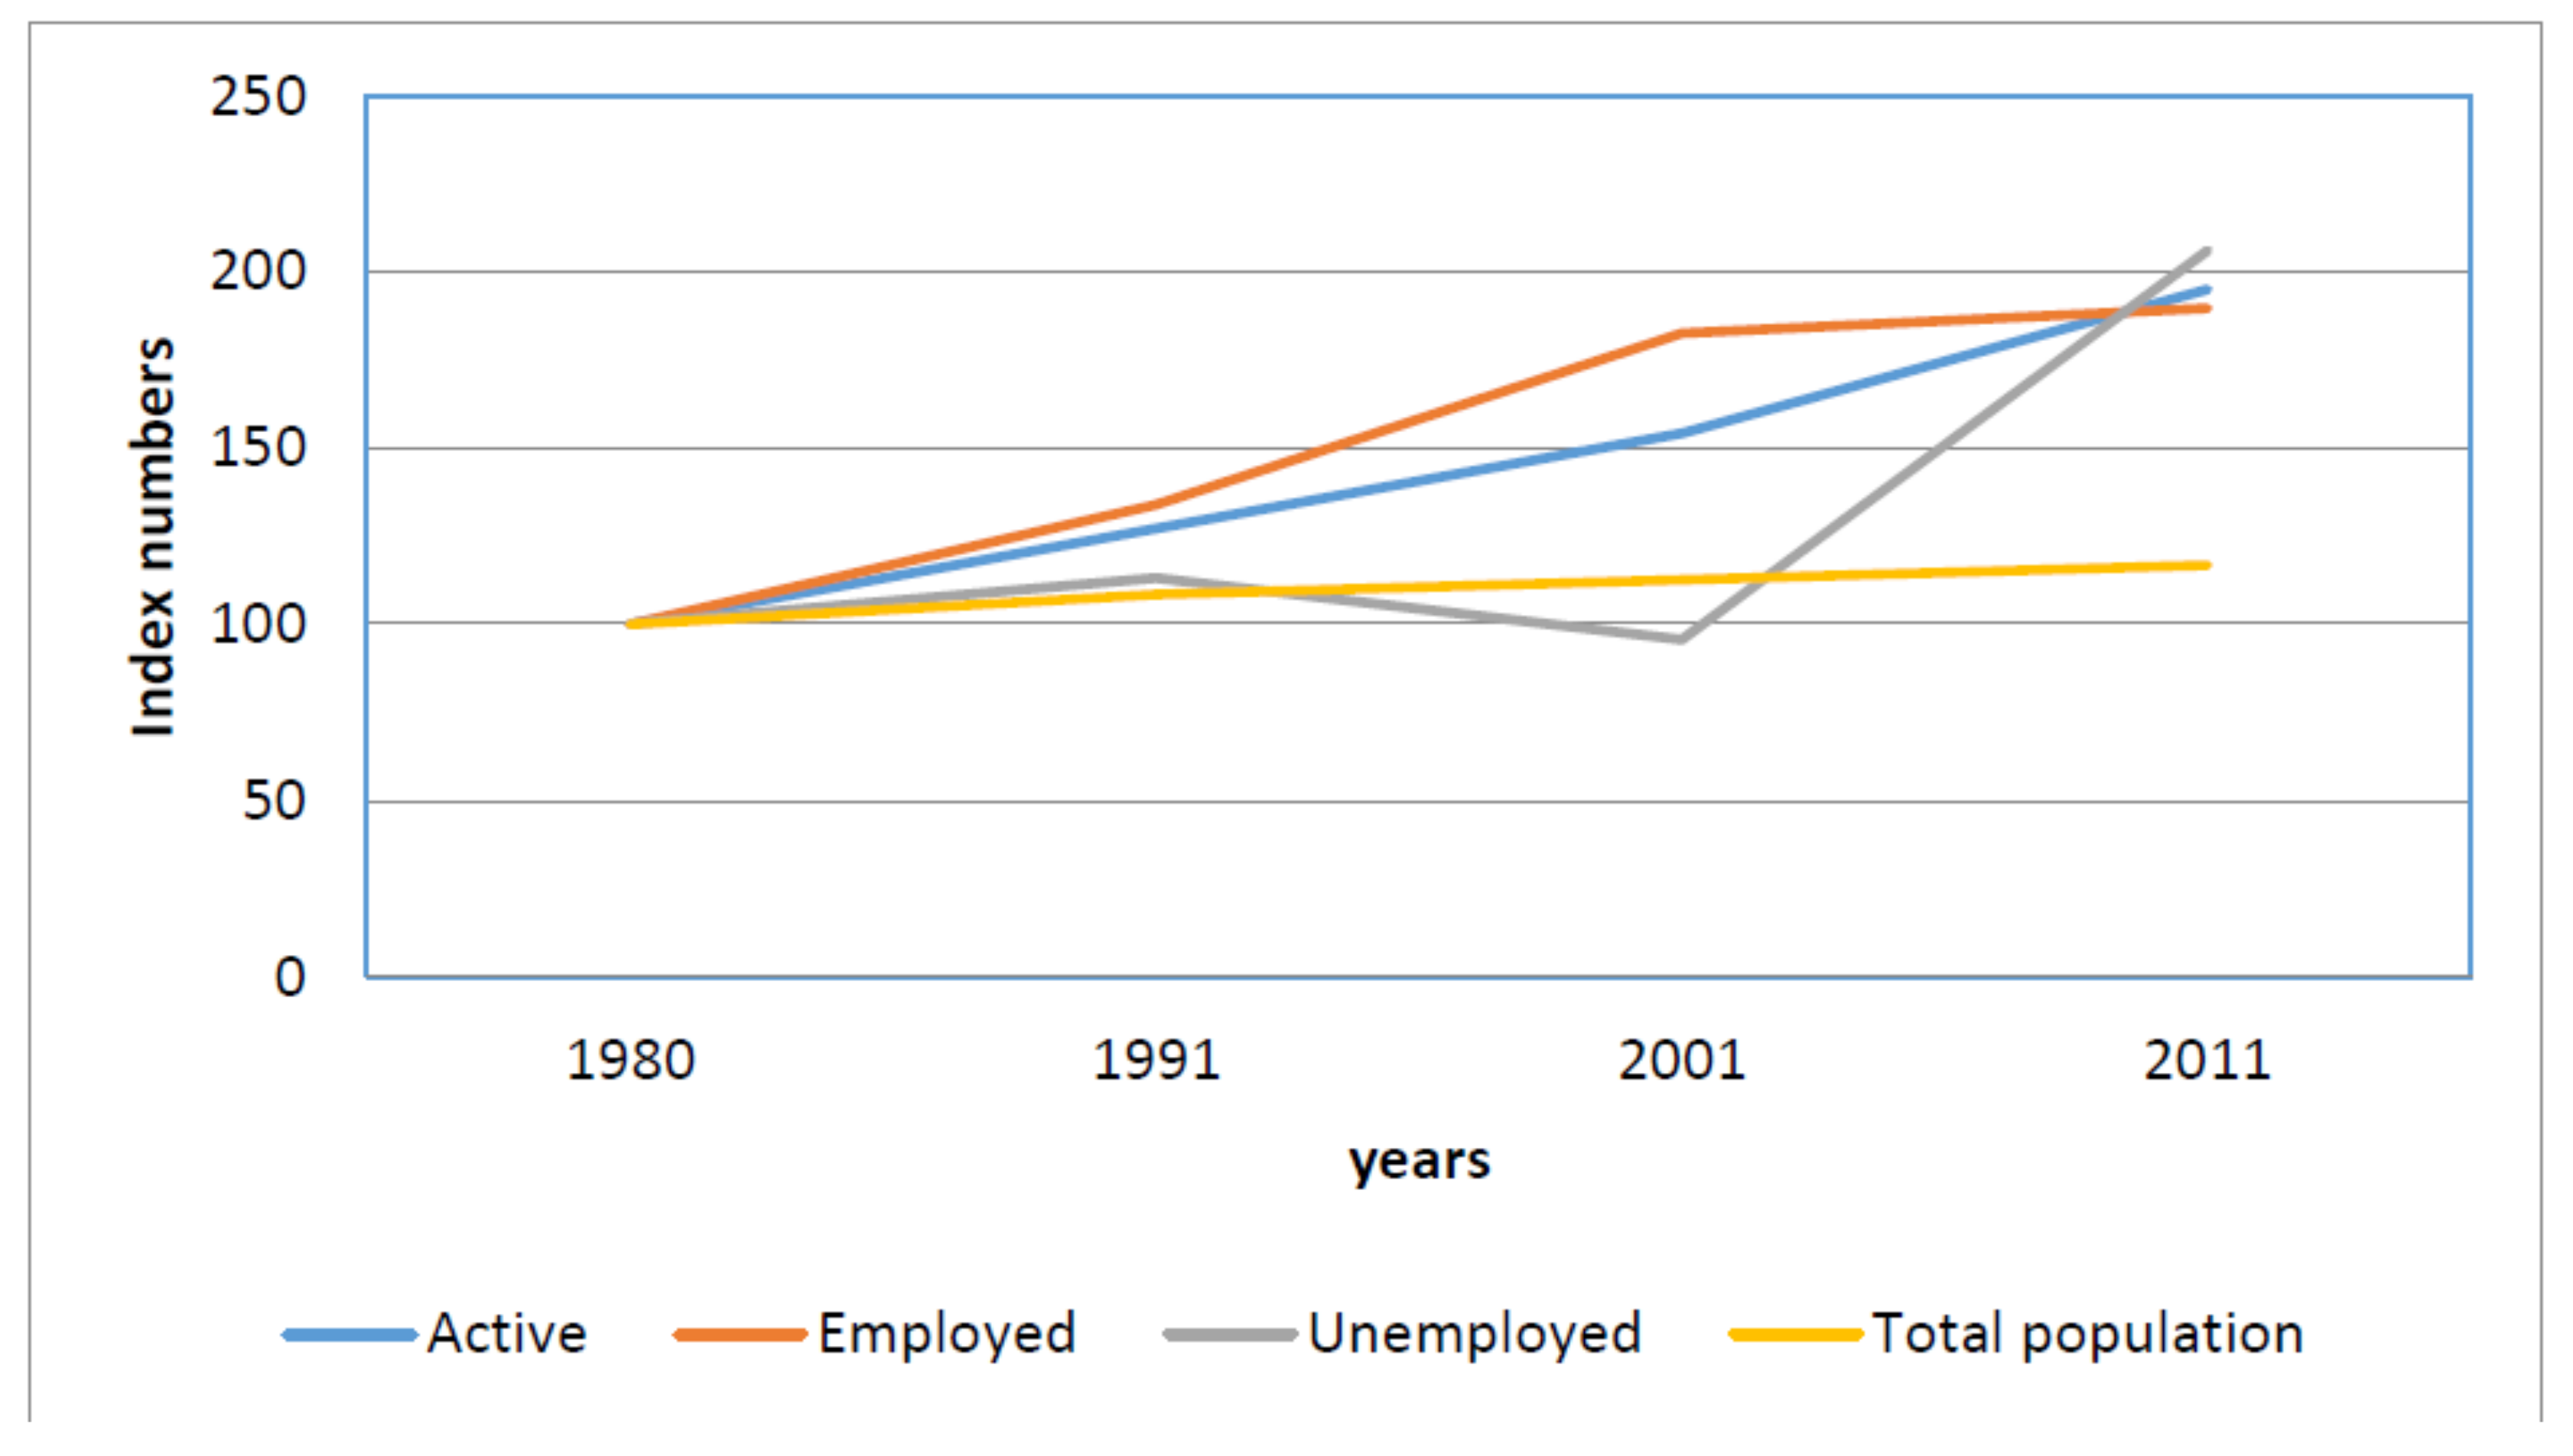
3.3. 1980–1991: Weaknesses and Strengths of Public Policies, Weighing Competitiveness against Social Policies
3.4. 1991–2011: The Dream of Self-Rule Local Development, Gone with the Bubble
3.4.1. The Background of the Real Estate Bubble
3.4.2. The Backdrop of the Crisis of 2007
3.4.3. After the Bubble: The Return to Unemployment and to Dependence on Territorial Resources
Agriculture–Food
Construction
Public and Private Services Related to the Town’s Geographic Centrality and District Capital Status
Tourism: First and Foremost, after the Bubble. Is It Related to Skilled Employment in Cultural Services?
Skills-Based Business Services
4. Discussion and Conclusions
Supplementary Materials
Funding
Institutional Review Board Statement
Informed Consent Statement
Data Availability Statement
Conflicts of Interest
References
- EUROSTADT. Unemployment Rates (%) 2018, 2019. Available online: https://ec.europa.eu/eurostat/databrowser/view/tgs00010/default/table?lang=en (accessed on 1 April 2021).
- Spanish National Institute of Statistics (Instituto Nacional de Estadística, INE, Spanish Initials). Population Register. Available online: https://www.ine.es/jaxiT3/Tabla.htm?t=33848&L=0 (accessed on 1 April 2021).
- Méndez, R. Procesos de Innovación En Ciudades Intermedias, Actores Locales y Desarrollo. In El Desarrollo Local en su Complejidad Territorial; Universidad de Santiago de Compostela: Santiago de Compostela, Spain, 2005; pp. 33–60. [Google Scholar]
- Sistema de Ciudades. In Andalucía; Consejería de Política territorial de la Junta de Andalucía: Sevilla, Spain, 1986.
- Bases y Estrategias Del Plan de Ordenación Del Territorio de Andalucía; Junta de Andalucía, Consejería de Obras Públicas y Transportes: Sevilla, Spain, 1989.
- Garcia-Manrique, E.; Ocaña, M.C. El Territorio Andaluz; Librería Agora: Málaga, Spain, 1990. [Google Scholar]
- Cejudo, E.; Navarro, F.; Cañete, J.A. Evolución y Distribución Territorial de Los Trabajadores Eventuales Agrarios Subsidiados En Andalucía. Boletín Asoc. Geogr. Española 2016, 72, 117–147. [Google Scholar]
- Gómez, M.L. La Diversificación Económica de Antequera Como Proceso de Desarrollo Local; Servicio de Publicaciones de la Diputación Provincial de Málaga: Málaga, Spain, 1999. [Google Scholar]
- Parejo, A.; Gómez, M.L. Una Economía en Transformación: Antequera Entre Los Siglos XX y XXI; Cajamar: Almería, Spain, 2009. [Google Scholar]
- Arenas, C. Poder, Economía y Sociedad en el Sur Historia e Instituciones Del Capitalismo Andaluz; Centro de Estudios Andaluces: Sevilla, Spain, 2016. [Google Scholar]
- Taylor, P. Geografía Política. In Economía-Mundo, Estado-Nación y Localidad; Trama: Madrid, Spain, 1994. [Google Scholar]
- Sforzi, F. Del Distrito Industrial al Desarrollo Local. In Los Sistemas Locales de Empresas y el Desarrollo Territorial: Evolución y Perspectivas Actuales en un Contexto Globalizado; AGE, Colegio de Geógrafos, Universidad de Alicante: Alicante, Spain, 2007; pp. 27–50. [Google Scholar]
- Dalla Rosa, G. Valle d’Aspe En Survieou Les Limites d’une Politique En Faveur de l’agriculture de Montagne Dans Les Pyrenees Françaises. In Superivencia de la Montaña; Servicio de Publicaciones Agrarias: Madrid, Spain, 1981; pp. 633–665. [Google Scholar]
- Garofoli, G. Evolución Institucional y de La Gobernanza Del Desarrollo Territorial. In Globalización y Desarrollo de los Territorios; Pirámide: Madrid, Spain, 2020; pp. 27–50. [Google Scholar]
- Vázquez, A.; Rodríguez, J.C. Globalización y Dinámica Territorial. In Globalización y Desarrollo de los Territorios; Pirámide: Madrid, Spain, 2020; pp. 17–28. [Google Scholar]
- Gainza, X.; Unceta, K. Los Factores Socio-Territoriales y Su Incidencia En Las Estrategias Locales de Desarrollo: El Caso de Las Agencias de Desarrollo Local En El País Vasco. Rev. Estud. Reg. 2011, 92, 113–143. [Google Scholar]
- Castro, M.; Moniche, L.M.; Morillas, A. Evaluación de Los Fondos Estructurales En La Economía Andaluza. Rev. Estud. Reg. 1999, 54, 225–250. [Google Scholar]
- Ruiz, J.L. Patrimonio y Desarrollo Local En Andalucía. Boletín Asoc. Geogr. Española 2004, 38, 101–114. [Google Scholar]
- Martínez, A.; Ponce, G.; Pérez, D.; Miralles, M. El Papel de Los Poderes Locales En El Desarrollo Económico e Industrial de La Provincial de Alicante. Estudio de Casos. In El Desarrollo Rural/Local Integrado y el Papel de los Poderes Locales. Nuevas Consideraciones Sectoriales y sus Repercusiones en el Territorio Valenciano; Publicaciones de la Universidad de Alicante: Alicante, Spain, 2001; pp. 273–298. [Google Scholar]
- Caravaca, I.; González, G.; Mendoza, A. Indicadores de Dinamismo, Innovación y Desarrollo. Su Aplicación En Ciudades Pequeñas y Medias de Andalucía. Boletín Asoc. Geogr. Española 2007, 43, 141–154. [Google Scholar]
- Pena, J.A.; Sánchez, J.M. Disparidades Económicas Intrarregionales a Escala Municipal: Evidencia Empírica Para El Caso Gallego. Rev. Estud. Reg. 2008, 81, 15–43. [Google Scholar]
- Albertos, J.M. Cultura, Innovación y Desarrollo Local. Boletín Asoc. Española Geogr. 2002, 34, 229–244. [Google Scholar]
- Bericat, E. Cultura Productiva y Desarrollo Endógeno. El Caso Andaluz. Rev. Estud. Reg. 1989, 24, 15–44. [Google Scholar]
- González, G. Innovación Territorial y Políticas Públicas. Boletín Asoc. Española Geogr. 2006, 41, 121–136. [Google Scholar]
- Ceña, F.; Gallardo, R.; Garrido, P. An Approach on Integrated Territorial Competitiveness to Ensure Long Term Viability in Rural Areas of Andalusia (Spain). In Proceedings of the I Mediterranean conference of Agro-Food Social Scientists, Barcelona, Spain, 23–23 April 2007. [Google Scholar]
- Dematteis, G.; Governa, F. Territorio y Territorialidad En El Desarrollo Local. La Contribución Del Modelo SloT. Boletín Boletín Asoc. Geogr. Española 2006, 41, 31–58. [Google Scholar]
- Trullen, J. La Nueva Política Industrial Española: Innovación, Economías Externas y Productividad. Econ. Ind. 2007, 363, 17–37. [Google Scholar]
- Hagget, P. Locational Analysis in Human Geography; Edward Arnold: London, UK, 1965. [Google Scholar]
- Ponce, G. Impactos de La Organización Postfordista Del Trabajo En Las Comarcas Alicantinas. In El Desarrollo Rural/Local Integrado y el Papel de los Poderes Locales. Nuevas Consideraciones Sectoriales y sus Repercusiones en el Territorio Valenciano; Publicaciones de la University de Alicante: Alicante, Spain, 2001; pp. 225–258. [Google Scholar]
- Simón, A.; Zazo, A.; Morán, N.; Hernández, V. Pathways towards the Integration of Periurban Agrarian Ecosystems into the Spatial Planning System. Ecol. Process. 2014, 3, 1–16. [Google Scholar]
- Population Census Data from 1900 to 2011, Register Population, 2012 to 2015. Total Inhabitants of Antequera Municipality; Andalusian Municipal Information System (SIMA, Spanish initials); Edición 2013, versión 2.0.0.; Instituto e Estadistico y de Cartografía de Andalucia: Sevilla, Spain, 2013.
- Annual Data for Births and Deaths; Andalusian Municipal Information System (SIMA, Spanish initials); Edición 2013, versión 2.0.0.; Instituto Estadistico y de Cartografía de Andalucia: Sevilla, Spain, 2013, 2013.
- Censo de Población 1970. Tomo II Resultados Provinciales; Spanish National Institute of Statistics (Instituto Nacional De Estadística, INE, Spanish initials): Madrid, Spain, 2016.
- Encuesta de la Población Activa (EPA) (Active Population Survey); Spanish National Institute of Statistics (Instituto Nacional De Estadística, INE, Spanish initials): Madrid, Spain, 2016.
- Censo de Población de 1981. Provincia de Málaga. Tomo IV. Resultados Municipales; Spanish National Institute of Statistics (Instituto Nacional De Estadística, INE, Spanish initials): Madrid, Spain, 1985.
- Censo de Población de Andalucía 1991. Estadísticas Demográficas. Población. Provincia de Málaga; Instituto De Estadistica Y Cartografía De Andalucia: Sevilla, Spain, 1993.
- Censo de Población y Viviendas 2001. Resultados Definitivos; Spanish National Institute of Statistics (Instituto Nacional De Estadística, INE, Spanish initials): Madrid, Spain; Available online: https://www.ine.es/censo/es/inicio.jsp (accessed on 15 March 2021).
- Censo de Población y Viviendas 2011. Resultados Definitivos; Spanish National Institute of Statistics (Instituto Nacional De Estadística, INE, Spanish initials): Madrid, Spain; Available online: https://www.ine.es/censos2011/tablas/Inicio.do (accessed on 15 March 2021).
- Malaga Provincial Council. La Población de la Provincia de Málaga; Estadístico; Malaga Provincial Council: Málaga, Spain, 1989. [Google Scholar]
- Registered Unemployeds; Andalusian Municipal Information System (SIMA, Spanish initials); Edición 2013, versión 2.0.0.; Instituto Estadistico y de Cartografía de Andalucia: Sevilla, Spain, 2013.
- Directory of Business Establishments; Andalusian Municipal Information System (SIMA, Spanish initials); Edición 2013, versión 2.0.0.; Instituto Estadistico y de Cartografía de Andalucia: Sevilla, Spain, 2013.
- Statistical Yearbook on Commercial Companies; Andalusian Municipal Information System (SIMA, Spanish initials); Edición 2013, versión 2.0.0.; Instituto Estadistico y de Cartografía de Andalucia: Sevilla, Spain, 2013.
- NACE REV-1, 1991 Population Census Methodology; Spanish National Institute of Statistics (Instituto Nacional De Estadística, INE, Spanish initials): Madrid, Spain; Available online: https://www.ine.es/censo91/es/glosario.html (accessed on 4 April 2021).
- Censo Agrario 1962. Datos Provinciales, Provincia de Málaga; Spanish National Institute of Statistics (Instituto Nacional De Estadística, INE, Spanish initials): Madrid, Spain, 1964.
- Censo Agrario de 1972. Datos Provinciales, Provincia de Málaga; Spanish National Institute of Statistics (Instituto Nacional De Estadística, INE, Spanish initials): Madrid, Spain, 1975.
- Censo Agrario de 1982. Datos Provinciales, Provincia de Málaga; Spanish National Institute of Statistics (Instituto Nacional De Estadística, INE, Spanish initials): Madrid, Spain, 1985.
- Censo Agrario de 1992. Datos Provinciales, Provincia de Málaga. INE, Madrid, Spain; Spanish National Institute of Statistics (Instituto Nacional De Estadística, INE, Spanish initials): Madrid, Spain, 1995.
- Censo Agrario de 1999. Datos Provinciales, Provincia de Málaga. INE, Madrid, Spain; Spanish National Institute of Statistics (Instituto Nacional De Estadística, INE, Spanish initials): Madrid, Spain, 2003.
- Censo Agrario de 2009; Spanish National Institute of Statistics (Instituto Nacional De Estadística, INE, Spanish initials): Madrid, Spain, 2016.
- Statistics on Hotel and Catering Establishments; Andalusian Municipal Information System (SIMA, Spanish initials); Edición 2013, versión 2.0.0.; Regional Ministry of Tourism, Commerce and Sports (Consejería de Turismo, Comercio y Deporte, Junta de Andalucía): Madrid, Spain, 1998.
- Several. El Sol de Antequera, local newspaper, source consulted in Municipal Archive of Antequera (Spain). All copies since, 1975 to 1980, both inclusive.
- López-Casero, F. La Agrociudad Mediterránea; Ministerio de Agricultura, Pesca y Alimentación: Madrid, Spain, 1989. [Google Scholar]
- Parejo, A. Industria Dispersa e Industrialización en Andalucía: El Textil Antequerano, 1750–1900; Universidad de Málaga: Málaga, Spain, 1987. [Google Scholar]
- Mata, R. La Gran Propiedad en los Llanos de Antequera; Instituto Juan Sebastián Elcano, CSIC: Madrid, Spain, 1979. [Google Scholar]
- Belis, J.; Villar, C. Gran Área de Expansión Industrial de Andalucía; Junta de Andalucía: Sevilla, Spain, 1986. [Google Scholar]
- Carmona, A. El Empresariado Local En El Desarrollo Local: La Experiencia de La Comunidad de Propietarios Del Polígono; Industrial de Antequera: Jábega, Spain, 2001; Volume 87, pp. 74–77. [Google Scholar]
- Junta de Andalucía. Plan General de Carreteras de Andalucía; Consejería de Obras Públicas y Transportes: Sevilla, Spain, 1987. [Google Scholar]
- Memoria de Actividades, 1989; Instituto De Fomento De Andalucia: Sevilla, Spain, 1990.
- Memoria de Actividades, 1990; Instituto De Fomento De Andalucia: Sevilla, Spain, 1991.
- Aurioles, J. Málaga En El Contexto Regional, Nacional y Europeo. In Economía de Málaga; Cajamar: Almería, Spain, 2008; pp. 15–45. [Google Scholar]
- Peñalver, S.M.; Camacho, J.A.; Feixas, J.C. Empleo y Explotación de Recursos Naturales: El Sector Minero Andaluz. In Desarrollo Local en Tiempos de Crisis: ¿El Retorno a los Recursos Endógenos; Rodríguez, F., Ed.; Instituto de Desarrollo Regional, University De Granada: Granada, Spain; Barcelona, Spain, 2013; pp. 59–80. [Google Scholar]
- Plan Estratégico de Antequera ‘En El Centro Del. Available online: https://www.diariosur.es/pg060618/prensa/noticias/Turismo/200606/18/SUR-TUR-167.html (accessed on 18 June 2006).
- Ocaña, M.C. Latifundio, Gran Explotación y Modernización Agrícola: Una Reflexión Sobre Andalucía; Universidad de Málaga: Málaga, Spain, 1987. [Google Scholar]
- Gómez, M.L. Dcoop y Antequera: Encuentros y Desencuentros. In Sistemas Productivos con Anclaje Territorial; Universidad de Huelva Publicaciones: Huelva, Spain, 2018; pp. 245–263. [Google Scholar]
- Decoop. Available online: https://www.dcoop.es/home/ (accessed on 5 June 2017).
- Gómez, M.L. Crecimiento vs Desarrollo Local, Los Límites de Un Modelo de Excelencia Turística En Un Área Semiperiférica. Boletín Asoc. Geogr. Española 2008, 46, 261–290. [Google Scholar]
- Romero, J.; Brandis, D.; Delgado, C.; García, J.L.; Gómez, M.L.; Olcina, J.; Rullán, O.; Vera-Rebollo, J.F.; Vicente, J. Aproximación a La Geografía Del Despilfarro En España: Balance de Las Últimas Dos Décadas. Boletín Asoc. Geogr. Española 2018, 77, 1–51. [Google Scholar] [CrossRef] [Green Version]
- Rodero, A. La Planificación Económica En Andalucía. Rev. Estud. Reg. 2006, 75, 41–68. [Google Scholar]
- De la Porte, C.; Jacobson, K. Social investment or Re-commodification? Assessing the empoloyment policies of the EU member states. In Towards a Social Investment Welfare State? Ideas, Policies and Challenges; Bristol Press: Bristol, UK, 2012; pp. 117–234. [Google Scholar]
- Martínez, A.; Honrado, A. Turismo Urbano-Cultural y Desarrollo Local: La Aplicación Del Proyecto Picture En La Provincial de Alicante. In El Desarrollo Local en su Complejidad Territorial; Universidad de Santiago de Compostela: Santiago de Compostela, Spain, 2005; pp. 107–148. [Google Scholar]
- Vázquez Barquero, A. Desarrollo Local, Una Estrategia Para Tiempos de Crisis. Rev. Apunt. Del CENES 2009, XXVIII, 117–132. [Google Scholar]


| Subject | Indexation Subject | Rate 1 | Rate 2 | Source 1 | Source 2 |
|---|---|---|---|---|---|
| 1. Natural and spatial demographic dynamics | Birth rate | Annual Data for Births and Deaths | Population Census Data from 1900 to 2011; Register of Population, 2012 to 2015 | ||
| Death rate | |||||
| Migratory balance | |||||
| 2. Size of working population | 2.1. Economically active workforce | Employment rate | Evolution index number 1980–2011. Table and line chart | Population censuses 1970 (total population); 1980, 1991, 2001, 2011; Málaga provincial council 1986 | Active Population Survey 1976, Málaga, |
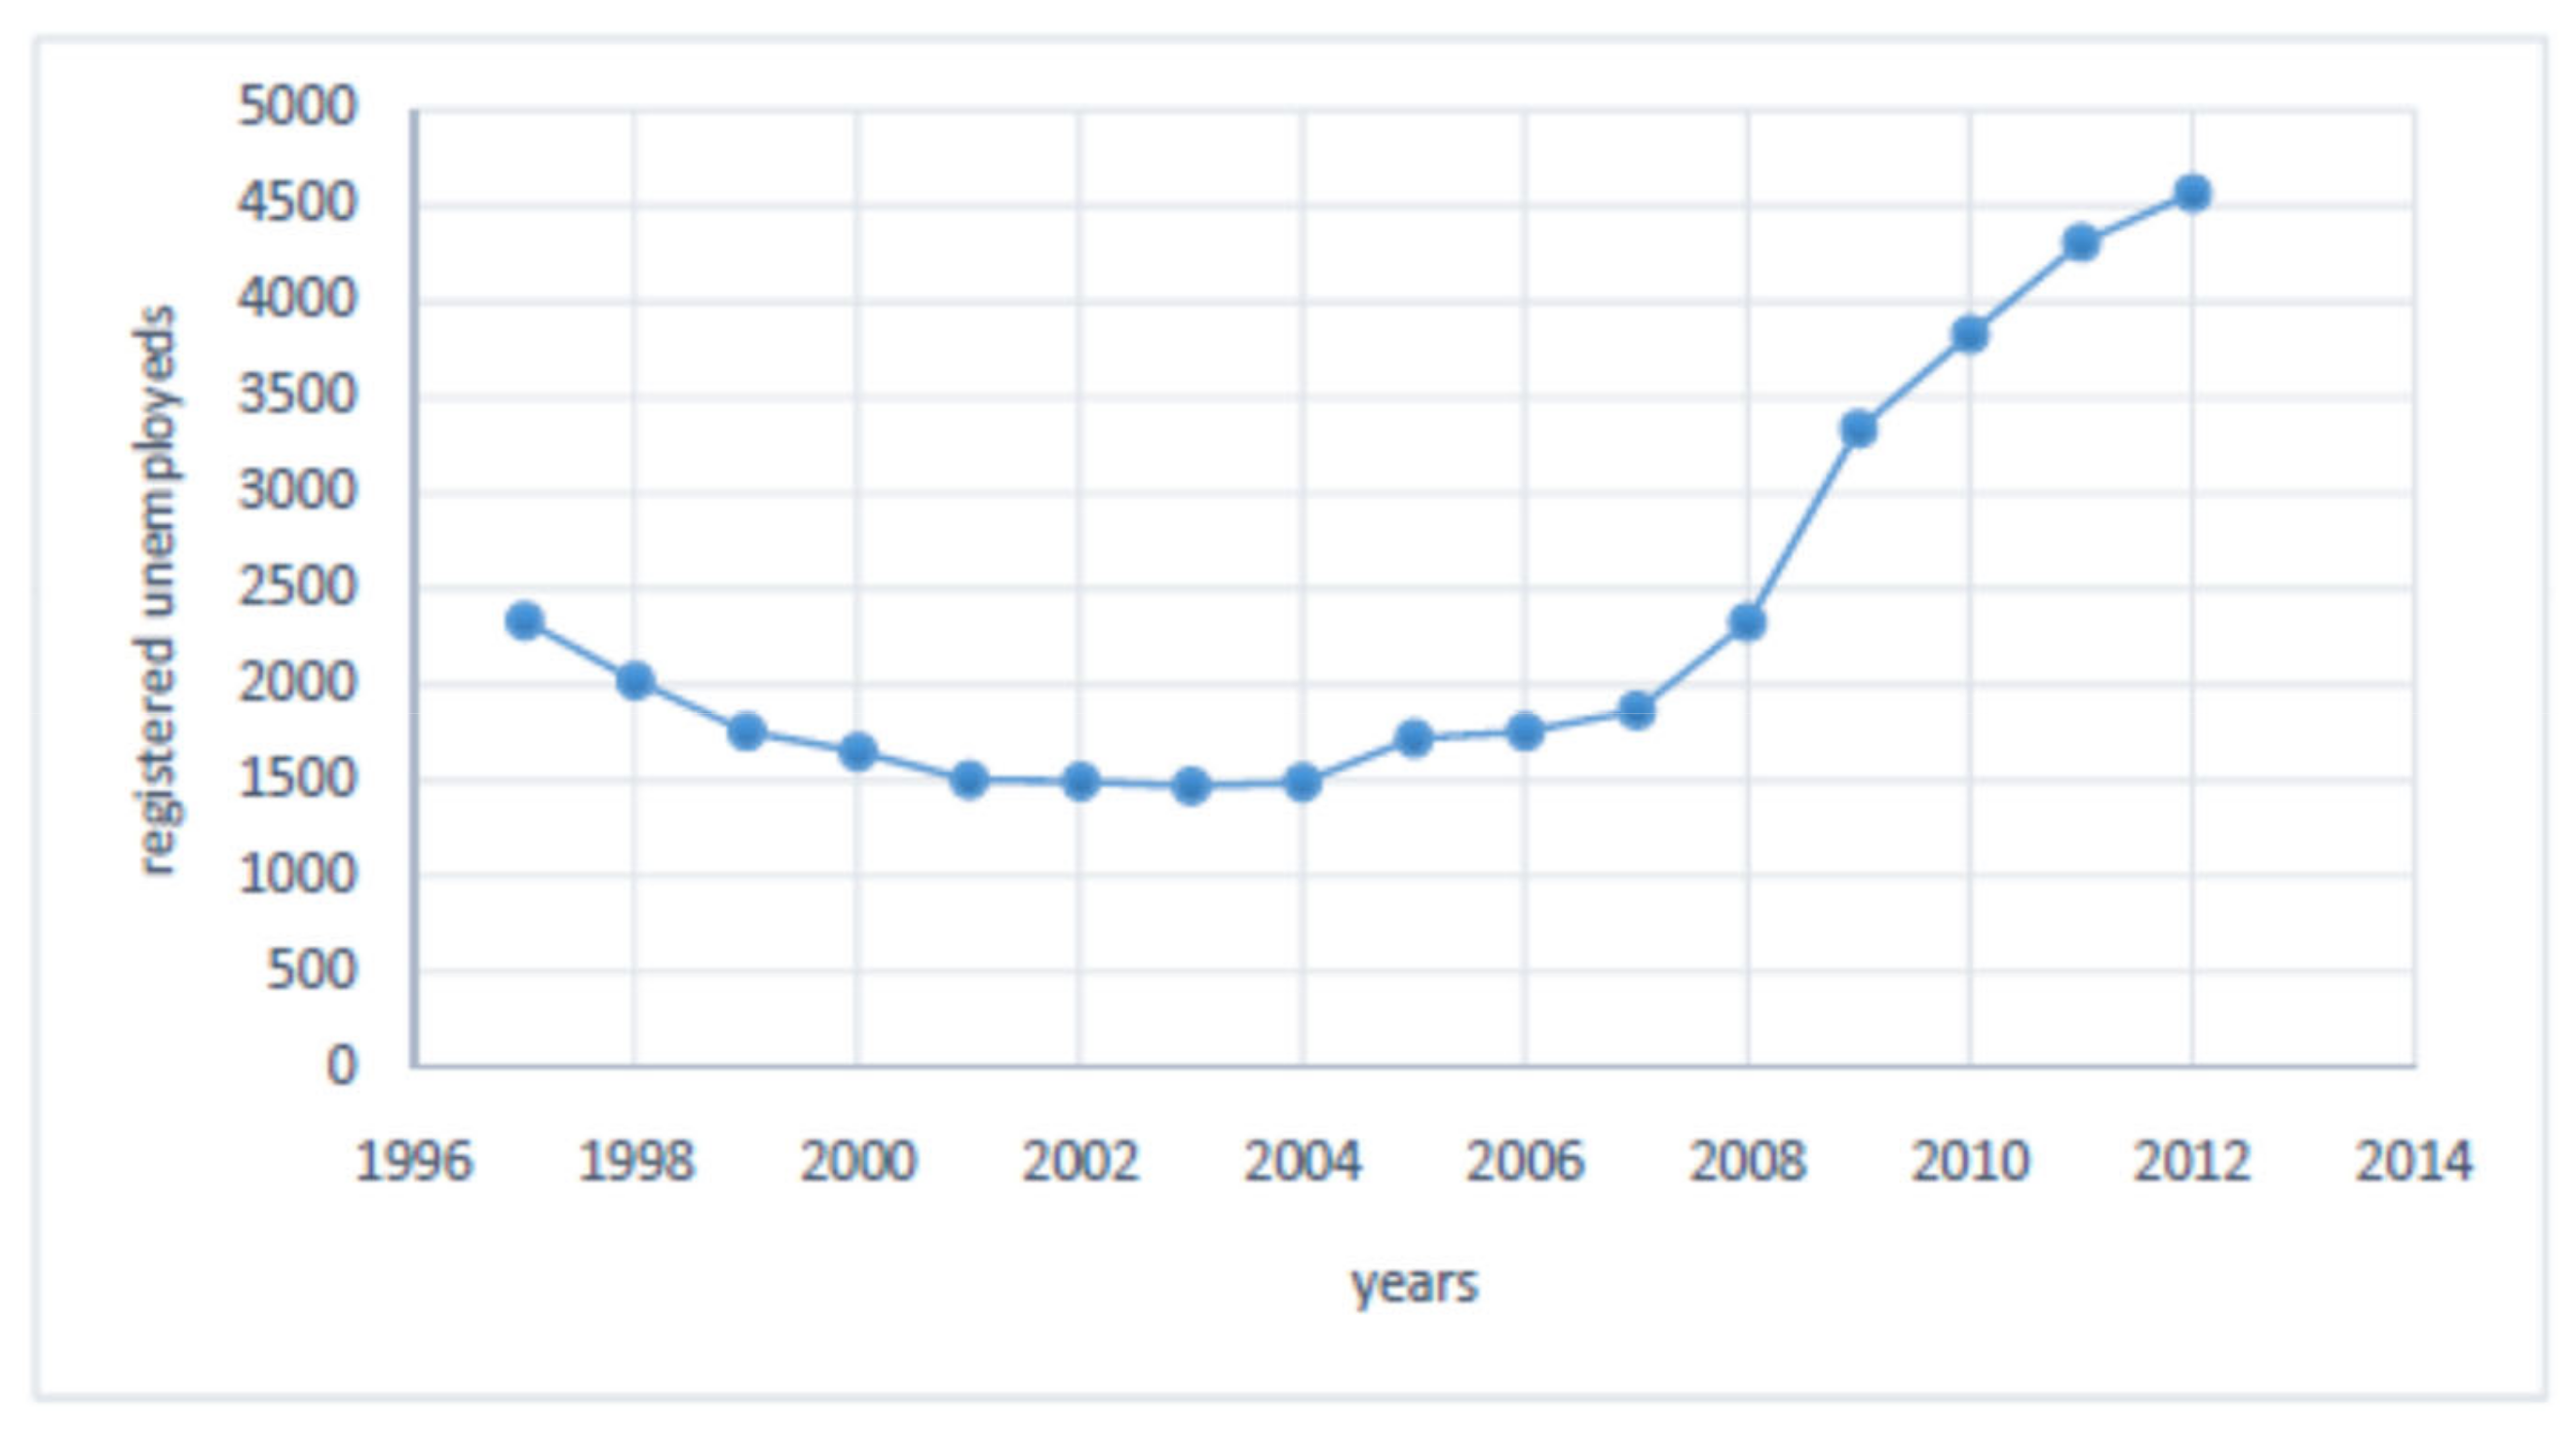
| 2.2. Unemployment | Unemployment rate | Line chart | Population censuses 1970 (total population); 1980, 1991, 2001, 2011; Málaga provincial council 1986 | Registered Unemployed 1996–2011 | |
| 2.3. Labour Immigration | Contingency table: preferential relationship with the activity/newcomers 2001–2011 | Inquiry on line: two-digit National Classification of Occupations (CNO) with the workers’ place of origin | Population census 2011 | ||
| 3. Relationship between residence and work place | 3.1. Work place | % distribution | Population census 2011 | ||
| 3.2. Relationship between work place and occupations | Contingency table | Population census 2011 | |||
| 4. The evolution of the productive fabric and the resulting characterisation | 4.1. Evolution of working population classified by the employer’s area of activity, classified by one, two or three digits | % distribution of working population classified by one digit CNAE 1980, 1991, 2001, 2011 | Evolution index number 1980–2011 | Population censuses, 1980, 1991, 2001, 2011 | |
| % distribution of working population (1991, 2001, 2011) in manufacturing industry classified by two-digit CNAE | |||||
| % distribution of working population (1991, 2001, 2011) in services subsector classified by two-digit CNAE | |||||
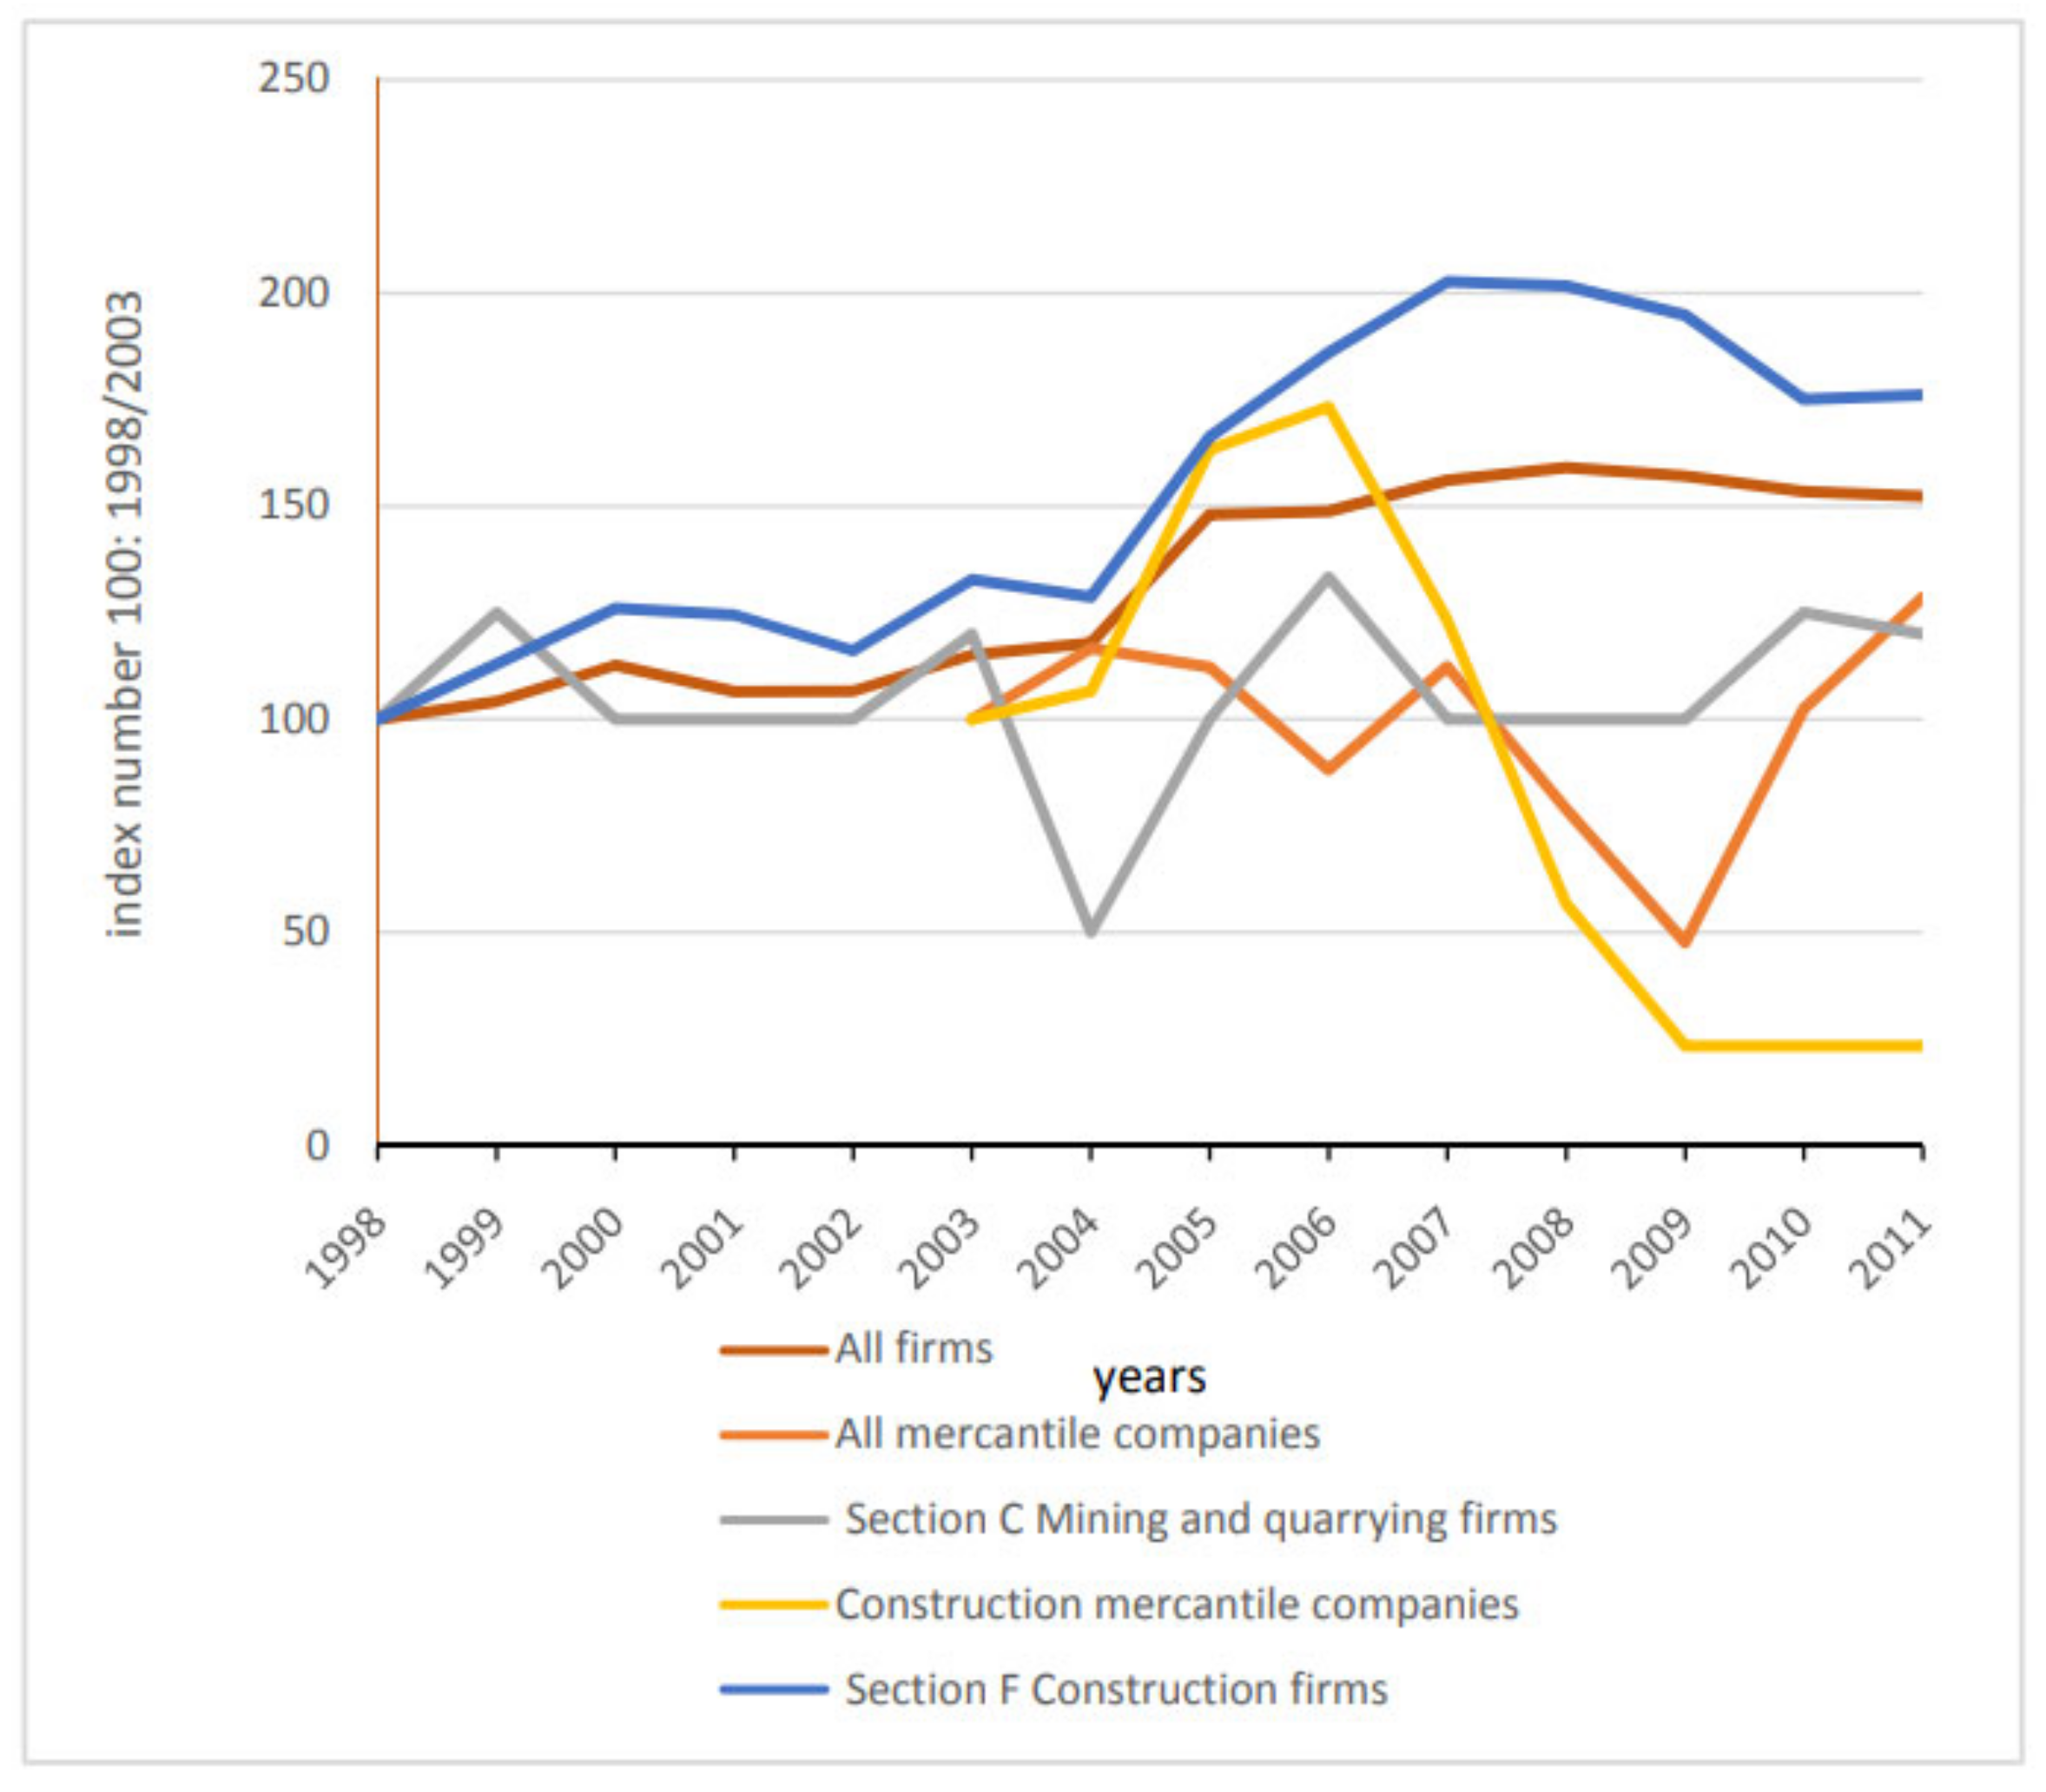
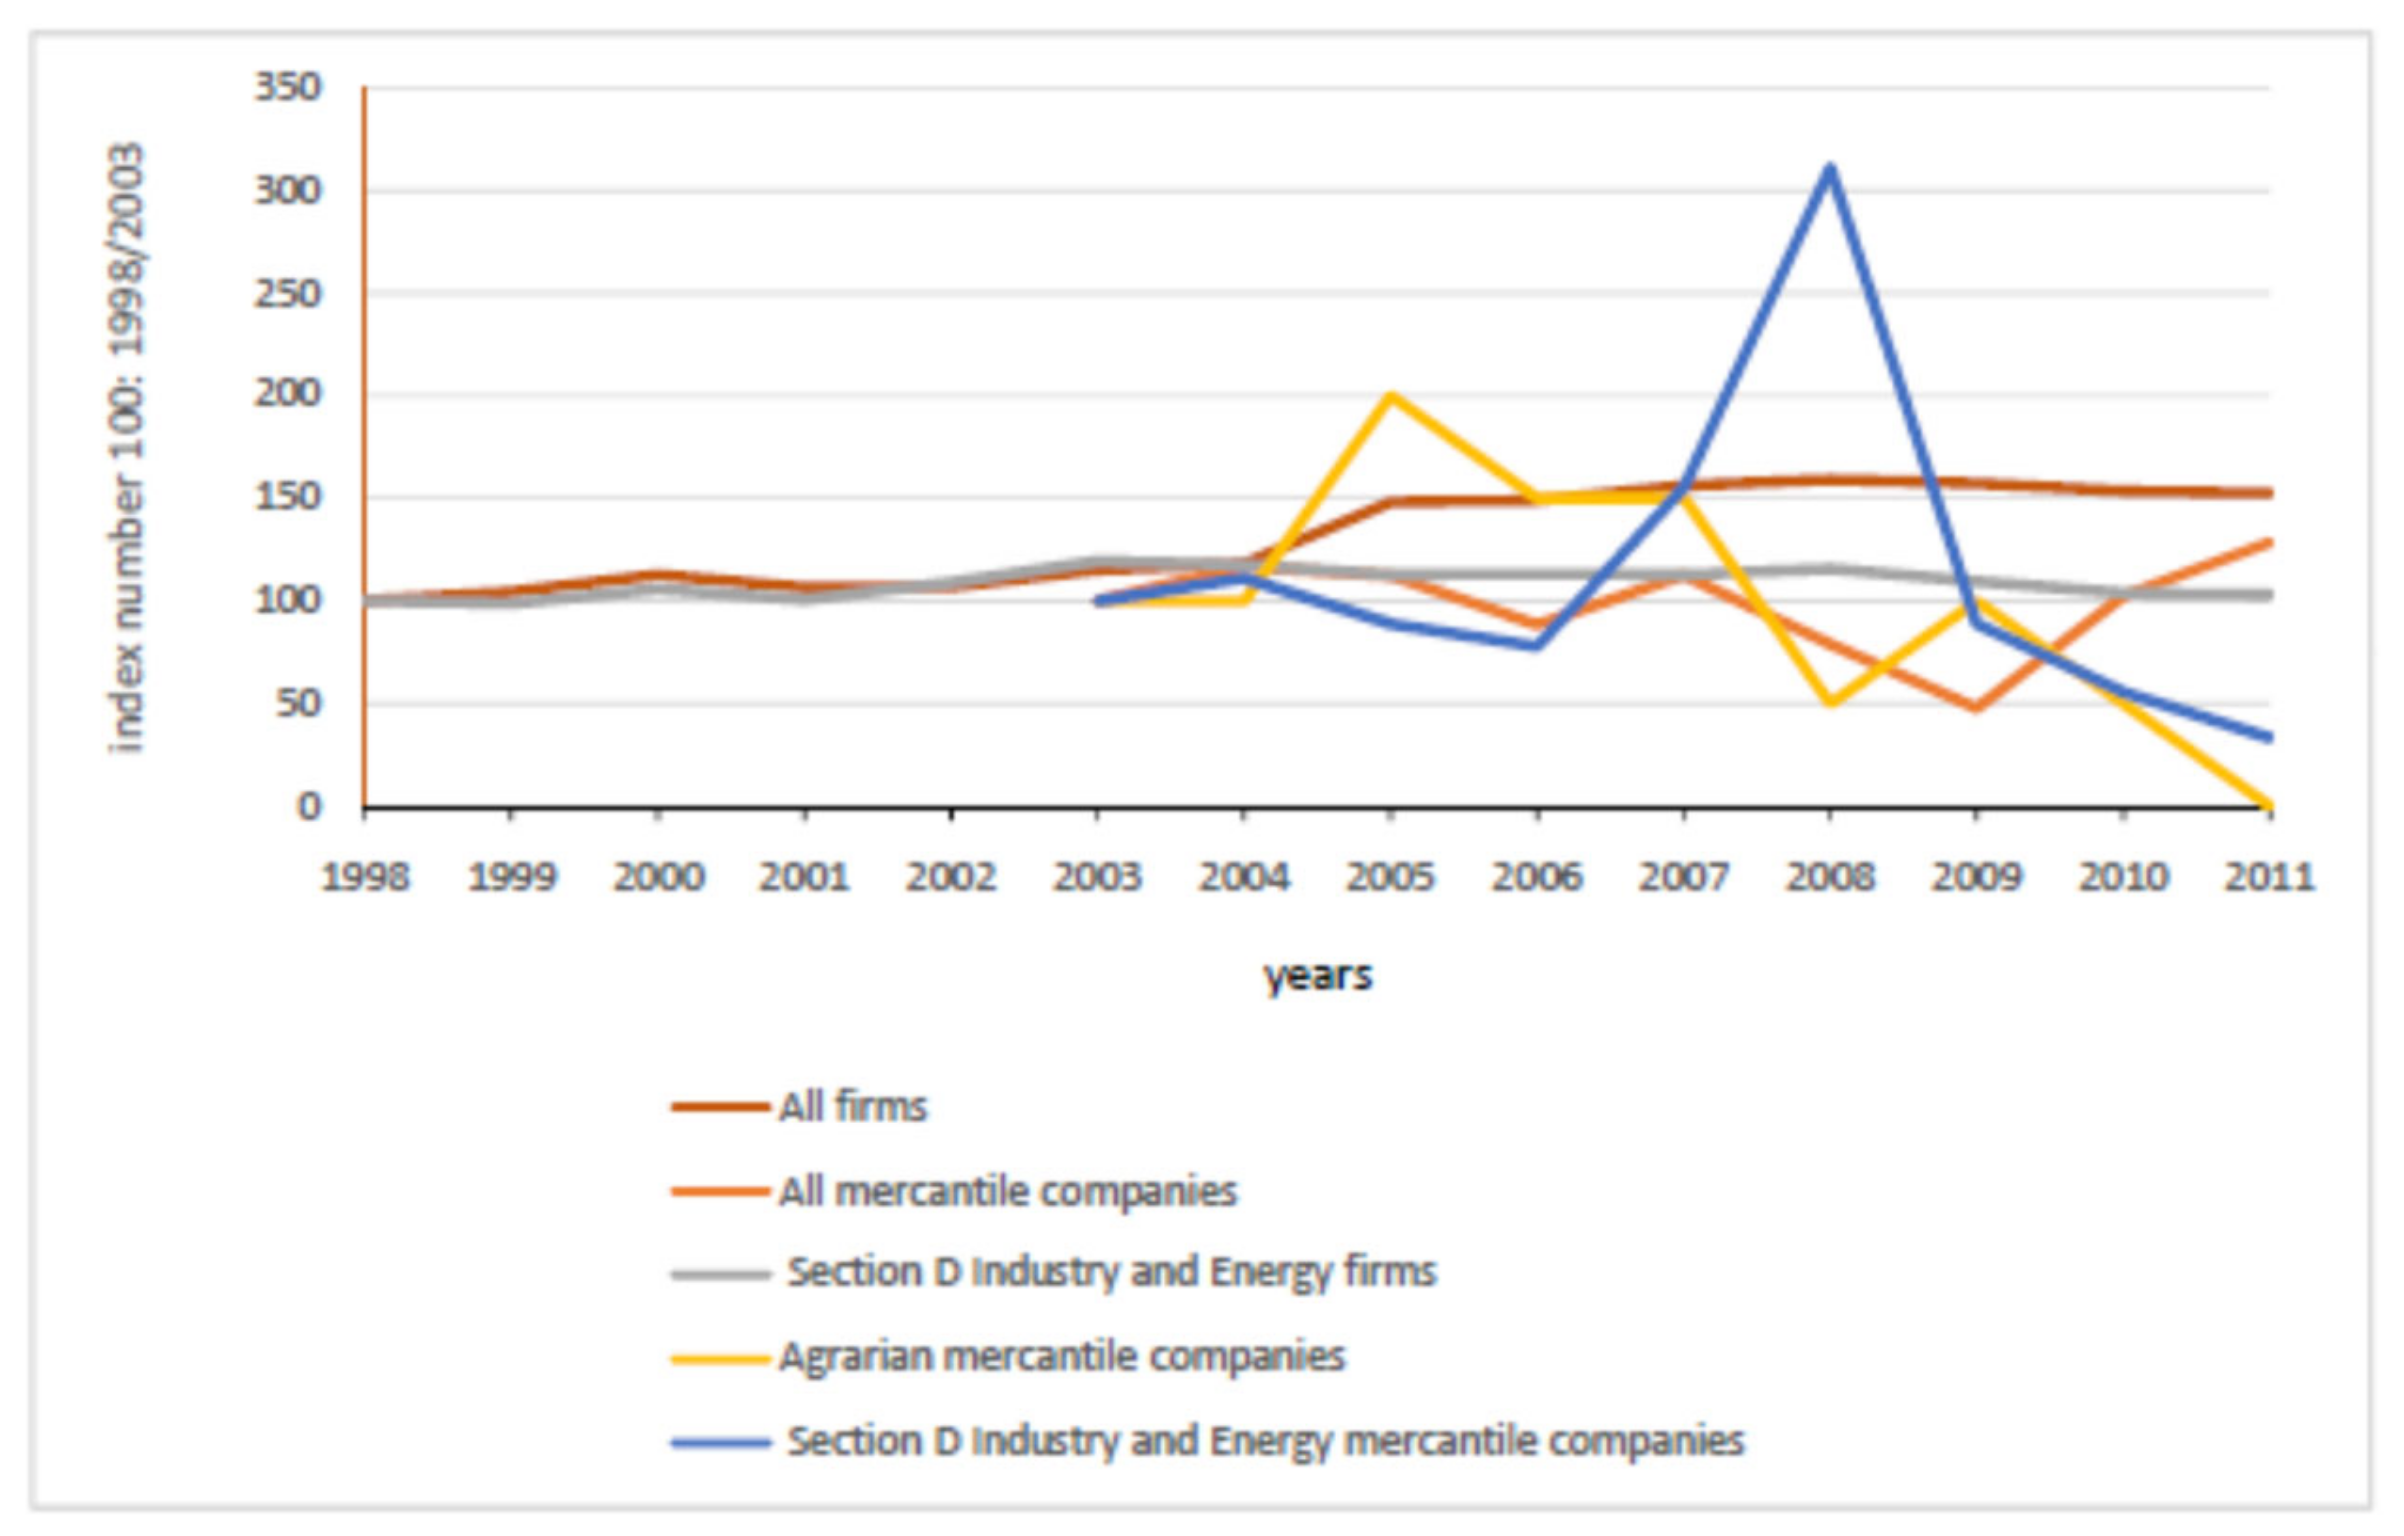
| 4.2. Evolution of business activity. | Evolution in index number Line chart. One per complex: (a) agriculture–food complex; (b) construction complex; (c) the complexes related to services activities are combined in a single figure. | Directory of Business Establish-ments. One digit CNAE. 1998–2011. | Statistical Yearbook on Commercial Companies in Andalusia. Branch CNAE. 2003–2011. | ||
| 4.3. Characterisation of productive fabric. | Contingency tables crossing two variables: the employer’s business activity sector (two-digit CNAE classification) and the CNO distribution by professions (one-digit classification). One per complex: (a) agriculture–food complex; (b) construction complex; (c) the complexes related to services activities are combined in a single figure. | Table: comparison of % distribution of population working in “Advanced services related to culture” and “Advanced services for business” in Antequera, Málaga and Andalusia | Population census 2011 | ||
| 5. Other specific subjects | 5.1. Impact of Agrarian Reform on employment | Evolution of number and surface area of farmlands per size category. | Evolution of AWU/ha cultivated | Agrarian censuses 1962–2009 | Population census 1991, 2011 |
| Evolution of AWU/agrarian worker | |||||
| Evolution of AWU/agrarian active population | |||||
| 5.2. Characterisation of tourism-related variables | Evolution of hotels and restaurants. Bar chart | Statistics on hotel and catering establishments. Regional Ministry of Tourism, Commerce and Sports |
| Years | Births | Deaths | Natural Balance | Balance | Migratory Balance | Birth Rate | Death Rate |
|---|---|---|---|---|---|---|---|
| 1975–1980 | 3989 | 1909 | 2080 | −4446 | −6526 | 17.50 | 8.38 |
| 1981–1990 | 5576 | 3176 | 2400 | 3000 | 600 | 14.96 | 14.20 |
| 1991–2000 | 4797 | 3284 | 1513 | 1524 | 11 | 12.14 | 13.85 |
| 2001–2009 | 4590 | 2979 | 1611 | 4879 | 3268 | 11.94 | 11.62 |
| 1970 | 1980 | 1986 | 1991 | 2001 | 2011 | |||||||
|---|---|---|---|---|---|---|---|---|---|---|---|---|
| Population over Age 16 | Total | Rate | Total | Rate | Total | Rate | Total | Rate | Total | Rate | Total | Rate |
| Men | 11,346 | 12,272 | 15,152 | 14,572 | 13,268 | 14,015 | ||||||
| Women | 11,938 | 12,715 | 15,881 | 15,511 | 13,339 | 13,570 | ||||||
| Total | 23,284 | 24,987 | 31,033 | 30,083 | 26,607 | 27,585 | ||||||
| Economically Active | ||||||||||||
| Men | 8891 | 72.4 | 10,443 | 68.9 | 9892 | 67.9 | 10.788 | 79.09 | 11.890 | 84.8 | ||
| Women | 2312 | 18.2 | 3680 | 23.1 | 4477 | 28.9 | 6.488 | 48.64 | 9.955 | 73.4 | ||
| Total | 12,035 | 51.69 | 11,203 | 44.8 | 14,123 | 45.5 | 14,369 | 47.8 | 17.276 | 64.93 | 21.845 | 79.2 |
| Total Inhabitants | 41,276 | 35,765 | 40,625 | 38,765 | 40,289 | 41,741 | ||||||
| Active | Workers | Unemployed | Rate | |
|---|---|---|---|---|
| Agriculture | 58,400 | 54,200 | 4200 | 7.19 |
| Industry | 47,750 | 44,800 | 2950 | 6.18 |
| Construction | 44,900 | 30,650 | 14,250 | 31.74 |
| Services | 148,650 | 140,600 | 8050 | 5.42 |
| Unemployed persons seeking first job | 8750 | 2.84 | ||
| Total | 308,450 | 270250 | 38,200 | 12.38 |
| SUBJECTS | Articles (n) | % Subject | % Total Articles |
|---|---|---|---|
| Economy | 21 | 37 | |
| Unemployment | 36 | 63 | |
| Global economic issues | 57 | 100 | 24 |
| Agricultural activities | 24 | 65 | |
| Water and irrigation | 5 | 14 | |
| Olive cultivation and processing | 8 | 22 | |
| Total agricultural sector | 37 | 100 | 15 |
| Industry | 33 | 55 | |
| Craftwork | 5 | 8 | |
| Industrial real estate | 19 | 32 | |
| SODIAN | 3 | 5 | |
| Total manufacturing sector | 60 | 100 | 25 |
| Services | 14 | 16 | |
| District capital status | 5 | 6 | |
| Regional capital status | 34 | 40 | |
| Heritage | 18 | 21 | |
| Tourism | 15 | 17 | |
| Total services subsectors | 86 | 100 | 36 |
| Infrastructure | 1 | 100 | 0.41 |
| Total articles | 241 | 100 |
| Kind of Land Use | Year | Number of Farmlands per Size (Hectares) | Total Farmlands | |||||
|---|---|---|---|---|---|---|---|---|
| 0.1 to <1 | >=0.1 to <5 | 5 to <10 | 10 to <20 | >=20 to <50 | >=50 | |||
| Total area | 1962 | 394 | 270 | 217 | 212 | 1093 | ||
| Total area | 1972 | 270 | 233 | 210 | 196 | 225 | 1134 | |
| UAA | 1982 | 352 | 205 | 203 | 179 | 219 | 1158 | |
| UAA | 1992 | 807 | 405 | 266 | 222 | 264 | 1967 | |
| UAA | 1999 | 1040 | 381 | 311 | 268 | 279 | 2279 | |
| UAA | 2009 | 8 | 847 | 372 | 271 | 234 | 238 | 1970 |
| Area (Hectares) | Total Area (ha) | |||||||
| Total area | 1962 | 1801 | 2753 | 3797 | 6624 | 59,657 | 74,652 | |
| UAA | 2009 | 7.59 | 2269.02 | 2702.37 | 4024.88 | 7794.53 | 42,927.6 | 5,9725.97 |
| Kind of Land Use | Years | Number of Farmlands per Size (Hectares) | Total Farmlands | |||||
| 0.1 to <1 | >=0.1 to <5 | 5 to <10 | 10 to <20 | >=20 to <50 | >=50 | |||
| Total area | 1962 | 100 | 100 | 100 | 100 | 100 | ||
| Total area | 1972 | 100 | 59 | 78 | 90 | 106 | 104 | |
| UAA | 1982 | 130 | 52 | 75 | 82 | 97 | 106 | |
| UAA | 1992 | 299 | 103 | 99 | 102 | 121 | 180 | |
| UAA | 1999 | 385 | 97 | 115 | 124 | 106 | 209 | |
| UAA | 2009 | 314 | 94 | 100 | 108 | 85 | 180 | |
| Years | Cultivated Land (ha) | LU | AWU | Agrarian Active Population (1) | Agrarian Workers (2) | AWU/ha Cultivated | AWU/Agrarian Worker | AWU/ Agrarian Active Population | |
|---|---|---|---|---|---|---|---|---|---|
| 1962 | 1093 | ||||||||
| 1972 | 1134 | 45,878 | |||||||
| 1982 | 1158 | 39,761 | 5966 | 1781 | 2001 | 0.045 | 0.890 | ||
| 1992 | 1967 | 45,348 | 10,267 | 2459 | 3846 | 1963 | 0.054 | 1.253 | 0.639 |
| 1999 | 2279 | 50,265 | 13,020 | 2457 | 1555 | 0.049 | 1.580 | ||
| 2009 | 1970 | 43,442 | 12,135 | 2159 | 2285 | 815 | 0.050 | 2.649 | 0.945 |
| Title | Scope of Decision Making | Kind of Planning | Date | Impact |
|---|---|---|---|---|
| Major Areas of Industrial Expansion in Andalusia (GAEIA) | Andalusia | Identification of the industrial sector as a driver of development. | 1981 (Decree) | Transfer of local industries to the industrial estate. |
| Agrarian Reform Act | Regional administration of Andalusia | Agrarian reform is viewed as an instrument to correct social inequalities. The measures adopted are aligned with the concept of integrated rural development. | 1984 (Antequera declared a target region for Agrarian Reform) | Short term: strengthening of the agriculture–food industry (canning and olive oil production). Medium term: moderate deconcentration of agricultural holdings. |
| Andalusian City System | Regional administration of Andalusia | Urban hierarchisation as an instrument for locating public services in the context of the welfare state | 1986 (publication) | Identification of Antequera as an intermediate-level town: supra-municipal siting of public facilities, e.g., the district hospital. |
| General Plan for Highways in Andalusia | Regional administration of Andalusia/EU (ERDF funding) | As above. | 1987 (publication) 1992 (inauguration) | Enhanced road accessibility of Antequera on the East–West communication axis, via the A92 highway. |
| Conversion of the Antequera-Málaga section of the N331 conventional road into a highway | Spanish Central Administration/EU (ERDF funding) | Centralised model of communications, radiating from the national capital. | 1992 inauguration | Enhanced road accessibility of Antequera regarding the North–South communication axis, Córdoba-Málaga (via the N-IV Mediterranean highway). |
| Basic Elements for Territorial Planning in Andalusia | Regional administration of Andalusia | Endogenous (local) development. | 1990 | No investment. |
| Local Autonomous Organisation for the Promotion and Development of Antequera (OAL) | Municipality of Antequera | Endogenous (local) development. | 1985? | Guidelines and procedures for business assistance: self-employment, SMEs. |
| Handbook of investment in Antequera | Municipality of Antequera | Foster new commercial activity. | 1985? | Establishment in the municipality of companies investing non-local capital. |
| SECTORS | 1980 | 1991 | 2001 | 2011 | INDEX NUMBER (1980: 100) | |||||||
|---|---|---|---|---|---|---|---|---|---|---|---|---|
| Total | % | Total | % | Total | % | Total | % | 1981 | 1991 | 2001 | 2011 | |
| Agriculture | 2001 | 26.5 | 1814 | 17.9 | 1555 | 11.3 | 815 | 5.7 | 100 | 91 | 78 | 41 |
| Industry | 944 | 12.5 | 1320 | 13.0 | 1743 | 12.6 | 1475 | 10.3 | 100 | 140 | 185 | 156 |
| Construction | 831 | 11 | 1567 | 15.5 | 2401 | 17.4 | 1215 | 8.5 | 100 | 189 | 289 | 146 |
| Services | 3776 | 50 | 5414 | 53.5 | 8084 | 58.7 | 10,815 | 75.5 | 100 | 143 | 214 | 286 |
| Total | 7552 | 100 | 10,115 | 100 | 13,783 | 100 | 14,320 | 100 | 100 | 134 | 183 | 190 |
| 1991 | 2001 | 2011 | ||||
|---|---|---|---|---|---|---|
| Activity in the worksite | Total | % | Total | % | Total | % |
| Sec. C. Extractive | 19 | 1.4 | 4 | 0.2 | 15 | 1.1 |
| Food, drink, tobacco | 473 | 35.8 | 535 | 30.7 | 730 | 52.9 |
| Textile, leather, shoe, apparel | 392 | 29.7 | 458 | 26.3 | 75 | 5.4 |
| Furniture, wood, cork | 29 | 2.2 | 114 | 6.5 | 35 | 2.5 |
| Paper, graphics | 44 | 3.3 | 63 | 3.6 | 35 | 2.5 |
| Manufacture of coke and refined petroleum products | 1 | 0.1 | 4 | 0.2 | 0 | 0.0 |
| Chemicals and cement | 91 | 6.9 | 175 | 10.0 | 95 | 6.9 |
| Basic metal products | 15 | 1.1 | 10 | 0.6 | 20 | 1.4 |
| Manufacture of fabricated metal products, except machinery and equipment | 85 | 6.4 | 132 | 7.6 | 30 | 2.2 |
| Manufacture of electrical, electronic and optical products | 30 | 2.3 | 93 | 5.3 | 75 | 5.4 |
| Manufacture of transport equipment | 23 | 1.7 | 8 | 0.5 | 0 | 0.0 |
| Materials recovery and other manufacturing | 60 | 4.5 | 50 | 2.9 | 115 | 8.3 |
| Electricity, gas and water supply | 58 | 4.4 | 97 | 5.6 | 155 | 11.2 |
| Total | 1.320 | 100 | 1.743 | 100 | 1380 | 100 |
| 1970 | 1980 | 1991 | 2001 | 2011 | ||||||
|---|---|---|---|---|---|---|---|---|---|---|
| Total | Un-emp. Rate | Total | Un- emp. Rate | Total | Un- emp. Rate | Total | Un- emp. Rate | Total | Un- emp. Rate | |
| Active population | 12,035 | 11,203 | 14,242 | 17,276 | 21,845 | |||||
| Workers | 7552 | 10,115 | 13,783 | 14,320 | ||||||
| Unemployed | 3651 | 32.59 | 4127 | 28.98 | 3493 | 20.22 | 7525 | 34.45 | ||
| Registered unemployed | 1579 | 9.14 | 4309 | 19.73 | ||||||
| Total population | 35,765 | 38,765 | 40,289 | 41,741 | ||||||
| Unemployment rate APS province of Málaga 1976 | 15.22 | |||||||||
| Activity of Worksite | 1991 | 2001 | 2011 | Balance 2011–2001 | ||||
|---|---|---|---|---|---|---|---|---|
| Total | % | Total | % | Total | % | Balance | As % Workers in Growing Activities | |
| Wholesale trade | 305 | 5.6 | 660 | 8.2 | 590 | 5.5 | −70 | |
| Retail trade | 883 | 16.3 | 1829 | 22.6 | 2095 | 19.4 | 266 | 9.0 |
| Repair of motor vehicles and motorcycles | 272 | 5.0 | 384 | 4.8 | 235 | 2.2 | 149 | |
| Accommodation and food service activities | 420 | 7.8 | 645 | 8.0 | 1175 | 10.9 | 530 | 18.0 |
| Transportation and communication | 520 | 9.6 | 653 | 8.1 | 950 | 8.8 | 297 | 10.1 |
| Financial and insurance activities | 351 | 6.5 | 293 | 3.6 | 425 | 3.9 | 132 | 4.5 |
| Business services | 113 | 2.1 | 572 | 7.1 | 800 | 7.4 | 228 | 7.7 |
| Public administration and defence; compulsory social security | 676 | 12.5 | 732 | 9.1 | 760 | 7.0 | 28 | 0.9 |
| Education | 776 | 14.3 | 1011 | 12.5 | 1295 | 12.0 | 284 | 9.6 |
| Health | 502 | 9.3 | 917 | 11.3 | 1440 | 13.3 | 523 | 17.7 |
| Activities of households as employers of domestic personnel | 320 | 5.9 | 177 | 2.2 | ||||
| Other service activities | 276 | 5.1 | 211 | 2.6 | 1050 | 9.7 | 662 | 22.4 |
| TOTAL | 5414 | 100 | 8084 | 100 | 10,815 | 100 | 2731 | 100 |
| Workers | ||
|---|---|---|
| Work Place | Total | % |
| Antequera | 11,305 | 78.95 |
| Málaga city | 565 | 3.95 |
| Another municipality in Málaga province | 680 | 4.75 |
| Municipality in an adjoining province | 380 | 2.65 |
| Other province and region | 250 | 1.75 |
| Several municipalities | 1140 | 7.96 |
| 14,320 | 100 | |
| Spanish National Classification of Occupations (CNO) | Antequera | Another Municipality in Málaga Province | Another Province in Andalusia | Another Region | Several Municipalities | Total | |
|---|---|---|---|---|---|---|---|
| 0—Military professions | Total | 0 | 0 | 15 | 15 | 0 | 30 |
| % | 0 | 0 | 50 | 50 | 0 | 100 | |
| 1—Managers | Total | 385 | 60 | 10 | 10 | 30 | 495 |
| % | 78 | 12 | 2 | 2 | 6 | 100 | |
| 2—Technicians and scientists | Total | 1415 | 335 | 195 | 45 | 80 | 2070 |
| % | 68 | 16 | 9 | 2 | 4 | 100 | |
| 3—Technicians; supporting staff | Total | 1005 | 100 | 10 | 15 | 195 | 1325 |
| % | 76 | 8 | 1 | 1 | 15 | 100 | |
| 4—Accountants, administrative staff and other office workers | Total | 1185 | 210 | 40 | 35 | 45 | 1515 |
| % | 78 | 14 | 3 | 2 | 3 | 100 | |
| 5—Salaried workers in catering services, personal services, security and shopkeepers | Total | 2990 | 205 | 25 | 45 | 210 | 3475 |
| % | 86 | 6 | 1 | 1 | 6 | 100 | |
| 6—Skilled workers in agriculture, livestock, forestry and fishing | Total | 375 | 0 | 0 | 0 | 65 | 440 |
| % | 85 | 0 | 0 | 0 | 15 | 100 | |
| 7—Artisans and skilled workers in manufacturing and construction (except plant and machinery operators) | Total | 1290 | 95 | 50 | 10 | 120 | 1565 |
| % | 82 | 6 | 3 | 1 | 8 | 100 | |
| 8—Plant and machinery operators and assemblers | Total | 845 | 110 | 35 | 0 | 240 | 1230 |
| % | 69 | 9 | 3 | 0 | 20 | 101 | |
| 9—Basic occupations | Total | 1820 | 125 | 45 | 35 | 155 | 2180 |
| % | 83 | 6 | 2 | 2 | 7 | 100 | |
| Total | Total | 11,310 | 1240 | 425 | 210 | 1140 | 14,325 |
| % | 79 | 9 | 3 | 1 | 8 | 100 | |
| Full-Time Workers | Part-Time Workers | Unemployed | Unemployed Seeking 1st Employment | C Economically Active | % C/A, B | ||
|---|---|---|---|---|---|---|---|
| A Total Population 2011 | 41,590 | 12045 | 2275 | 6390 | 1135 | 21845 | 52.5 |
| B Newcomers 2001–2011 | 3905 | 1650 | 350 | 895 | 125 | 3020 | 77.3 |
| % B/A | 9.4 | 13.7 | 15.4 | 14.0 | 11.0 | 13.8 |
| Activity of Worksite Two-Digit Disaggregation CNAE09 | Workers (One-Digit Spanish National Classification of Occupations, CNO) | |||||||||||
|---|---|---|---|---|---|---|---|---|---|---|---|---|
| 1 | 2 | 3 | 4 | 5 | 6 | 7 | 8 | 9 | Total | Workers (1) | ||
| Total | % (2) | |||||||||||
| 01. Crop and animal production, hunting and related service activities Total | * | * | * | * | * | 310 | * | 110 | 305 | 725 | 815 | 89 |
| % | 43 | 15 | 42 | 100 | ||||||||
| 10. Manufacture of food products, beverages and tobacco products Total | * | * | * | 70 | * | * | 210 | 165 | 90 | 535 | 730 | 73 |
| % | 13 | 39 | 31 | 17 | 100 | |||||||
| 75. Veterinary activities | * | * | * | * | * | * | * | * | * | * | 15 | |
| Workers (One-Digit Spanish National Classification of Occupations, CNO) | ||||||||||||
|---|---|---|---|---|---|---|---|---|---|---|---|---|
| Activity of Worksite Two-Digit Disaggregation CNAE09 | 1 | 2 | 3 | 4 | 5 | 6 | 7 | 8 | 9 | Total | Workers (1) | |
| Total | % (2) | |||||||||||
| 08. Other mining and quarrying | 15 | |||||||||||
| 41. Construction of buildings | * | 75 | 125 | * | * | * | 250 | * | 85 | 450 | 595 | 76 |
| % | 17 | 28 | 56 | 19 | 100 | |||||||
| 42. Civil engineering | * | * | * | * | * | * | 160 | * | * | 160 | 345 | 46 |
| % | 100 | 100 | ||||||||||
| 43. Specialised construction activities | * | * | * | * | * | * | 145 | * | * | 145 | 275 | 58 |
| % | 100 | 100 | ||||||||||
| 68. Real estate activities | 90 | |||||||||||
| 81. Services to buildings and landscape activities | * | * | * | * | * | * | * | * | 95 | 175 | 54 | |
| % | 100 | 0 | ||||||||||
| Workers (One-Digit Spanish National Classification of Occupations, CNO) | |||||||||||
|---|---|---|---|---|---|---|---|---|---|---|---|
| Activity of Worksite Two-Digit Disaggregation CNAE09 | 1- | 2- | 3- | 4- | 5- | 6- | 7- | 8- | 9- | Total Workers | |
| District capital status | 84. Public administration and defence; compulsory social security | * | 85 | 120 | 185 | 275 | * | * | * | * | 760 |
| 85. Education | * | 935 | 105 | 70 | 110 | * | * | * | 50 | 1295 | |
| 86. Human health activities | * | 565 | 80 | 85 | 310 | * | * | * | * | 1155 | |
| 88. Social work activities without accommodation | * | * | * | * | 75 | * | * | * | * | 100 | |
| Tourism and recreation | 55. Accommodation | * | * | * | * | 205 | * | * | * | 95 | 450 |
| 56. Food and beverage service activities | * | * | * | * | 550 | * | * | * | 90 | 725 | |
| 79. Travel agency, tour operator and other reservation services and related activities | * | * | * | * | * | * | * | * | * | 10 | |
| 93. Sports activities and amusement and recreation activities | * | * | * | * | * | * | * | * | * | 75 | |
| Skills-based business services | 61. Telecommunications | * | * | * | * | * | * | * | * | * | 45 |
| 62. Computer programming, consultancy and related activities | * | * | 95 | * | * | * | * | * | * | 105 | |
| 69. Legal and accounting activities | * | 85 | * | * | * | * | * | * | * | 110 | |
| 70. Activities of head offices; management consultancy activities | * | * | * | * | * | * | * | * | * | 50 | |
| 71. Architectural and engineering activities; technical testing and analysis | * | * | * | * | * | * | * | * | * | 85 | |
| 74. Other professional, scientific and technical activities | * | * | * | * | * | * | * | * | * | 10 | |
| 78. Employment activities | * | * | * | * | * | * | * | * | * | 10 | |
| 80. Security and investigation activities | * | * | * | * | * | * | * | * | * | 15 | |
| 82. Office administrative, office support and other business support activities | * | * | * | 115 | * | * | * | * | * | 230 | |
| Skilled services related to culture | 58. Edition | * | * | * | * | * | * | * | * | * | 20 * |
| 59. Motion picture, video and television programme production, sound recording and music publishing activities | * | * | * | * | * | * | * | * | * | 20 * | |
| 60. Programming and broadcasting activities | * | * | * | * | * | * | * | * | * | 25 * | |
| 63. Information service activities | * | * | * | * | * | * | * | * | * | 75 | |
| 90. Creative, arts and entertainment activities | * | * | * | * | * | * | * | * | * | 14 | |
| 91. Libraries, archives, museums and other cultural activities | * | * | * | * | * | * | * | * | * | 20 * | |
| Activity of Worksite Two-Digit Disaggregation CNAE09 | Andalusia | Málaga | Antequera | |||
|---|---|---|---|---|---|---|
| Total | % | Total | % | Total | % | |
| 58. Edition | 3830 | 12 | 920 | 14 | 20 | 11 |
| 59. Motion picture, video and television programme production, sound recording and music publishing activities | 2370 | 8 | 425 | 7 | 20 | 11 |
| 60. Programming and broadcasting activities | 4900 | 16 | 860 | 13 | 25 | 14 |
| 63. Information service activities | 7340 | 23 | 1470 | 23 | 75 | 41 |
| 90. Creative, arts and entertainment activities | 9320 | 30 | 1945 | 30 | 14 | 14 |
| 91. Libraries, archives, museums and other cultural activities | 3640 | 12 | 825 | 13 | 20 | 11 |
| Total | 31,400 | 100 | 6445 | 100 | 185 | 100 |
| % over total workers in services | 1.58 | 1.49 | 1.71 | |||
| Activity of Worksite Two-Digit Disaggregation CNAE09 | Andalusia | Málaga | Antequera | |||
|---|---|---|---|---|---|---|
| Total | % | Total | % | Total | % | |
| 69. Legal and accounting activities | 40,720 | 22 | 9795 | 24 | 110 | 16 |
| 70. Activities of head offices; management consultancy activities | 8890 | 5 | 2045 | 5 | 50 | 7 |
| 71. Architectural and engineering activities; technical testing and analysis | 24,145 | 13 | 3940 | 10 | 85 | 13 |
| 72. Scientific research and development | 9010 | 5 | 1025 | 3 | 0 | 0 |
| 73. Advertising and market research | 5425 | 3 | 1220 | 3 | 0 | 0 |
| 74. Other professional, scientific and technical activities | 16,310 | 9 | 3420 | 8 | 10 | 1 |
| 61. Telecommunications | 18,205 | 10 | 4410 | 11 | 105 | 16 |
| 62. Computer programming, consultancy and related activities | 22,610 | 12 | 4910 | 12 | 45 | 7 |
| 78. Employment activities | 2195 | 1 | 635 | 2 | 10 | 1 |
| 80. Security and investigation activities | 11,250 | 6 | 2790 | 7 | 15 | 2 |
| 82. Office administrative, office support and other business support activities | 28,295 | 15 | 6130 | 15 | 230 | 34 |
| Total | 188,930 | 100 | 40,635 | 100 | 675 | 100 |
| % over total workers in services | 9.51 | 9.37 | 6.24 | |||
Publisher’s Note: MDPI stays neutral with regard to jurisdictional claims in published maps and institutional affiliations. |
© 2021 by the author. Licensee MDPI, Basel, Switzerland. This article is an open access article distributed under the terms and conditions of the Creative Commons Attribution (CC BY) license (https://creativecommons.org/licenses/by/4.0/).
Share and Cite
Gómez-Moreno, M.-L. Employment or Development in a Semi-Peripheral Region: The Roadrunner Paradigm. Sustainability 2021, 13, 10545. https://doi.org/10.3390/su131910545
Gómez-Moreno M-L. Employment or Development in a Semi-Peripheral Region: The Roadrunner Paradigm. Sustainability. 2021; 13(19):10545. https://doi.org/10.3390/su131910545
Chicago/Turabian StyleGómez-Moreno, María-Luisa. 2021. "Employment or Development in a Semi-Peripheral Region: The Roadrunner Paradigm" Sustainability 13, no. 19: 10545. https://doi.org/10.3390/su131910545
APA StyleGómez-Moreno, M.-L. (2021). Employment or Development in a Semi-Peripheral Region: The Roadrunner Paradigm. Sustainability, 13(19), 10545. https://doi.org/10.3390/su131910545