Article

Research on the Impact of Urban Rail Transit on the Financing Constraints of Enterprises from the Perspective of Sustainability

1
School of Economics and Management, Beijing Jiaotong University, Beijing 100044, China
2
Department of Asian and International Studies, City University of Hong Kong, Hong Kong, China
3
Florence School of Regulation, European University Institute, 50131 Florence, Italy
*
Authors to whom correspondence should be addressed.
Sustainability 2021, 13(19), 10543; https://doi.org/10.3390/su131910543
Submission received: 25 August 2021 / Revised: 17 September 2021 / Accepted: 21 September 2021 / Published: 23 September 2021

Abstract

:
Urban rail transit (URT) is closely related to the sustainable development of the city. In addition to the traffic improvements, it also brings social and economic benefits. From the perspective of sustainability, we discuss the effect of urban rail transit on financing constraints of companies listed on the China A-share stock market (A-share, common stocks issued by companies registered in China for domestic institutions, organizations or individuals to subscribe and trade in RMB) and further explore whether the level of financial development has an effect on the above relationship. The results show that: (1) Financing constraints are common among sample enterprises, and the later the opening year of urban rail transit, the greater the degree of financing constraints; (2) The development of urban rail transit is beneficial to alleviate the level of financing constraints of listed companies, and this mitigating effect mainly exists in the samples with high relevance to urban rail transit; (3) The higher the level of financial development, the smaller the degree of corporate financing constraints; (4) Financial development may influence the relationship between financing constraints and urban rail transit. With the improvement of the financial development level, the alleviating effect of urban rail transit on corporate financing constraints is less pronounced. This study gives some references to improve the financing constraints of listed companies and for promoting the sustainable development of urban rail transit.

1. Introduction

According to data released by the National Bureau of Statistics of China, by the end of 2020, the urbanization rate of the permanent population in the country exceeded 60%. To meet people’s needs for convenient, fast, and safe travel and to promote sustainable development of urban areas, it is necessary and urgent to invest in the construction of urban rail transit. Urban rail transit systems can be considered as a greener and more sustainable transportation mode than traditional urban transport. The development of urban rail transit is a logical evolution in light of the current challenges. According to the “2020 Annual Statistics and Analysis Report of Urban Rail Transit” issued by the China Association of Metros, as of the end of 2020, 244 urban rail transit operating lines have been opened in 45 cities in mainland China, with a total length of 7978.19 km. 2020 was the last year of the “13th Five-Year Plan”. The length of newly added operating lines that year was 1241.99 km, setting a new record high.
It is a fact that the construction of URT can not only effectively alleviate traffic congestion [1] and environmental pollution [2], but also promote the overall development of the city. Studies have confirmed the positive influence of urban rail transit on the site selection of residents and enterprises [3], land value [4], housing price [5,6,7], etc., as well as on urban expansion [8] and social and economic development [9,10]. At the same time, urban rail transit also brings good development opportunities related to upstream and downstream industries.
Most of the existing studies analyze the external effects of urban rail transit based on the macro level, but there is little literature exploring the impact of urban rail transit on enterprises. Funds are the “lifeblood” of a company, which must have sufficient financial support to carry out production and operation. When companies want to invest, and if internal funds are insufficient, they will seek to obtain funds from the external capital market. However, companies may not be able to successfully obtain sufficient funds from the outside. There are two reasons for this: one reason is that the company does not meet some specific conditions in the market; the other is that the market requires a higher rate of return, which may be beyond the reach of the company. When the above two situations exist, the enterprises face financing constraints. Financing constraints mainly refer to the restrictions that companies face when financing externally.
Li et al. [11] found that the construction of urban rail transit infrastructure positively affected the agglomeration of urban manufacturing and consumer service industries. Such a positive agglomeration effect is thus beneficial to reducing the degree of financing constraints of corporates [12]. In other words, the operation of urban rail transit may indirectly have a positive impact on reducing the financing constraints of corporates by promoting industrial agglomeration. In addition, the alleviating effect of industrial agglomeration on financing constraints is more obvious in enterprises with a poor initial financing environment [13]. Studies have also shown that the higher the level of regional financial development, the better the external financing environment, and the lower the level of financing constraints of companies [14,15]. This paper takes the annual data of companies listed in Stock A from 2009 to 2018 as the research sample, uses the sensitivity coefficient of corporate investment expenditure to cash flow as a measure of corporate financing constraints, and adopts the difference-in-differences model in order to explore whether the development of urban rail transit is conducive to alleviating financing constraint of enterprises. It furthermore tests whether the level of financial development has an effect on the above relationship.

2. Theoretical Analysis and Research Hypothesis

2.1. Urban Rail Transit and Financing Constraints

Classical financial theory believes that in a perfect capital market, a company’s external capital and internal capital can be completely replaced. Therefore, investment behavior is not affected by the company’s financial status, but is only related to the company’s investment needs. However, in the real world, there is no perfect capital market. Information asymmetry and agency problems will always lead to higher external than internal financing cost; the financing ability of the enterprise will always affect its investment behavior to a large extent. According to the theory of information asymmetry, in the loan market, enterprises have more information than external investors, so they may take self-interested actions that harm the interests of investors, which is called moral hazard. Based on the existence of moral hazard, it is difficult for financial institutional investors to make decisions smoothly, leading to transaction failure and the imbalance of supply and demand in the market, and then the market efficiency is reduced, which is called adverse selection. To avoid this kind of phenomenon, the rational financial institutions will determine average loan interest rates, and attach some conditions other than interest rates, thus leading to the problem of credit rationing; those companies with high-quality and low-risk characteristics are more favored by investors, while those companies that do not meet the conditions will fail in financing, so that enterprises are generally subject to varying degrees of financing constraints.
At the end of the 19th century, Marshall began to pay attention to the economic phenomenon of industrial agglomeration. Industrial agglomeration refers to the gathering of different types of enterprises producing a certain product, and the upstream and downstream entities, as well as relevant service industries supporting these enterprises within a fixed large regional scope. Credit [16] applied the agglomeration theory to the study of transportation accessibility and believed that specific modes of transportation would promote the agglomeration of certain types of industries, thus generating accessibility benefits. Yu et al. [17] found that rail transit exhibits different degrees of agglomeration effect on different industries. Lyu et al. [18] studied the TOD (Transit Oriented Development) model centered on the Beijing subway and found that wholesale and retail, accommodation and catering industries, and other consumer service-related industries tend to cluster in areas with strong TOD characteristics, and labor productivity tends to be relatively high. Li et al. [11] found that urban rail transit effectively guided the agglomeration of industries such as urban manufacturing and consumer service industries through the agglomeration of labor, capital, and technological innovation. Zheng [19] found that the new subway station has a positive effect on the agglomeration of nearby catering and other service industries and the stimulation of consumer demand. All this shows that the operation of URT system will promote the geographical agglomeration of related upstream and downstream industries, which is conducive to the development of enterprises.
The influence of the URT system on the corporate financing of the related upstream and downstream enterprises may be due to the positive agglomeration benefits brought about by industrial agglomeration. The agglomeration benefit makes the enterprises in the industrial agglomeration area have more advantages in financing. Firstly, based on the effect of learning mechanism, the agglomeration area has a high density of knowledge and technology resources, which is more conducive to mutual learning among enterprises and promotes efficient production and technology spillover [20]. Secondly, enterprises in industrial agglomeration areas are close to each other in geographical location, information transmission between enterprises is faster, information quality is higher, that is, information asymmetry phenomenon is reduced, which can generate commercial benefits between enterprises [21], and moral hazard and adverse selection problems are also reduced [22]. In the process of transaction, enterprises may get preferential prices due to the existence of commercial credit. Thirdly, smaller enterprises can unite to raise funds from financial institutions in the form of collective guarantees. This method can not only reduce credit costs but also enable financial institutions to better identify and control credit risks [23]. Finally, different enterprises in the same industry work together, which is conducive to the specialization and cooperation among enterprises. The initial capital required by enterprises is reduced, and the barriers to entering the industry are lowered [24]. Moreover, each enterprise is responsible for more detailed independent production links, so that the capital demand of enterprises is reduced [25,26,27]. In short, industrial agglomeration makes it easier for enterprises to raise external financing but also reduces the demand for internal funds; in other words, it effectively improves the financing difficulties of enterprises. Urban rail transit, as shown above, promotes the agglomeration and development of related industries. Based on this, the following hypothesis is proposed.
Hypothesis 1.
The development of urban rail transit is beneficial to alleviating the level of financing constraints of enterprises.

2.2. Financial Development and Corporate Financing Constraints

American economists John G. Gurley and Edward S. Shaw believe that economic development is the premise and foundation of financial development, while financial development is the driving force and means of economic development. Financial development is the continuous improvement of financial efficiency brought about by the expansion of the scale of financial transactions and the advancement of the financial industry. According to the actual situation of developing countries, Ronald I. McKinnon and Edward S. Shaw proposed financial repression, which refers to the phenomenon that the government’s excessive intervention in financial activities and the financial system inhibits the development of the financial system, and the lagging development of the financial system hinders economic development. The improvement of the level of financial development is reflected in the removal of financial repression and streamlining the financial structure, including the innovative application of financial tools and diversification of financial institutions amid the changing economic environment. External macro-economic conditions will have an impact on the internal capital structure of enterprises [28]. A sound regional financial environment leads to the fact that enterprises have more extensive financing channels and can meet their financing needs in multiple ways. The more developed the financial market, the lower the transaction costs [29]. In addition, information in developed financial markets is typically more transparent and information asymmetry is reduced [30], which not only improves the problem of credit rationing in the capital market to a certain extent, but also improves the allocation efficiency of resources and reduces the external financing cost of enterprises, thus reducing the financing constraint level of enterprises [31,32]. Laeven [33] conducted an empirical study and found that the lower the degree of financial repression, the lower the degree of financing constraint of enterprises. Compared with large-scale enterprises, this phenomenon is more obvious for small-scale companies. According to the report of the marketization process by Fan Gang and Wang Xiaolu, regions with higher levels of financial development are more dependent upon market factors in the allocation of credit funds [34]. Therefore, it can be concluded that the higher the level of financial development, the less the enterprise will be affected by non-market factors in the financing process, and the problem of ownership discrimination will be alleviated to a certain extent. Therefore, the possibility for non-state-owned enterprises to obtain bank loans will be increased.
To summarize, on the one hand, the increase in the level of financial development not only expands the sources of financing in terms of quantity, but also eliminates “scale discrimination” and “ownership discrimination” to a certain extent, that is, the phenomenon of financial institutions rejecting small-scale enterprises and non-state-owned enterprises’ loan applications, thus increasing the possibility that the enterprise obtains the loan successfully. On the other hand, financial development reduces the financing cost and the information asymmetry between enterprises and external investors, and thus improves the financing constraint dilemma of enterprises. Based on this, the following hypothesis is proposed:
Hypothesis 2.
The higher the level of financial development, the lower the degree of financing constraints faced by enterprises.

2.3. Urban Rail Transit, Financial Development and Financing Constraints

The positive externalities brought by industrial agglomeration to enterprises may have an “inflection point”, that is, excessive agglomeration may lead to diminishing agglomeration benefits [35]. When the nature of enterprise ownership and enterprise size are considered, private enterprises and small enterprises have higher operating risks, lower financing qualifications, and are often located in a poorer financing environment. When considering the size and attributes of the company, the industrial agglomeration has a more obvious alleviating effect on the financing difficulties of private enterprises and small enterprises [36]. Sun et al. [37] conducted an empirical study on companies in high-tech industrial development zones listed on the New Third Board (National Equities Exchange and Quotations; it is China’s third national securities trading venue after the Shanghai Stock Exchange and the Shenzhen Stock Exchange, mainly targeting small, medium, and micro enterprises) and found that such companies face significantly less financing constraints than companies outside such high-tech development zones. They also found that the role of high-tech zones is more pronounced for small-scale enterprises and private enterprises, as well as enterprises in areas with poorer regional development levels. This shows that the mitigation effect of industrial agglomeration on financing constraints is characterized by “decreasing marginal efficiency”, that is, when the external financing environment of the enterprise is poor, the effect of industrial agglomeration on the improvement of corporate financing constraints is more obvious; with the continuous optimization of the corporate environment, this mitigation effect is no longer significant.
From the perspective of the level of regional financial development, a sound regional financial environment indicates that companies have more available financing channels. In addition to bank credit financing, companies can also use other means to raise funds, such as commercial credit, private equity, venture capital, etc. According to Hypothesis 2, when the level of financial development is high, the enterprise may not have difficulties in financing or the level of financing constraint is lower. However, in areas with relatively poorer financial development, enterprises often face serious financing difficulties. The operation and development of urban rail transit can promote the agglomeration and development of related industries and improve the financing environment faced by enterprises, so as to alleviate the financing constraint dilemma of enterprises. However, for the regions with higher financial development levels, the level of enterprise financing constraint is anyway low, and the influence of urban rail transit on enterprise financing constraints remains small. Based on this, the following hypothesis is proposed:
Hypothesis 3.
The lower the level of financial development, the more significant the effect of urban rail transit on corporate financing constraints, the higher the level of financial development, the less obvious the effect of urban rail transit on corporate financing constraints.
As we can see from Figure 1, we conducted theoretical analysis and proposed three research hypotheses in the second part. In the third part, we will introduce the research design of this article, including sample selection, variable definition, and model construction. In the fourth part, we will conduct empirical tests on three research hypotheses.

3. Research Design

3.1. Sample Source

Difference-in-Differences (DID), as a powerful tool in policy effect assessment, has attracted more and more attention. The basic idea of the DID method is to construct differential statistics to reflect the policy effect by comparing the differences between the control group and the treatment group before and after the implementation of the policy. In this paper, whether urban rail transit is operated or not can be regarded as the occurrence and non-occurrence of the policy, and corporate financing constraints can be regarded as the observed object, so the DID method is suitable for the research of this paper. Since the initial operation years of the URT system in different cities are not consistent, multi-phase DID [38] is adopted in this paper, that is, the time of policy implementation is not consistent, and the implementation year of policy in different cities will be determined according to the year when the URT system was opened. Because of the availability of data, we selected samples from 2009 to 2018 for our research.
In this paper, Chinese A-share listed enterprises from 2009 to 2018 are selected as the research samples. Since the explanatory variable of this paper is corporate financing constraint, the research objects of this paper do not include the sample enterprises in the financial industry. To improve the validity of the sample and the accuracy of the empirical data, this article deals with the full sample data as follows: remove samples with incomplete data, and remove companies with abnormal data, such as the debt-to-asset ratio exceeding 100%. Corporate financial data and financial development level-related data come from the CSMAR database, and urban rail transit-related data come from the China Association of Metros. The empirical tests are conducted mainly by STATA.

3.2. Variable Definition

3.2.1. The Explained Variable

The explained variable in this paper is the financing constraint of the enterprise. When the capital market is not perfect, external investors have little understanding of the real information of the enterprise; that is, the problem of information asymmetry exists, which leads the enterprise to having to bear more expenses when financing from the external than the internal capital cost. The degree of financing constraints faced by an enterprise refers to the difference between the internal financing cost of the enterprise and the external financing cost, and can also be understood as the restriction the enterprise faces when financing externally. Some early studies began to explore the financing constraints of enterprises. Scholars constantly tried to use appropriate proxy variables to measure the level of financing constraints of enterprises and obtained some rich research results. Including the sensitivity model of investment to cash flow first proposed by Fazzari et al. [39], and the KZ index constructed by Lamont et al. based on the conclusions of Kaplan and Zingales [40,41]; Almeida et al. proposed a cash-cash flow sensitivity model [42] based on the perspective of corporate cash holdings, Whited and Wu constructed the WW index [43] based on Euler’s investment equation; Hadlock and Pierce constructed the Size Age Index Model (SA Index) based on the two indexes of company Size (SIZE) and time of company listing (AGE) [44]. According to previous studies, although there are differences in the measurement principles of these methods, they can all be used to measure the level of financing constraints.
Regarding the investment-cash flow sensitivity model, Fazzari et al. believe that, theoretically speaking, when a company faces more investment opportunities, the company’s investment expenditure will increase. The sources of funds required for investment expenditures include internal disposable cash flow and external financing. For companies that have difficulty in external financing, it is difficult or impossible to obtain sufficient funds from outside, so their investment expenditures will be restricted by the company’s disposable cash flow. The more difficult an enterprise’s external financing, the more its investment expenditure depends on its internal cash flow. When a company’s investment has a greater sensitivity coefficient to cash flow, it proves that the financing constraint problem faced by the company is more serious, that is, the sensitivity of investment to cash flow can indirectly reflect the financing constraints. Therefore, this paper uses the sensitivity of investment to cash flow to measure the degree of financial constraints of a company, uses Tobin Q to control the impact of growth opportunities, and constructs Equation (1) to reflect the level of financing constraints of company:
INVEST i , t / ASSET i , t 1 = α 0 + α 1 CF i , t / ASSET i , t 1 + α 2 TOBINQ i , t 1 + ε i , t
INVEST i , t represents the investment of the company, ASSET i , t 1 means the assets of the company, and CF i , t represents the cash flow, TOBINQ i , t 1 means the company’s investment opportunity. We mainly analyze the situation of the coefficient α 1 reflects. If α 1 > 0 , it means that the company’s investment expenditure and the company’s internal cash flow are positively correlated, that is, the investment of the company depends on the internal cash flow, indicating that the company is in the dilemma of financing constraints.

3.2.2. The Explanatory Variable

In this article, the major explanatory variable is urban rail transit. Based on the difference-in-differences model, the dummy variable DID (a zero/one variable) is used to represent the urban rail transit variable. The DID interaction term is a comprehensive dummy variable of two dummy variables: TREAT (whether the policy was implemented by the end of 2018); for example, Wuhan had already operated urban rail transit before the end of 2018: then, the value of treat is 1. However, Jinan had not yet operated urban rail transit at the end of 2018: then, the value of treat is 0; AFTER (Before or after the implementation of the policy); for example, Changsha started operating urban rail transit in 2014: then, the value of AFTER is 1 for the time after 2014 (Including 2014), but AFTER is 0 for the time before 2014. Because DID is obtained by multiplying TREAT and AFTER, when both TREAT and AFTER are 1, DID takes the value 1. As of the end of 2018, when urban rail transit has been opened in the city where the company is located and the sample time is after the opening year, DID will be 1, otherwise, it will be 0. In addition, in the robustness test, the DID variable DID is replaced by the urban rail transit operating mileage (MILEAGE) as a proxy variable for the development of urban rail transit for empirical analysis.

3.2.3. The Moderating Variable

This paper selects the level of financial development as the moderating variable of the basic relationship mentioned in Hypothesis 1. The process of increasing financial efficiency brought about by the advancement of the financial industry and the expansion of the scale of financial transactions is financial development. The reduction in the degree of financial repression and the optimization of the financial structure both indicate the improvement of the level of financial development. It also shows that the financial products on the market are constantly innovating, and the investment institutions are constantly improving following the diversification of the economy. To gain potential benefits, economic entities began to seek financial innovations in institutions and technologies, thus promoting financial development. In general, financial development is represented by an increase in financial relative ratios. At present, there are two main methods for measuring the level of financial development: the first is based on the perspective of the scale of credit in the market, and the position of the scale of credit in the capital market is used to reflect the degree of financial development; the second is to use the relevant Chinese marketization index, analyzed by Wang Xiaolu and Fan Gang based on the actual situation in China, so as to directly indicate the level of development of the financial market, but its statistical time is relatively early, which is not suitable for the research of this article. Therefore, this paper intends to use the relative financial indicator. With reference to previous studies [37,45,46], we use the proportion of the year-end loan balance of financial institutions at the city level in each city’s GDP to measure the level of financial development ( F D i , t ).

3.2.4. Control Variables

This paper mainly wants to explore the influence of the explanatory variable (urban rail transit) on the explained variable (financing constraints). In this relationship, in addition to urban rail transit, there are many other factors that will also affect the financing constraints of the company, which are not the objects of this paper. In order to alleviate the interference of these confounding variables on the estimation of causal effects, we need to control them during regression analysis, so they are called control variables. The control variables in this paper are mainly composed of enterprise characteristic variables. This mainly includes working capital fluctuation ( Δ N W C i , t ), the difference between the end of the year and the beginning of the enterprise’s working capital; company Scale ( S I Z E i , t 1 ), measured by taking the logarithm of assets; corporate debt ( L E V i , t 1 ), measured by the ratio of the total liabilities of the enterprise to the total assets. In addition, the development level, policy, and other characteristics of different cities are quite different, which will also affect the financing constraints of enterprises. Therefore, it is necessary to control the individual effects of cities, city fixed effects ( C I T Y ); and the financing constraints of companies will change over time, so we should also control the time effect, year fixed effects ( Y E A R ). The specific meaning of each variable is shown in Table 1.

3.3. Model Design

3.3.1. Test of the Level of Financing Constraints

We use the sensitivity coefficient of investment to cash flow to represent the level of financing constraints. After adding control variables to Equation (1), Equation (2) is obtained as follows:
INVEST i , t / ASSET i , t 1 = α 0 + α 1 CF i , t / ASSET i , t 1 + α 2 TOBINQ i , t 1 + α 3 Δ NWC i , t / ASSET i , t 1 + α 4 SIZE i , t 1 + α 5 LEV i , t 1 + CIYT + YEAR + ε i , t
If α 1 is greater than 0 and statistically significant, it indicates that the investment of sample enterprises is sensitive to cash flow and the enterprises are subject to financing constraints.

3.3.2. Test of Hypothesis 1

In order to test Hypothesis 1, this paper adds a variable urban rail transit DID i , t and the transit terms CF i , t / ASSET i , t 1 × DID i , t on the basis of Equation (2); subsequently, the Equation (3) is as follows:
INVEST i , t / ASSET i , t 1 = α 0 + α 1 CF i , t / ASSET i , t 1 + α 2 CF i , t / ASSET i , t 1 × D I D i , t + α 3 D I D i , t + α 4 TOBINQ i , t 1 + α 5 Δ NWC i , t / ASSET i , t 1 + α 6 SIZE i , t 1 + α 7 LEV i , t 1 + CITY + YEAR + ε i , t
If α 2 is less than 0 and statistically significant, it means that urban rail transit is alleviating the level of financing constraints of sample companies.

3.3.3. Test of Hypothesis 2

To examine the impact of the financial development level on corporate financing constraints, this paper adds the financial development variable FD i , t and the transit term CF i , t / ASSET i , t - 1 × FD i , t on the basis of Equation (2), then the Equation (4) is as follows:
INVEST i , t / ASSET i , t 1 = α 0 + α 1 CF i , t / ASSET i , t 1 + α 2 CF i , t / ASSET i , t 1 × FD i , t + α 3 FD i , t + α 4 TOBINQ i , t 1 + α 5 Δ NWC i , t / ASSET i , t - 1 + α 6 SIZE i , t - 1 + α 7 LEV i , t - 1 + CITY + YEAR + ε i , t
If the coefficient α 2 is less than 0 and statistically significant, it means that the higher the level of financial development, the lower the degree of corporate financing constraints.

3.3.4. Test of Hypothesis 3

To verify the effect of financial development level on the relationship between urban rail transit and corporate financing constraints, this paper adds CF i , t / ASSET i , t 1 × DID i , t × FD i , t , the multiplicative interaction term of financial development variables FD it and CF i , t / ASSET i , t 1 × DID i , t , on the Equation (3), then the construction Equation (5) is as follows:
INVEST i , t / ASSET i , t 1 = α 0 + α 1 CF i , t / ASSET i , t 1 + α 2 CF i , t / ASSET i , t 1 × DID i , t × FD i , t + α 3 CF i , t / ASSET i , t 1 × DID i , t + α 4 DID i , t + α 5 FD i , t + α 6 TOBINQ i , t 1 + α 7 Δ NWC i , t / ASSET i , t 1 + α 8 SIZE i , t 1 + α 9 LEV i , t 1 + CITY + YEAR + ε i , t
If α 2 is greater than 0 and statistically significant, it means that the high level of urban financial development inhibits the effect for urban rail transit to mitigate the constraints imposed by corporate financing.

4. Empirical Results and Discussions

4.1. Descriptive Statistics Analysis

As showed in Table 2, this paper described the statistical characteristics of each variable. It can be seen that the maximum value of the investment expenditure of the sample companies is 5.490, the minimum value is 0, and the mean value is 0.07, which indicates that there are certain differences in the investment expenditure of different companies, and the investment expenditure of most companies is small. The maximum value of CF i , t / ASSET i , t 1 is 8.860, and the average value is 0.060, indicating that the cash flow of the selected sample enterprise is not particularly high. The average value of the variable TREAT i , t is 0.630, indicating that. as of the end of 2018, 63% of the sample companies have opened urban rail transit in their cities; “ AFTER i , t   =1” means that the sample year is after the opening year of URT system in the city where the enterprise is located, the mean value of the variable AFTER i , t is 0.490, means that the sample enterprises meeting the condition “ AFTER i , t =1”account for 49% of the total sample. The maximum value of FD i , t is 2.290, and the minimum value is 0.130, indicating that the financial development level of the sample enterprises is quite different in the regions. TOBINQ i , t 1 has a maximum value of 31.40 and a minimum value of 0.150, indicating that the investment opportunities faced by the sample companies are quite different. The maximum value of SIZE i , t 1 is 27.78, the minimum value is 17.66, and the average value is 22.02, which means the size difference of the sample enterprises is relatively small. The lowest asset–liability ratio is only 1%, the average is 46%, and the highest is 98%, that is, there are large differences in the capital structure of the sample companies.

4.2. Analysis of Empirical Results

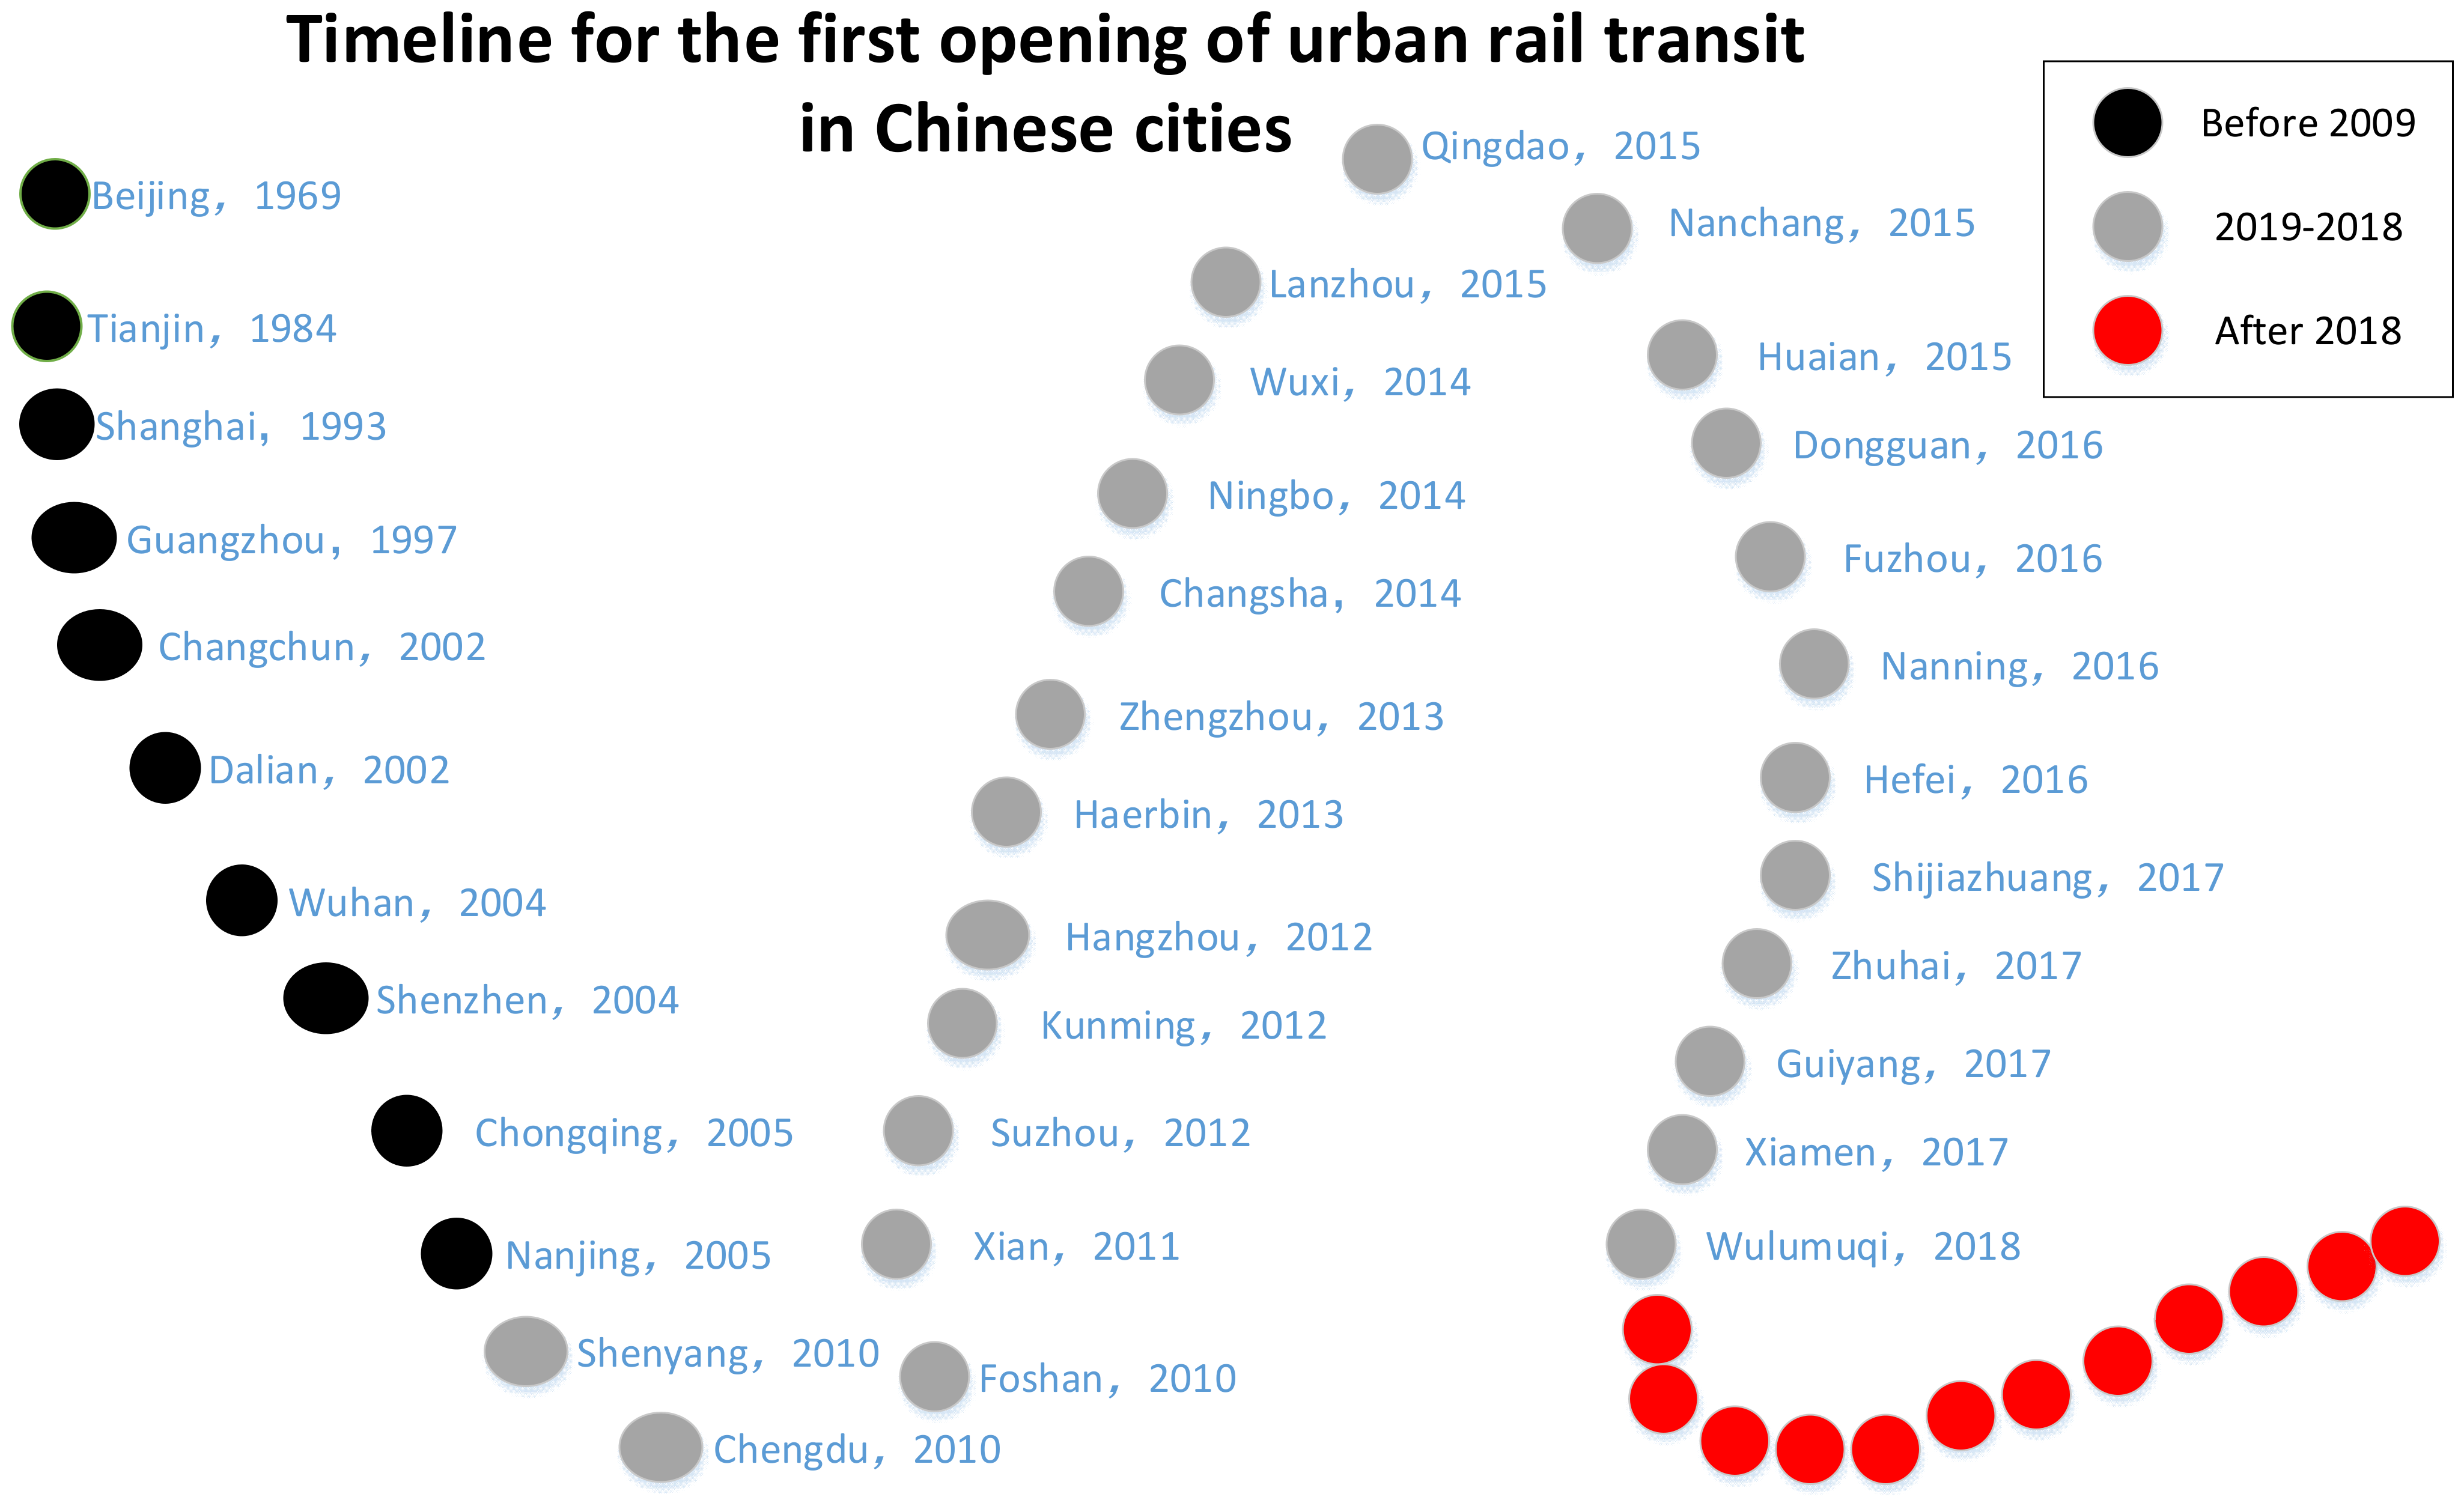
According to the statistics, there are ten cities that have operated urban rail transit before 2009; during 2009–2018, 25 cities have gradually started to operate urban rail transit, as shown in Figure 2. We divided the sample companies into three groups according to the year in which the urban rail transit started operations: starting operations before 2009, starting operations between 2009 and 2018, and starting operations after 2018.
We perform regression analysis on Equation (2) for full sample enterprises and grouped sample enterprises respectively, shown in Table 3. R-squared in the fourth column is the largest, indicating that the fitting effect of this group of samples is the best, that is, in the sample of urban rail transit opened after 2018, the degree of interpretation of the dependent variable by the regression equation is 68.8%. Column (1) in Table 3 displays the regression result of the Equation (2) of the full sample of companies. The coefficient of investment-cash flow sensitivity is 0.237 and significant at the statistical level of 1%, meaning that companies have financing constraints on the whole. In the grouped sample, the coefficient α 1 of column (2) is not significant, the coefficient α 1 of columns (3) and (4) are both significantly positive at the 1% level, and the coefficient value of column (4) is the largest. It can be considered that among the cities where urban rail transit was opened earlier, the scale of the city is larger, the level of economic development is higher, the external economic and policy environment of the company is better, and the investment of the company is not sensitive to cash flow, that is, the financing constraints faced by the enterprise are relatively small. However, the later the year of URT system is opened, the more sensitive the company’s investment to cash flow, indicating that when the local economic development level is more backward, the degree of financing constraints faced by the company is relatively greater.
To verify the influence of the URT system on the financing constraints, first, a regression analysis of Equation (3) was performed on a full sample of enterprises, and the regression results are shown in column (1) of Table 4. R-squared is 0.226, compared with column 1 in Table 3, the value of R2 becomes larger, indicating that the model fits better after adding variable CF i , t / ASSET i , t 1 × DID i , t . The coefficient of the variable CF i , t / ASSET i , t 1 × DID i , t is significantly negative (−0.286) at the 1% level, that is, under the influence of URT system, the sensitivity of corporate investment to cash flow has weakened, indicating that the operation of URT system is beneficial to alleviate the financing constraints of enterprises, confirming Hypothesis 1.
To verify the influence of financial development level on corporate financing constraints, a regression analysis of Equation (4) was performed on a full sample of enterprises, and the regression results are shown in column (2) of Table 4. R-squared is 0.195, compared with column 1 in Table 3, the value of R2 becomes larger, indicating that the model fits better after adding variable CF i , t / ASSET i , t 1 × FD i , t . The coefficient of the variable CF i , t / ASSET i , t 1 × FD i , t is significantly negative (−0.0975) at the 1% level. That is, the sensitivity of investment cash flow of enterprises is weakened in view of the influence of financial development, indicating that the higher the level of urban financial development, the lower the degree of financing constraints of enterprises, which confirms Hypothesis 2.
To test the moderating effect of the financial development level on the relationship between urban rail transit and corporate financing constraints, a regression analysis of Equation (5) was performed on a full sample of companies. The results are shown in column (3) of Table 4. R-squared is 0.227, compared with column 1 in Table 3, the value of R2 becomes larger, indicating that the model fits better after adding CF i , t / ASSET i , t 1 × DID i , t × FD i , t . The coefficient α 2 of CF i , t / ASSET i , t 1 × DID i , t × FD i , t is significantly positive at the level of 5% (0.0985), which indicates that under the effect of financial development level, urban rail transit does not play a role in reducing the sensitivity of enterprises to the cash flow of investment. In other words, a higher level of financial development inhibits the alleviating effect of URT system on the financing constraints of enterprises. This result proves Hypothesis 3.
Regarding Hypothesis 1, few documents directly study the relationship between URT system and financing constraints. However, studies have shown that URT will promote the occurrence of industrial agglomeration, and some scholars have proved that industrial agglomeration is beneficial to alleviating the financing difficulties. The conclusion of this article directly verifies the influence of URT on corporate financing. For Hypothesis 2, the research results of this paper are consistent with existing research conclusions, that is, the higher the level of financial development, the lower the degree of financing constraints of enterprises. Regarding Hypothesis 3, few studies have put together urban rail transit, financial development level, and corporate financing constraints for discussion. Some scholars believe that the benefits of industrial agglomeration are not monotonically increasing, but excessive agglomeration will occur. By analogy with the URT system, we conducted the test of Hypothesis 3, and the conclusion is also in line with expectations, that is, the influence of URT system on corporate financing constraints will vary depending on the level of financial development. The conclusion of this paper enriches the theoretical research of urban rail transit.

4.3. Robustness Tests

4.3.1. Test Based on Revenue Growth Rate

As introduced earlier, we choose the investment-cash flow sensitivity model chosen to express the financing constraints of enterprises, in which the TobinQ value is used to represent the investment opportunities of enterprises. However, China’s capital market is a new primary market with various institutional problems, it will take some time for the formulation of the law and the improvement of the capital market. Therefore, it may not be accurate to use TobinQ to measure t the investment opportunities of enterprises. Referencing existing research [47], in this paper, the growth rate of operating income is used to replace TobinQ in each Equation to control the influence of growth opportunities, then the Equations are tested again. The regression results are shown in Table 5. We can see that the R-squared values of the four columns have relatively small differences, and the fourth column has the largest value, which is 0.227, indicating that the degree of interpretation of the dependent variable by Equation (5) is 22.7%.
Column (1) is a test of Equation (2). The coefficient of CF i , t / ASSET i , t 1 is 0.238 and significant at the statistical level of 1%, indicating that the sample enterprises have received financing constraints; column (2) is a test of Equation (3). The coefficient of CF i , t / ASSET i , t 1 × DID i , t is significantly negative (−0.286) at the statistical level of 1%, which indicates that URT system is beneficial to alleviate the financing constraints. Column (3) is the test of Equation (4). The coefficient of CF i , t / ASSET i , t 1 × FD i , t is significantly negative (−0.0974) at the statistical level of 1%, indicating that the higher the level of financial development of city, the lower the sensitivity of enterprise investment to cash flow. In other words, the level of financial development is conducive to easing the financing constraints of enterprises; column (4) is the test of Equation (5). The coefficient of CF i , t / ASSET i , t 1 × DID i , t × FD i , t is 0.0975 and significant at the statistical level of 1%, indicating that with the improvement of financial development level, the effect of the operation of the URT system on the financing constraint of enterprises is weakened. The results in Table 5 show that, when the TobinQ value in each Equation is replaced by the operating revenue, the research conclusions remain unchanged and are robust.

4.3.2. Test Based on the Mileage of URT System

To further verify Hypothesis 1, this paper uses the operating mileage of URT system ( MILEAGE i , t ) as the core explanatory variable, then conduct empirical analysis. The Empirical analysis results are displayed in Table 6. R-squared of column (2) is larger than column (1), means that the model fits better after adding CF i , t / ASSET i , t 1 × MILEAGE i , t × FD i , t . column (1) expresses the relationship between operating mileage of URT system and the sensitivity of the company’s investment to cash flow, the coefficient of CF i , t / ASSET i , t 1 × MILEAGE i , t is significantly negative at the 1% level, indicating that as the operating mileage of URT system increases, the financing constraints faced by enterprises are alleviated. After adding the adjustment variable of the financial development level, the coefficient of CF i , t / ASSET i , t 1 × MILEAGE i , t × FD i , t in column (2) is significantly positive at the level of 1%, indicating that the mitigation effect of urban rail transit on corporate financing constraints has a diminishing effect. With the improvement of the level of financial development, the increase in urban rail transit operating mileage will no longer have an obvious effect on alleviating corporate financing constraints. This conclusion is consistent with the hypothesis proposed in this article.

4.4. Further Test

As an economic unit, a kind of industry is not only an integral part of the national economy but also a collection of similar enterprises. Scholars often use industry association theory to study the connections between industries. Hirschman pointed out that forward correlation and backward correlation are the most basic movement mode of correlation, and the correlation in the economic development of the whole industry can be measured by the correlation degree between local industries. The operation of the URT system will promote the development of some related up and downstream industries [16]. There will be complex and varied technical and economic connections among these related industries, and these connections will also be strong and weak due to different ways of the division of labor and cooperation. The correlation intensity between the URT system and different categories of industries is also different. On the base of industrial association theory, some scholars have calculated the correlation measure coefficient between the URT system and upstream and downstream industries by using the input-output method. The greater the value of this coefficient, the stronger the correlation between industry and urban rail transit is [48]. For the enterprises with a strong correlation with the urban rail transit industry, the convenient conditions and positive influence created by urban rail transit should be greater, the industrial aggregation effect should be more obvious, and the alleviating effect of the URT system on the financing constraint of enterprises should be more significant.
To figure out if the alleviating effect of the URT system on the financing constraint of enterprises differs among different industries, this paper, referring to existing studies, divided the entire sample of enterprises into strong industry correlation and weak industry correlation, according to the correlation between the industry types and the URT industry.
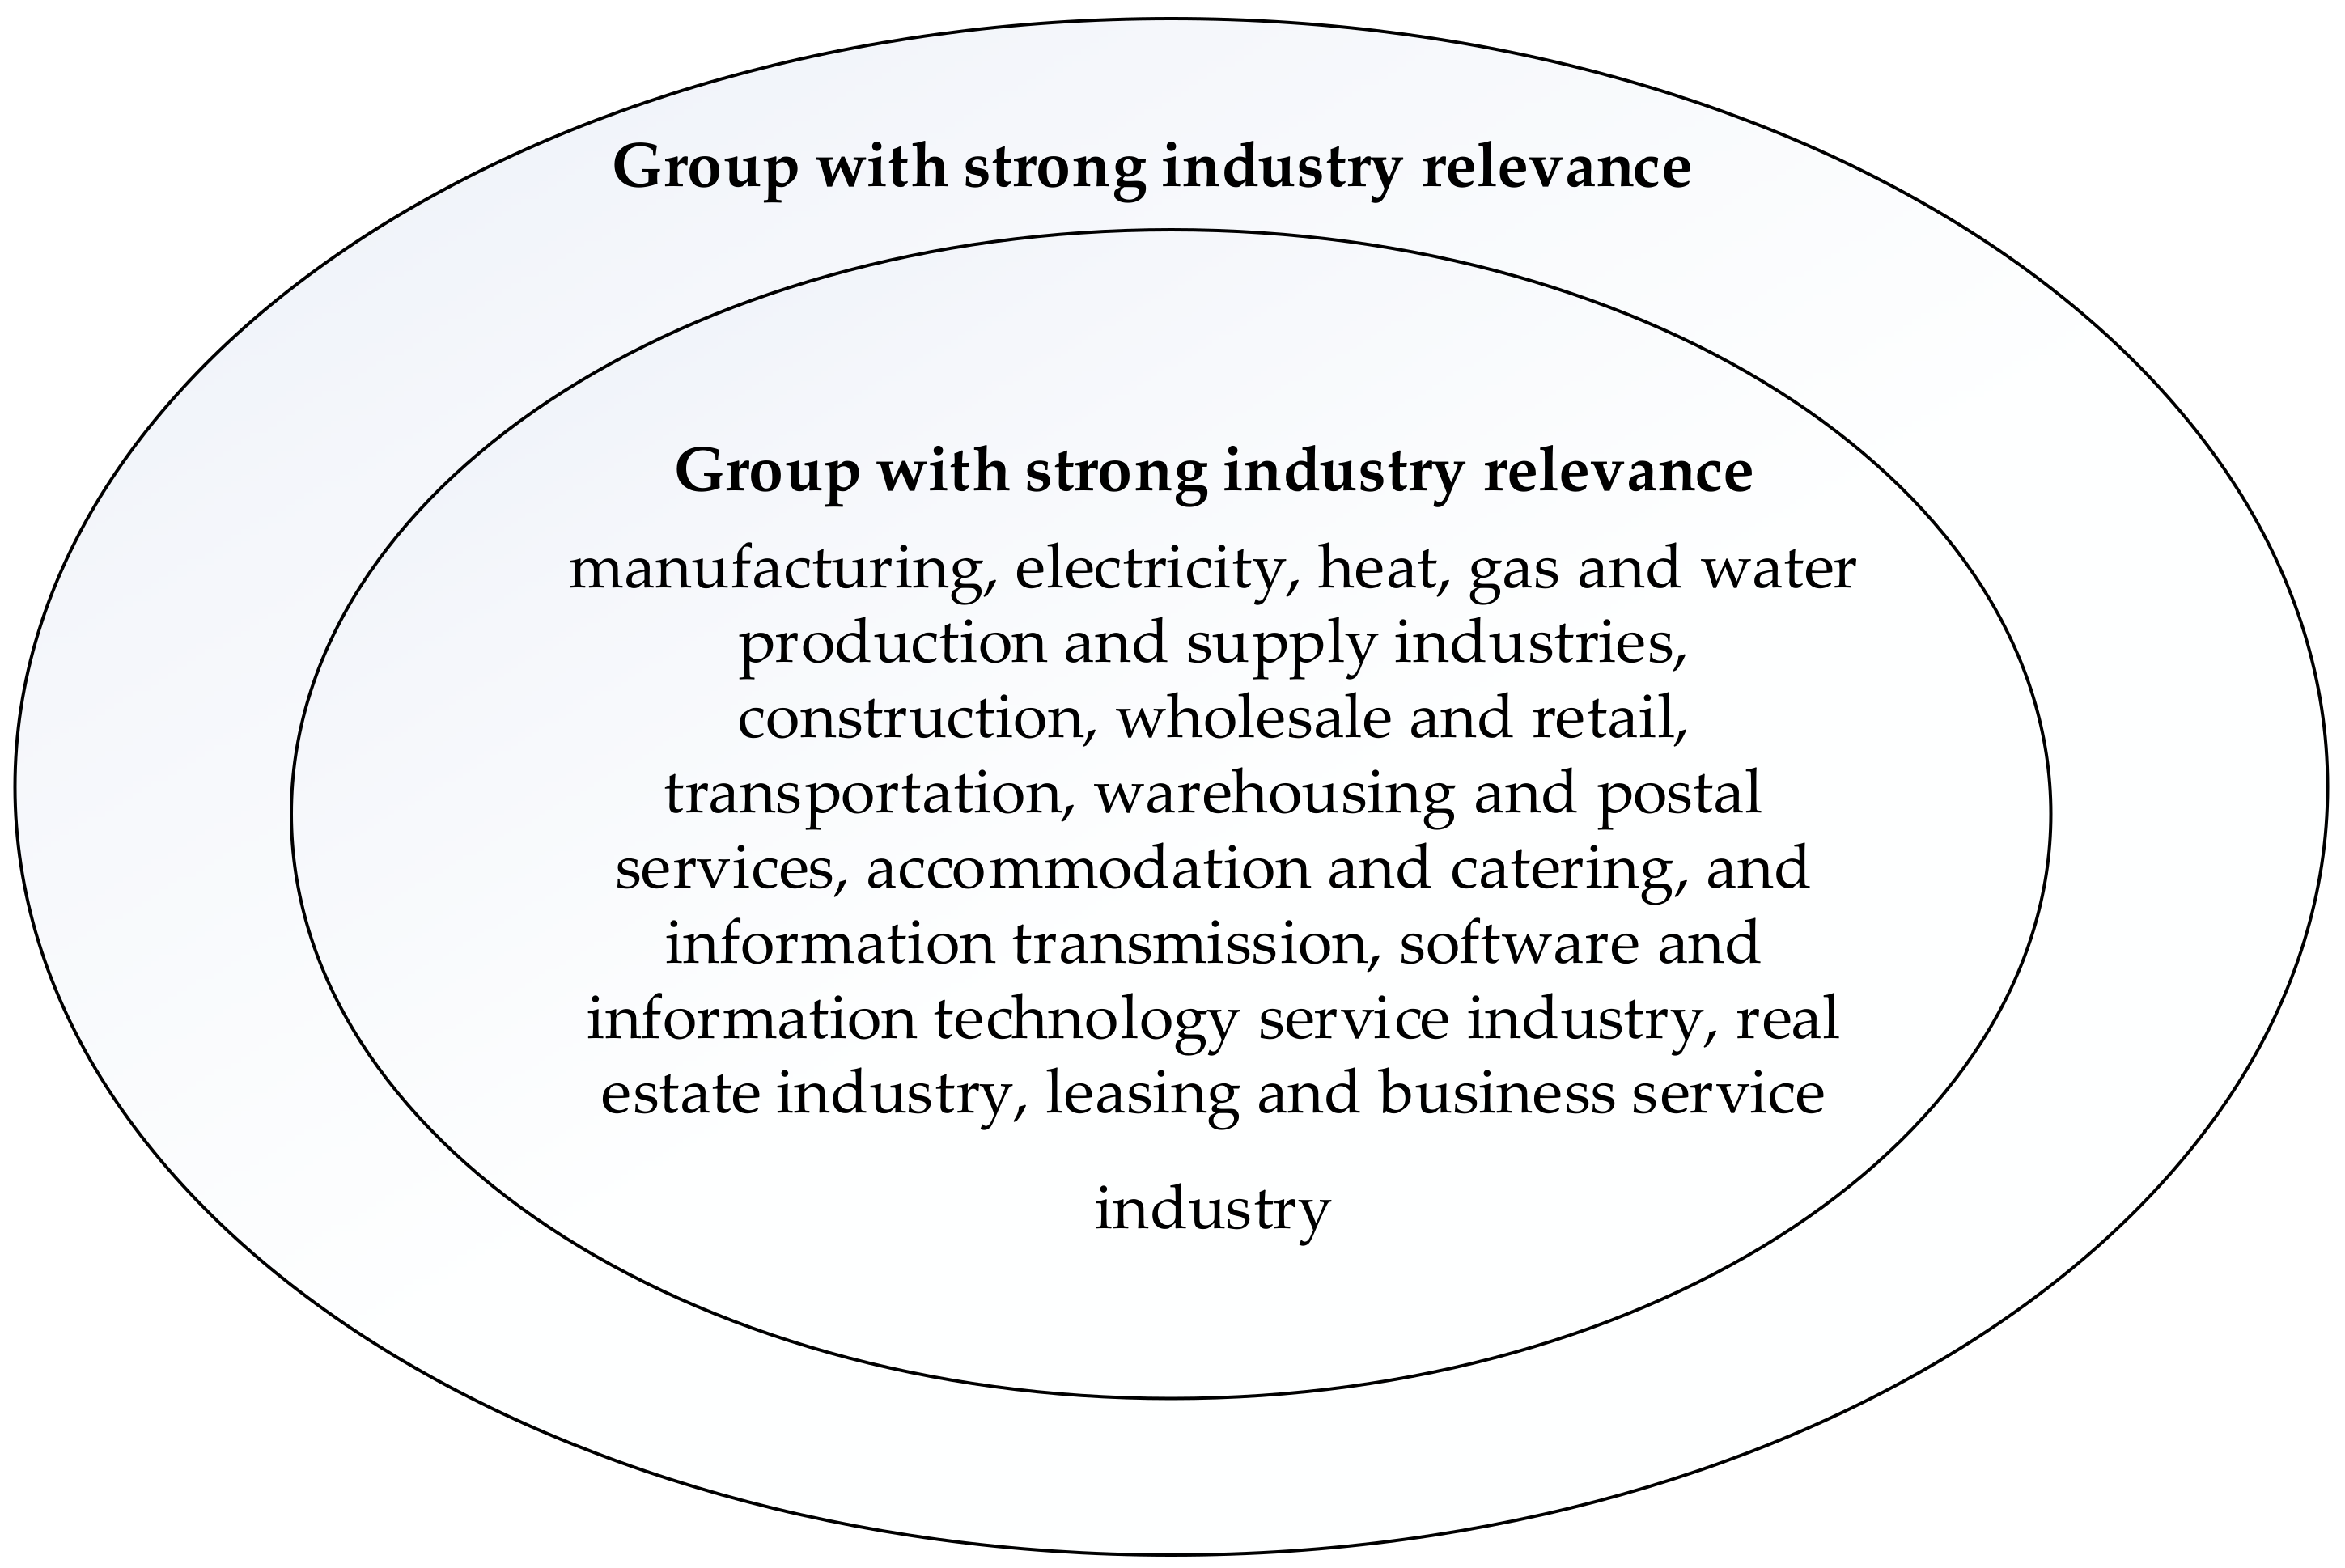
Specifically, according to the “Classification of National Economic Industries” (GB/T 4754—2017), the manufacturing, electricity, heat sectors, etc., are regarded as the groups with strong industry relevance (As shown in Figure 3), and other industries are regarded as the groups with weaker industry relevance. After grouping, regression analysis was conducted on Equation (3) respectively, and TobinQ value and operating income growth rate were successively used to replace enterprise investment opportunities for testing. The regression results are shown in Table 7. Compared with the strong industry correlation sample group, the value of R-squared are larger in the weak industry correlation sample group, indicating that the Weak industry correlation sample group has a better fit.
The results show that the coefficients of CF i , t / ASSET i , t 1 × DID i , t are significantly negative (−0.271, −0.305) at the 1% level in the samples with strong industry correlation, whether the TobinQ value or the growth rate of operating income is used to measure the investment opportunity. However, in the sample with weak industry correlation, the coefficient of the cross term is not significant. It shows that the urban rail transit has a certain alleviating effect on the financing constraint of the sample enterprises with strong industry correlation, but the influence on the sample enterprises with weak industry correlation is not obvious.

5. Conclusions

From the perspective of sustainability, this paper adopts a multi-phase differential method and takes Chinese A-share listed companies from 2009 to 2018 as research samples to conduct an empirical investigation on the relationship between URT and financing constraints of listed companies; it further explores the regulating effect of financial development on the above relationship. The conclusions of this paper are as follows:
  • A later opening year of the urban rail transit system means that the development level of the city is relatively poorer, and that the external financing environment for enterprises is also relatively poor. Compared with enterprises in regions with earlier urban rail transit opening years, enterprises in regions with late urban rail transit opening years face more serious financing constraints.
  • The development of urban rail transit system is conducive to alleviating the financing constraints faced by enterprises; further considering industry relevance, it is found that the mitigation effect is more obvious for enterprises with strong relevance to the urban rail transit industry. That is, after the opening of urban rail transit, this will promote the agglomeration and development of a series of industries that are closely related to it, and industry gatherings will bring positive external effects, which can create a good financing environment for enterprises and ultimately help alleviate corporate financing constraints.
  • The higher the level of financial development, the lower the level of financing constraints faced by enterprises. Compared with enterprises in regions with higher financial development levels, the alleviating effect of URT system on the financing constraint of enterprises in regions with relatively backward financial development is more obvious. When the financial development level is high, the market system and regulations are more developed, the financing environment of enterprises is better, and the financing constraints encountered by enterprises are alleviated. In this case, while the improvement effect of the URT system on the financing constraints of enterprises is no longer obvious it can still alleviate the financing constraints of enterprises in areas with backward financial development.
The URT development provides new solutions to the financing dilemma of micro-enterprises. Therefore, government departments should pay attention to the important role of the development of the URT system in alleviating the financing constraints of enterprises, actively guide the development of urban rail transit, formulate appropriate industrial policies, and effectively play a positive role of the URT system in easing the financing constraints of enterprises and driving the sustainable development of related industries.
In addition, urban rail transit should consider the general ecological concerns of the city at the early stage of construction, integrating urban rail transit construction and sustainable development of urban, and practicing the concepts of “building rail is building a city” and “operating rail is operating a city”. In the urban space and land use planning, the facilities layout around the site, and the exploration of TOD development models, the differential URT impact on various industries should be fully considered, and the prevailing effect of urban rail transit in sustainable urban development should be better brought into play.
Given that the mitigation effect of urban rail transit on corporate financing constraints will be affected by the level of financial development, it is also necessary to pay attention to the law of diminishing returns to scale of the external benefits of urban rail transit; we should therefore not blindly expand the scale of urban rail transit operations, but strive to improve service quality and passenger satisfaction based on actual conditions, make better use of the transportation, economic and social benefits of urban rail transit, and commit to high-quality and sustainable development. of urban rail transit.
There are some limitations in this paper: First of all, in the selection of variables, this paper only uses the sensitivity of investment to cash flow to measure the financing constraints of the explanatory variables, and there are many ways to measure financing constraints, and the result of using only one measurement may not be accurate. Similarly, only one method is used to calculate the financial development. In subsequent research, different proxy variables can be selected for research to make the conclusion more convincing; Secondly, from the perspective of sample selection, this paper selects A-share listed companies as the research object. The A-share market includes multiple different trading segments, which are suitable for companies of different sizes and characteristics. The influence of urban rail transit on corporate financing constraints under different trading venues may be different, but this article does not discuss it further. Subsequent research can further distinguish different trading sectors and conduct separate research; finally, this article only proves that urban rail transit is beneficial to alleviating financing constraints, but its mechanism is only based on theoretical analysis, without empirical analysis. The following research can further explore the mechanism of urban rail transit by promoting industrial agglomeration to alleviate corporate financing constraints.

Author Contributions

Conceptualization, R.Y., L.Y.-n.T. and M.F.; methodology, R.Y.; validation, R.Y., L.Y.-n.T. and M.F.; formal analysis, R.Y.; data curation, R.Y.; writing—original draft preparation, R.Y.; writing—review and editing, R.Y., L.Y.-n.T. and M.F.; supervision, L.Y.-n.T. and M.F. All authors have read and agreed to the published version of the manuscript.

Funding

The support by the National Social Science Foundation research project “the Realization Path of Supporting the Comprehensive Construction of a Modern Country with Strong Transportation Network” (21AZD019) is gratefully acknowledged.

Institutional Review Board Statement

Not applicable.

Informed Consent Statement

Not applicable.

Data Availability Statement

The data that supporting the findings of this study are available in the CSMAR database, statistical data of China Association of Metros. These data were derived from the following resources available in the public domain: https://cn.gtadata.com/ (accessed on 20 September 2021); https://www.camet.org.cn/tjxx (accessed on 20 September 2021).

Conflicts of Interest

The author declares no conflict of interest.

References

  1. Bhattacharjee, S.; Goetz, A.R. Impact of light rail on traffic congestion in Denver. J. Transp. Geogr. 2012, 22, 262–270. [Google Scholar] [CrossRef]
  2. Yu, L.; Zhang, J. The role of rail transit in the construction of low-carbon cities. China Open. Her. 2009, 5, 26–30. [Google Scholar]
  3. Chatman, D.G.; Noland, R.B. Do Public Transport Improvements Increase Agglomeration Economies? A Review of Litera-ture and an Agenda for Research. Transp. Rev. 2011, 31, 725–742. [Google Scholar] [CrossRef]
  4. Rohit, S.; Peter, N. Does urban rail increase land value in emerging cities? Value uplift from Bangalore Metro. Transp. Res. Part A Policy Pract. 2018, 117, 70–86. [Google Scholar]
  5. Choi, K.; Han, J.P.; Dewald, J. The impact of mixes of transportation options on residential property values: Synergistic effects of walkability. Cities 2021, 111, 103080. [Google Scholar] [CrossRef]
  6. Bao, H.X.; Larsson, J.P.; Wong, V. Light at the end of the tunnel:The impacts of expected major transport improvements on residential property prices. Urban Stud. 2020. [Google Scholar] [CrossRef]
  7. Zhang, D.; Jiao, J. How Does Urban Rail Transit Influence Residential Property Values? Evidence from An Emerging Chinese Megacity. Sustainability 2019, 11, 534. [Google Scholar] [CrossRef] [Green Version]
  8. Shen, Q.; Chen, P.; Pan, H. Factors affecting car ownership and mode choice in rail transit-supported suburbs of a large Chinese city. Transp. Res. Part A Policy Pract. 2016, 94, 31–44. [Google Scholar] [CrossRef]
  9. Deyas, G.T.; Woldeamanuel, M.G. Social and economic impacts of public transportation on adjacent communities: The case of the Addis Ababa light rail transit. Res. Transp. Econ. 2020, 84, 100970. [Google Scholar] [CrossRef]
  10. Knowles, R.D.; Ferbrache, F. Evaluation of wider economic impacts of light rail investment on cities. J. Transp. Geogr. 2016, 54, 430–439. [Google Scholar] [CrossRef]
  11. Li, Z.; Xia, T.; Xia, Z.; Wang, X. The Impact of Urban Rail Transit on Industrial Agglomeration Based on the Intermediary Effects of Factor Agglomeration. Math. Probl. Eng. 2021, 2021, 6664215. [Google Scholar] [CrossRef]
  12. Mao, R. Industrial agglomeration and corporate financing constraints. Manag. World 2015, 2, 58–71. [Google Scholar]
  13. Liu, R.; Zhao, R. Does the national high-tech zone promote regional economic development?—Based on the verification of the double difference method. Manag. World 2015, 8, 30–38. [Google Scholar]
  14. Khurana, I.K.; Martin, X.; Pereira, R. Financial Development and the Cash Flow Sensitivity of Cash. J. Financ. Quant. Anal. 2006, 41, 787–808. [Google Scholar] [CrossRef]
  15. Islam, S.S.; Mozumdar, A. Financial market development and the importance of internal cash: Evidence from international data. J. Bank. Financ. 2007, 31, 641–658. [Google Scholar] [CrossRef]
  16. Credit, K. Accessibility and agglomeration: A theoretical framework for understanding the connection between transportation modes, agglomeration benefits, and types of businesses. Geogr. Compass 2019, 13, e12425. [Google Scholar] [CrossRef]
  17. Yu, H.; Jiao, J.; Houston, E.; Peng, Z.R. Evaluating the relationship between rail transit and industrial agglomeration: An observa-tion from the Dallasfort worth region, TX. J. Transp. Geogr. 2018, 67, 33–52. [Google Scholar] [CrossRef]
  18. Lyu, G.; Bertolini, L.; Pfeffer, K. Is Labour Productivity Higher in Transit Oriented Development Areas? A Study of Beijing. Tijdschr. Econ. Soc. Geogr. 2020, 111, 652–670. [Google Scholar] [CrossRef]
  19. Zheng, S.; Hu, X.; Wang, J.; Wang, R. Subways near the subway: Rail transit and neighborhood catering businesses in Beijing. Transp. Policy 2016, 51, 81–92. [Google Scholar] [CrossRef]
  20. Ciccone, A. Agglomeration effects in Europe. Eur. Econ. Rev. 2001, 46, 213–227. [Google Scholar] [CrossRef] [Green Version]
  21. Ottati, G. Trust, interlinking transactions and credit in the industrial district. Camb. J. Econ. 1994, 18, 529–546. [Google Scholar] [CrossRef]
  22. Guiso, L.; Sapienza, P.; Zingales, L. The Role of Social Capital in Financial Development. Am. Econ. Rev. 2004, 94, 526–556. [Google Scholar] [CrossRef] [Green Version]
  23. Seidel, T.; Ehrlich, M. Agglomeration and Credit Constraints. Available online: http://www-sre.wu.ac.at/ersa/ersaconfs/ersa12/e120821aFinal00110.pdf (accessed on 20 September 2021).
  24. Ali, M.; Peerlings, J.; Zhang, X. Clustering as an organizational response to capital market inefficiency: Evidence from micro-enterprises in Ethiopia. Small Bus. Econ. 2014, 43, 697–709. [Google Scholar] [CrossRef]
  25. Stigler, G.J. The Division of Labor is Limited by the Extent of the Market. J. Political Econ. 1951, 59, 185–193. [Google Scholar] [CrossRef]
  26. Schmitz, H.; Nadvi, K. Clustering and Industrialization: Introduction. World Dev. 1999, 27, 1503–1514. [Google Scholar] [CrossRef]
  27. Long, C.; Zhang, X. Cluster-based industrialization in China: Financing and performance. J. Int. Econ. 2011, 84, 112–123. [Google Scholar] [CrossRef] [Green Version]
  28. He, W.; Kyaw, N. Macroeconomic risks and capital structure adjustment speed: The Chinese evidence. Int. J. Financ. Econ. 2021, 5. [Google Scholar] [CrossRef]
  29. Love, I. Financial Development and Financing Constraints: International Evidence from the Structural Investment Model. Rev. Financ. Stud. 2003, 16, 765–791. [Google Scholar] [CrossRef] [Green Version]
  30. Maksimovic, V. Law, finance, and firm growth Asli Demirgü-Kunt. J. Financ. 1998, 53, 2107–2137. [Google Scholar]
  31. Harvey, B. Foreign Speculators and Emerging Equity Markets. J. Financ. 2000, 55, 565–613. [Google Scholar]
  32. Wurgler, J. Financial markets and the allocation of capital. J. Financ. Econ. 2000, 58, 187–214. [Google Scholar] [CrossRef] [Green Version]
  33. Laeven, L. Does Financial Liberalization Reduce Financing Constraints? Financ Manag. 2003, 32, 5–34. [Google Scholar] [CrossRef]
  34. Wang, X.; Fan, G.; Yu, J. China’s Marketization Index Report by Provinces; Social Sciences Literature Publishing House: Beijing, China, 2017. [Google Scholar]
  35. Zhang, W.; Wei, W. The Impact of Manufacturing Agglomeration on Efficiency: Restraining or Promoting? PSTR Analysis Based on the Classification of Region and Factor Concentration. S. Chin. J. Econ. 2018, 4, 95–113. [Google Scholar]
  36. Zhang, Y.; Xie, Q. The Impact of Industrial Agglomeration on Corporate Financing Constraints: Empirical Data from China’s Manufacturing Companies. Enterp. Econ. 2014, 8, 180–184. [Google Scholar]
  37. Sun, Z.; Zhang, W.; Meng, W. Will the construction of high-tech zones help reduce the financing constraints of small and medium-sized enterprises?—Empirical evidence from companies listed on the “New Third Board”. Secur. Mark. Her. 2018, 6, 42–50. [Google Scholar]
  38. Hanck, C.; Joshua, D. Angrist and Jrn-Steffen Pischke (2009): Mostly Harmless Econometrics: An Empiricist’s Companion. Stat Pap. 2011, 52, 503–504. [Google Scholar] [CrossRef] [Green Version]
  39. Fazzari, S.; Hubbard, R.; Petersen, B. Financing Constraints and Corporate Investment. Brook. Pap. Econ. Act. 1988, 1, 141–206. [Google Scholar] [CrossRef] [Green Version]
  40. Kaplan, S.N.; Zingales, L. Do Investment-Cash Flow Sensitivities Provide Useful Measures of Financing Constraints? Q. J. Econ. 1997, 112, 169–215. [Google Scholar] [CrossRef] [Green Version]
  41. Lamont, O.; Polk, C.; Saaá-Requejo, J. Financial Constraints and Stock Returns. Rev. Financ. Stud. 2001, 14, 529–554. [Google Scholar] [CrossRef]
  42. Almeida, H.; Weisbach, M.; Campello, M. The Cash Flow Sensitivity of Cash. J. Financ. 2004, 59, 1777–1804. [Google Scholar] [CrossRef]
  43. Whited, T.M.; Wu, G. Financial Constraints Risk. Rev. Financ. Stud. 2006, 19, 531–559. [Google Scholar] [CrossRef]
  44. Hadlock, C.J.; Pierce, J.R. New Evidence on Measuring Financial Constraints: Moving Beyond the KZ Index. Rev. Financ. Stud. 2010, 23, 1909–1940. [Google Scholar] [CrossRef]
  45. Li, H.; Xie, J. Financial Development, Corporate Financing Constraints and Investment Efficiency: An Empirical Study Based on Panel Data of Listed Companies from 2002 to 2013. Nankai Econ. Res. 2018, 4, 36–52. [Google Scholar]
  46. Zeng, Z.; Wang, C.; Zhang, Q. The Impact of Financial Development on the Financing Constraints of China’s Small and Medium-sized Listed Companies. Theory Pract. Financ. Econ. 2017, 4, 15–20. [Google Scholar]
  47. Wang, W.; Zhang, Z. Financial Development, Government Subsidy and R&D Financing Constraints: Evidence from A-share High-tech Listed Companies. Res. Econ. Manag. 2013, 11, 51–57. [Google Scholar]
  48. Xin, X. Research on the Safety Evaluation System of my country’s Urban Rail Transit Industry. Ph.D. Thesis, Beijing Jiaotong University, Beijing, China, 2017. [Google Scholar]
Figure 1. Research ideas and logical framework.
Sustainability 13 10543 g001
Figure 2. Timeline for the first opening of urban rail transit in Chinese cities.
Sustainability 13 10543 g002
Figure 3. Classification of the correlation between industry and urban rail transit.
Sustainability 13 10543 g003
Table 1. Variable summary.
Variable NameVariable Meaning
Investment (INVEST)“Cash paid for the purchase and construction of fixed assets, intangible assets and other long-term assets” in the cash flow statement
Cash Flow (CF)Net cash flow from operating activities
Total Assets (ASSET)Total assets of the enterprise at the end of the year
Investment Opportunities (TOBINQ)Stock market value/total book assets at the end of the period
Urban Rail Transit (DID)DID = TREAT × AFTER. When the city opened urban rail transit at the end of 2018, and the time is after the opening year, DID takes 1, otherwise, it is 0
Financial Development (FD)The proportion of the year-end loan balance of financial institutions to the GDP of each city
Enterprise Size (SIZE)Take the logarithm of assets
Company Liabilities (LEV)The ratio of the total liabilities to the total assets
Working Capital (NWC)Difference between current assets and current liabilities
Year Fixed effect (YEAR)Control time effect
City Fixed effect (CITY)Control city effect
Table 2. Variable descriptive statistics.
VariablenMeanS.D.Min0.250Mdn0.750Max
INVESTi,t/ASSETi,t−157160.07000.15000.02000.04000.08005.490
CFi,t/ASSETi,t−157160.06000.220−7.1300.01000.05000.1008.860
TREATi,t57160.6300.48000111
AFTERTi,t57160.4900.50000011
FDi,t57161.3000.5400.1300.8001.3401.8002.290
TOBINQi,t−157162.2501.7500.1501.3301.7402.53031.40
∆NWCi,t/ASSETi,t−157160.05000.480−5.840−0.04000.01000.080027.58
SIZEi,t−1571622.021.22017.6621.1921.9022.7027.78
LEVi,t−157160.4600.2000.01000.3000.4600.6200.980
Table 3. Sensitivity of the investment of the sample companies to cash flow.
INVESTi,t/ASSETi,t−1INVESTi,t/ASSETi,t−1INVESTi,t/ASSETi,t−1INVESTi,t/ASSETi,t−1
Full SampleOpened before 2009Opened in 2009–2018Opened after 2018
(1)(2)(3)(4)
CFi,t/ASSETi,t−10.237 ***−0.01450.118 ***0.670 ***
(28.53)(−1.003)(6.978)(57.44)
TOBINQi,t−10.0005610.001090.00408 *−0.00545 ***
(0.441)(0.550)(1.837)(−3.026)
∆NWCi,t/ASSETi,t−10.0422 ***−0.0218 ***0.154 ***−0.0122 *
(11.14)(−4.406)(11.85)(−1.885)
SIZEi,t−1−0.00597 ***−0.00769 **−0.00459−0.00753 ***
(−2.749)(−2.524)(−0.959)(−2.901)
LEVi,t−10.002660.00191−0.009810.0342 ***
(0.249)(0.120)(−0.429)(2.818)
CITY EFFECTSYesYesYesYes
YEAR EFFECTSYesYesYesYes
Constant0.174 ***0.233 ***0.224 **0.203 ***
(3.654)(3.498)(2.101)(3.444)
Observations5716195316652098
R-squared0.1910.0350.2250.688
Adjusted R20.6670.6670.6670.667
F7.793.2012.1133.10
Note: ***, **, * represent the significance level of 1%, 5% and 10% respectively.
Table 4. Urban rail transit, financial development, and enterprise financing constraints.
INVESTi,t/ASSETi,t−1INVESTi,t/ASSETi,t−1INVESTi,t/ASSETi,t−1
Equation (3)Equation (3)Equation (4)
(1)(2)(3)
CFi,t/ASSETi,t−10.358 ***0.348 ***0.361 ***
(32.11)(14.64)(32.14)
CFi,t/ASSETi,t−1 *DIDi,t−0.286 *** −0.444 ***
(−15.82) (−6.029)
CFi,t/ASSETi,t−1 *DIDi,t *FDi,t 0.0985 **
(2.208)
CFi,t/ASSETi,t−1 *FDi,t −0.0975 ***
(−4.951)
DIDi,t0.0230 ** 0.0243 ***
(2.548) (2.634)
FDi,t 0.00360−0.00548
(0.346)(−0.523)
TOBINQi,t−10.0009090.0005970.000994
(0.731)(0.470)(0.798)
∆NWCi,t/ASSETi,t−10.0123 ***0.0387 ***0.00767 *
(2.969)(10.08)(1.647)
SIZEi,t−1−0.00692 ***−0.00612 ***−0.00696 ***
(−3.257)(−2.826)(−3.274)
LEVi,t−10.006780.001880.00781
(0.647)(0.176)(0.744)
CITY EFFECTSYesYesYes
YEAR EFFECTSYesYesYes
Constant0.179 ***0.174 ***0.186 ***
(3.800)(3.493)(3.791)
Observations571657165716
R-squared0.2260.1950.227
Adjusted R20.4520.2030.203
F9.537.889.45
Note: ***, **, * represent the significance level of 1%, 5% and 10% respectively.
Table 5. Robustness test with revenue growth rate as investment opportunities.
INVESTi,t/ASSETi,t−1INVESTi,t/ASSETi,t−1INVESTi,t/ASSETi,t−1INVESTi,t/ASSETi,t−1
Equation (2)Equation (3)Equation (4)Equation (5)
(1)(2)(3)(4)
CFi,t/ASSETi,t−10.238 ***0.359 ***0.348 ***0.362 ***
(28.82)(32.27)(14.67)(32.30)
CFi,t/ASSETi,t−1 *DIDi,t −0.286 *** −0.442 ***
(−15.81) (−6.006)
CFi,t/ASSETi,t−1 *DIDi,t *FDi,t 0.0975 **
(2.187)
CFi,t/ASSETi,t−1 *FDi,t −0.0974 ***
(−4.948)
DIDi,t0.0230 ** 0.0242 ***0.0230 **
(2.544) (2.625)(2.544)
FDi,t 0.00371−0.00526
(0.356)(−0.503)
GROETHi,t−1−3.60e−06−3.41e−06−3.51e−06−3.41e−06
(−0.399)(−0.386)(−0.390)(−0.386)
∆NWCi,t/ASSETi,t−10.0424 ***0.0127 ***0.0390 ***0.00815 *
(11.31)(3.090)(10.24)(1.764)
SIZEi,t−1−0.00635 ***−0.00755 ***−0.00653 ***−0.00765 ***
(−3.217)(−3.905)(−3.314)(−3.954)
LEVi,t−10.002440.006370.001640.00734
(0.228)(0.608)(0.153)(0.701)
CITY EFFECTSYesYesYesYes
YEAR EFFECTSYesYesYesYes
Constant0.183 ***0.195 ***0.184 ***0.203 ***
(4.404)(4.708)(4.152)(4.643)
Observations5716571657165716
R-squared0.1910.2260.1950.227
Adjusted R20.2030.2030.2030.203
F7.799.527.889.45
Note: ***, **, * represent the significance level of 1%, 5% and 10% respectively.
Table 6. Robustness test with operating mileage as the explanatory variable.
INVESTi,t/ASSETi,t−1INVESTi,t/ASSETi,t−1
Equation (3)Equation (5)
(1)(2)
CFi,t/ASSETi,t−10.308 ***0.340 ***
(32.01)(34.07)
CFi,t/ASSETi,t−1 *MILAEGEi,t *FDi,t 0.00216 ***
(10.79)
CFi,t/ASSETi,t−1 *MILEAGEi,t−0.000947 ***−0.00497 ***
(−14.87)(−13.14)
DIDi,t6.00e−052.36e−05
(1.568)(0.613)
FDi,t −0.00353
(−0.342)
TOBINQi,t−1−0.00578 ***−0.00405 ***
(−5.465)(−3.821)
∆NWCi,t/ASSETi,t−10.0155 ***0.0141 ***
(6.261)(5.747)
SIZEi,t−1−0.0122 ***−0.0106 ***
(−5.952)(−5.197)
LEVi,t−1−0.00363−0.00232
(−0.343)(−0.221)
CITY EFFECTSYesYes
YEAR EFFECTSYesYes
Constant0.319 ***0.291 ***
(6.680)(5.957)
Observations57175717
R-squared0.2150.232
Adjusted R20.1910.208
F8.969.71
Note: ***, **, * represent the significance level of 1%, 5% and 10% respectively.
Table 7. Further test of the impact of industry correlation.
INVESTi,t/ASSETi,t−1INVESTi,t/ASSETi,t−1INVESTi,t/ASSETi,t−1INVESTi,t/ASSETi,t−1
TOBINQGROWTHTOBINQGROWTH
Strong Industry CorrelationWeak Industry Correlation
(1)(2)(3)(4)
CFi,t/ASSETi,t−10.358 ***0.367 ***0.06990.0661
(31.06)(33.08)(1.138)(1.082)
CFi,t/ASSETi,t−1 *DIDi,t−0.271 ***−0.305 ***−0.0388−0.0371
(−13.53)(−18.06)(−0.605)(−0.578)
DIDi,t0.0230 **0.0248 ***0.03050.0307
(2.410)(2.603)(1.618)(1.626)
TOBINQi,t−1(GROWTHi,t)0.00103−3.31e−06−0.001490.000108
(0.759)(−0.366)(−0.578)(0.121)
∆NWCi,t/ASSETi,t−10.0160 ***0.00236 ***−0.0205 *−0.0192 *
(3.496)(5.024)(−1.933)(−1.850)
SIZEi,t−1−0.00748 ***−0.00873 ***−0.00461−0.00248
(−3.351)(−4.275)(−0.802)(−0.559)
LEVi,t−10.01180.0120−0.0504 **−0.0539 **
(1.054)(1.077)(−2.056)(−2.266)
CITY EFFECTSYesYesYesYes
YEAR EFFECTSYesYesYesYes
Constant0.191 ***0.220 ***0.1500.102
(3.858)(5.038)(1.175)(1.040)
Observations53425343374374
R-squared0.2270.2270.5460.546
Adjusted R20.2020.2020.4520.452
F9.199.195.815.80
Note: ***, **, * represent the significance level of 1%, 5% and 10% respectively.
Publisher’s Note: MDPI stays neutral with regard to jurisdictional claims in published maps and institutional affiliations.

