Article

Energy Network Embodied in Trade along the Belt and Road: Spatiotemporal Evolution and Influencing Factors

Economics School, Zhongnan University of Economics and Law, Wuhan 430073, China
*
Authors to whom correspondence should be addressed.
These authors contributed equally to this paper.
Sustainability 2021, 13(19), 10530; https://doi.org/10.3390/su131910530
Submission received: 9 July 2021 / Revised: 16 September 2021 / Accepted: 18 September 2021 / Published: 23 September 2021
(This article belongs to the Special Issue Renewable Energy: Pathways towards Sustainable Development)

Abstract

:
As an important part of trade in the Belt and Road Initiative (BRI) area, significant research attention has been devoted to direct energy transfer, whereas studies on energy embodied in non-energy products have largely been neglected. To present an overview of energy trade for the BRI members, this study combined multi-regional input-output (MRIO) analysis with complex network analysis to model energy use flows within the BRI’s intermediate and final trade network during 2000–2015. Results showed that intermediate energy trade volume is about 7.29-fold larger than that of final trade. Russia and Mainland China were found to be the main net exporter and net importer in intermediate energy trade, respectively, but in final energy trade their roles are reversed. In intermediate energy trade, resource exploitation and heavy industry are the leading intermediate exporter and importer respectively, whereas household consumption is the largest importer (accounting for about three-fifths of the total) in final energy trade. Based on the complex network analysis, the BRI countries were found to trade widely in the final network while cooperating deeply in the intermediate network, with obvious small-world features. Mainland China and Russia were identified as key economies in both intermediate and final trade networks. In addition, quadratic assignment procedure (QAP) analysis was adopted to explore the determinants of the BRI energy trade from 2000 to 2015. It was found that geographic distance, land adjacency, and culture and language have a consistently significant impact on intermediate trade. Closer geographic distance, being adjacent to land, a higher level of economic development, and a larger size of population can promote final trade. This study aimed to supplement existing studies on direct energy trade and provides implications for understanding the sustainable energy development in the BRI area.

1. Introduction

Proposed in 2013, the Belt and Road Initiative (BRI) has attracted significant global attention. Researchers have aimed to view and assess this initiative from different perspectives. For instance, one stream concentrates on the environmental impacts on member countries caused by rising trade [1], whereas others concern the risks of cooperation and the stability of regional trade [2]. More recently, emerging evidence shows how countries will benefit from trading under the BRI strategy [3]. Following the full implementation of the initiative, the annual average growth rate of the BRI’s trade volume was 13.4% from 2013 to 2019, which surpassed that of the total volume of global trade [4]. Energy, as a basic production material, is one of the most important issues in the BRI’s trade [5], with increasing foreign investments in the infrastructure construction inducing considerable energy consumption and trade. In addition, the unbalanced resource endowments provide the BRI countries with growing opportunities for collaboration on energy matters to ensure national energy security [6]. According to the statistics from the World Trade Organization (WTO) [4], the exports of fuels by the BRI countries totaled USD 1273 billion in 2019, accounting for 15.7% of the countries’ total exports of goods. Therefore, there is a growing awareness of studies on the energy trade of the BRI.
In addition to direct energy trade, which has been widely investigated in the literature, indirect energy trade also plays a crucial role in international trade, but it is often ignored. International trade involves the circulation of goods among countries; for instance, goods that are produced in a home country can be consumed in foreign countries. The energy consumption during the whole production process is therefore hidden in the goods and is indirectly traded to foreign areas. Due to globalization, it is common for countries to obtain indirect energy from other countries in order to avoid domestic energy use and the consequential pollutant. As a result, indirect energy trade has been proven to account for a growing proportion of the total energy trade in recent years [7], and has become a non-negligible source of environmental pollution that is transferred within international trade [8,9]. Placing emphasis on energy and pollutant transfers enables a comprehensive overview of international energy cooperation to be undertaken, which is essential to achieving sustainable energy development in the BRI area.
For this purpose, we adopted the concept of embodied energy in our study. Embodied energy is defined as the total energy consumed in product processing, manufacturing, and transportation, namely, the sum of direct and indirect energy consumption in the whole production chain [10]. Since the concept was conceptualized in the 1970s, input-output analysis (IOA) has been successfully applied by numerous researchers to evaluate embodied energy in economic systems at various levels, including in global [7,11,12], national [13,14,15,16,17], and city economies [18,19]. In terms of the BRI region, there have been a lack of studies on its embodied energy trade. One of the recent works by Han et al. (2020) compared the direct and embodied energy trade flows of the BRI countries, and found that China experienced a trade surplus with respect to direct energy trade, and a deficit in embodied energy trade, with its BRI partners [20]. Similarly, studies on virtual water (or embodied water) [21], and the carbon footprint (or embodied carbon) [22,23], for the BRI, also noted that embodiment accounting and conventional direct accounting produce different results regarding resource use and pollutant emissions. Under the 2030 Sustainable Development Goals, the BRI initiative advocates establishing a green Belt and Road, with sustainable energy development being an important field in this region [24]. Given the large energy demand and significant energy-related trade in this region, capturing a full spectrum of energy transfer among BRI countries is a critical step. This may provide key information for stakeholders who are willing to move towards a sustainable energy trade pattern or to more precisely define pollution responsibilities.
In international trade, tradable commodities are categorized into intermediate and final goods. Intermediate products are utilized for intermediate production, whereas final products are for final consumption [7]. For example, steel used in producing cars is an intermediate good, whereas cars bought by consumers are final goods. As a result of international specialization, more than 80% of international trade is represented by intermediate goods and services [25], and embodiment studies on intermediate trade have increasingly raised concerns in recent years. For instance, carbon emissions embodied in intermediate trade were found to be 2.3-fold larger than those in final trade at the global scale [26]. In a study on the water use embodied in global supply chains, the water transfer of intermediate trade was found to be 1.4-fold that of final trade [27]. However, because intermediate goods cross borders frequently and are embodied in goods multiple times [6,28], the problem of double counting may emerge in the gross trade (or total trade) accounting method, which includes both intermediate and final trade. Although this problem has been solved in conventional international trade research by using a value-added accounting method [29,30], this approach is still not mature in embodied resource research and no consensus has been reached [31,32]. Accordingly, we adopted the biophysical input-output balance model (see Appendix A) in Wu and Chen (2019)’s work [7] to distinguish intermediate and final trade in the BRI region. As a result of industrial associations and division of labor in the BRI region, more countries are involved in the regional supply chain, in which they play different roles in terms of intermediate and final trade. Intermediate and final trade depict the countries’ interconnection in the networks associated with intermediate production and final consumption, respectively. They are important to understanding the countries’ trade pattern. The embodied energy research in the BRI region, particularly separating intermediate and final trade, is lacking in the literature, but is of great importance for providing a complete picture of how energy flows with production and consumption activities in the BRI region. Therefore, we attempted to fill this research gap by separately taking into account the intermediate and final trade for the BRI regions, to help better understand the pattern of regional energy trade.
The existing literature mostly relates to bilateral trade relationships and tends to overlook the fact that trade relations among the BRI regions are complex and present network characteristics. An increasing number of researchers have applied network analysis methods to study the structure and determinants of international trade networks [33,34,35,36]. In studies of trade networks, network analysis methods have the advantage of concentrating on the connection between two regions in the network, identifying the complete structure of interactions among regions, and assessing its determinants. Thus, this approach is more valuable than traditional statistical methods. Therefore, the structural characteristics and the effects of the key influencing factors on the embodied energy trade for the BRI were explored using the methods of complex network analysis and quadratic assignment procedure (QAP) analysis. Complex network analysis enables a systematic simulation of intricate sectoral and national interrelationships along the supply chains, and has been widely documented in studies of international trade networks [12,37]. For the BRI regions, Zhao et al. (2019) depicted the oil trade network in the region via complex network analysis, and established interdependence relationships between China and the BRI countries [6]. Li et al. (2021) adopted complex network analysis to explore the evolution of the natural gas trade in the BRI region, and concluded that trade links were deepening among BRI countries [38]. Feng et al. (2020) applied a similar method to depict the trade competitive advantage networks among the BRI countries, and indicated that Turkey and Russia had the largest trade competitive advantages, whereas China functioned as the most important intermediation [39]. However, it is still unclear how the BRI’s intermediate and final energy trade networks have developed since the introduction of the initiative. The fast-growing trade in the BRI has exerted a significant impact on human activities in the region, resulting in a wide variety of energy use. Therefore, the embodied energy flows in the BRI’s intermediate and final trade during the period of 2000–2015, including the contributions of major countries and regions, were estimated in this study. Furthermore, to explore the factors that affect the network evolution of energy trade for the BRI regions, we applied QAP analysis to the embodiment accounting model. QAP analysis is a valuable tool to analyze the regression relationship between the explained matrix and the explanatory matrix, and provides a means to assess the determinants of the trade network [40,41,42]. These analyses may provide basic evidence for the establishment of more targeted agreements to strengthen energy relations at the BRI scale, which, in turn, may help build a safe and stable environment for the economic and trade development of BRI countries.
The remainder of the paper is organized as follows. Section 2 introduces the data and methods. Section 3 analyzes the evolution of energy embodied in intermediate and final trade from the national and sectoral perspectives, and Section 4 manifests network features of the BRI’s embodied energy trade network at macro-, meso-, and micro-levels. In Section 5, the QAP results for the influencing factors of the BRI’s embodied energy trade are explored, and conclusions and implications are presented in Section 6.

2. Materials and Methods

2.1. Data Sources

Following the recommendations of previous studies [5,43,44] and based on data availability, 69 countries and regions were investigated in this research, including most of the important countries and regions involved in the BRI trade (see Table A1). The global economic input-output table was derived from the Eora database [45], from which data for the BRI countries in the years 2000, 2005, 2010 and 2015 were extracted, and were deflated by the producer price index (PPI) [46]. The energy data were obtained from energy balance statistics released by the IEA [47], excluding some fossil energy that is used as industrial materials. Detailed direct energy inputs by industry can be seen in Table A2 in Appendix B. In addition, data sources of the seven variables for QAP analysis are listed in Table A3.

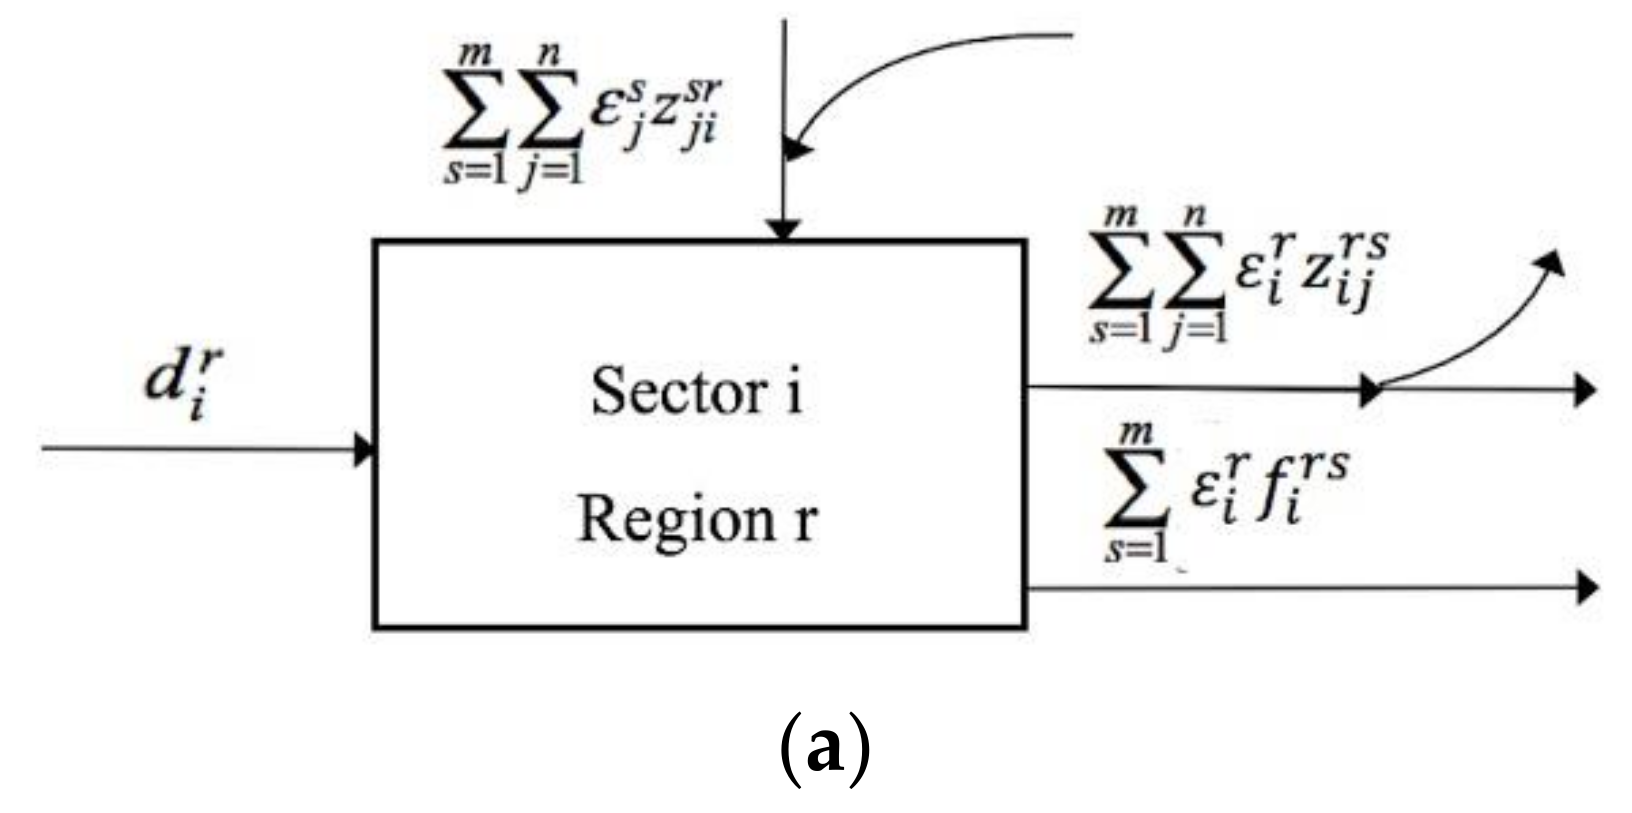
2.2. Multi-Regional Input-Output (MRIO) Model

Due to data availability, the multi-regional input-output (MRIO) model has been extensively applied in global input-output analysis [11,48]. This model consists of n sectors in m regions, presenting the exchanges among these sectors in inter-regional trade. From the perspective of sectoral energy use, the inputs include direct inputs from the ecological environment and intermediate inputs from various sectors in different regions, and outputs mainly consist of intermediate outputs and final outputs. Based on the biophysical input-output balance model developed in existing studies [49,50], for sector i in region r, the energy use balance formula can be calculated as:
d i r + s = 1 m j = 1 n ε j s z j i s r = ε i r ( s = 1 m j = 1 n z i j r s + s = 1 m f i r s ) = ε i r x i r
where d i r represents direct energy inputs (i.e., direct energy exploited from the environment) of sector i in region r; ε j s represents the embodied energy intensity of sector j in region s, that is, the amount of energy used to produce one unit of output in sector j in region s; z j i s r denotes the monetary value of commodities that are produced by sector j in region s but are then used as intermediate products by sector i in region r; f i r s represents goods or services traded from sector i in region r to region s as final products; x i r ( = s = 1 m j = 1 n z i j r s + s = 1 m f i r s ) represents total outputs of sector i in region r.
Define D as direct energy input matrix, E as embodied energy intensity matrix, Z as intermediate goods exchange matrix, and X as total outputs matrix. Formula (1) then can be written as:
D + E Z = E X ^
where the capitalized characters represent diagonalization. Because D, Z and X can be obtained through existing databases, the embodied energy intensity matrix E can be achieved.
Notably, ε is defined as the total quantity of energy resources required per unit to produce the corresponding sector’s output for either immediate or final use. As a result, all goods and services in the economic system are considered with energy hidden or embodied within them, regardless of whether they are for intermediate production or final use purposes. For region r, energy embodied in its intermediate goods imports ( E E I p r ) and exports ( E E X p r ), embodied energy flows in final goods imports ( E E I f r ) and exports ( E E X f r ) can therefore be calculated as:
E E I p r = s = 1 ( s r ) m j = 1 n i = 1 n ( ε j s z j i s r )
E E X p r = i = 1 n s = 1 ( s r ) m j = 1 n ( ε i r z i j r s )
E E I f r = s = 1 ( s r ) m j = 1 n ( ε j s f j s r )
E E X f r = i = 1 n s = 1 ( s r ) m ( ε i r f i r s )

2.3. Complex Network Analysis

According to the complex network theory, the embodied energy trade network among the BRI countries was constructed to analyze the embodied energy trade flows in this region. This network is represented by a set N = (E, F), in which E = ( e 1 , e 2 e n ) indicates the regions investigated which are taken as nodes, F = f i j = w i j a i j denotes the trade flows between the regions which are depicted as edges, in which w i j is the weight in terms of embodied energy trade volume from regions i to j, and a i j = 1 i f   w i j > 0 0 o t h e r w i s e .
The features and evolutions of the network are discussed based on the macro-, meso-, and micro-level indexes, as listed in Table 1. Macro-level indexes are designed to evaluate the general characteristics of the trade network of embodied energy in the BRI. Meso-level indexes try to distinguish the community partitioning and regional characteristics of the network. Micro-level indexes are utilized to measure the involvement of each country and to identify key economies from different perspectives.

2.4. QAP Analysis

This study applied the QAP method to analyze the determinants of the energy trade network for the BRI members. The embodied energy trade network is a set of relational data, in which structural auto-correlation frequently appears either in rows or columns of the matrix [55,56]. In addition, factors affecting this network are inevitably dependent on each other. This may lead to biased standard deviations when conducting multiple ordinary least squares (OLS) regression. To solve this problem, QAP analysis was adopted here. QAP is a non-parametric test method based on random permutations to examine the significance of the regression coefficient and goodness of fit. Because all rows and columns of the matrix are identically permuted in the QAP method, the problem of auto-correlation is addressed. QAP analysis consists of correlation analysis and regression analysis. The former examines the extent to which each influencing factor is related to the BRI’s embodied energy trade network, whereas the latter is used to inspect whether these factors have a statistically significant influence on the embodied energy trade network, and the extent of that influence.
The gravity model argues that trade among different countries depends on the characteristics of these countries [57]. The existing empirical studies mainly analyze the factors of trade relationships among countries from the following aspects. The first is the spatial proximity and geographic location among countries. For example, geographic distance is an important factor for the trade scale. The closer the distance between countries, the lower the transportation cost of trade and the larger the possibility of trade [58,59]. The second factor is culture and language. The study of Wang and Sheng (2010) shows that culture and language play a crucial role in international trade [60]. The sharing of a similar cultural background or a common language among countries reduces the information acquisition costs and hence promotes international trade [40]. The difference in economic development is another important factor. According to Chong et al. (2018), economic distance is used to test the effects of different levels of economic development on trade relations [35]. Moreover, because we focused on energy trade, in this study, the difference in energy intensity was also included, as suggested by Wu et al. (2021) [41]. Based on the existing studies [41,42,61], industry structure and population may also be vital determinants of the spatial correlation network structure of embodied energy transfer. We also included these two factors into our research. The definitions and data sources of all the factors are described in Table A3.
Based on the above analysis, the model constructed in this study is as follow:
T = f D i f f _ d i s t a n c e , B i n a r y _ l a n d , B i n a r y _ c u l t u r e , D i f f _ G D P , D i f f _ i n d u s t r y   s t r u c t u r e , D i f f _ e n e r g y   i n t e n s i t y , D i f f _ p o p u l a t i o n
where T is the dependent variable, representing the spatial correlation matrix of BRI’s embodied energy trade. Diff_distance, Diff_GDP, Diff_industry, Diff_energy, and Diff_population are absolute differences in the corresponding indexes between the countries, and are presented in the matrix form. The five variables introduced above are standardized by the column of the matrix. Binary_land and Binary_culture are binary matrices. Binary_land takes the value 1 if two countries are adjacent to land and 0 otherwise. Binary_culture is equal to 1 if two countries share the same language or culture.

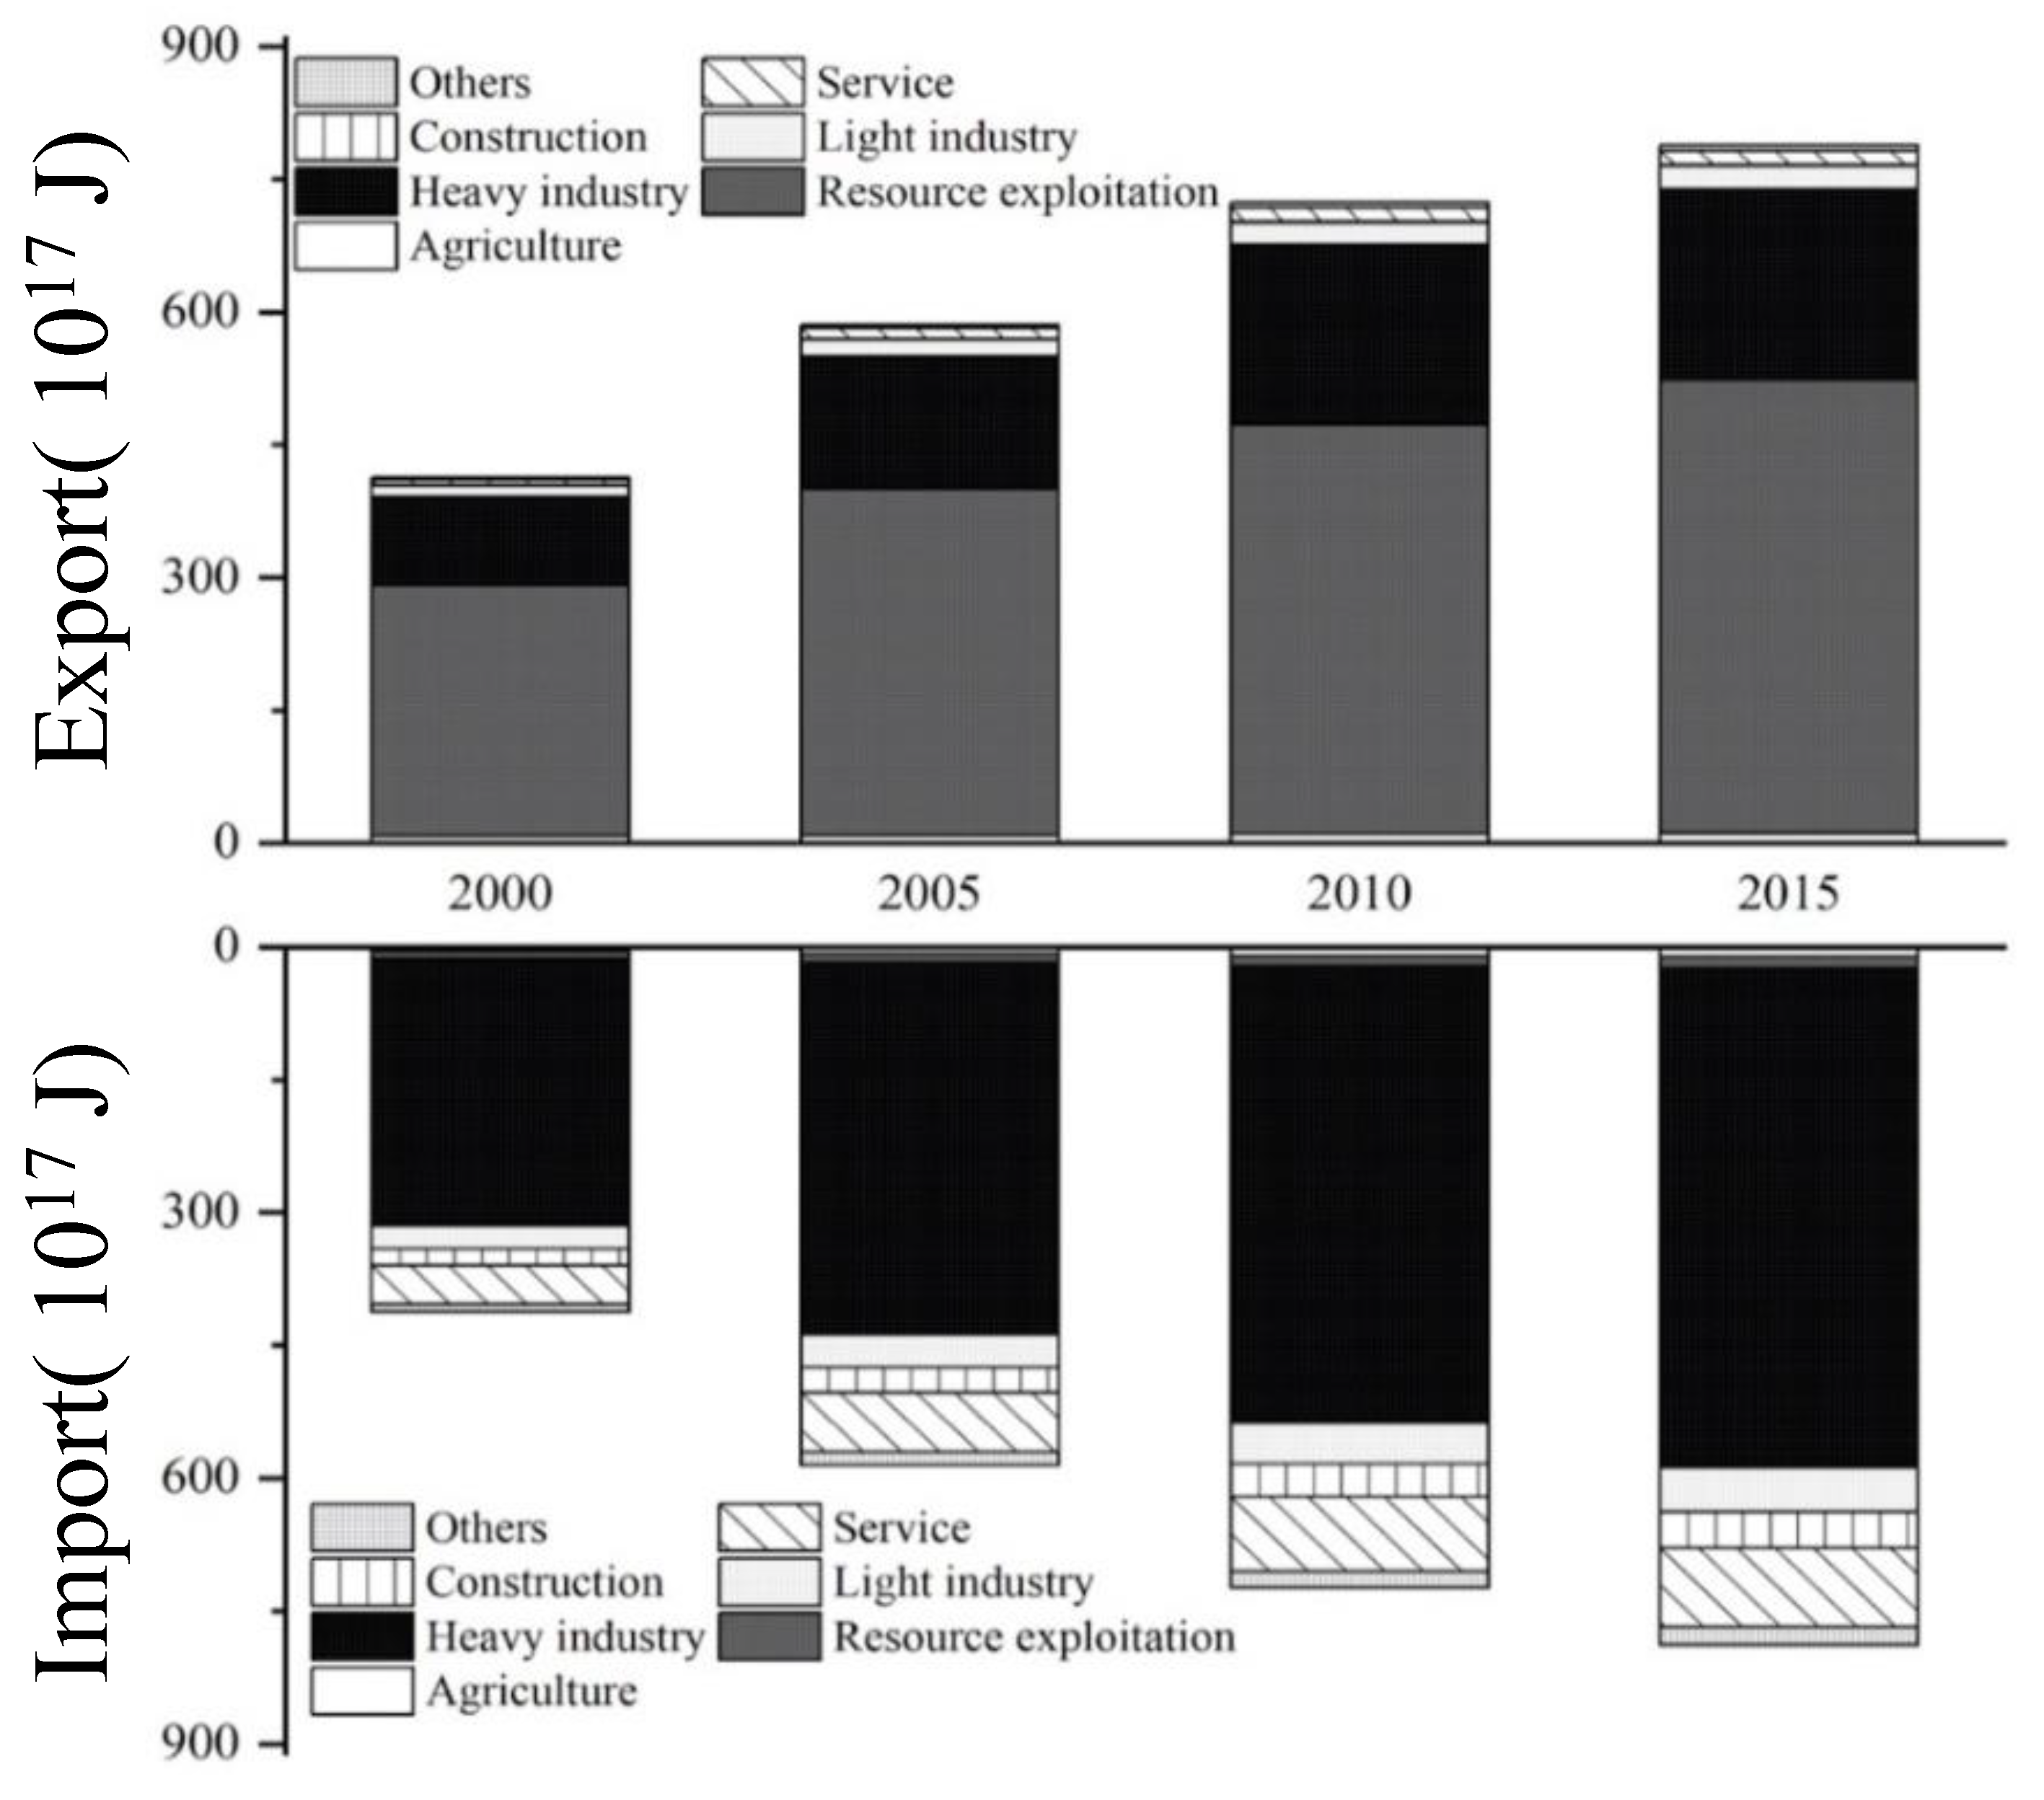
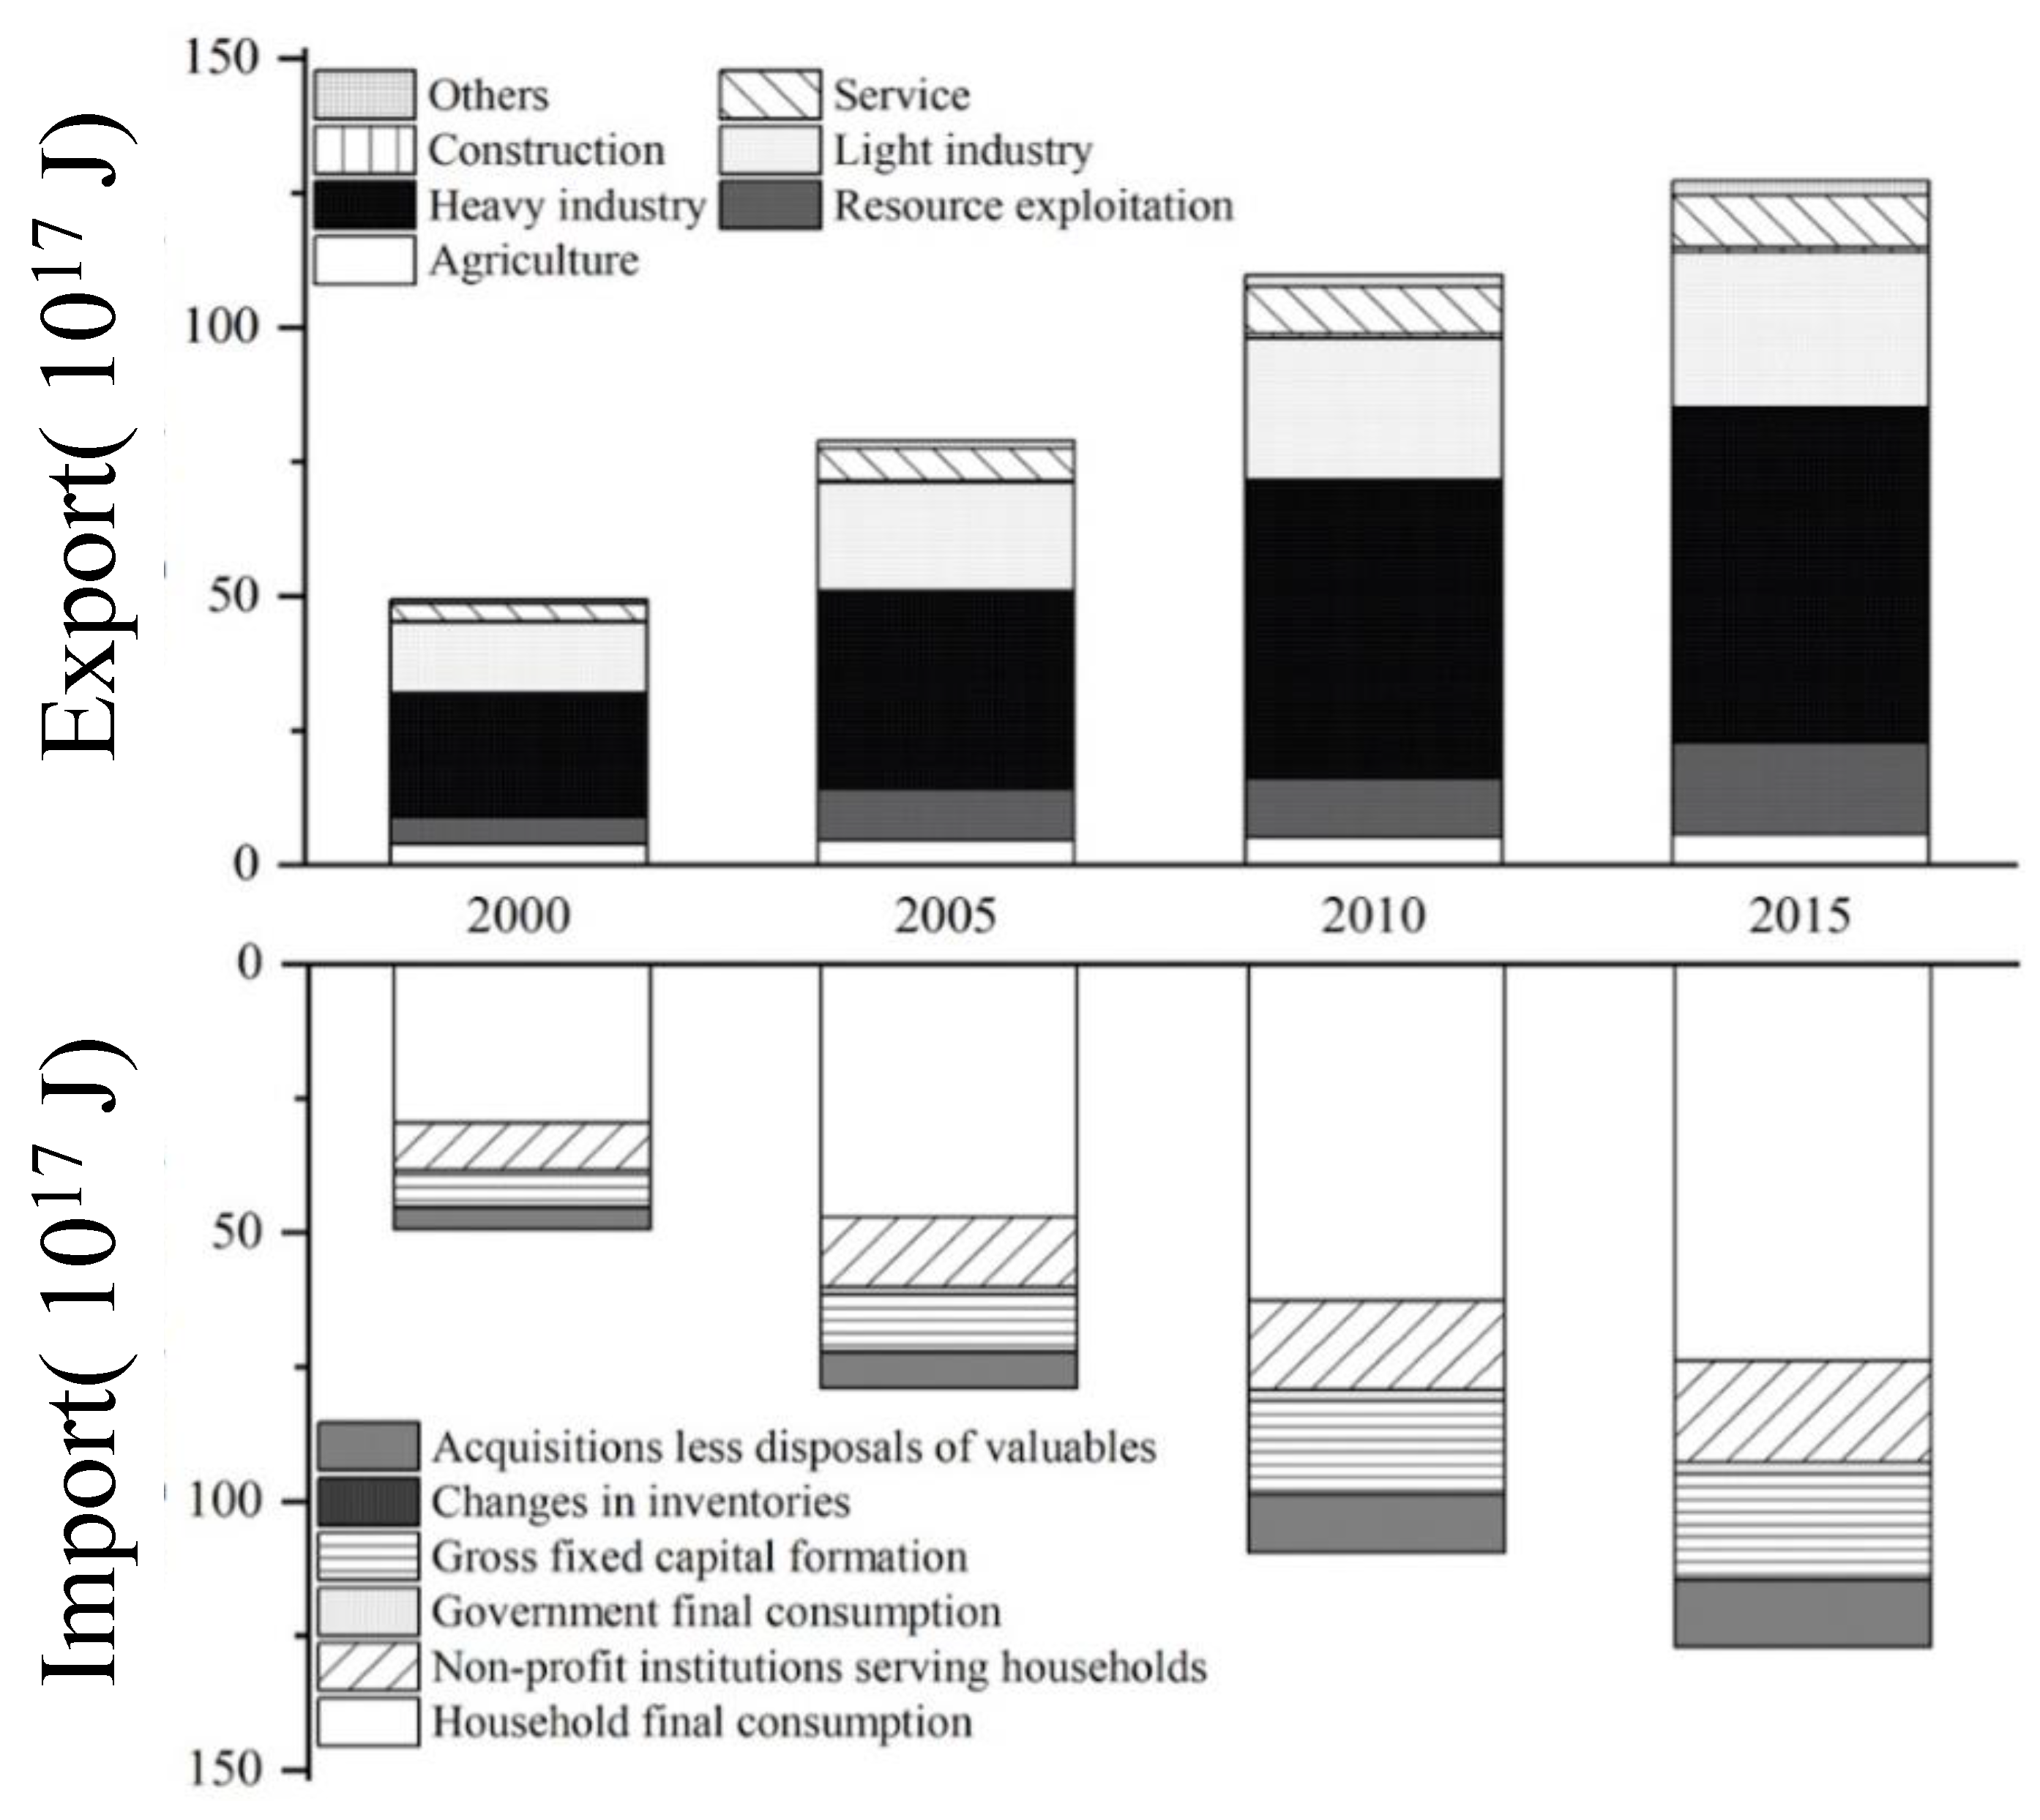
3. Energy Embodied in Intermediate and Final Trade along the BRI

By combing direct and indirect energy trade, the embodied energy trade network reflects the trajectory of total energy use flows in the BRI regions. Generally, the intermediate trade volume of embodied energy in the BRI area continued to grow during this period (from 4.13 × 10¹⁹ J in 2000 to 7.89 × 10¹⁹ J in 2015), and the same trend can be found for final trade, which increased from 4.94 × 10¹⁸ J to 1.27 × 10¹⁹ J. The BRI’s intermediate trade of embodied energy was about 7.29-fold larger than final trade on average, which is slightly higher than the ratio (5.67-fold) at the global scale [25].
In the intermediate energy trade (see Figure 1), Russia, Mainland China, and Central and Eastern Europe (CEE) are the main trading centers in the BRI region, of which Mainland China and CEE are the major embodied energy receivers, and Russia is the main embodied energy supplier. Specifically, Mainland China’s imports of embodied energy in intermediate trade were 1.33-fold larger than its exports in 2000, and this disparity increased to be 1.99-fold in 2015, indicating China’s role as a net importer in the BRI energy trade. By contrast, the export volume of embodied energy in Russia was 8.33-fold larger than its imports during the period, accounting for about one-third of the BRI’s total exports. The CEE countries, such as Turkey, Slovakia, Greece, and Czech Republic, are major receivers of Russia’s energy. Endowed with abundant energy resources, Russia supplies considerable energy resources to support the development of CEE countries, whose energy resources are extremely scarce. This highlights the importance of resource endowment in determining countries’ role in the embodied energy trade.
In terms of final trade (see Figure 2), completely different results can be seen. Mainland China and Russia switched their roles. Mainland China serves as the largest net exporter of embodied energy, whose export volume (3.46 × 10¹⁸ J) is far larger than its imports (8.94 × 10¹⁷ J), accounting for about 30% of the BRI’s total exports. Russia is the third-largest embodied energy receiver, and contributes to approximately 6% of the BRI’s total imports. An inverse trading pattern can be observed between Russia and CEE, indicating that Russia exports a large number of energy-intensive materials to CEE for local intermediate production, but imports numerous products from CEE to satisfy domestic final consumption. Furthermore, the opposite flow also exists between countries such as Saudi Arabia and Mainland China. These differences between intermediate and final trade demonstrate the country’s varied roles in the two trade types. Hence, separate accounting for embodied energy in intermediate and final trade helps provide a wider understanding of energy exchanges among the BRI countries.
Figure 3 and Figure 4 show the evolution of the sectoral contributions to intermediate and final embodied energy trade, respectively. The 26 sectors are aggregated for illustration purposes, with more details shown in Table A2.
For intermediate trade, the resource exploitation industry is the leading contributor to embodied energy exports, followed by heavy industry. During the sample period, the share of resource exploitation industry decreased slightly (from 68.98% in 2000 to 65.01% in 2015), whereas heavy industry showed an upward trend (from 23.65% in 2000 to 27.19% in 2015). Considering embodied energy imports, heavy industry is the leading contributor, accounting for around 60% of total intermediate imports. Due to the unbalanced distribution of energy reserves in the BRI region, primary resources are exported from energy-abundant countries as intermediate inputs for further processing in the heavy industry of energy-scarce countries. Although the construction sector accounts for a small proportion of total intermediate embodied energy trade (at around 5%), its import volume increased by 109.94% during the study period. This is due to the fact that the economic development and urbanization process promoted the expansion of the construction sector in many BRI countries [15]; construction is mainly involved in the material-intensive production process, leading to large amounts of energy being exported to this sector. This suggests the important role of the BRI initiative in strengthening energy cooperation among countries, which is crucial for resource-scarce countries to maintain long-term industrial development and economic prosperity. In addition, only about 11% of energy is imported for intermediate usage in the service industry, with the transportation sector being the leading contributor (about 43%), which indicates that this sector can be further strengthened with more free trade agreements among the BRI countries [62].
In final trade, heavy industry is the largest embodied energy exporter, accounting for about 48% of the BRI’s total exports. This is mainly due to the fact that heavy industry includes the sectors of electrical and machinery, metal products, processing, and manufacturing, which provide the basic materials for other sectors in the BRI countries. Compared with intermediate exports, the proportion of final embodied energy exports from light industry is more pronounced (22.63% in 2015). For the service industry, its embodied energy exports account for about 7% of total energy exports, with transportation being the largest contributor (about 38%), followed by education, health, and other services (about 14%), indicating these are highly interconnected industries in the BRI economies [25]. In terms of embodied energy imports, six kinds of final use were considered. Among these, household consumption is the largest final user, with a share of about 60% of total final use, implying that the standard of living of local residents is improving [63]. Non-profit institutions serving households account for the second largest share, but indicates a downward trend, declining from 17.65% in 2000 to 14.85% in 2015. This may due to the fact that that many BRI countries have reformed to reduce unnecessary administrative procedures, and these sectors are now operated transparently and sustainably. It is noted that the proportion of gross fixed capital formation in final use increased from 12.32% to 15.42% during the period. These resources are accumulated and prepared for infrastructure construction and future production, revealing that countries along the BRI have the potential to maintain economic prosperity.

4. Intermediate and Final Energy Trade Networks along the BRI

Several complex network indexes were utilized to capture the spatial features and evolutions of the BRI’s intermediate and final energy trade networks. These indexes can be categorized into three levels, namely, the macro-level for describing general features of networks, the meso-level for distinguishing community structure and regional characteristics of networks, and the micro-level for identifying key countries of networks. The key findings of each level are discussed below.

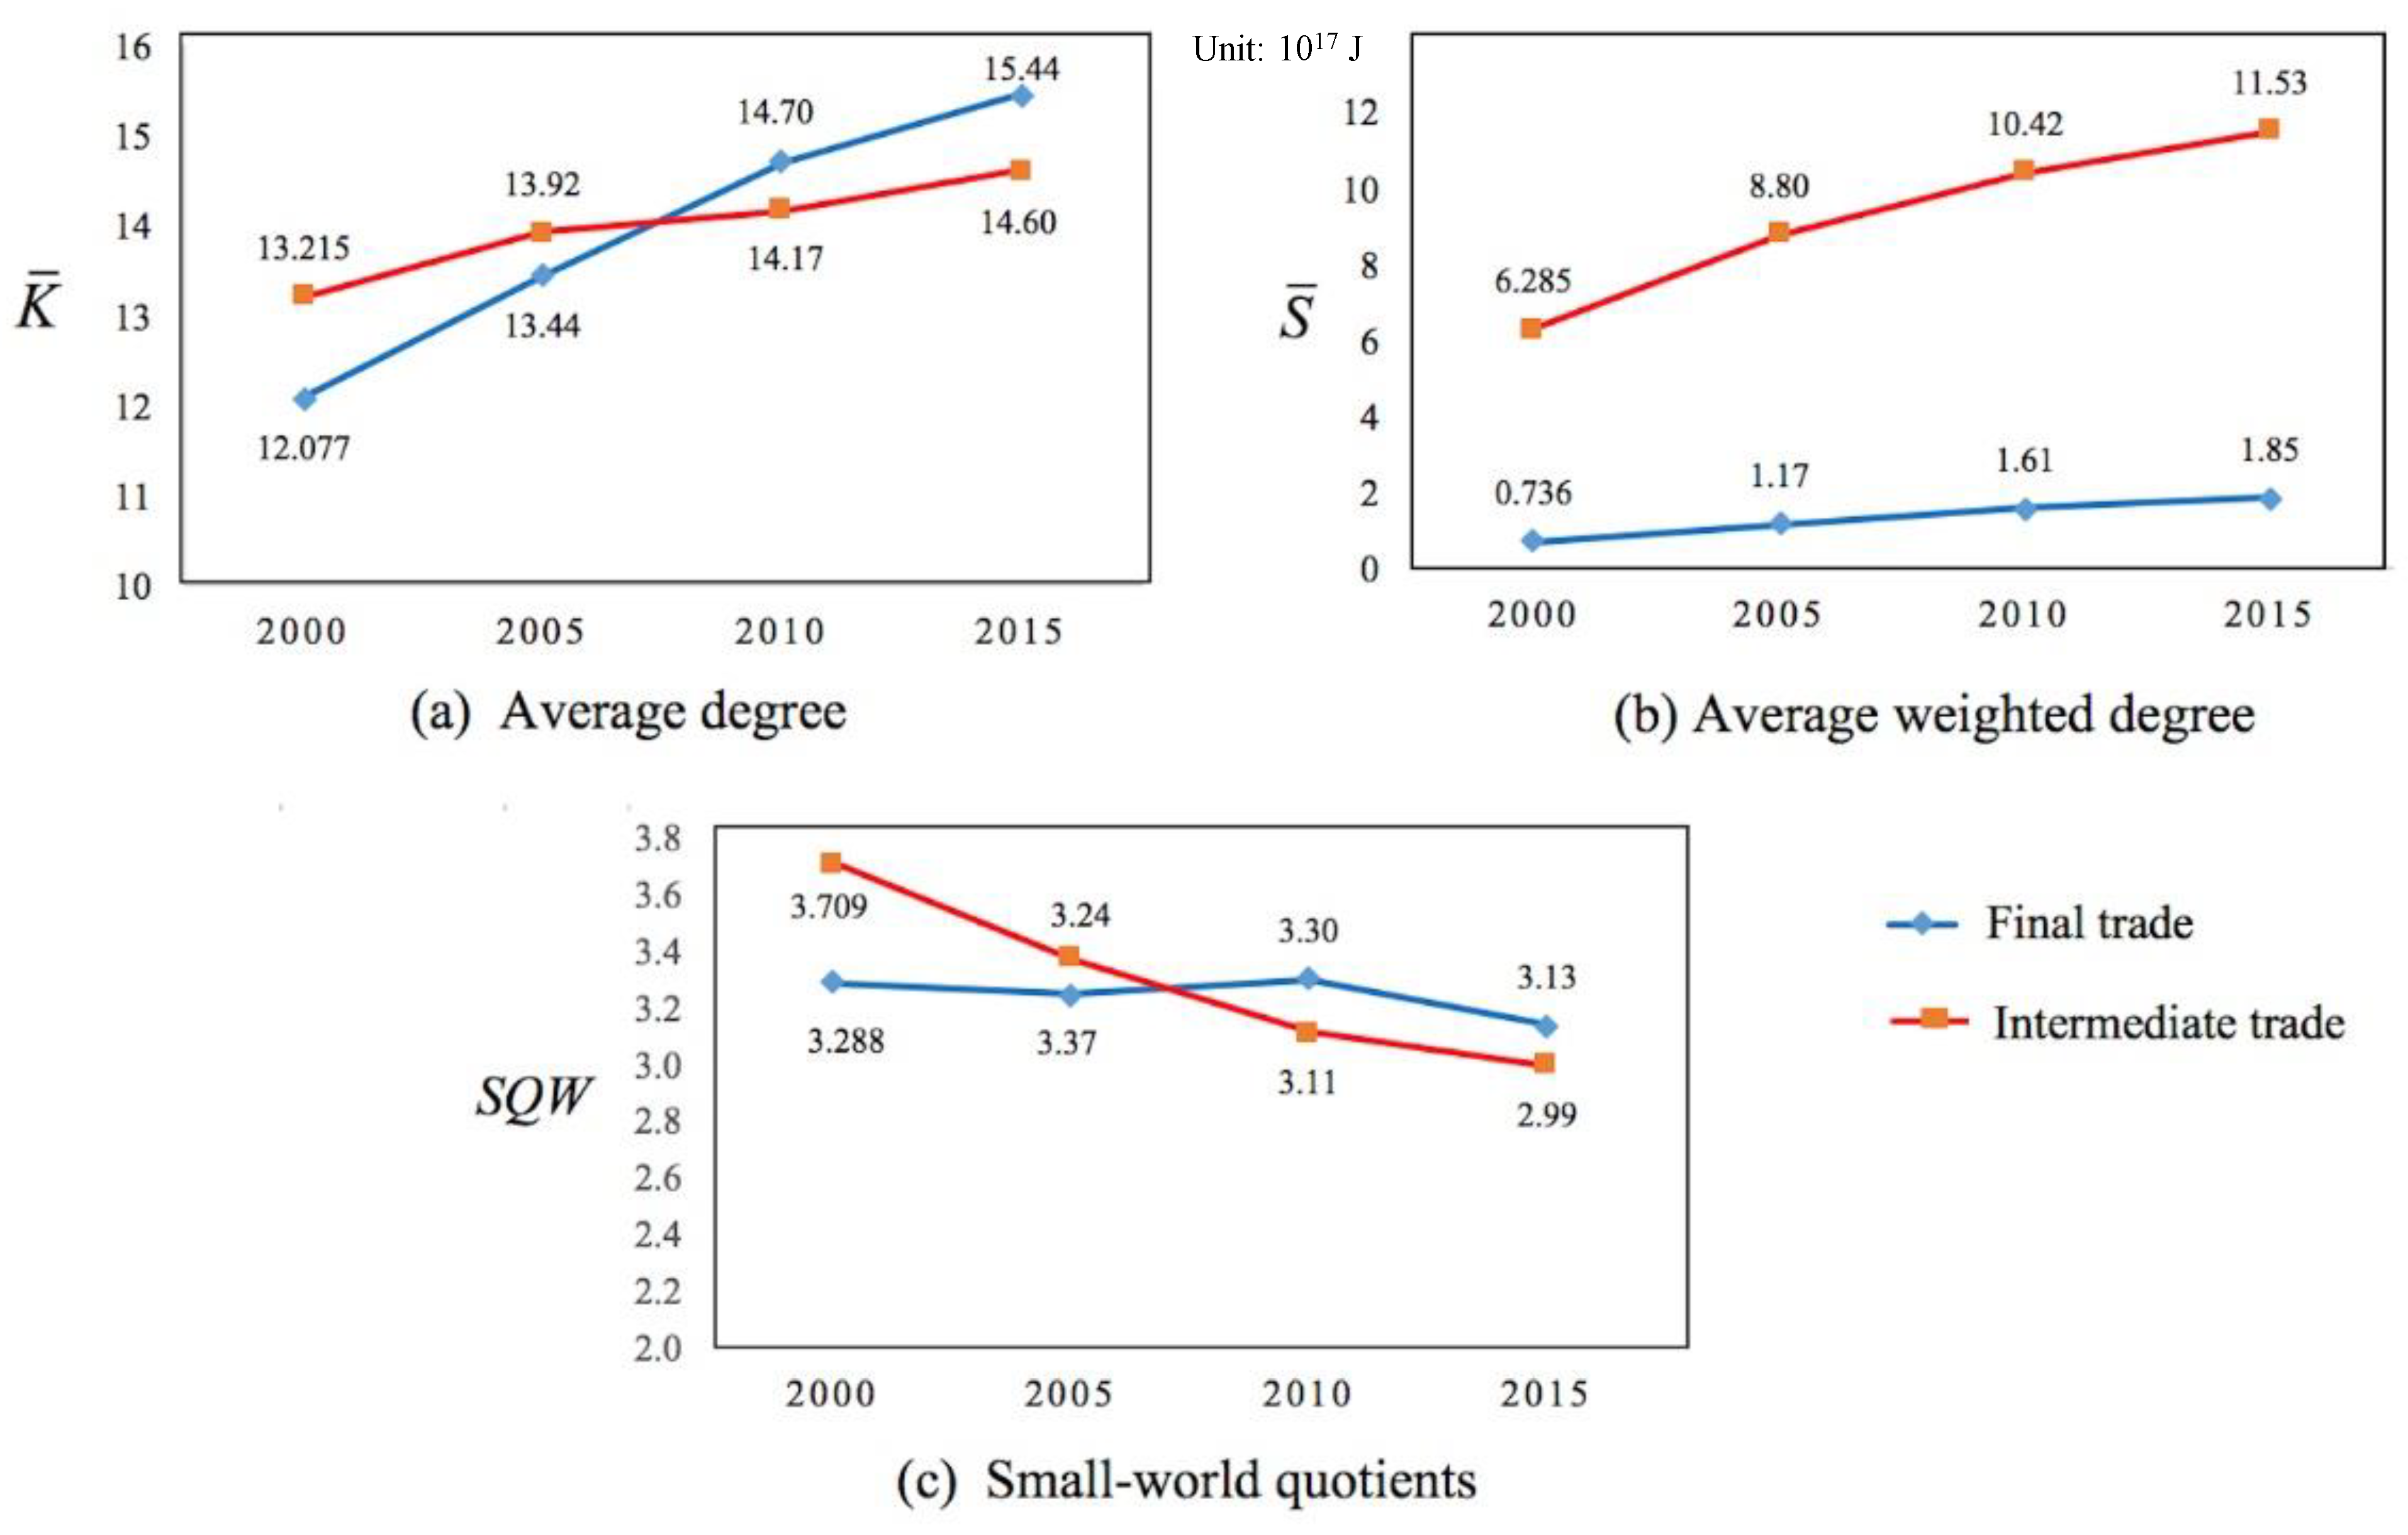
4.1. Macro-Level Analysis

The macro-level analysis identifies the general features of the embodied energy trade network in the BRI area. The evolution of the major indexes for intermediate and final trade are shown in Figure 5.
The breadth and depth of trading relationships in the BRI region are measured by the average degree and average weighted degree, respectively, as shown in Figure 5a,b. The average degree in the final trade network grew faster than that in the intermediate network. It increased from 12.08 in 2000 to 15.44 in 2015, suggesting that about three new trading partners are added to each country in final embodied energy trade on average. However, the increase in the average weighted degree was more obvious in the intermediate trade network than in the final trade network, rising from 6.29 × 10¹⁷ J in 2000 to 1.15 × 10¹⁸ J in 2015. The above trends indicate that countries trade more widely with each other in final trade, while cooperating more deeply in intermediate trade. As a result of the reduction of trade costs due to the BRI’s regional trade and transport facilitation, the region is integrated into a larger market, in which more countries are willing to exchange final products with different partners. In addition, the strengthened cooperation ties in intermediate goods processing are mainly attributed to the deepening division of production and tightening industrial linkages in the BRI area, which encourages more intensive trade in intermediate products.
Results in Figure 5c show that the small-world quotient (SWQ) was estimated to be greater than 2 for both networks, which is slightly lower than the SWQ in the global embodied energy trade network (about 5.87) [12], confirming the small-world nature in the BRI region. However, the quotient for final network reveals a downward tendency, and the same phenomenon can be found in the intermediate network after 2010. This implies a weakening small-world nature in this region, particularly after the proposal of the BRI initiative. As a result of the regional division of production, the production chain of embodied energy continues to elongate, providing opportunities for countries to trade with more partners, even if they are not geographically adjacent. This is also in accordance with one of the BRI’s aspirations to build a broader and mutually beneficial regional trade market [64].

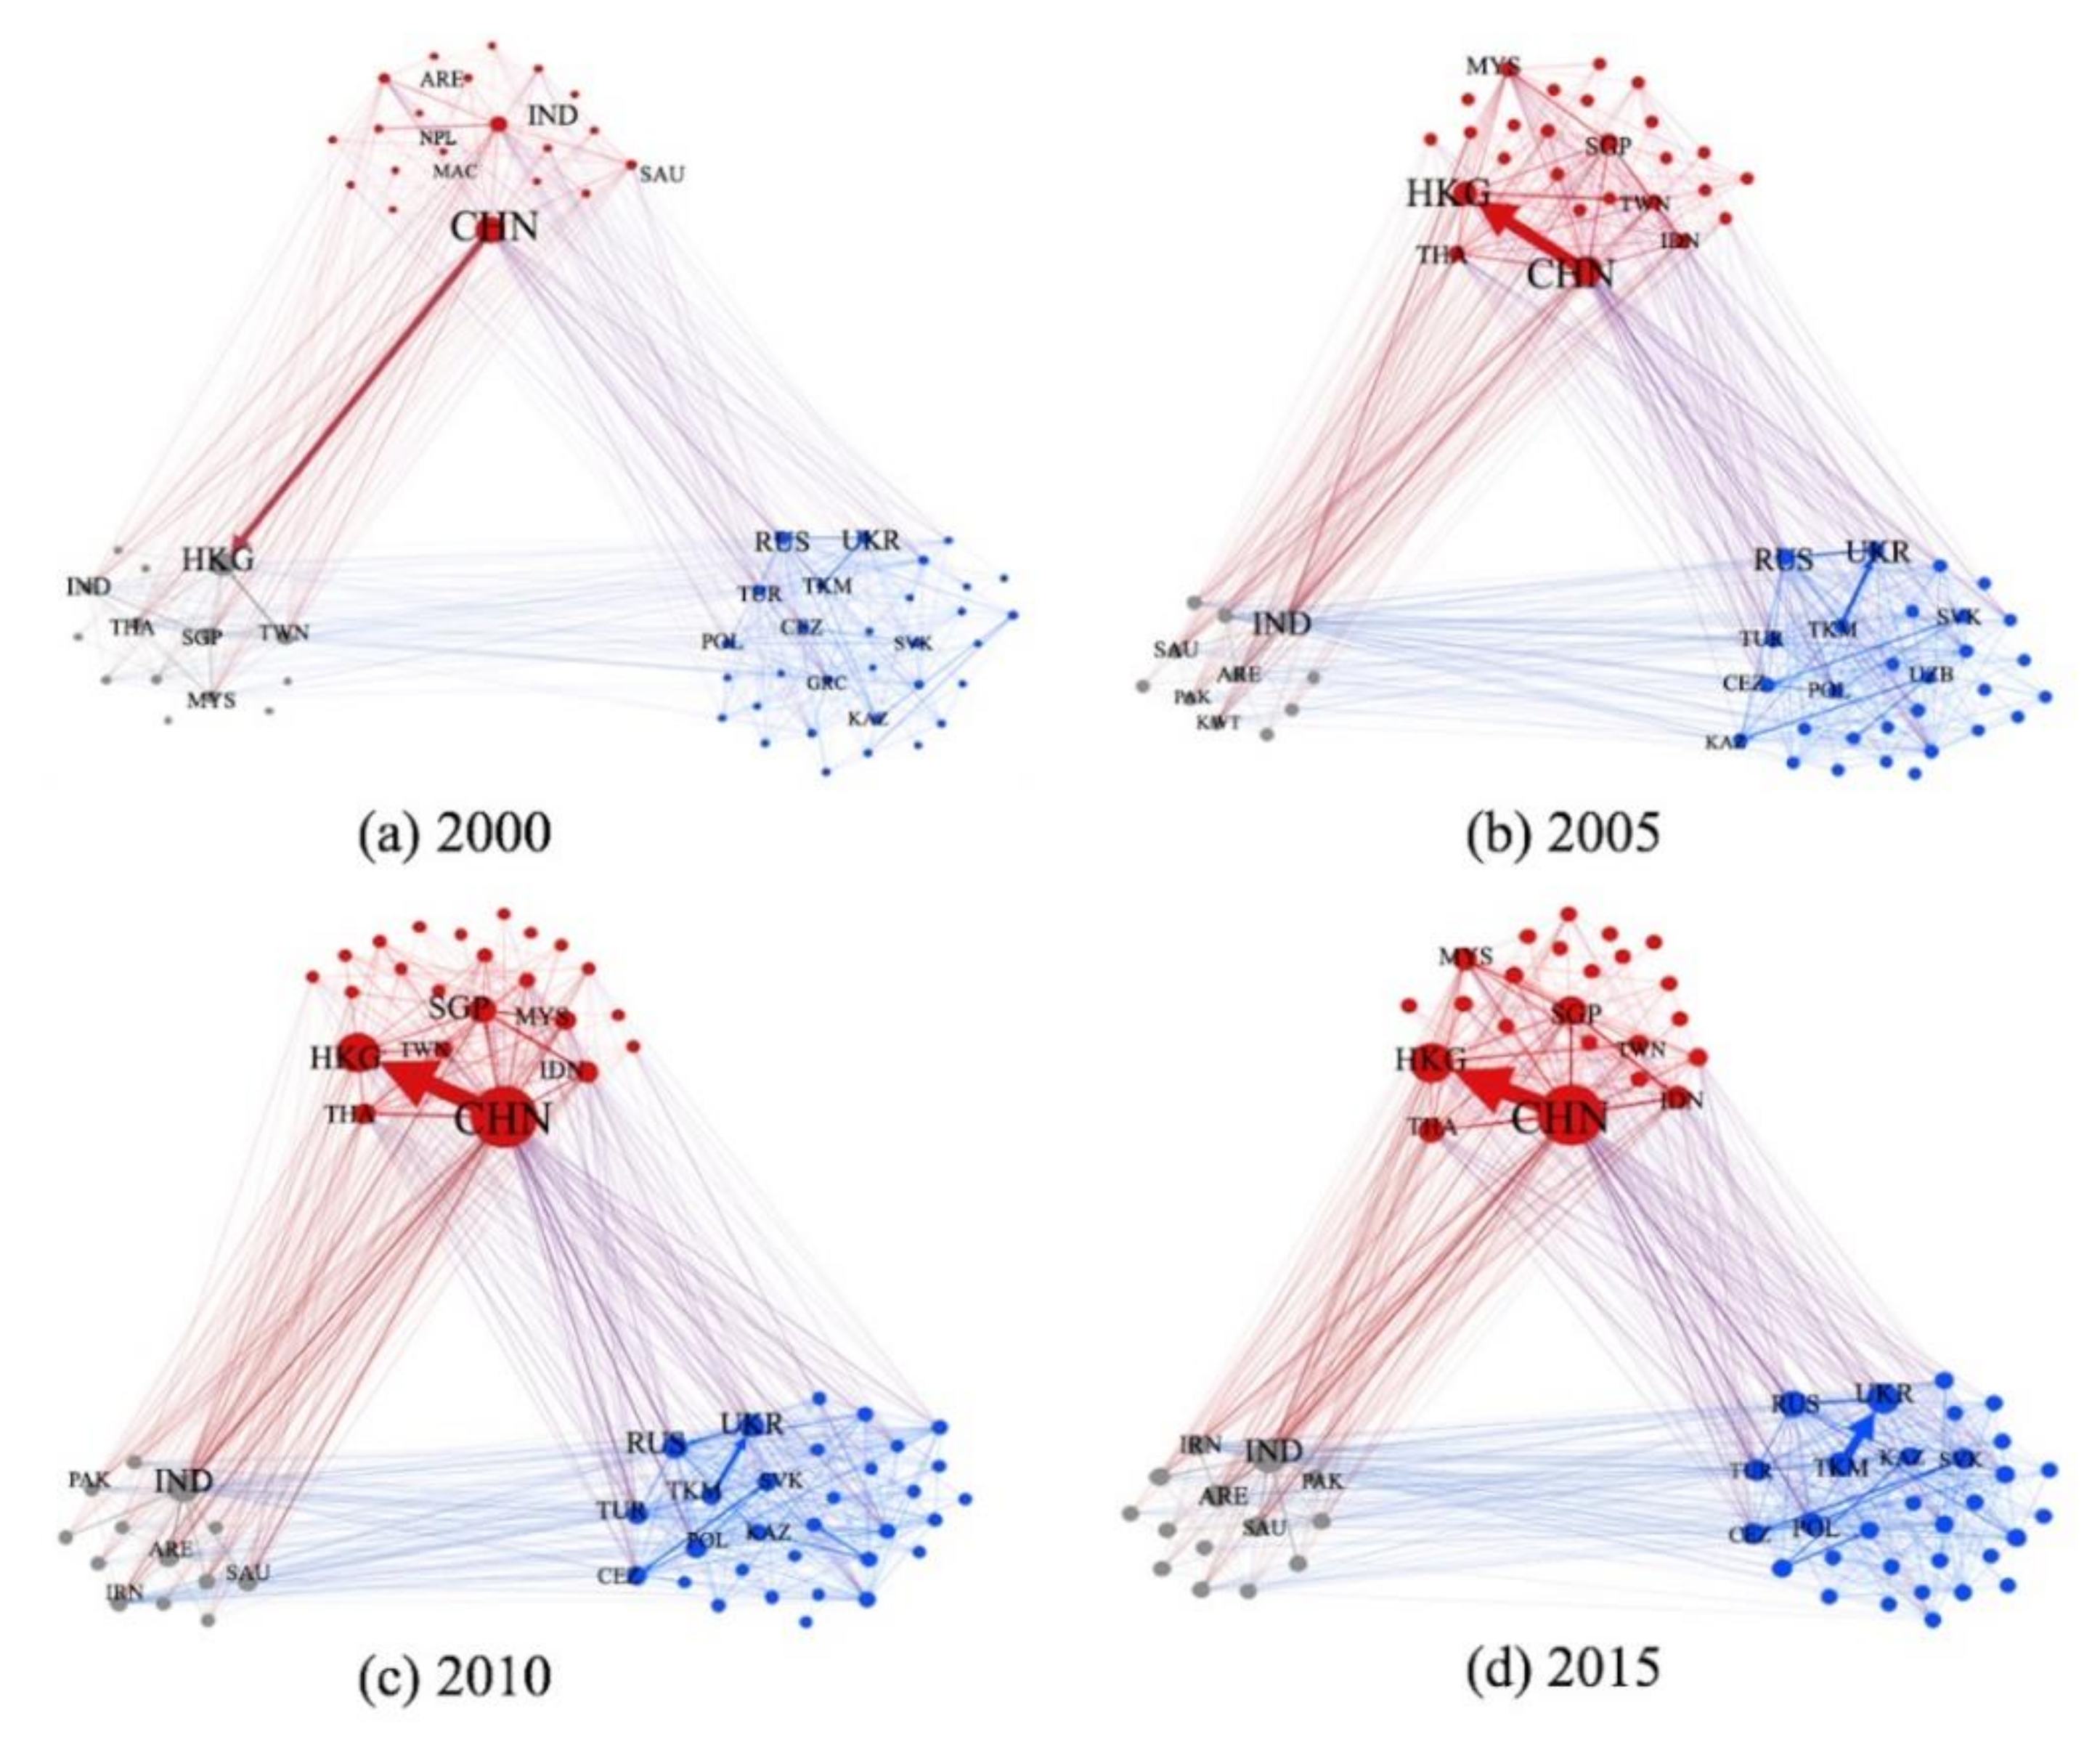
4.2. Meso-Level Analysis

In this study, modularity optimization based heuristic method [65] was adopted to identify the community structure of the embodied energy trade network in the BRI region. The modularity (Q) was calculated to be greater than 0.3 in all networks, indicating the good quality of the partitions. Generally, around 75% of trade flows are attributed to intra-community exchanges, which highlights the regional integration. Countries adjacent to each other are inclined to be incorporated into the same community in the intermediate energy trade network, whereas the geographical distribution of countries in the same community is more decentralized in final trade network. In addition, the dense spatial connections also indicate that the depth and breadth of regional trade are improving.
Figure 6 shows the regional distribution in the community from 2000 to 2015 for the final trade network, in which countries are assigned to three relatively stable communities, namely, C1, C2, and C3. Dominated by Mainland China, C1 is consistently the largest community in the BRI region, and generates 4.65 × 10¹⁸ J intra-embodied energy flows in 2015, and contributes to about 37% of the total trade flows in the network. C2 is the second largest community, which is relatively decentralized and led by Ukraine and Russia. Although the total trade volume is small for each country in community C2, these countries trade frequently with each other. Community C3 experiences minor changes in its leading country. Hong Kong was the dominant region in community C3 in 2000 but, in 2005, it broke away from this community and was placed in community C1; thus, India has been the core country in community C3 since 2005.
Regarding intermediate trade, with the exception of the year 2000, three stable communities were formed, as shown in Figure 7. Specifically, Community C1 is still led by Mainland China, which is consistent with its position in the final trade network. This implies that Mainland China, as the region’s important supplier and consumer, actively engages in intra and inter-regional trade of both intermediate and final products. Community C2 is the largest group and is more centered around Russia, which accounts for about 35% of total inter-regional trade flows, with Slovakia and Czech Republic being the largest embodied energy receivers. The large trade volume in C2 not only implies a close trade relationship, but also indicates that an energy crisis may be transmitted quickly from one country to others in community C2, particularly for key countries. Community C3 has the least intra-trade volume, and its leading countries, Turkey and Greece, have not only established various trade ties with countries within this community, but also received signficant amounts of embodied energy from Russia in community C2. In 2000, community C4 consisted of a small number of regions such as Hong Kong, India, and Taiwan. However, this community was largely disbanded in 2005, and most countries were assigned to community C1, indicating that these countries trade more frequently with other countries in C1.

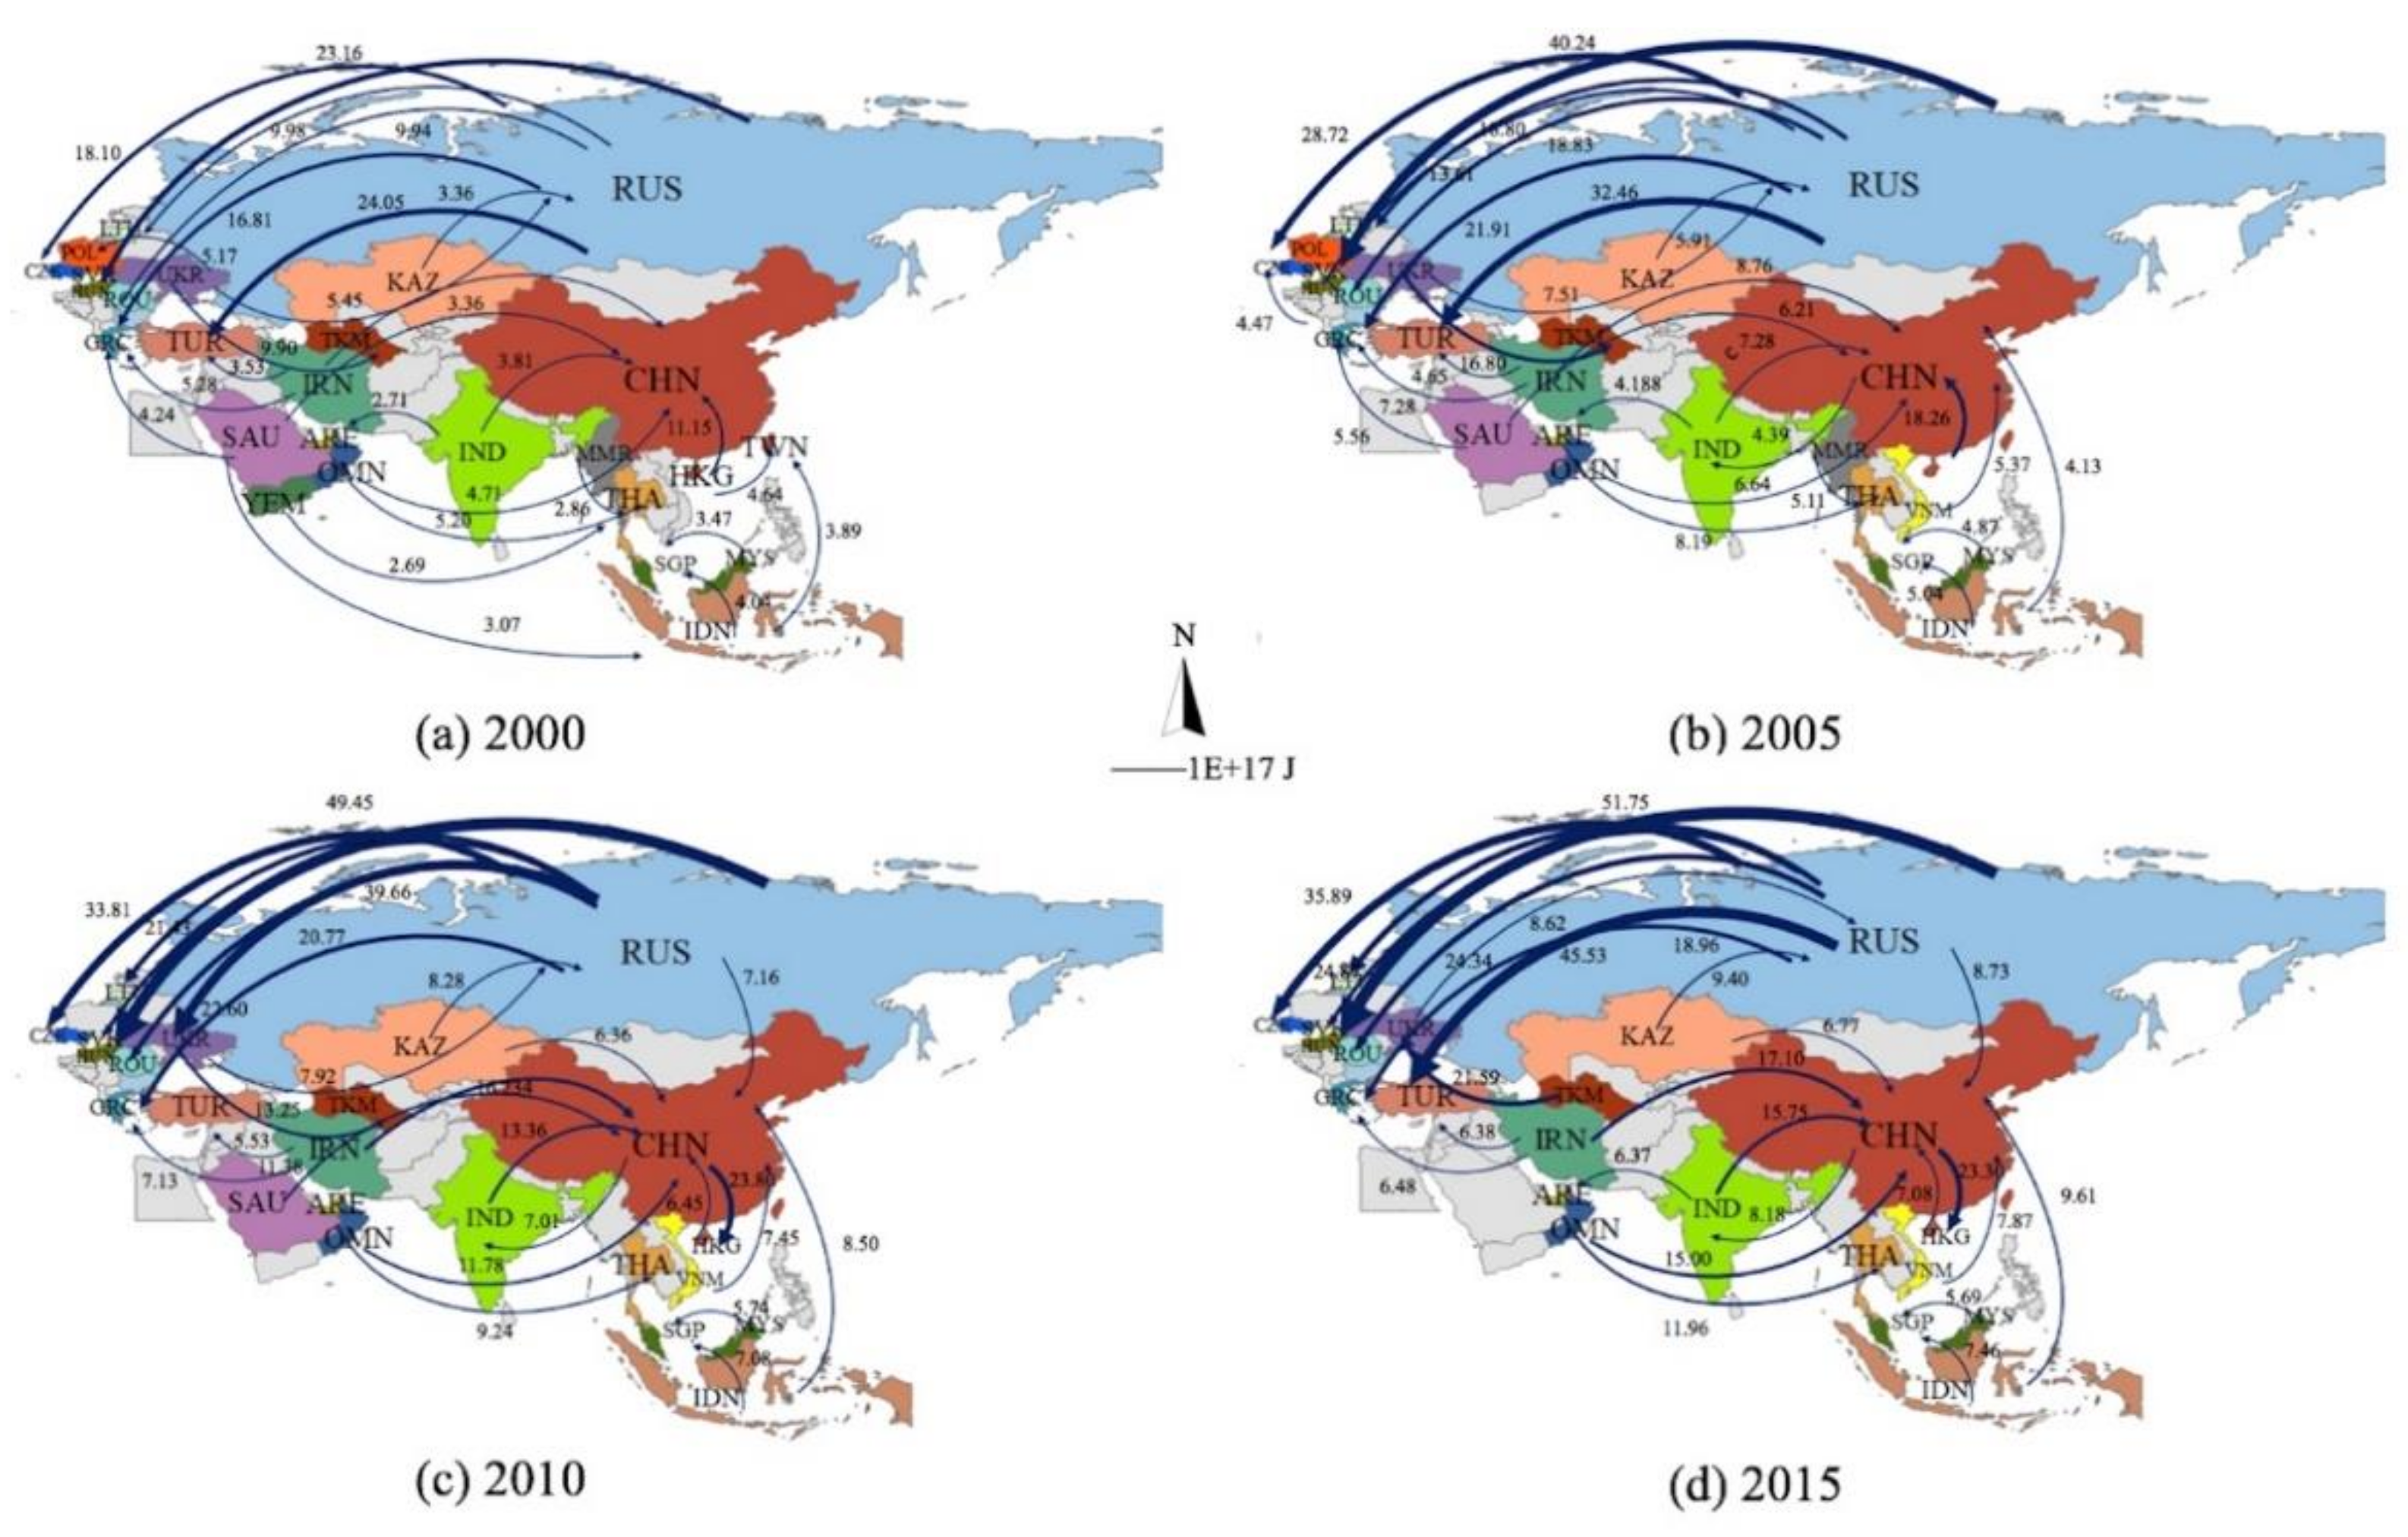
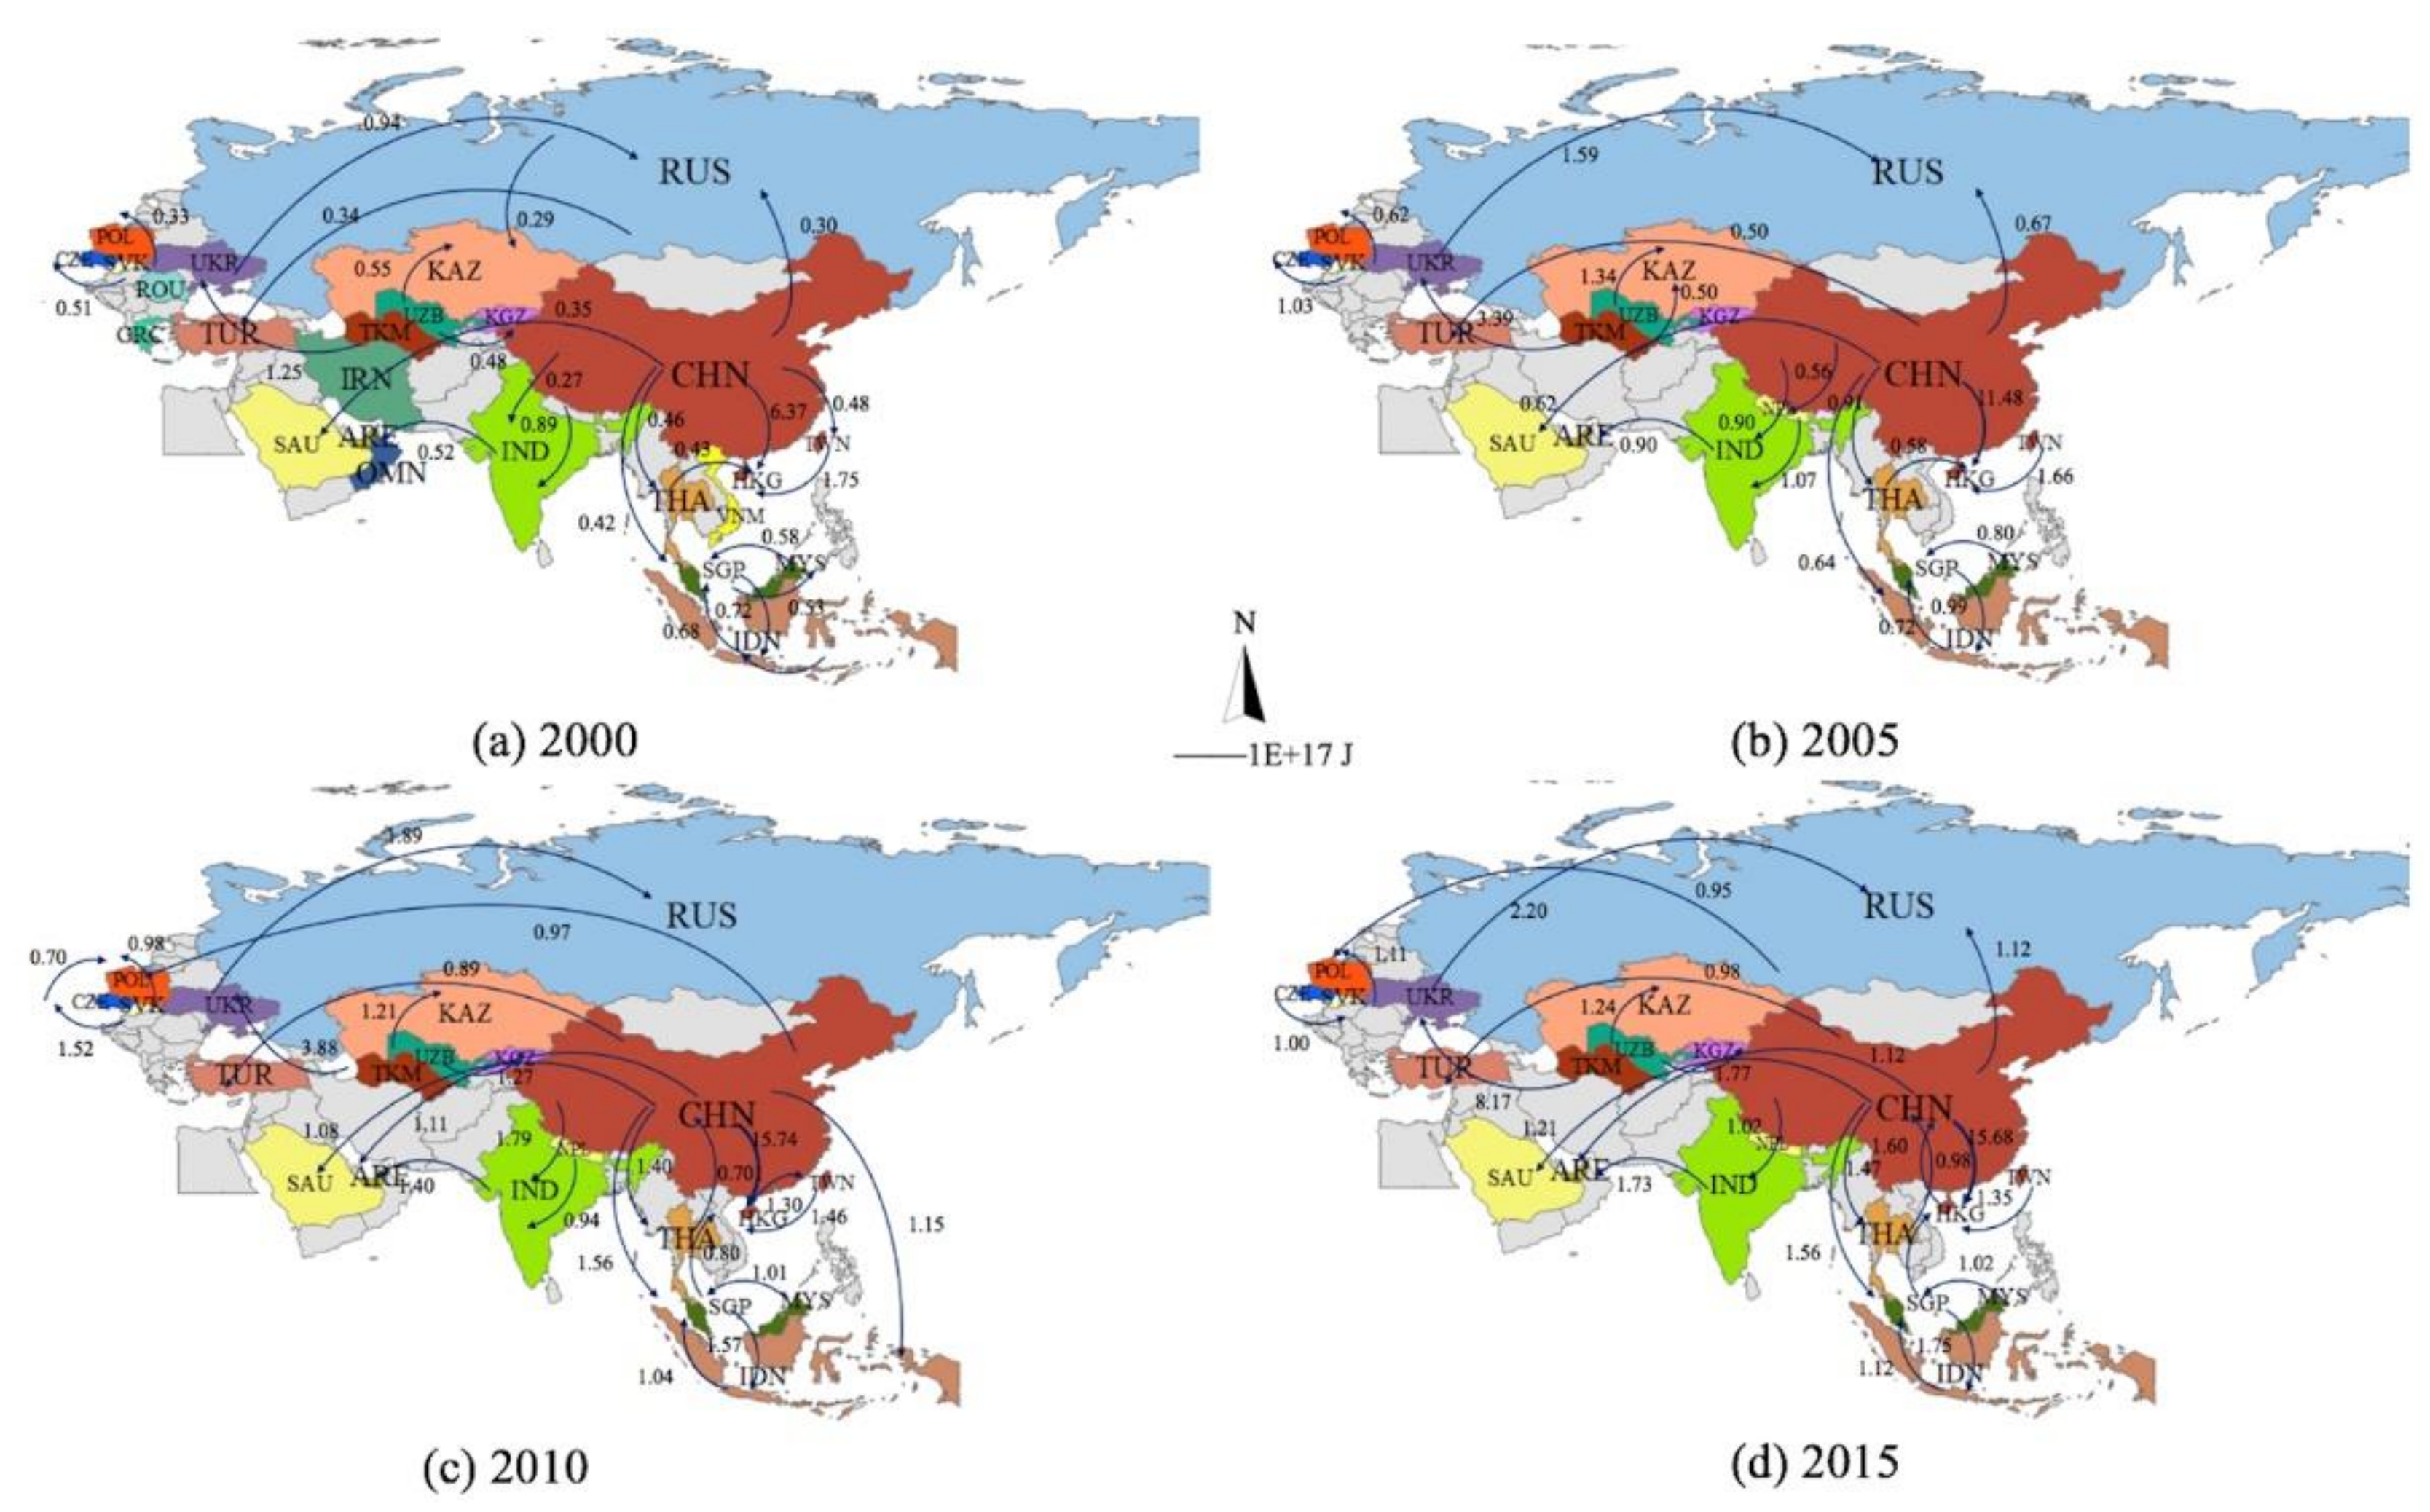
4.3. Micro-Level Analysis

Micro-level indexes were utilized to measure the involvement of each country in the BRI’s embodied energy trade network, which includes the degree, strength, and betweenness centrality. The top five economies of the above indexes from 2000 to 2015 were identified and are shown in Table A5, Table A6, Table A7, Table A8 and Table A9. Although the countries’ ranking varies in different measurements, some key economies, i.e., Mainland China, Russia, India, and Turkey, consistently rank at the forefront, highlighting their remarkable contributions to the BRI’s regional embodied energy trade.
Regarding the node degree in intermediate trade, Mainland China and India rank first and second in both in-degree and out-degree, which indicates that they are important intermediate goods processors and suppliers in the BRI’s regional supply chain. In terms of final trade, Mainland China retains its leading position with the highest in-degree and out-degree. India’s out-degree rank surpasses its in-degree rank, and this phenomenon can also be found in Turkey and Thailand, which is mainly attributed to their export-oriented strategy in trade. Overall, most countries’ in-degree in intermediate trade is larger than that in final trade, whereas an inverse trend is found regarding out-degree during the study period, which implies an imbalanced embodied energy trade pattern. Most countries sell energy embodied in final products to more distant countries in the BRI region in search of broader consumption markets. Furthermore, they also tend to diversify their country sources when importing intermediate energy products to avoid the risks associated with a supply disturbance caused by energy wars or economic crises [66].
In addition to the node degree, the important role of a country in the BRI network can also be captured through strength indexes, which describe the closeness of node relationships. Generally, summing the intermediate and final trade volumes, the weighted out-degree in Russia (about 2.48 × 10¹⁹ J) is much larger than in Mainland China (about 1.09 × 10¹⁹ J), whereas the opposite result is found in the global embodied energy trade network, in which Mainland China is the world’s largest embodied energy exporter [12]. Specifically, from the rankings shown in Table A7 and Table A8, Mainland China is consistently ranked first in terms of weighted out-degree in final trade, and ranks first and second in weighted in- and out-degree, respectively, in intermediate trade. This confirms its leading role as “the world’s factory” in the BRI region, whose energy products are imported by various BRI countries, and then manufactured and exported as semi-products for intermediate input in other countries, or as finished products to satisfy foreign final consumption needs. Russia, whose export volume is far beyond other countries, ranks first in weighted out-degree in intermediate trade during the period. This signifies the high interdependence between Russia and its energy exporting partners, which may increase potential risks for both sides. For countries that rely heavily on embodied energy imports from Russia, they may lose energy resources if they have socio-economic conflicts with Russia, or an energy crisis occurs in Russia. Conversely, Russia, whose income is heavily dependent on energy exports, may suffer significant losses due to resource anti-control measures imposed by importing countries via boycotting the use of energy from Russia [67]. These risks emphasize the crucial role of the BRI strategy in establishing stable energy supply and demand ties, which is a win-win solution for the countries involved. As the largest embodied energy importer in final trade, Hong Kong consistently ranks first in weighted in-degree. This is mainly because this region is focused on the service industry with little manufacturing, and imports a large number of energy products from Mainland China and other countries to support its operation of the tertiary industry and the daily consumption of local residents [68]. Moreover, in final trade, the export volumes of embodied energy in Singapore, Turkmenistan, Thailand, and India significantly increased during the period.
The betweenness centrality is used to identify the trade mediators in the BRI region. Mainland China and Russia play a major role as a “bridge” in both intermediate and final embodied energy trade networks. If this role is disrupted, the regional supply chains among the corresponding countries become disconnected. However, in the global embodied energy network inspected by Chen et al. (2018), the mediate position of Russia is significantly weakened and, in contrast to the current study, the network is mostly controlled by the United States, China, and Germany [12]. In addition, in intermediate trade, the mediate position of Turkey and Greece dropped sharply from 2005 to 2010, which was probably due to the global financial crisis in 2008. In final trade, the mediate position of most countries revealed a downward trend, implying a more decentralized feature in the BRI’s embodied energy trade.

5. Influencing Factors on Energy Trade Network of the BRI

5.1. QAP Correlation Analysis

In this paper, 5000 random permutations were selected to undertake a correlation analysis between the spatial correlation matrix of the BRI’s embodied energy trade and the impact factors, as shown in Table 2 and Table 3. We found the following results.
First, in terms of the intermediate trade network, Geographic distance, Land adjacency, Culture and language, Level of economic development, and Population were strongly correlated with the network from 2000 to 2015 at the 1% significance level. In particular, Geographic distance was the only influencing factor that was negatively correlated with the network, which implies that the greater the geographic distance among different countries, the lower the regional trade volume. In addition, Energy intensity was marginally significantly correlated with the intermediate trade network only in 2000 and 2005. Considering the magnitudes of the correlation coefficients, Land adjacency and Level of economic development were the largest, suggesting that these two factors have the closest relationships with embodied energy trade, and that their influence increases as the coefficients increase. However, Industrial structure was not statistically correlated with intermediate trade network.
Second, from the perspective of the final trade network, Geographic distance, Land adjacency, Culture and language, Level of economic development, and Population were found to be statistically significant. In contrast to intermediate trade, Energy intensity was not statistically correlated with the final trade network. However, it is noteworthy that Industrial structure was found to be statistically significant in the final trade network, compared to the intermediate network. This indicates that the proportional disparity of the secondary industry in GDP between two countries has no relation to intermediate energy trade network, but is positively correlated with final network to some extent.

5.2. QAP Regression Analysis

Because correlation analysis only provided preliminary results, QAP regression analysis was then applied to further investigate the statistical significance of the impact of different factors on the energy trade network for the BRI countries. QAP regression analysis was derived from the selection of 5000 random permutations. The regression results of the influencing factors on the BRI embodied energy flows in intermediate and final trade are shown in Table 4 and Table 5, respectively.
First, in terms of intermediate trade, Geographic distance, Land adjacency, and Culture and language are long-term significant factors, and have the greatest impact on embodied energy trade. Specifically, the coefficient of Geographic distance is statistically negative at the 1% critical level, suggesting that a shorter geographic distance between countries leads to a higher level of trading volumes. This finding is consistent with the previous literature [35] and the arguments of the gravity model [57]. High transportation costs of energy and energy products (mostly from the heavy industry sector) induce countries to trade with partners with short geographic distance. Land adjacency plays a crucial role in the intermediate trade network, in which countries who are adjacent to land tend to trade more energy with each other. This is mainly due to the fact that oil and natural gas are frequently traded in the BRI regions, but they are mainly transported through pipelines, thus leading to high construction and management costs if countries are not adjacent to each other. However, when considering the dynamic features, the influence of this factor weakens from 2000 to 2015, indicating that, with the diversified modes of energy trade, adjacency to land tends to be less important in embodied energy trade. The regression coefficients of Culture and language are significantly positive but with a diminishing trend. This implies that countries benefit from a common language and a similar cultural background. It also suggests that cultural and language barriers still exist among the BRI countries due to information asymmetry and cultural shock. However, as a result of the advancement of the BRI strategy, which has promoted more frequent trade cooperation among BRI countries, cultural barriers are decreasing over time [69]. According to the results of Level of economic development, its positive impact increased before 2010 and then decreased after the proposal of the BRI strategy, suggesting a decreasing influence on the BRI energy trade network. Results also show that countries with a high economic development disparity tend to trade more with each other. One possible reason is that some economically advanced countries with abundant energy resources tend to have higher labor and pollution costs associated with the development of energy-intensive industries. These industries are thus transferred to less-developed countries to reduce costs, which facilitates trade among countries. Furthermore, results were found to be significant for Energy intensity only in 2000 and 2005. The positive value indicates that countries with a larger energy intensity disparity tend to have greater trade in embodied energy. Some BRI countries at that time were in the initial stage of development, and their economies relied heavily on energy and had a relatively high level of energy intensity, whereas some energy abundant countries had a low level of energy intensity due to their strict environmental regulations and clean production technology. The difference in energy intensity between these countries induces the frequent transfer of energy among the BRI regions [70]. Nevertheless, Population significantly affected trade in certain years but showed no clear pattern, and Industry structure had no significant effect on the network. Therefore, the reduction in the cost of transportation via technology to mitigate the limitation of geographic distance, adjacency to land, and narrowing of the language and cultural gap between BRI countries can promote intermediate embodied energy trade.
Second, from the perspective of final trade, Geographic distance, Land adjacency, Level of economic development, and Population have a significant influence on the final network during the sample period. The trends of Geographic distance and Land adjacency in final trade are similar to those of intermediate trade. Compared with the intermediate trade network, the coefficients of Level of economic development showed an opposite trend, in which the influence increased from 2000 to 2015. This suggests that the disparity in the countries’ economic scales has a significant positive effect on the BRI embodied energy trade, and that its influence is growing. The impact of Culture and language on final trade was marginally significant in 2000 and 2005, but subsequently became insignificant. Industrial structure was found to be statistically insignificant, as in the intermediate trade network. To conclude, we find that a closer geographic distance, adjacency to land, a higher level of economic development, and a larger size of population can promote final trade for the BRI countries.

6. Conclusions and Implications

This study applied MRIO analysis to model the energy use embodied in both intermediate and final trade networks of the BRI region. In this paper, the spatiotemporal evolution of the trade networks and its influencing factors from 2000 to 2015 are discussed via complex network analysis and the QAP approach. Several meaningful conclusions and potential suggestions can be drawn from this paper.
First, the total volume of intermediate trade in the BRI area is about 7.29-fold larger than that of final trade on average. Large embodied energy flows in both intermediate and final trade indicate that BRI countries trade more frequently with each other as a result of their economic and industrial development. In addition, this also implies that this region has the potential for maintaining clean energy development and a sustainable production–consumption pattern, because energy use is closely related to environmental pollution. In the intermediate energy trade, Mainland China and CEE are major embodied energy receivers, whereas Russia is the main supplier of embodied energy. Nevertheless, Mainland China and Russia switched their role in final trade, suggesting the importance of resource endowment in determining countries’ role in the embodied energy trade. From the industrial perspective, in intermediate trade, resource exploitation and heavy industry are the leading embodied energy exporting sectors, whereas heavy industry and the service sector are key importers. In final trade, heavy and light industries are the main exporting sectors, whereas household final consumption accounts for the greatest share of embodied energy imports.
Second, at the macro-level, countries in the BRI area trade more widely with each other in final trade, whereas their cooperation is deeper in intermediate trade. In both intermediate and final trade networks, a small-world nature is manifested. At the meso-level, about 75% of total trade flows are attributed to intra-community exchanges, which highlights the importance of regional integration. The final trade network forms three stable communities from 2000 to 2015, dominated by Mainland China, India, and Russia, respectively. Three stable communities and one unstable community were witnessed in intermediate trade, which are centered around Russia, Mainland China, Turkey, and Hong Kong, respectively. At the micro-level, the node degree, weighted degree, and betweenness centrality were used to identify key economies in the network. Mainland China ranked first in both in-degree and out-degree. For weighted in-degree, Mainland China ranked first in intermediate trade, whereas Hong Kong ranked first in final trade. For weighted out-degree, Russia and Mainland China were the leading embodied energy exporter in intermediate and final trade, respectively. In addition, Mainland China and Russia act as a “bridge” in each type of network. These diversified trade patterns have several implications for different entities. For most embodied energy importing countries, it is necessary to expand their trade partners to reduce their dependence on major energy countries such as Russia and Mainland China, which can mitigate the negative impact on them of energy crises in major countries. For the main embodied energy exporters, it is also of significant importance for them to manage their energy trade relationships with countries in the same community, and diversify their exporting structure to reduce their high reliance on energy exports. In addition, although the BRI strategy has resulted in significant progress in strengthening energy cooperation ties among member countries, the energy trade status of key countries may not only influence BRI’s direct energy supply, but also have a significant impact on regional industrial supply chains by influencing indirect energy trade. Accordingly, the future steps of the BRI strategy must focus on coordinating energy relations among these core countries to stabilize regional energy security.
Third, geographic distance between countries, and the adjacency of pairs of countries to land, have significant effects both on intermediate and final energy trade networks. The extent of cultural similarities has a consistently significant effect only on intermediate trade, whereas GDP disparities and population differences between countries significantly affect final trade. Energy intensity plays a weaker role in both trade networks and industry structure has no significant impact. The QAP regression results indicate that there are still opportunities available to promote BRI’s embodied energy trade. Developing new technologies to reduce the transportation costs of energy transfer, or encouraging developed countries to help build energy-related infrastructure in impoverished countries, will enable more distant countries to establish a tighter embodied energy trade link. In addition, the BRI strategy must also play a role in fostering cultural and economic communication and establishing a transparent regional energy trade platform to reduce transaction costs due to cultural and language barriers.
Because large energy and non-energy products are transferred more frequently in the BRI region, the issue of carbon emissions caused by cross-border trade has also attracted broader concerns. To address this problem and maintain progress toward the United Nation’s 2030 Sustainable Development Goals, it is important to reduce embodied energy use and define the global carbon emission responsibilities of the BRI countries. The results in our study present detailed information about the embodied energy transfer of each BRI country, thus providing an understanding of the quantity of energy each country has provided or received in regional trade. As a result, authorities are able to implement consumption- or production-oriented policies to control local carbon emissions. In terms of allocating responsibilities for carbon reduction, this study also provides a holistic perspective of total energy use in the BRI region, which can be used to identify emission responsibilities associated with intermediate and final trade. This can supplement the existing studies that focus merely on responsibilities in final trade, and help formulate a fair proposal for allocating emission reduction responsibilities.
The combination of these policies and the previous trade models can raise countries’ awareness of their current status in the embodied energy trade network, and thus allow a more active involvement in the BRI region. However, this research only presents a preliminary overview of the energy network embodied in the trade among the BRI countries, and a number of limitations can be addressed in future research. First, the global MRIO table adopted in this study only incorporates countries at the national or regional level, and neglects the provincial heterogeneity within a country. For instance, although the manufacturing capacity and import–export volumes vary significantly among provinces in China, these disparities are integrated into Mainland China in the global MRIO table. This may cause some deviations and more detailed implications cannot be derived. Second, in this study, we calculated and analyzed the energy embodied in the BRI’s intermediate and final trade. This may involve the double-counting of terms due to the frequent cross-border trade of intermediate goods, meaning it is not possible to estimate the added value of embodied energy produced by each country in the regional division of production. Thus, one of our future research directions may be to resolve the issue of double-counting in terms of energy trade in order to more precisely identify the contribution of each country in the energy supply chain. Third, although the Eora database used in this paper is the most suitable database to the best of our knowledge, its robustness and reliability for making targeted policies remain to be validated [71]. In addition, the update of this database is relatively slow, so we cannot track BRI’s energy flow during the past five years. Finally, energy flows within the BRI member countries were classified in this study. However, these countries also have close energy interactions with countries outside the BRI region, which also deserve special attention. Thus, future work may also compare energy flows both inside and outside the BRI region.
To conclude, as a result of the prosperity resulting from socio-economic development among the BRI countries, energy trade will become increasingly important in the future. This study undertook a comprehensive analysis of the spatiotemporal evolution and influencing forces of the BRI intermediate and final energy trade networks. It is expected that its results will supplement the direct energy trade theory and contribute to recent efforts to better understand the roles and responsibilities of the BRI countries in the context of energy conservation and carbon reduction, and to provide insight for the implementation of targeted energy trade policies to establish stable energy trade relations in the BRI region.

Author Contributions

Conceptualization, Y.P. and X.W.; methodology, Y.F. and Y.Y.; software, Y.Y.; validation, L.X. and Y.S.; formal analysis, Y.P. and Y.F.; investigation, Y.F. and L.X.; resources, Y.F. and L.X.; data curation, Y.Y.; writing—original draft preparation, Y.F. and L.X.; writing—review and editing, Y.P. and X.W.; visualization, Y.F. and Y.Y.; supervision, Y.P. and X.W.; project administration, Y.P.; funding acquisition, X.W. All authors have read and agreed to the published version of the manuscript.

Funding

This research was funded by the National Natural Science Foundation of China, grant number 71804194.

Institutional Review Board Statement

Not applicable.

Informed Consent Statement

Not applicable.

Data Availability Statement

The data presented in this study are available from the authors upon request.

Acknowledgments

This work was supported by the National Natural Science Foundation of China, grant number 71804194. The authors are especially grateful to anonymous reviewers and the editors for providing precious comments and suggestions to this article. The authors also acknowledge all experts and colleagues who provided ideas, offered help and proposed recommendations to this article.

Conflicts of Interest

The authors declare no conflict of interest.

Appendix A. Information on the Method

In conventional international trade accounting, a country’s gross trade contains both intermediate and final trade, which leads to a double-counting problem. In order to tackle the problem, the value-added accounting method has been widely applied in the literature. For instance, Li et al. (2021a) calculated trade in value-added of Outward Foreign Direct Investment (OFDI) using the Trade in Value added (TiVA) database initiated by the WTO and OECD [72]. Grodzicki (2020) applied vertically-integrated analysis to capture the combined contributions of all industries supplying their inputs to the automotive final production within a value chain [73]. Koopman et al. (2014) decomposed the country’s gross exports into sixteen value-added components based on the input-output table, and identified four double-counting terms [74]. Other examples using a similar decomposition method for excluding double-counting terms can be found in Johnson and Noguera (2012) [29] and Zhao et al. (2018) [30].
However, in terms of natural resources (e.g., energy, land, and water) or pollution emissions (e.g., carbon and mercury) embodied in trade, research on the double-counting problem remains insufficient. Usubiaga-Liaño (2021) identified the double-counting portion in the energy footprint due to the use of both primary and secondary energy sources [75]. Dai et al. (2021) applied the Hypothetical Extraction Method (HEM) to decompose value-added trade and estimated the CO2 emissions induced by China–US trade [31]. Recent embodied carbon research mentioned the value-added method [32,76], in which CO2 emission intensities and value-added coefficients are adopted to separate the original input-output table into embodied carbon flows (in physical units) and value-added flows (in dollar units) in trade, and performed a comparison. However, they only solved the double-counting problem in trade flows, and not in carbon flows. Hence, to date, there is no consensus on the method used to tackle the double-counting problem in embodiment accounting. As in the case of studies of international trade, which evolved from the gross trade accounting method to value-added trade accounting, introducing added value into embodied energy to address the double-counting problem requires time and further validation.
As a result of the deepening international division of production, natural resources, and pollution emissions are transferred more frequently in intermediaries. Research regarding embodied accounting has thus received significant attention [26,77]. Generally, there are two types of double counting in embodied energy research. The first category concerns the process from intermediate production in one county to final consumption in another. When a commodity is first traded for intermediate production and then traded for final use, it is recorded twice in gross trade accounting. Accordingly, the double-counting issue occurs if embodied energy in intermediate trade and final trade are summed. Because our study was designed to compare intermediate and final trade to explore regional trade patterns in energy supply chains, the discussions on gross trade (or total trade) were excluded to avoid ambiguity. In the revised manuscript, we calculated and discussed intermediate and final imports and exports, respectively, without adding them together, in order to provide an overview of energy use in intermediate and final trade of region r, which is a prerequisite for understanding the role of region r in the BRI’s energy supply chains.
The second category of double-counting occurs within intermediate trade, in which energy use in intermediate goods and services of one country may be traded for production of other intermediate goods and services in foreign countries, and is therefore recorded twice. However, we should note that the issue of double-counting is common to all networks, and not all double-counting results are meaningless. For example, in conventional international trade, many national or regional-level statistics are still based on gross trade accounting. The double-counting terms in gross trade are used to gauge the depth of a country’s participation in the global production chain, and important messages may be missed if no account is taken of the double-counted terms [74]. Similarly, the double-counted terms in embodied energy accounting induced by exchanges of intermediate goods and services reflect the interconnection of energy flows in the intermediate trade network, and can provide statistical support for understanding sectoral or national inter-dependence in energy trade. In this regard, the portion related to this category of double-counting was retained in this study.
In our study, we referred to Wu and Chen (2019)’s work to calculate the embodied energy in intermediate trade based on gross trade accounting [7]. As indicated in Equation (1) in the main text, d i r + s = 1 m j = 1 n ε j s z j i s r = ε i r ( s = 1 m j = 1 n z i j r s + s = 1 m f i r s ) = ε i r x i r , which implies that Sector i in Region r receives direct energy inputs ( d i r ) and indirect energy use ( s = 1 m j = 1 n ε j s z j i s r ) in terms of embodied energy of intermediate inputs, to produce outputs containing total energy use ( ε i r x i r ). This equation is actually an expression of the energy conservation law in the biophysical input-output balance model [7] (see Figure A1 below). In the model of Figure A1a, we can see that all goods and services in the economic system are expressed in energy units, i.e., joules, to estimate the energy use related to the goods and services, which is analogous to monetary units that are adopted in economic analyses to evaluate the economic value of the goods and services. Parallel to the unit price defined in economic analyses, embodied energy intensity ε is defined as the total amount of energy resources required per unit to produce the corresponding sector’s output for either immediate or final use. As a result, all outputs have a price and contain energy use, regardless of whether they are for intermediate production or final use purposes.
Figure A1. Energy use flows for a typical (a) sector and (b) region.
Sustainability 13 10530 g0a1aSustainability 13 10530 g0a1b
When all sectors in region r are considered, we can obtain Figure A1b. For region r, it imports intermediate goods and services ( s = 1 ( s r ) m j = 1 n i = 1 n z j i s r ) for industrial production, and imports goods and services for final use ( s = 1 ( s r ) m j = 1 n f j s r ), from foreign regions. These imports can be multiplied by the unit price of the corresponding sector to obtain the economic value of intermediate and final imports of region r. In this study, we adopted ε to convert the trade data to joules to address the energy issue. Intermediate and final imports were multiplied by ε of the corresponding sector to obtain the energy use embodied in intermediate imports (i.e., the energy use for the production of these intermediate imports) and final imports (i.e., the energy use for the production of these final imports), which can be illustrated as E E I p r = s = 1 ( s r ) m j = 1 n i = 1 n ( ε j s z j i s r ) and E E I f r = s = 1 ( s r ) m j = 1 n ( ε j s f j s r ) , respectively. E E I p r evaluates the energy support given by foreign regions to intermediate production in region r, and E E I f r indicates the energy use in foreign areas to meet the final demand in region r. Similarly, the exports of region r are imported by foreign regions for either intermediate production ( i = 1 n s = 1 ( s r ) m j = 1 n z i j r s ) or final use ( i = 1 n s = 1 ( s r ) m f i r s ). The energy use related to these intermediate exports ( E E X p r = i = 1 n s = 1 ( s r ) m j = 1 n ( ε i r z i j r s ) ) and final exports ( E E X f r = i = 1 n s = 1 ( s r ) m ( ε i r f i r s ) ) measures the energy use in region r to support the intermediate production and final use in foreign areas, respectively.

Appendix B. Data Description and Data Source

Table A1. The 69 countries and their abbreviations in the BRI region.
CountryAbbreviation CountryAbbreviation CountryAbbreviation
1AfghanistanAFG24IndonesiaIDN47PolandPOL
2AlbaniaALB25IranIRN48QatarQAT
3ArmeniaARM26IraqIRQ49MoldovaMDA
4AzerbaijanAZE27IsraelISR50RomaniaROU
5BahrainBHR28JordanJOR51RussiaRUS
6BangladeshBGD29KazakhstanKAZ52Saudi ArabiaSAU
7BelarusBLR30KuwaitKWT53SerbiaSRB
8BhutanBTN31KyrgyzstanKGZ54SingaporeSGP
9Bosnia and HerzegovinaBIH32LaosLAO55SlovakiaSVK
10BruneiBRN33LatviaLVA56SloveniaSVN
11BulgariaBGR34LebanonLBN57Sri LankaLKA
12CambodiaKHM35LithuaniaLTU58SyriaSYR
13Mainland ChinaCHN36Macao SARMAC59TaiwanTWN
14CroatiaHRV37MalaysiaMYS60TajikistanTJK
15CyprusCYP38MaldivesMDV61ThailandTHA
16Czech RepublicCZE39MongoliaMNG62MacedoniaMKD
17EgyptEGY40MontenegroMNE63TurkeyTUR
18EstoniaEST41MyanmarMMR64TurkmenistanTKM
19GeorgiaGEO42NepalNPL65UkraineUKR
20GreeceGRC43Gaza StripPSE66UAEARE
21Hong KongHKG44OmanOMN67UzbekistanUZB
22HungaryHUN45PakistanPAK68Viet NamVNM
23IndiaIND46PhilippinesPHL69YemenYEM
Table A2. Industry categorization for direct energy inputs.
Sector ContentSector Grouping
1AgricultureAgriculture
2FishingAgriculture
3Mining and quarryingResource exploitation
4Food and beveragesLight industry
5Textiles and wearing apparelLight industry
6Wood and paperLight industry
7Petroleum, chemical and non-metallic mineral productsHeavy industry
8Metal productsHeavy industry
9Electrical and machineryHeavy industry
10Transport equipmentHeavy industry
11Other manufacturingLight industry
12RecyclingLight industry
13Electricity, gas and waterHeavy industry
14ConstructionConstruction
15Maintenance and repairService
16Wholesale tradeService
17Retail tradeService
18Hotels and restaurantsService
19TransportService
20Post and telecommunicationsService
21Financial intermediation and business activitiesService
22Public administrationService
23Education, health and other servicesService
24Private householdsService
25OthersOther industries
26Re-export and re-importOther industries
Table A3. Explanation, variables, and data sources of influential factors.
Influencing FactorExplanationVariablesData Sources
Geographic distanceThe geographic distance between the capitals of two countriesDiff_distance
(Geographic distance difference matrix)
CEPII database
http://www.cepii.fr/CEPII/en/bdd_modele/presentation.asp?id=6 (accessed on 8 June 2021)
Land adjacencyWhether two countries are adjacent to each other by landBinary_land
(Land adjacency binary matrix)
CEPII database
http://www.cepii.fr/CEPII/en/bdd_modele/presentation.asp?id=6 (accessed on 8 June 2021)
Culture and languageWhether countries share the same language or cultureBinary_culture
(Culture and language binary matrix)
CEPII database
http://www.cepii.fr/CEPII/en/bdd_modele/presentation.asp?id=19 (accessed on 8 June 2021)
Level of economic developmentThe GDP disparity between countriesDiff_GDP
(Economic scale difference matrix)
World Bank database
https://data.worldbank.org/indicator/NY.GDP.MKTP.CD
(accessed on 8 June 2021)
Industrial structureThe difference of the proportion of the secondary industry in GDP between two countriesDiff_industry
(Industrial structure difference matrix)
World Bank database
https://data.worldbank.org/indicator/NV.IND.TOTL.ZS?view=chart (accessed on 8 June 2021)
Energy intensityThe disparity of the proportion of energy consumption to output between two countriesDiff_energy
(Energy intensity difference matrix)
This study
PopulationThe population difference between two countriesDiff_population
(Population difference matrix)
World Bank database
https://data.worldbank.org/indicator/SP.POP.TOTL
(accessed on 8 June 2021)

Appendix C. Data for Network Indexes

Table A4. Macro-level network indexes of intermediate and final energy trade network from 2000 to 2015.
Network CategoryYearAverage DegreeAverage Weighted DegreeSmall-World Quotients
Intermediate trade network200013.226.29 × 1017 J3.71
200513.928.80 × 1017 J3.38
201014.171.04 × 1018 J3.11
201514.601.15 × 1018 J2.99
Final trade network200012.087.36 × 1016 J3.29
200513.441.17 × 1017 J3.24
201014.701.61 × 1017 J3.30
201515.441.85 × 1017 J3.13
Table A5. In-degree indexes of top 5 BRI countries from 2000 to 2015.
Ranking12345
Intermediate2000Mainland ChinaRussiaTurkeyThailandIndia
4335353433
2005Mainland ChinaIndiaThailandRussiaTurkey
4538363434
2010Mainland ChinaIndiaRussiaSaudi ArabiaThailand
4839373535
2015Mainland ChinaIndiaRussiaSaudi ArabiaTurkey
4939373535
Final2000RussiaMainland ChinaTurkeySaudi ArabiaGreece
3733322727
2005RussiaMainland ChinaIndiaTurkeySaudi Arabia
3938323130
2010Mainland ChinaRussiaIndiaSaudi ArabiaTurkey
4339353532
2015Mainland ChinaRussiaTurkeySaudi ArabiaIndia
4339363635
Table A6. Out-degree indexes of top 5 BRI countries from 2000 to 2015.
Ranking12345
Intermediate2000Mainland ChinaIndiaRussiaTurkeyUkraine
4642413736
2005Mainland ChinaIndiaRussiaTurkeyUkraine
5144423837
2010Mainland ChinaIndiaRussiaTurkeyUkraine
5647454137
2015Mainland ChinaIndiaRussiaTurkeyGreece
5847454136
Final2000Mainland ChinaIndiaTurkeyThailandTaiwan
5142403532
2005Mainland ChinaIndiaThailandTurkeyGreece
5545434032
2010Mainland ChinaIndiaTurkeyThailandIndonesia
5948474537
2015Mainland ChinaIndiaTurkeyThailandCzech Republic
5949494739
Table A7. Weighted in-degree of top 5 BRI countries from 2000 to 2015 (unit: 1017 J).
Ranking12345
Intermediate2000Mainland ChinaTurkeyGreeceSlovakiaCzech Republic
38.3837.6132.9128.6224.82
2005Mainland ChinaTurkeySlovakiaGreeceCzech Republic
70.4449.4547.6540.1338.51
2010Mainland ChinaTurkeySlovakiaCzech RepublicGreece
130.5060.3158.0646.4036.92
2015Mainland ChinaTurkeySlovakiaCzech RepublicThailand
147.7567.8560.5148.9041.70
Final2000Hong KongRussiaIndiaSingaporeMalaysia
10.112.902.822.542.09
2005Hong KongRussiaIndiaUkraineSingapore
15.454.904.744.363.60
2010Hong KongMainland ChinaIndiaRussiaUkraine
20.046.836.726.545.93
2015Hong KongUkraineMainland ChinaRussiaIndia
20.1910.928.947.607.24
Table A8. Weighted out-degree of top 5 BRI countries from 2000 to 2015 (unit: 1017 J).
Ranking12345
Intermediate2000RussiaMainland ChinaIranSaudi ArabiaUkraine
123.6828.7724.0722.2718.63
2005RussiaMainland ChinaIranSaudi ArabiaIndia
192.5551.4829.7928.620.86
2010RussiaMainland ChinaIranSaudi ArabiaIndia
227.5071.9237.7434.0030.06
2015RussiaMainland ChinaSaudi ArabiaIranIndia
244.7574.1941.7539.2336.29
Final2000Mainland ChinaSingaporeTaiwanIndiaThailand
11.753.292.962.792.31
2005Mainland ChinaIndiaSingaporeTurkmenistanThailand
22.504.444.363.993.50
2010Mainland ChinaIndiaSingaporeThailandTurkmenistan
34.026.846.764.644.30
2015Mainland ChinaTurkmenistanIndiaSingaporeThailand
34.608.838.837.805.60
Table A9. Betweenness index of top 5 BRI countries from 2000 to 2015.
Ranking12345
Intermediate2000Mainland ChinaRussiaTurkeyIndiaGreece
0.150.140.080.0740.052
2005Mainland ChinaRussiaIndiaTurkeyGreece
0.160.110.090.080.061
2010Mainland ChinaRussiaIndiaTurkeyGreece
0.170.100.090.050.048
2015Mainland ChinaRussiaIndiaThailandTurkey
0.190.090.080.060.056
Final2000Mainland ChinaRussiaTurkeyIndiaGreece
0.150.130.100.060.05
2005Mainland ChinaRussiaIndiaTurkeyGreece
0.170.110.070.060.06
2010Mainland ChinaRussiaIndiaTurkeyGreece
0.180.090.070.060.05
2015Mainland ChinaRussiaTurkeyIndiaThailand
0.160.080.070.060.04

References

  1. Tian, X.; Hu, Y.; Yin, H.; Geng, Y.; Bleischwitz, R. Trade impacts of China’s Belt and Road Initiative: From resource and environmental perspectives. Resour. Conserv. Recycl. 2019, 150, 104430. [Google Scholar] [CrossRef]
  2. Zhao, L.; Li, D.; Guo, X.; Xue, J.; Wang, C.; Sun, W. Cooperation risk of oil and gas resources between China and the countries along the Belt and Road. Energy 2021, 227, 120445. [Google Scholar] [CrossRef]
  3. Jackson, K.; Shepotylo, O. Belt and road: The China dream? China Econ. Rev. 2021, 67, 101604. [Google Scholar] [CrossRef]
  4. World Trade Organization Data. 2020. Available online: https://data.wto.org/ (accessed on 1 June 2021).
  5. Zhang, J. Oil and gas trade between China and countries and regions along the ‘Belt and Road’: A panoramic perspective. Energy Policy 2019, 129, 1111–1120. [Google Scholar] [CrossRef]
  6. Zhao, Y.; Liu, X.; Wang, S.; Ge, Y. Energy relations between China and the countries along the Belt and Road: An analysis of the distribution of energy resources and interdependence relationships. Renew. Sustain. Energy Rev. 2019, 107, 133–144. [Google Scholar] [CrossRef]
  7. Wu, X.F.; Chen, G.Q. Global overview of crude oil use: From source to sink through inter-regional trade. Energy Policy 2019, 128, 476–486. [Google Scholar] [CrossRef]
  8. Li, J.S.; Chen, G.Q.; Hayat, T.; Alsaedi, A. Mercury emissions by Beijing׳s fossil energy consumption: Based on environmentally extended input—Output analysis. Renew. Sustain. Energy Rev. 2015, 41, 1167–1175. [Google Scholar] [CrossRef]
  9. Chen, S.; Liu, Z.; Chen, B.; Zhu, F.; Fath, B.D.; Liang, S.; Su, M.; Yang, J. Dynamic Carbon Emission Linkages Across Boundaries. Earth’s Future 2019, 7, 197–209. [Google Scholar] [CrossRef] [Green Version]
  10. Costanza, R. Embodied Energy and Economic Valuation. Science 1980, 210, 1219–1224. [Google Scholar] [CrossRef] [PubMed]
  11. Liu, B.; Wang, D.; Xu, Y.; Liu, C.; Luther, M. Embodied energy consumption of the construction industry and its international trade using multi-regional input—Output analysis. Energy Build. 2018, 173, 489–501. [Google Scholar] [CrossRef]
  12. Chen, B.; Li, J.S.; Wu, X.F.; Han, M.Y.; Zeng, L.; Li, Z.; Chen, G.Q. Global energy flows embodied in international trade: A combination of environmentally extended input–output analysis and complex network analysis. Appl. Energy 2018, 210, 98–107. [Google Scholar] [CrossRef]
  13. Hong, J.; Tang, M.; Wu, Z.; Miao, Z.; Shen, G.Q. The evolution of patterns within embodied energy flows in the Chinese economy: A multi-regional-based complex network approach. Sustain. Cities Soc. 2019, 47, 101500. [Google Scholar] [CrossRef]
  14. Zhang, B.; Qiao, H.; Chen, Z.M.; Chen, B. Growth in embodied energy transfers via China’s domestic trade: Evidence from multi-regional input—Output analysis. Appl. Energy 2016, 184, 1093–1105. [Google Scholar] [CrossRef]
  15. Guo, S.; Zheng, S.; Hu, Y.; Hong, J.; Wu, X.; Tang, M. Embodied energy use in the global construction industry. Appl. Energy 2019, 256, 113838. [Google Scholar] [CrossRef]
  16. Tang, M.; Hong, J.; Liu, G.; Shen, G.Q. Exploring energy flows embodied in China’s economy from the regional and sectoral perspectives via combination of multi-regional input–output analysis and a complex network approach. Energy 2019, 170, 1191–1201. [Google Scholar] [CrossRef]
  17. Sun, X.; Li, J.; Qiao, H.; Zhang, B. Energy implications of China’s regional development: New insights from multi-regional input-output analysis. Appl. Energy 2017, 196, 118–131. [Google Scholar] [CrossRef]
  18. Zhang, L.; Hu, Q.; Fan, Z.; Ben, B.L. Input-Output Modeling for Urban Energy Consumption in Beijing: Dynamics and Comparison. PLoS ONE 2014, 9, e89850. [Google Scholar] [CrossRef] [PubMed] [Green Version]
  19. Guo, S.; Li, Y.; He, P.; Chen, H.; Meng, J. Embodied energy use of China’s megacities: A comparative study of Beijing and Shanghai. Energy Policy 2021, 155, 112243. [Google Scholar] [CrossRef]
  20. Han, Y.M.; Xiong, J.; Liu, W.D. China’s cross-border energy relations between direct trade and embodied transfers: Based on “the Belt and Road” energy cooperation. J. Nat. Resour. 2020, 35, 2674–2686. [Google Scholar]
  21. Zhang, Y.; Zhang, J.-H.; Tian, Q.; Liu, Z.-H.; Zhang, H.-L. Virtual water trade of agricultural products: A new perspective to explore the Belt and Road. Sci. Total Environ. 2018, 622, 988–996. [Google Scholar] [CrossRef]
  22. Lu, Q.L.; Fang, K.; Heijungs, R.; Feng, K.S.; Li, J.S.; Wen, Q.; Li, Y.M.; Huang, X.J. Imbalance and drivers of carbon emissions embodied in trade along the Belt and Road Initiative. Appl. Energy 2020, 280, 12. [Google Scholar] [CrossRef]
  23. Han, M.; Lao, J.; Yao, Q.; Zhang, B.; Meng, J. Carbon inequality and economic development across the Belt and Road regions. J. Environ. Manag. 2020, 262, 110250. [Google Scholar] [CrossRef]
  24. Cuiyun, C.; Chazhong, G. Green development assessment for countries along the belt and road. J. Environ. Manag. 2020, 263, 110344. [Google Scholar] [CrossRef] [PubMed]
  25. Wu, X.F.; Chen, G.Q. Global primary energy use associated with production, consumption and international trade. Energy Policy 2017, 111, 85–94. [Google Scholar] [CrossRef]
  26. Wu, X.D.; Guo, J.L.; Li, C.; Chen, G.Q.; Ji, X. Carbon emissions embodied in the global supply chain: Intermediate and final trade imbalances. Sci. Total Environ. 2020, 707, 134670. [Google Scholar] [CrossRef] [PubMed]
  27. Wu, X.D.; Guo, J.L.; Li, C.H.; Shao, L.; Han, M.Y.; Chen, G.Q. Global socio-hydrology: An overview of virtual water use by the world economy from source of exploitation to sink of final consumption. J. Hydrol. 2019, 573, 794–810. [Google Scholar] [CrossRef]
  28. Fang, K.; Wang, S.; He, J.; Song, J.; Fang, C.; Jia, X. Mapping the environmental footprints of nations partnering the Belt and Road Initiative. Resour. Conserv. Recycl. 2021, 164, 105068. [Google Scholar] [CrossRef]
  29. Johnson, R.C.; Noguera, G. Accounting for intermediates: Production sharing and trade in value added. J. Int. Econ. 2012, 86, 224–236. [Google Scholar] [CrossRef] [Green Version]
  30. Zhao, Y.; Liu, Y.; Qiao, X.; Wang, S.; Zhang, Z.; Zhang, Y.; Li, H. Tracing value added in gross exports of China: Comparison with the USA, Japan, Korea, and India based on generalized LMDI. China Econ. Rev. 2018, 49, 24–44. [Google Scholar] [CrossRef]
  31. Dai, F.; Yang, J.; Guo, H.; Sun, H. Tracing CO2 emissions in China-US trade: A global value chain perspective. Sci. Total Environ. 2021, 775, 145701. [Google Scholar] [CrossRef]
  32. Wei, W.; Hao, S.; Yao, M.; Chen, W.; Wang, S.; Wang, Z.; Wang, Y.; Zhang, P. Unbalanced economic benefits and the electricity-related carbon emissions embodied in China’s interprovincial trade. J. Environ. Manag. 2020, 263, 110390. [Google Scholar] [CrossRef]
  33. Cassi, L.; Morrison, A.; Ter Wal, A.L.J. The Evolution of Trade and Scientific Collaboration Networks in the Global Wine Sector: A Longitudinal Study Using Network Analysis. Econ. Geogr. 2012, 88, 311–334. [Google Scholar] [CrossRef]
  34. Ermann, L.; Shepelyansky, D.L. Google matrix analysis of the multiproduct world trade network. Eur. Phys. J. B 2015, 88, 84. [Google Scholar] [CrossRef] [Green Version]
  35. Chong, Z.; Qin, C.; Pan, S. The Evolution of the Belt and Road Trade Network and Its Determinant Factors. Emerg. Mark. Financ. Trade 2019, 55, 3166–3177. [Google Scholar] [CrossRef]
  36. Li, Y.; Li, Y.; Pan, A.; Pan, X.; Veglianti, E. The Network Structure Characteristics and Determinants of the Belt & Road Industrial Robot Trade. Emerg. Mark. Financ. Trade 2021, 57, 1–11. [Google Scholar]
  37. Li, Y.L.; Chen, B.; Chen, G.Q. Carbon network embodied in international trade: Global structural evolution and its policy implications. Energy Policy 2020, 139, 111316. [Google Scholar] [CrossRef]
  38. Li, J.; Dong, X.; Jiang, Q.; Dong, K.; Liu, G. Natural gas trade network of countries and regions along the belt and road: Where to go in the future? Resour. Policy 2021, 71, 101981. [Google Scholar] [CrossRef]
  39. Feng, L.; Xu, H.; Wu, G.; Zhao, Y.; Xu, J. Exploring the structure and influence factors of trade competitive advantage network along the Belt and Road. Phys. A Stat. Mech. Appl. 2020, 559, 125057. [Google Scholar] [CrossRef]
  40. Zhang, C.; Fu, J.; Pu, Z. A study of the petroleum trade network of countries along “The Belt and Road Initiative”. J. Clean. Prod. 2019, 222, 593–605. [Google Scholar] [CrossRef]
  41. Wu, G.; Pu, Y.; Shu, T. Features and Evolution of Global Energy Trade Network Based on Domestic Value-Added Decomposition of Export. Energy 2021, 228, 120486. [Google Scholar] [CrossRef]
  42. Lv, K.; Feng, X.; Kelly, S.; Zhu, L.; Deng, M. A study on embodied carbon transfer at the provincial level of China from a social network perspective. J. Clean. Prod. 2019, 225, 1089–1104. [Google Scholar] [CrossRef]
  43. Fair, C.O.I. List and Overview of 65 Countries and Regions Along the Belt and Road. 2017. Available online: http://www.codafair.org/index.php?m=content&c=index&a=show&catid=113&id=1203 (accessed on 1 June 2021). (In Chinese).
  44. Chen, G.Q.; Wu, X.D.; Guo, J.; Meng, J.; Li, C. Global overview for energy use of the world economy: Household-consumption-based accounting based on the world input-output database (WIOD). Energy Econ. 2019, 81, 835–847. [Google Scholar] [CrossRef]
  45. Lenzen, M.; Moran, D.; Kanemoto, K.; Geschke, A. Building eora: A global multi-region input–output database at high country and sector resolution. Econ. Syst. Res. 2013, 25, 20–49. [Google Scholar] [CrossRef]
  46. International Monetary Fund (IMF). Available online: http://data.imf.org/?sk=29e74e46-0824-427f-bbde-af108686157f&sId=1390030109571 (accessed on 2 June 2021).
  47. International Energy Agency (IEA). Available online: https://www.iea.org/ (accessed on 1 May 2021).
  48. Cui, L.-B.; Peng, P.; Zhu, L. Embodied energy, export policy adjustment and China’s sustainable development: A multi-regional input-output analysis. Energy 2015, 82, 457–467. [Google Scholar] [CrossRef]
  49. Bullard, C.W.; Herendeen, R.A. The energy cost of goods and services. Energy Policy 1975, 3, 268–278. [Google Scholar] [CrossRef]
  50. Chen, Z.-M.; Chen, G.Q. Demand-driven energy requirement of world economy 2007: A multi-region input–output network simulation. Commun. Nonlinear Sci. Numer. Simul. 2013, 18, 1757–1774. [Google Scholar] [CrossRef]
  51. Watts, D.J.; Strogatz, S.H. Collective dynamics of ‘small-world’ networks. Nature 1998, 393, 440–442. [Google Scholar] [CrossRef]
  52. Newman, M.E.J. Scientific collaboration networks. II. Shortest paths, weighted networks, and centrality. Phys. Rev. E Statal Nonlinear Soft Matter Phys. 2001, 64, 016132. [Google Scholar] [CrossRef] [PubMed] [Green Version]
  53. Newman, M.E.J. Analysis of weighted networks. Phys. Rev. E 2004, 70, 056131. [Google Scholar] [CrossRef] [PubMed] [Green Version]
  54. Freeman, L.C. Centrality in social networks conceptual clarification. Soc. Netw. 1978, 1, 215–239. [Google Scholar] [CrossRef] [Green Version]
  55. Cranmer, S.J.; Leifeld, P.; McClurg, S.D.; Rolfe, M. Navigating the Range of Statistical Tools for Inferential Network Analysis. Am. J. Political Sci. 2017, 61, 237–251. [Google Scholar] [CrossRef] [Green Version]
  56. Xu, H.; Cheng, L. The QAP weighted network analysis method and its application in international services trade. Phys. A Stat. Mech. Appl. 2016, 448, 91–101. [Google Scholar] [CrossRef]
  57. Bergstrand, J.H. The Gravity Equation in International Trade: Some Microeconomic Foundations and Empirical Evidence. Rev. Econ. Stat. 1985, 67, 474–481. [Google Scholar] [CrossRef]
  58. Chaney, T. The Network Structure of International Trade. Am. Econ. Rev. 2014, 104, 3600–3634. [Google Scholar] [CrossRef] [Green Version]
  59. Borchert, I.; Yotov, Y.V. Distance, globalization, and international trade. Econ. Lett. 2017, 153, 32–38. [Google Scholar] [CrossRef] [Green Version]
  60. Wang, Y.; Sheng, D. Social trust and export comparative advantage: An empirical investigation based on IVTSLS and PSM method. J. Int. Trade 2010, 10, 64–71. [Google Scholar]
  61. Jing, S.; Zhihui, L.; Jinhua, C.; Zhiyao, S. China’s renewable energy trade potential in the “Belt-and-Road” countries: A gravity model analysis. Renew. Energy 2020, 161, 1025–1035. [Google Scholar] [CrossRef]
  62. Deeparghya, M. Services traded for intermediate and final usage: An analysis of the role of services FTAs and restrictions. J. Econ. Stud. 2018, 45, 459–497. [Google Scholar]
  63. Joyeux, R.; Ripple, R.D. Household energy consumption versus income and relative standard of living: A panel approach. Energy Policy 2007, 35, 50–60. [Google Scholar] [CrossRef]
  64. Liu, W.; Dunford, M. Inclusive Globalization: Unpacking China’s Belt and Road Initiative. Area Dev. Policy 2016, 1, 323–340. [Google Scholar] [CrossRef]
  65. Meo, P.D.; Ferrara, E.; Fiumara, G.; Provetti, A.; Flickr, O.C.; Zhang, Y.; Wang, J.; Wang, Y.; Zhou, L.; Kaza, S. Fast unfolding of communities in large networks. J. Stat. Mech. Theory Exp. 2008, 2008, 10008. [Google Scholar]
  66. Yang, Y.; Poon, J.P.H.; Liu, Y.; Bagchi-Sen, S. Small and flat worlds: A complex network analysis of international trade in crude oil. Energy 2015, 93, 534–543. [Google Scholar] [CrossRef]
  67. Zhang, H.; Wang, Y.; Yang, C.; Guo, Y. The impact of country risk on energy trade patterns based on complex network and panel regression analyses. Energy 2021, 222, 119979. [Google Scholar] [CrossRef]
  68. Guo, S.; Shen, G.; Yang, J.; Sun, B.; Xue, F. Embodied energy of service trading in Hong Kong. Smart Sustain. Built Environ. 2015, 4, 234–248. [Google Scholar] [CrossRef] [Green Version]
  69. Liu, A.; Lu, C.; Wang, Z. The roles of cultural and institutional distance in international trade: Evidence from China’s trade with the Belt and Road countries. China Econ. Rev. 2020, 61, 101234. [Google Scholar] [CrossRef]
  70. Qi, S.-Z.; Peng, H.-R.; Zhang, Y.-J. Energy intensity convergence in Belt and Road Initiative (BRI) countries: What role does China-BRI trade play? J. Clean. Prod. 2019, 239, 118022. [Google Scholar] [CrossRef]
  71. Moran, D.; Wood, R. Convergence between the EORA, WIOD, EXIOBASE, and Openeu’s consumption-based carbon accounts. Econ. Syst. Res. 2014, 26, 245–261. [Google Scholar] [CrossRef]
  72. Li, X.; Zhou, W.; Hou, J. Research on the impact of OFDI on the home country’s global value chain upgrading. Int. Rev. Financ. Anal. 2021, 77, 101862. [Google Scholar] [CrossRef]
  73. Grodzicki, M.J.; Skrzypek, J. Cost-competitiveness and structural change in value chains—Vertically-integrated analysis of the European automotive sector. Struct. Chang. Econ. Dyn. 2020, 55, 276–287. [Google Scholar] [CrossRef]
  74. Koopman, R.; Wang, Z.; Wei, S.-J. Tracing Value-Added and Double Counting in Gross Exports. Am. Econ. Rev. 2014, 104, 459–494. [Google Scholar] [CrossRef] [Green Version]
  75. Usubiaga-Liaño, A.; Arto, I.; Acosta-Fernández, J. Double accounting in energy footprint and related assessments: How common is it and what are the consequences? Energy 2021, 222, 119891. [Google Scholar] [CrossRef]
  76. Kim, T.-J.; Tromp, N. Analysis of carbon emissions embodied in South Korea’s international trade: Production-based and consumption-based perspectives. J. Clean. Prod. 2021, 320, 128839. [Google Scholar] [CrossRef]
  77. Wu, X.; Guo, J.; Chen, G.; Wu, X.; Meng, J.; Alhodaly, M.; Wakeel, M. Energy use flows in the supply chains of the world economy: A full account of both primary and intermediate inputs. J. Clean. Prod. 2021, 320, 128621. [Google Scholar] [CrossRef]
Figure 1. The evolution of energy flows embodied in the BRI’s intermediate trade from 2000 to 2015 (main BRI countries with large embodied energy trade flows are noted in different colors).
Sustainability 13 10530 g001
Figure 2. The evolution of energy flows embodied in the BRI’s final trade from 2000 to 2015 (main BRI countries with large embodied energy trade flows are noted in different colors).
Sustainability 13 10530 g002
Figure 3. The industrial import and export structure of energy embodied in the BRI intermediate trade.
Sustainability 13 10530 g003
Figure 4. The industrial import and export structure of energy embodied in the BRI final trade.
Sustainability 13 10530 g004
Figure 5. Network characteristics of intermediate and final trade of the BRI in terms of (a) average degree; (b) average weighted degree, and (c) small-world quotients. (Detailed data are provided in Table A4).
Sustainability 13 10530 g005
Figure 6. The community structure of the BRI’s final energy trade network from 2000 to 2015 (countries colored in red, blue, and grey belong to communities C1, C2, and C3 respectively. The width of each edge captures the value of trade flows between two trading countries and the node size represents the total trade volume of each country. The number of nodes in 2000, 2005, 2010, and 2015 is 65, 66, 67, and 68, respectively. The number of edges in 2000, 2005, 2010, and 2015 is 785, 887, 985, and 1050, respectively).
Sustainability 13 10530 g006
Figure 7. The community structure of the BRI’s intermediate energy trade network from 2000 to 2015 (countries colored in red, blue, grey, and orange are assigned to communities C1, C2, C3, and C4, respectively. The width of each edge captures the value of trade flows between two trading countries and the node size represents the total trade volume of each country. The number of nodes in 2000, 2005, 2010, and 2015 is 65, 66, 69, and 68, respectively. The number of edges in 2000, 2005, 2010, and 2015 is 859, 919, 978 and 993, respectively).
Sustainability 13 10530 g007
Table 1. Specifications and formulas of the indexes measuring the BRI’s embodied energy trade network features.
IndexesFormulaSpecifications
Macro-level indexesAverage degree K ¯ = 1 n i = 1 n k i = 1 n i j a i j It indicates the average amount of trade relations each country has. n is the number of countries in the BRI trade network of embodied energy, k i is the degree of country i, and a i j is the number of trade links between country i and j.
Average weighted degree S ¯ = 1 n i = 1 n w i = 1 n i j w i j It indicates the country’s average trade relations by trade volume. w i is the weighted degree of country i, and w i j is the weight of edge between country i and j, representing their trade relations weighted by embodied energy trade volume.
Clustering coefficient C = 1 n i = 1 n 2 E i k i ( k i 1 ) It represents the average clustering coefficient of the countries, denoting the probability that any two neighbors of a country are also connected with each other [51]. E i is the actual number of connections among the neighbors of country i.
Characteristic path length L = 1 n ( n 1 ) i j d i j It describes the average topological distance for any two
countries to trade with energy [52]. d i j = min ( a i r + + a r j ) , reflecting the minimum number of edges in all paths from country i to j.
Small-world quotient S W Q = C L L r a n d o m C r a n d o m It measures the network’s small-world nature, in which most countries have no direct trade relationship with each other, but they can establish trade links through a small number of steps. A network presents a small-world nature when its SWQ is greater than 1. C r a n d o m = k ¯ / n and L r a n d o m = ln ( n ) / ln ( k ¯ ) are the clustering coefficient and characteristic path length in random network, respectively.
Meso-level indexesNewman’s modularity Q = 1 i j w i j i j ( w i j j = 1 n w j i j = 1 n w i j i j w i j ) δ ( c i , c j ) It measures the quality of community partitions, by comparing the density of trade links inside communities with links between communities [53]. c i is the community to which country i is assigned, and δ ( c i , c j ) = 1 c i = c j 0 c i c j .
Micro-level indexesDegree
(In- and Out degree)
K i i n = j = 1 n a j i ;
K i o u t = j = 1 n a i j
It is the number of direct linkages that country i has with other countries. In a directed network, node degree can be further divided into in-degree and out-degree, which indicates the number of countries that a country imports from and exports to in this network.
Strength
(In- and Out-strength)
S i i n = j = 1 n w j i ;
S i o u t = j = 1 n w i j
It is the weighted version of node degree. In a directed network, in-strength and out-strength represent the total volume of embodied energy a country importing from and exporting to in the energy trade network, respectively.
Betweenness centrality B C i = 2 j k g j k ( i ) / g j k n 2 3 n + 2 It is the degree to which a country is located in the “center” of other countries to reflect the ability of one country to control embodied energy trade relationships. The larger value indicates country i leverages a greater impact on the network. g j k is the number of shortcuts between country j and k, and g j k ( i ) is the number of shortest paths between country j and country k through country i [54].
Table 2. Results of QAP correlation analysis of the matrix T and the impact factors for intermediate trade.
Year2000200520102015
Diff_distance−0.203 ***−0.190 ***−0.180 ***−0.178 ***
Binary_land0.336 ***0.333 ***0.338 ***0.335 ***
Binary_culture0.132 ***0.122 ***0.120 ***0.115 ***
Diff_GDP0.195 ***0.293 ***0.324 ***0.314 ***
Diff_industry structure−0.0090.0240.032−0.001
Diff_energy intensity0.077 *0.087 *0.004−0.001
Diff_population0.207 ***0.257 ***0.280 ***0.296 ***
Notes: * Significance at 10% level. ** Significance at 5% level; *** Significance at 1% level.
Table 3. Results of QAP correlation analysis of the matrix T and the impact factors for final trade.
Year2000200520102015
Diff_distance−0.190 ***−0.173 ***−0.161 ***−0.170 ***
Binary_land0.353 ***0.340 ***0.334 ***0.339 ***
Binary_culture0.107 ***0.101 ***0.097 ***0.097 ***
Diff_GDP0.352 ***0.422 ***0.442 ***0.444 ***
Diff_industry structure0.0440.071 *0.091 *0.030
Diff_energy intensity0.0240.045−0.035−0.033
Diff_population0.348 ***0.390 ***0.404 ***0.407 ***
Notes: * Significance at 10% level. ** Significance at 5% level; *** Significance at 1% level.
Table 4. Results of QAP regression analysis of the matrix T and the impact factors for intermediate trade.
Year2000200520102015
Diff_distance−0.112 ***−0.106 ***−0.108 ***−0.105 ***
Binary_land0.277 ***0.264 ***0.265 ***0.267 ***
Binary_culture0.056 ***0.049 ***0.044 ***0.038 **
Diff_GDP0.0480.212 ***0.257 ***0.189 **
Diff_industry structure−0.021−0.010−0.018−0.029
Diff_energy intensity0.082 **0.094 **0.0170.013
Diff_population0.157 **0.074 *0.0590.137 **
Adj-R20.1700.2020.2130.212
Notes: * Significance at 10% level. ** Significance at 5% level; *** Significance at 1% level.
Table 5. Results of QAP regression analysis of the matrix T and the impact factors for final trade.
Year2000200520102015
Diff_distance−0.121 ***−0.110 ***−0.113 ***−0.117 ***
Binary_land0.281 ***0.262 ***0.254 ***0.256 ***
Binary_culture0.026 *0.025 *0.0200.016
Diff_GDP0.168 ***0.264 ***0.296 ***0.305 ***
Diff_industry structure0.0050.0160.012−0.025
Diff_energy intensity0.0340.056 *−0.013−0.014
Diff_population0.192 ***0.159 **0.145 **0.156 **
Adj-R20.2510.2870.2950.306
Notes: * Significance at 10% level. ** Significance at 5% level; *** Significance at 1% level.
Publisher’s Note: MDPI stays neutral with regard to jurisdictional claims in published maps and institutional affiliations.

