Article

A Quantitative GIS and AHP Based Analysis for Geodiversity Assessment and Mapping

1
Department of Earth, Environment and Life Sciences, University of Genoa, Europa 26, 16132 Genoa, Italy
2
Institute of Hydrogeological Research and Conservation (CNR-IRPI), National Research Council, Rue Du Hunte 73, 10135 Turin, Italy
3
Department of Chemistry and Geological Sciences, University of Modena and Reggio Emilia, Via Campi 103, 41125 Modena, Italy
*
Author to whom correspondence should be addressed.
Sustainability 2021, 13(18), 10376; https://doi.org/10.3390/su131810376
Submission received: 25 August 2021 / Revised: 13 September 2021 / Accepted: 14 September 2021 / Published: 17 September 2021

Abstract

:
In recent times, the issues of geodiversity assessment and mapping have been subject of great attention, and many evaluation methodologies, either quantitative or qualitative, have been developed. In this research, a first assessment of geodiversity in the Liguria region has been carried out, according to a quantitative method based on spatial analysis techniques implemented in a GIS environment. This method considers four diversity indices obtained by grid analysis, relevant to the four main aspects of geodiversity: geology, geomorphology, hydrogeology and pedology. The geodiversity index was calculated two times, first with a non-weighted sum, then with a weighted sum of the four diversity indices. In the second case, the weights have been assigned according to a semi-quantitative analytical hierarchy process method (AHP) based on experts’ judgment. The results show that the Liguria region is characterized by many areas with high geodiversity, most of them internationally known by geoscientists and tourists for their valuable geoheritage and for their stunning landscapes. The correspondence between these areas and the protected areas of the european Natura 2000 network suggests a link between geodiversity and biodiversity.

1. Introduction

The word “geodiversity” was coined in the 1990s (e.g., [1,2]) and has been rapidly accepted by geoscientists, even if this term has frequently been used rather loosely. There are several definitions to geodiversity (e.g., [2,3,4,5,6,7,8,9]), but the most widely used is “the natural range (diversity) of geological (rocks, minerals, fossils), geomorphological (landforms, processes) and soil features. It includes their assemblages, relationships, properties, interpretation and systems” [10].
Despite a widespread use of the geodiversity concept in the scientific literature, only during the last decades have geoscientists addressed the issues of its assessment and mapping (see [11] and references therein). Geodiversity assessment methods must face the same challenges and key issues as those relevant for geosites assessment, namely: subjectivity, scale, scope and methodology.
Numerous assessment methods have been developed through the years for the assessment of geodiversity, starting from the 2000s. Referring to the data source, direct and indirect methods can be distinguished [12]. In the direct methods, the diversity assessment is based primarily on field work. Indirect methods are based on calculations on numerical cartography, generally within a GIS environment; they are by far the most common, because the data acquisition is easier and considerably less expensive.
Considering the assessment procedures, one can distinguish qualitative and quantitative assessment methods. Qualitative methods (e.g., [8,13,14,15,16,17,18,19]) are based on the knowledge and sensibility of an expert or a group of experts, and because of this are characterized by a high degree of subjectivity. Quantitative methods (e.g., [20,21,22,23,24,25,26,27,28,29]) calculate geodiversity by means of simple algorithms; the repeatability of the results and the relatively high objectivity make these methods highly preferred [30]. Even quantitative methods have their limitations: the choice of criteria and parameters is still subjective, and the quality or absence of the input data affects the entire calculation [11]. Some authors propose hybrid qualitative–quantitative methods (e.g., [31,32]), that rely on the qualitative assessment on some of the chosen criteria, or on the qualitative weighting of the parameters involved in the quantitative calculation.
Geodiversity assessment and mapping have been mainly implemented for regional scale studies and can play a crucial role in different contexts: geoparks and geoheritage characterization [33,34], hazard evaluation and prevention [35,36], nature conservation and management in a holistic way [25,28,37] and territorial management planning [21,38,39]. Particular importance is addressed by land use planning as it implies both the conservation and valorization issues, preserving the eventual destruction or obliteration of geoheritage.
In this context, the main aim of this research is to present a quantitative GIS-based method of geodiversity assessment. This methodology is based on the concept of “diversity indices”, first proposed by [24]. Diversity indices express the variety of a given parameter in a certain area, usually a cell of a regular grid in an objective way, thus overwhelming the weakness of subjectivity. In this paper, four diversity indices were considered: geological, geomorphological, hydrogeological and soil–landscape diversity. Their combination gives the synthetic geodiversity index (GI).
The calculation has been performed by assigning different weights to the four indexes, applying the semi-quantitative analytic hierarchy process (AHP) method. AHP was developed in the ‘70s by Saaty [40,41] as a multicriteria decision support method, aimed at gaining a global assessment by comparing several heterogeneous factors, and is largely used in earth sciences.
The method was tested in the Liguria Region, which is famous for the scenery and variety of the physical landscape as well as for the contrast between the coastal environment and the close mountainous one. The methodology could be a useful tool for nature conservation and management in the framework of territorial management planning.

2. Landscapes and Landforms of Liguria

Liguria is a coastal region of 5400 km2 located in northwestern Italy with about 1.5 million inhabitants (Figure 1). To the south it is bordered by the Ligurian Sea, to the west by Provence-Alpes-Côte d’Azur (France), to the north by Piedmont and Emilia Romagna and to the southeast by Tuscany. It is part of the Alps–Mediterranean Euroregion.
The region is included between the Ligurian Alps and Ligurian Apennines, which form a continuous mountainous chain developed according to two axes: SW/NE and NW/SE, meeting a few kilometers west of Genoa city. The ridge of the Ligurian Alps and Apennines separates the maritime river basins, flowing in the Ligurian Sea in the south, from the ones contributing to the Po river in the north.
Liguria belongs to the Italian Ligurian and Tyrrenian climatic region; with reference to Koppen’s classification [42] the coastal strip presents a hot temperate climate (Csa), the southern slopes of the Alpine and Apennine chain show a sub-coastal temperate climate (Cs), while the Po valley slopes show a sub-continental temperate climate (Cf). The areas with an altitude above 1000 m present a cool temperate climate (Cf).
The geological structure of Liguria is complex, not only for the presence of the Alpine and Apennine chains, but also for the variety of rock masses, the tectonic history and the neotectonic imprint that characterizes most of the Ligurian landscape, both coastal and hill mountainous.
The geological structure of Liguria is complex: the presence of the Alpine and Apennine chains, the variety of rock masses, the tectonic history and the neotectonic imprint characterize most of the Ligurian landscape that develops between the mountains and the sea.
From the tectonic point of view, three main units can be distinguished, referring to three paleogeographic domains: Paleo-European (roughly the western sector), Piedmont–Ligurian Ocean (central and eastern part) and Adria (extreme eastern sector). The framework of lithotypes is quite varied and includes sedimentary, metamorphic, magmatic and upper mantle rock masses, as well as various types of Plio-Quaternary covers [43].
The marly-limestone flysch characterizes a good part of the region, either in the western part (between Sanremo and Imperia, including the inner part up to Piedmont) or in the central eastern part (between Genoa and Chiavari, including the inner part up to the border with the provinces of Alessandria, Piacenza and Parma). Sandy and silty flysch outcrops in the coast and in the inland between Ventimiglia and Bordighera, in the east coast between Sestri Levante and La Spezia, and in the Bormida valleys [43].
Calcareous and dolomitic rocks are found on the French border, in the western sector of the province of Savona, along the Sestri Ponente–Voltaggio line, in the Graveglia and Vara Valleys, along the Promontory of La Spezia and Montemarcello-Magra. The limestone plate of Finale Ligure deserves a particular mention, characterized by bioclastic limestone rich in fossils [44].
Ophiolitic rocks, including peridotites, serpentinites, gabbros, basalts, breccias and ophicalcites characterize both the central part of the region, between Sestri Ponente and Varazze, and the central eastern part, between Levanto and M. Maggiorasca. Calceschists and micascists discontinuously characterize the region between Genoa and the province of Savona. Orthogneiss and amphibolites characterize the coastal stretch and the immediate interland between Albisola and Savona, while cherts outcrop discontinuously associated with ophiolites between Monte Zatta and Levanto. Quartzites can be considered the metamorphic equivalent and are found associated with metaophiolites and calceschists in the Beigua massif or associated with dolomites in the west of Savona [43].
Conglomerates characterize the landscape of the Portofino Promontory, the upper Scrivia Valley and Celle Ligure coastal area. Finally, stiff fissured clays and shales are discontinuously observed along the coastal strip between Genoa and Ventimiglia, along the western promontory of La Spezia and in the upper Val Bormida on the border with Piedmont [43].
As mentioned above, neotectonic modeling influences the Ligurian landscape at all scales [45]: the coastline and the hydrographic network are set on Plio-Quaternary distensive lineations. Many anomalies of the hydrographic network suggest recent river captures and repeated shifts of the watershed, including the main one: the Tyrrhenian hydrographic network presents short water courses and high gradient slopes, while the Po Valley hydrographic network one shows a gentler profile and frequent embedded meander patterns. Moreover, the base level drop related to the neotectonic activity is responsible for the reactivation of the intense erosional processes [46].
Then, in addition to endogenous landforms due to the geological and tectonic structure, the landscape shows landforms due to gravity, fluvial and running waters, karst phenomena, coastal, periglacial and anthropic processes (Figure 2). Some gravity processes, due to their size and closeness to the urban area, have a strong influence on the landscape and represent a possible source of hazard; it is the case of the large relict landslide dam that is located close to the Genoa city [47].
Most of the historical settlements on the Ligurian inland insist on large scale relict landslides, often reactivated with slow kinematics [48]: the choice of settlement must be considered related to the low acclivity of the landslide body, the presence of workable soil for agricultural purposes and the presence of groundwater. The intense and short rainfall events often trigger shallow landslides and mud-debris flows, which, despite their small dimension, may have a highly damaging result.
The Ligurian Tyrrhenian floodplains are small and almost entirely urbanized, with the exception of the interregional Magra floodplain, the Centa floodplain in Albenga and the Entella floodplain in Chiavari-Lavagna. The floodplains sealing results in a high flood risk and flash flood [49,50,51].
Consequently, the rocky Ligurian coast is characterized by a high rocky cliff, active and receding, with frequent pebbly pocket beaches [52]. The mentioned fluvial–coastal plains are mainly gravelly-sandy.
With 6% of the territory characterized by limestone and dolomite, Liguria has widespread karst phenomena, both shallow and hypogean [53]; about 1500 caves are registered in the land cadastre [54].
Finally, it is worth mentioning the anthropic impact on the landscape and landforms, practically extended over the entire surface: among the various man-made landforms, the most widespread, ancient and certainly significant in terms of landscape is represented by terracing with dry stone walls, now largely abandoned [55].
In consideration of the extraordinary ecological and environmental variety, a system of parks and protected areas have been established covering almost 12% of the territory, for a surface of 60,000 ha. The parks are often connected by a network of trails: the most important of these itineraries is the “Alta Via dei Monti Liguri”, which crosses the region for 400 km, almost entirely following the Ligurian–Padanian watershed.
The Ligurian parks have one of the most significant, often exclusive, aspects of the territory in the Earth sciences. Beigua Global Geopark presents ophiolites with Alpine metamorphic imprint representing a fragment of a Jurassic ocean basin [56]; Aveto Park includes ophiolites with low metamorphic degree and sedimentary covers, with important mining complexes converted into Mining Museums [57,58]; Antola Park presents Helmintoid flysch and characteristic conglomeratic massifs [43]; Portofino Park also shows Helmintoid flysch and high cliffs shaped in the conglomerates [59]; Portovenere Park is characterized by calcareous and dolomitic rocks, interested by historical mining activities [60]; the Park of Monte-Marcello-Magra-Vara presents interesting karst areas shaped in the limestone massifs [53]; the Park of the Ligurian Alps concerns the Helmintoid flysch of western Liguria and the limestones of the Paleo-European Domain [50]; the Park of Piana Crixia owes its institution to the characteristic ‘rock mushroom’ formed by selective erosion of conglomerates; the protected area of Bric Tana is affected by karst phenomena in conglomerates and sandstones [48]; the National Park of the Cinque Terre presents arenaceous and argillite flysch and above all the stunning landscape made by terraced and dry-stone walls [61].

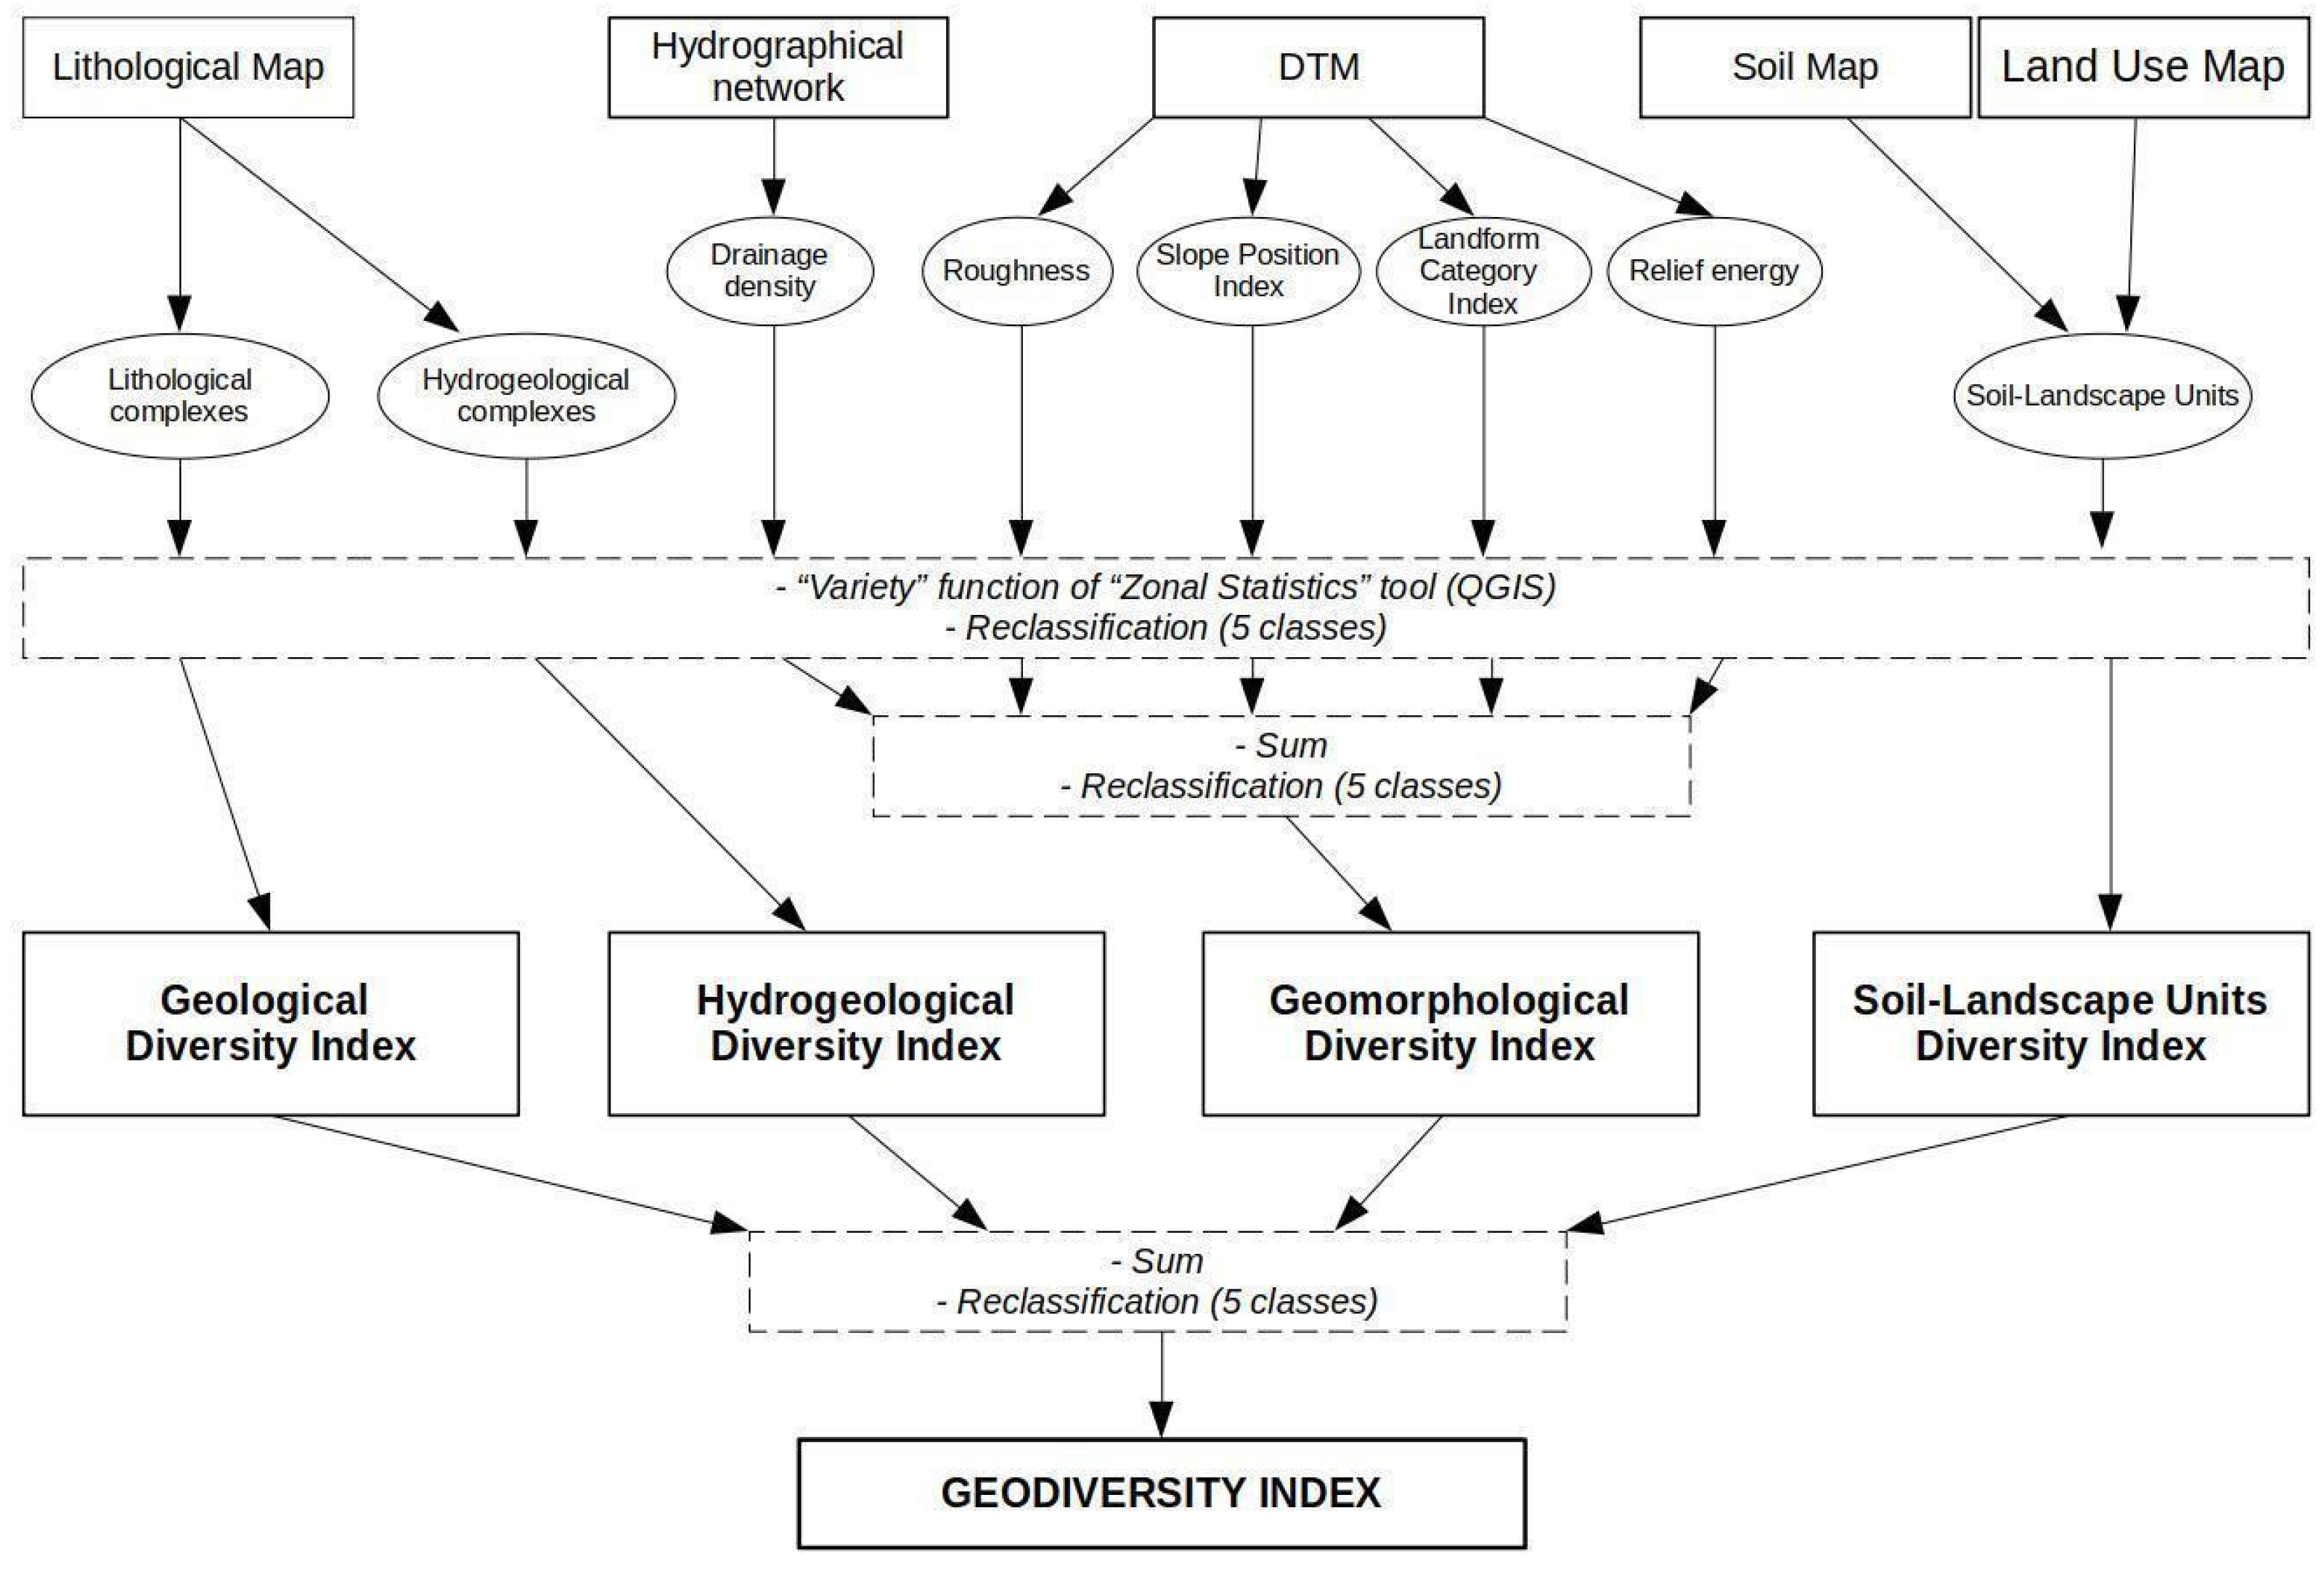
3. Materials and Methods

Geodiversity assessment remains an open issue, since the very concept of geodiversity has been introduced in recent times and still lacks a definite agreement on its meaning. Over the last few years, numerous geodiversity assessment methods have been proposed, which can be grouped into various sets depending on the data source and the procedure (see [11] and references therein).
Quantitative methods are by far the most common because they allow for a result through relatively simple algorithms; among them, the most popular methodologies are based on the calculation of the geodiversity index, originally proposed by Serrano and Ruiz-Flaňo [9] as:
GI = Eg * R/lnS
where: GI = geodiversity index; Eg = number of different physical elements in a unit of surface; R = roughness coefficient; lnS = natural logarithm of the surface unit. The original formula was then modified in subsequent works by various authors (e.g., [25,31,38,39]), in order to adapt it to different morphological and geological situations.
The methodology used in this research for the geodiversity index assessment is based on the quantitative method first proposed by Pereira et al. [24] and then implemented and modified by various authors (e.g., [62,63,64,65]). This methodology consists in the calculation of several thematic diversity indices: each index is computed by overlaying a grid on a thematic geologic map and calculating the diversity of the parameter represented in the map for every cell. The final geodiversity index (GI) is the sum of the considered diversity indices.
The method is user-friendly and automated in order to be applicable within different geological and geomorphological contexts, to reduce subjectivity and to be suitable for comparative studies.
In the present study, four diversity indices were considered, corresponding to the main components of geodiversity: geology, geomorphology, hydrogeology and pedology.
The calculation steps were carried out in a GIS environment, using the free softwares QGIS, GRASS and SAGA GIS. Taking into account several parameters whose details are provided in Section 3.1, four main raster maps were produced, storing the geological, geomorphological, hydrogeological and pedological information.
To calculate the diversity index, each thematic raster map was overlaid by a grid. For each grid cell, the diversity of the parameter was computed with the “variety” function of the “zonal statistics” processing tool in QGIS.
A grid size of 500 × 500 m was determined by a trial-and-error procedure, which considered the resolution of the input data. The input map with the lowest scale (i.e., the soil landscape unit map, for which see below) represents a sort of threshold: using smaller cells the “variety” function could not work properly and would give inconsistent results. On the contrary, considering the small extension of the study area (5400 km2), a bigger grid size doesn’t represent an acceptable detail.
The results of the “variety” function were reclassified on a 1-to-5 scale to make them comparable and let them assume the same weight on the final sum. In this scale, 1 = very low diversity, 2 = low diversity, 3 = average diversity, 4 = high diversity and 5 = very high diversity. The 1-to-5 scale was chosen because it is an effective way to group areas with comparable characteristics in terms of diversity. Less classes result in a coarse index that doesn’t properly highlight the spatial variability. More classes cause the opposite problem. The 1-to-5 scale is commonly used in geodiversity calculations (see [11] and references therein).
The reclassification was carried out by means of Jenks’ natural breaks classification method [66], which disposes the best arrangement of values into different classes. Jenks’ algorithm classifies the data according to their distribution, minimizing the variance within classes and maximizing the variance between classes.
The final result of these methodological steps are the four diversity indices, each one varying from 1 to 5. The geodiversity index is then obtained with the equation:
GI = Geoi + Morphi + Hydroi + SLUi
where Geoi is the geological index, Morphi is the geomorphological index, Hydroi is the hydrogeological index and SLUi is the soil–landscape units index. In the present work, even a modified version of Equation (2) has been calculated assigning weights to the four indices. The weights were assigned on the basis of an analytic hierarchy process (AHP) method for which the details are provided in Section 3.2.
The result of Equation (2) was then reclassified in 5 classes, again using Jenks’ natural breaks algorithm. The final geodiversity index varies from 1 (very low geodiversity) to 5 (very high geodiversity).
A sketch of the methodological procedure is shown in Figure 3.

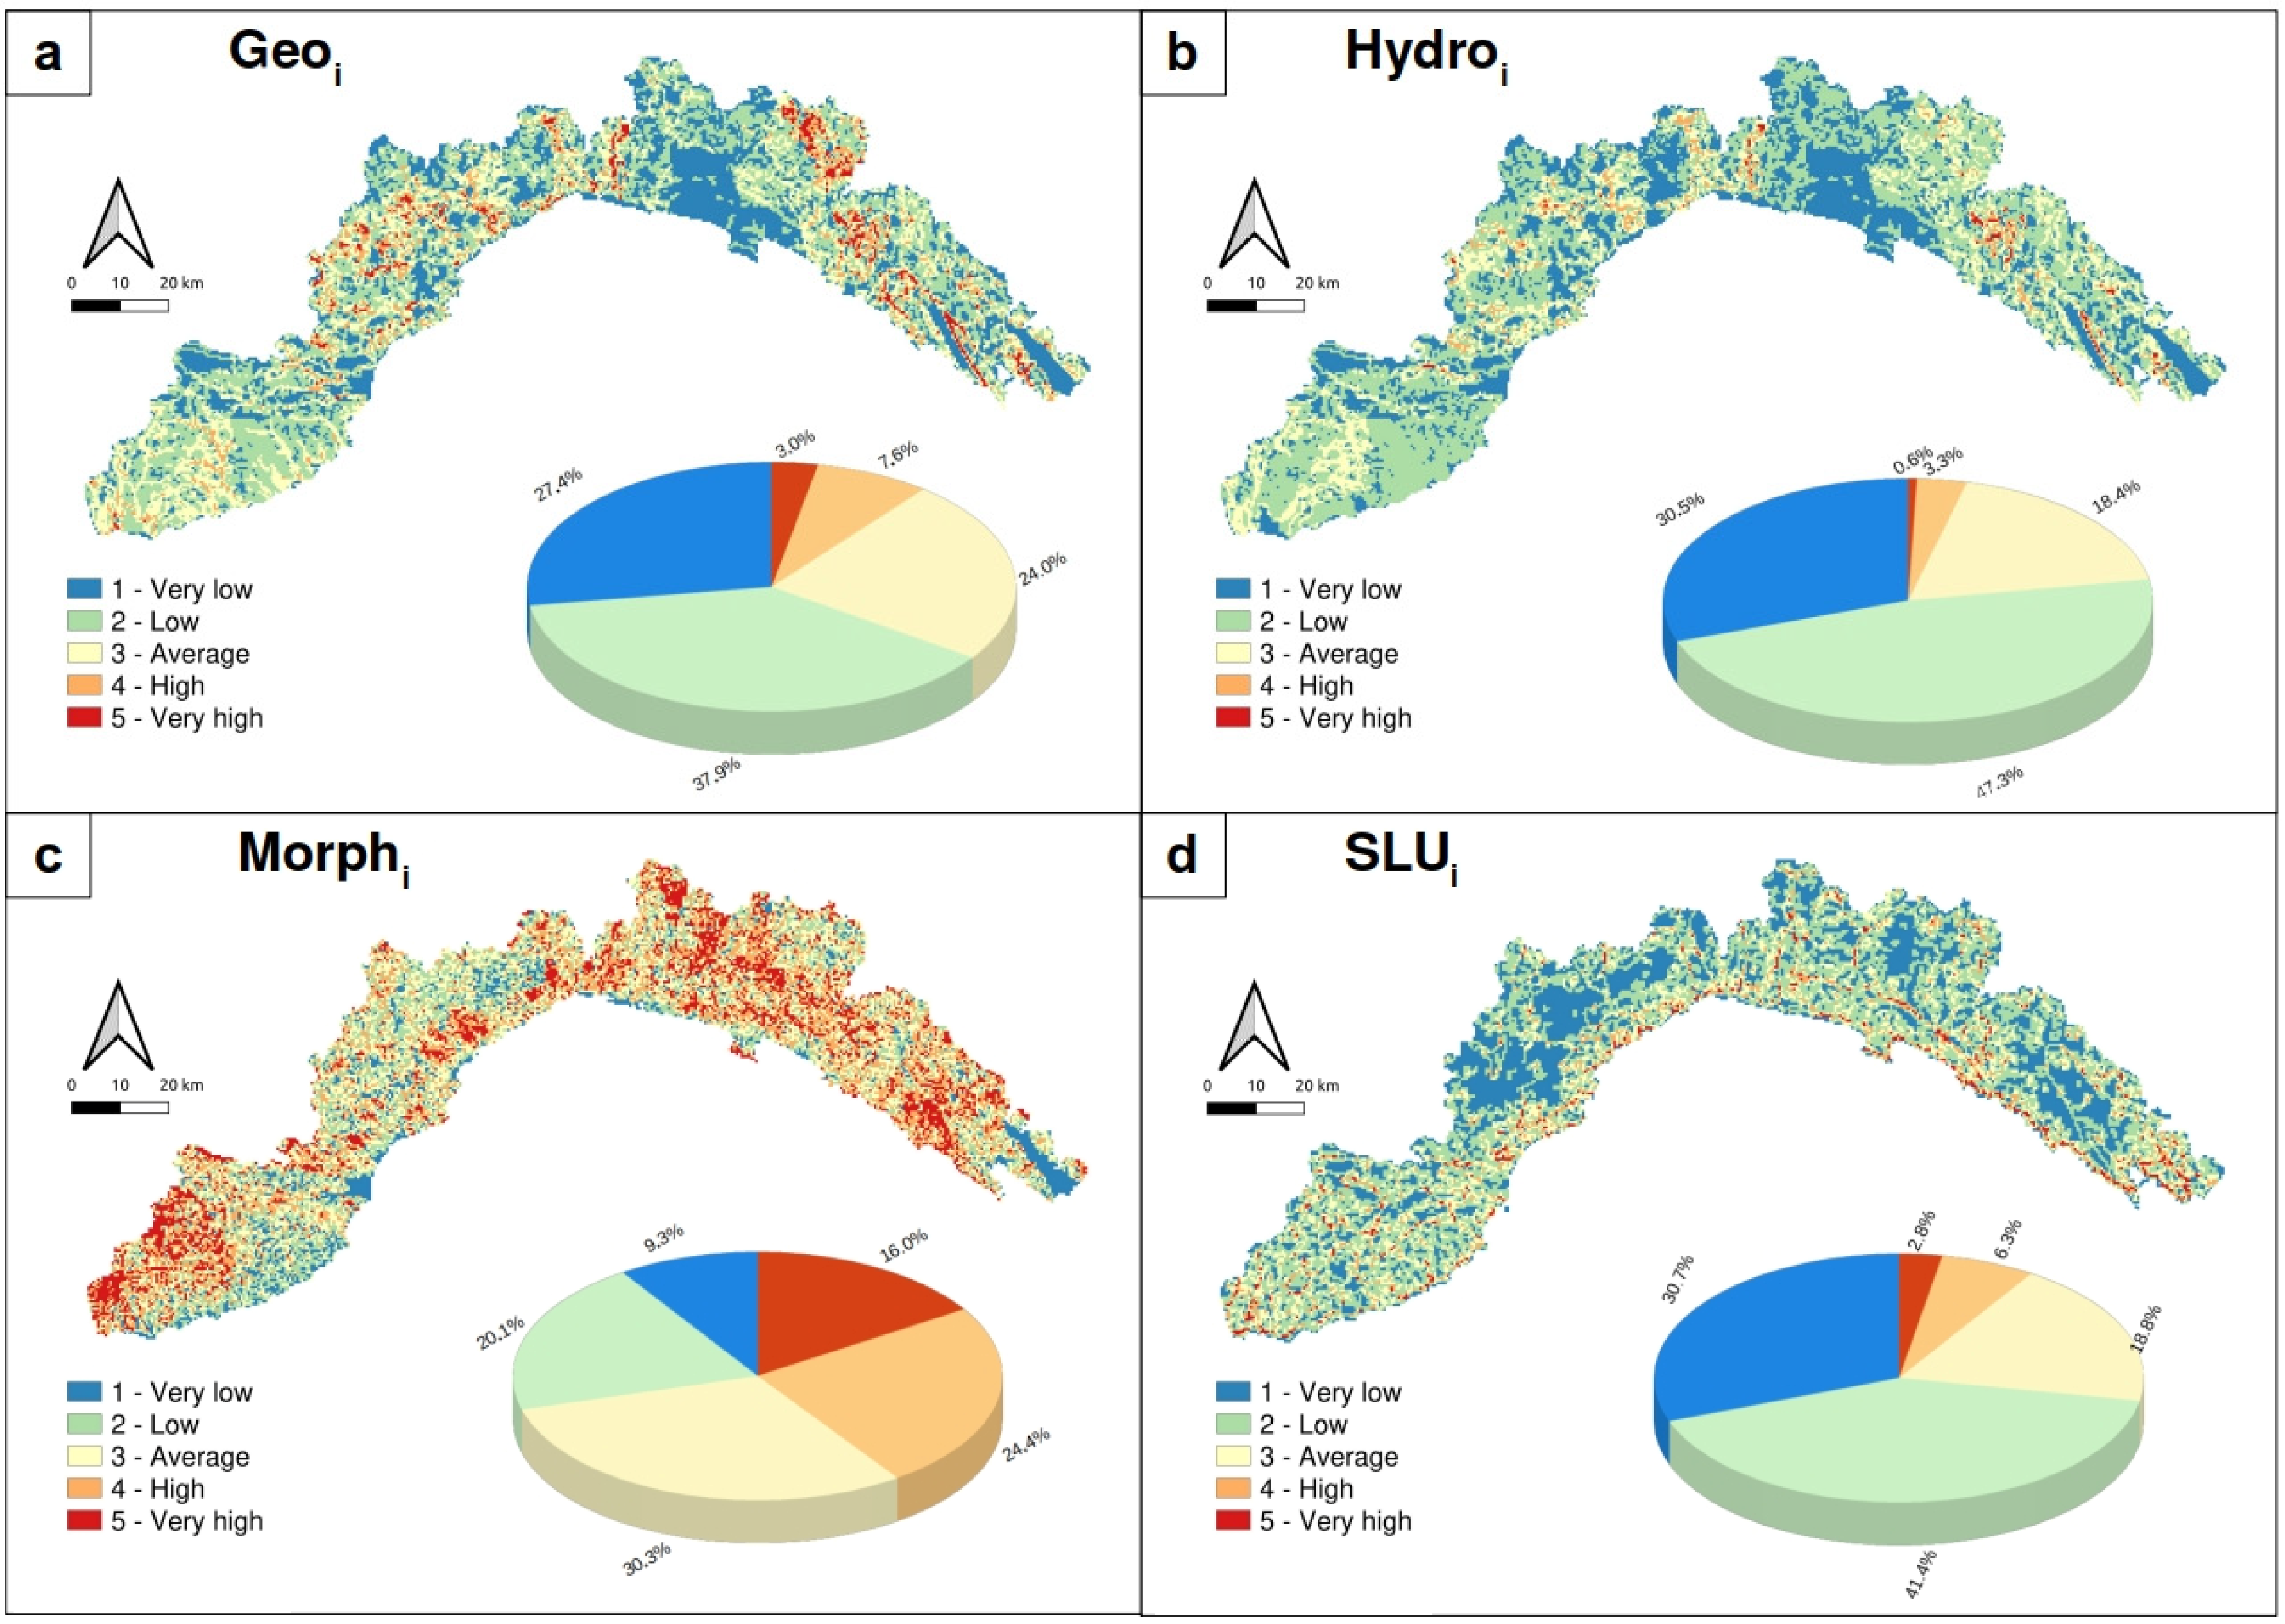
3.1. Input Data for the Calculation of the Diversity Indices

1. Geological Index (Geoi). The geological index was computed from the Lithological Map of Liguria (scale 1:50,000), freely available on the regional authority Geoportal [67]. A reclassification was performed to identify 11 simplified lithological complexes: (1) debris cover; (2) neogene deposits; (3) marly-limestone flysch and chaotic sedimentary complexes; (4) massive intrusive and metamorphic rocks; (5) marls and pelites; (6) foliated metamorphic rocks; (7) basic ophiolites and metaophiolites; (8) ultrabasic rocks; (9) sandstones and conglomerates; (10) mainly calcareous, dolomitic or chalky rocks; and (11) siliceous rocks. The reclassified vector map was transformed into a raster map to calculate the diversity index.
2. Hydrogeological Index (Hydroi): Starting from the regional lithological map, a reclassification was performed to obtain five simplified hydrogeological complexes, according to the permeability type: (1) karst rocks; (2) porous rocks and deposits; (3) fractured rocks with low permeability; (4) fractured rocks with average permeability; and (5) fractured rocks with high permeability.
3. Geomorphologic Index (Morphi). The geomorphologic diversity index was computed combining five morphometric parameters: (1) drainage density; (2) roughness coefficient; (3) slope position index; (4) landform category index; (5) relief energy.
The drainage density was calculated per unit area, overlaying a grid of 100 × 100 m on the regional hydrographic network in vector format (scale 1:10,000); [68]. The algorithm calculated the length of the river streams present in each cell, then divided it by the areal extension of the cell.
The roughness coefficient is an index designed to quantify the topographical heterogeneity (cell size: 5 × 5 m; vertical resolution: 1 m; [69]). It is calculated through an algorithm, which calculates the sum of the differences between that cell and the eight adjacent cells for each cell of the regional DTM [70].
The slope position index derives from the reclassification of another morphometric parameter, called topographic position index [71]. The TPI is calculated from the DTM, through the difference between the elevation value of a cell and the average elevation of a given surrounding area, the dimensions of which are chosen by the operator based on the scale and purpose of the work. Positive values correspond with topographic highs, negative values correspond with valleys and depressions, values close to 0 correspond with flat areas. The obtained TPI values are then reclassified, achieving an SPI variable ranging from 1 to 6.
The landform category index was obtained by applying the GRASS GIS r. geomorphon routine. This routine identifies ten landforms by analyzing the DTM: (1) flats; (2) summits; (3) ridges; (4) shoulders; (5) spurs; (6) slopes; (7) hollows; (8) footslopes; (9) valleys; and (10) depressions.
The relief energy was calculated from the DTM, with the “range” function of the zonal statistics processing tool in QGIS.
4. Soil–Landscape Units Index (SLUi): This index combines pedological and land use information, both of paramount importance in the evaluation of geodiversity. The pedological information was taken from the Soil Map of Italy, scale 1:1,000,000 [72]. The land use information was taken from the CORINE Land Cover Map (scale 1:100,000; link) in vector format. The two maps were combined to obtain a vector map of the soil–landscape units, which was subsequently rasterized for computing the related diversity index.

3.2. Analytic Hierarchy Process (AHP)

In order to assign weights to the geodiversity index criteria, the analytic hierarchy processes (AHP) have been applied [39,40]. AHP is a semi-quantitative decision-making technique developed to compute rank and weight among several criteria and widely applied in many fields of the Earth sciences, from geodiversity to landslides susceptibility mapping and groundwater recharge [29,73,74,75]. The methodology compounds subjective judgments in a quantitative way by assembling a pair-wise comparison matrix of the criteria, using the scale of preference in Table 1 and then assigning the relative weights through the normalized principal eigenvector calculation. Errors are estimated through the calculation of the consistency ration (CR) as defined by Saaty [76], while the consensus indicator S* [77,78] gives an estimation of the agreement between all the experts’ judgments. Using percentage values, both CR and S* ranges from 0 to 100%: CR values lower than 10% indicate a consistent matrix and then an acceptable result, S* values between 80% and 100% correspond to an excellent agreement among the experts’ judgments.
The four geodiversity index criteria have been submitted to a panel of twelve experts grounded in geology, geomorphology and pedology. The experts expressed their judgments through the pairwise comparison. AHP calculation has been performed using an AHP template [79], running under Excel 2013 version.
According to the weighting procedure, Equation (2) is modified as follows, where wG, wM, wH and wS denote the respective weights:
GI = wG * Geoi + wM * Morphi + wH * Hydroi + wG * SLUi

3.3. Cohen’s k Comparison
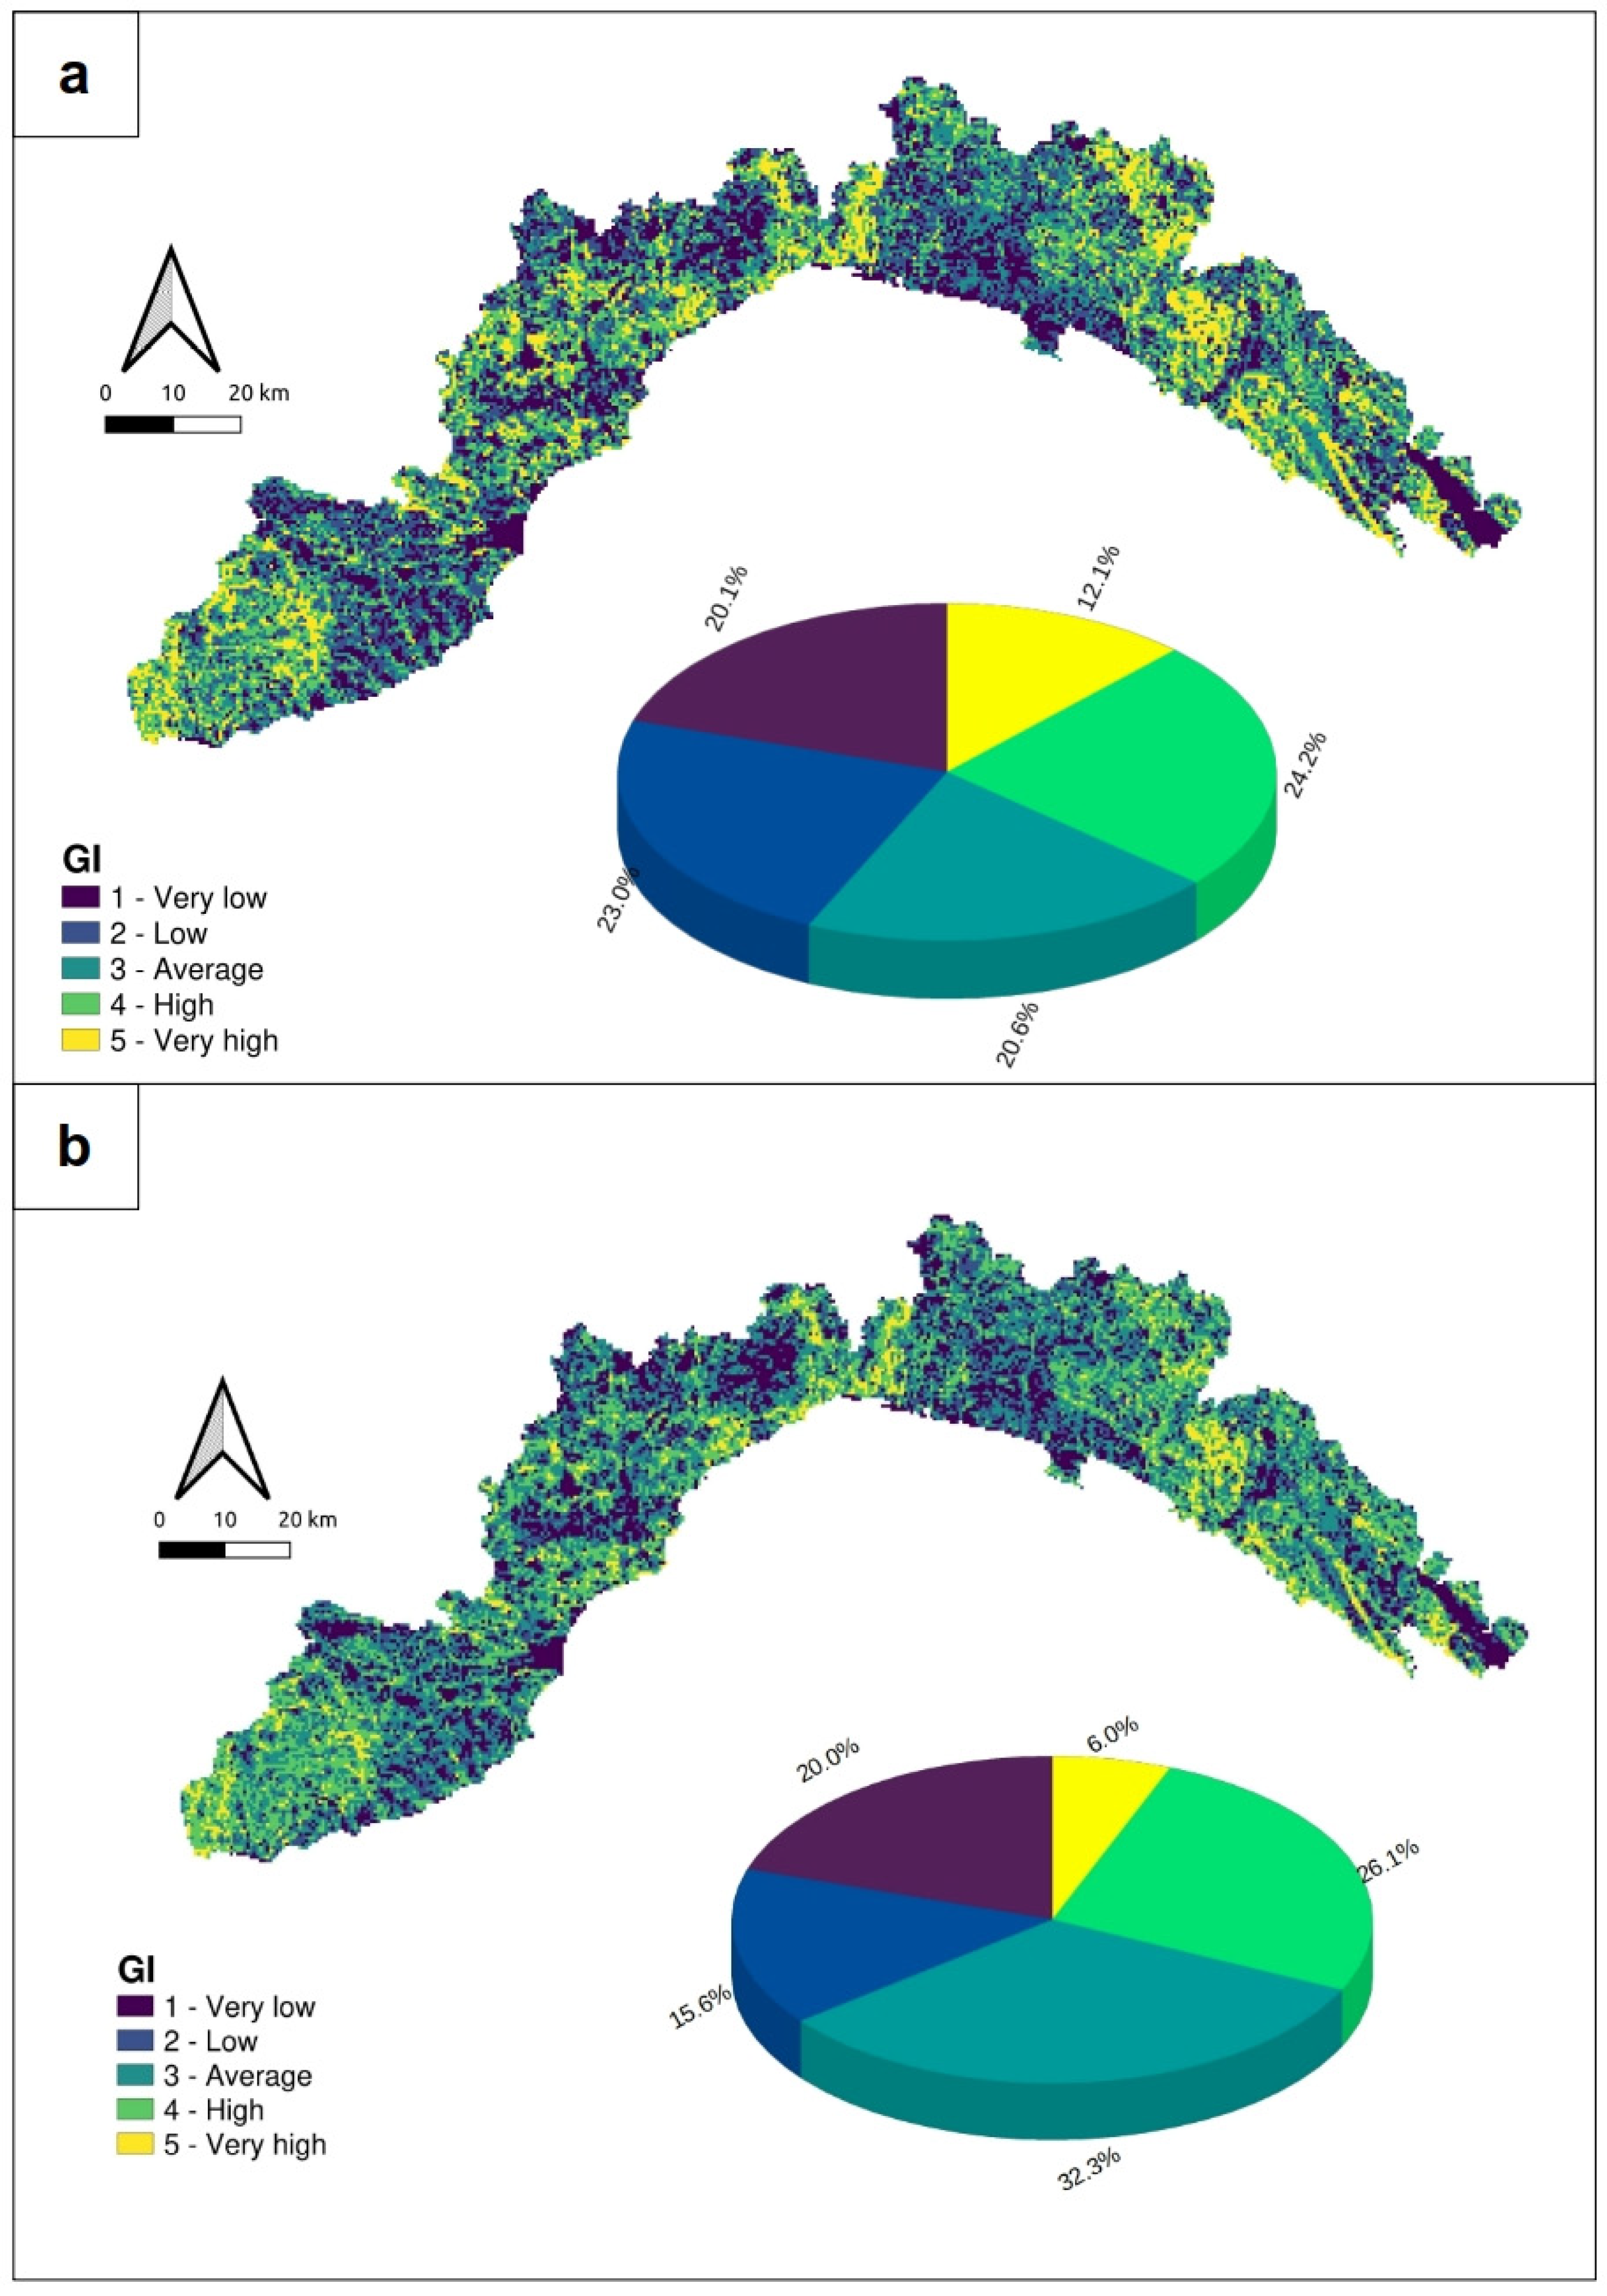
Stressing the importance of weighting the geodiversity index criteria, the weights calculation through AHP methodology has been compared with the result that is obtained without weighting. The map comparison has been carried out by applying Cohen’s kappa calculation [80,81], using the map comparison toolkit software version 3.2.3 [82]. The quantitative comparison allows for an overall score of concordance between the maps, values for every class and the spatial distribution of concordance. Cohen’s kappa scores range from 0 to 1.

4. Results

The four diversity indices maps are represented in Figure 4.
The prevailing class in the Geological Index (Figure 4a) map is the n. 2, taking up 37.9% of the regional area. Class 1 represents 27.4% of the region, class 3 represents 24.0%, class 4 represents 7.6% and class 5 represents 3.0%. The most diverse areas are: the central-eastern Ligurian Apennines, especially in the ophiolitic areas and by the outcrops of the Tuscan Nappe; the Sestri-Voltaggio Zone where, in a small area, ophiolites, oceanic metasedimentary rocks, dolomites and limestones can be found. Low values appear in the two main floodplains (Magra and Albenga rivers), and in areas characterized by marly limestone flysch sequences, such as the central part of the region, from Genoa to Chiavari, and the western Ligurian Alps nearby Imperia.
The hydrogeological index (Figure 4b) prevailing class is the n. 2 (47.3%), followed by class 1 (30.5%), class 3 (18.4%), class 4 (3.3%) and class 1 (0.6%). As for the geological index, the areas that show the highest hydrogeological diversity are in the central and eastern Ligurian Apennines and by the Sestri–Voltaggio zone, which is characterized by different rock masses classified in different hydrological complexes.
The geomorphological index (Figure 4c) is the combination of the varieties of five morphometric parameters: drainage density, roughness, slope position index, landform category index and relief energy. Class 1 takes up 29.4% of the regional territory, class 2 takes up 30.3%, class 3 represents 24.4%, class 4 represents 12% and class 5 represents 3.9% of the regional land. The highest geomorphodiversity is recorded in the western Ligurian Alps and in the Genoa interland; in general, the geomorphological index assumes high values in the more rugged parts of the regional area. Low geomorphodiversity scores are recorded in the coastal floodplains, on the northern side of the eastern Ligurian Alps, in the northern part of Bormida Valley near the Liguria-Piedmont border and in the Albenga and Imperia interland.
The soil–landscape units index (Figure 4d) takes into account and combines pedological and land use information. Class 2 is the prevailing class, covering 41.4% of the region; class 1 covers 30.7%, class 3 covers 18.8%, class 4 covers 6.3% and class 5 covers 2.8% of the Ligurian territory. In general terms, average to high diversity values are distributed mainly in the coastal areas and along some of the main valleys on the maritime side of the Alps-Apennines mountain chain. The inland, especially in the Savona Province, assumes very low diversity values, due to pedological and land use uniformity.
To calculate the final geodiversity index (GI), weights have been assigned to each diversity index using the AHP method. The four diversity indices have been rated against each other with a value ranging from 1 to 9 and expressing the relative dominance of one index over another. The results of the AHP method show that the most relevant factor in determining geodiversity is lithology, with a calculated weight of 47.7%; geomorphology has a calculated weight of 35.5%; much lower weights resulted for hydrogeology (9.0%) and soil–landscape units (7.8%). The AHP results are consistent, as indicated by a consistency ratio (CR) of 0.3%. The consensus indicator value of 83.3% shows a good consensus between the researchers that participated in the process.
The AHP methodology has been applied following twelve experts’ judgments: results are shown in Table 2. The good reliability of the computed weights is emphasized by the computed CR = 0.3% and S* = 83% values: the first is well below the 10% limit, while the latter underlines an excellent agreement between judgments, which is a good overlap of the different experts’ findings.
The GI was then calculated without assigning weights to the four diversity indices (Figure 5b). In this case, while the most geodiverse areas remain more or less the same, the results in terms of spatial distribution of the five classes are slightly different: class 1 covers 18% of the Liguria region, class 2 covers 33.2%, class 3 covers 28.2%, class 4 covers 17.5% and class 5 covers 3.1%.
The Cohen’ kappa calculation between the AHP weighted and non-weighted maps gives a value k = 0.625, indicating a fair concordance between the two maps. In Table 3, the geodiversity index class values are shown. The results show a total concordance for the very low class, for which k = 1, and a good concordance for the low and the very high classes.

5. Discussion

In Figure 5, the main GI map, obtained by the weighted sum of the four diversity indices, is compared to another GI map calculated with the non-weighted sum. A qualitative comparison displays that areas characterized by the highest geodiversity score are largely the same, with minor differences in the spatial distribution of the five GI classes. The similarity between the two GI maps indicates that, because of their generally low values, the hydrogeological diversity and the soil–landscape unit diversity don’t have a great incidence on the GI. Further, in the non-weighted GI map, geological and geomorphological diversity seem to be responsible for the major contribution to the final geodiversity score. This is consistent with the results of the AHP method, which assigned greater weights to the geological and geomorphological indices, and much lower weights to the hydrogeological and soil–landscape unit indices. Furthermore, the AHP weighted geodiversity map allows to mitigate the limitation of using the available low resolution pedological factor data by reducing the soil–landscape unit weight.
Then, areas assuming the highest GI values are characterized mainly by high geological or geomorphological diversity. Among them the Sestri–Voltaggio Zone, the Cinque Terre-La Spezia area, the Aveto and Graveglia valleys and the western Savona province are characterized by a striking variety of lithologies. The southern side of the Beigua massif and the western Ligurian Alps near the French border are instead characterized mainly by high geomorphodiversity. Most of these areas are in fact well known for their significant geoheritage [57,59,60,83,84,85] and for their landscape and scenic value. Some of them are included within regional natural parks, where geology is one of the most notable reasons of interest.
The lowest GI values are recorded in the main alluvial plains along the Ligurian coast; the Albenga plain in the west and the Magra River plain in the east are immediately recognizable on the maps in Figure 5. One can note other areas with very low to low GI. The area with a roughly triangular shape in the western part of the region and the inland between Genoa and the Portofino promontory are characterized by low geological diversity: they coincide with the outcrops of the monotonous Helminthoid Flysch sequences of the Antola and Sanremo formations. The northern side of the Beigua massif is also characterized by monotonous lithology, being formed mainly by serpentinites with minor outcrops of calcschists and eclogites.
The comparison between the AHP weighted and the non-weighted GI map shows a general overall concordance but considering both the per class values and their spatialization, many dissimilarities arise. At first, differences are more prominent in the high and average classes, while in the other classes the concordance is higher with a substantial coincidence in the lower one. This result is confirmed by the diagrams in Figure 5. Moreover, differences are spread all over the region and in general determine an increase in the higher classes.
Some areas can be identified where the discrepancies are more concentrated (Figure 6). These include the west coast near Imperia, the immediate hinterland of Savona, the lower Scrivia valley, the upper Trebbia valley and the eastern hinterland near Levanto. These areas are characterized by class 1 of both the hydrogeological diversity index and the soil-landscape diversity index, but by high or very high geomorphological diversity. Downplaying the weight of the hydrogeological and soil–landscape diversity as well as assigning more weight to geomorphological diversity causes them to obtain higher GI values.
Then, the AHP-weighted GI values were compared to the sites of community importance (S.C.I.) that are part of the Natura 2000 network (Figure 7). The comparative map shows a fitting correspondence between areas with high and very high GI and the S.C.I.
Table 4 reports the percentage of each GI class that is included in the terrestrial S.C.I (excluding the marine S.C.I. from the calculation): the highest percentages are reported for class 4 (26.68%) and class 5 (34.25%), corresponding to high and very high geodiversity. Slightly lower values are obtained by class 3 (23.93%), class 2 (22.97%) and class 1 (24.94%). Overall, the S.C.I. cover 25.83% of the entire Ligurian territory. This quantification confirms a fair correspondence between the protected areas and high geodiversity values.
The S.C.I. of the Natura 2000 Network are identified in accordance with Directive 92/43/EEC, with the aim of maintaining biodiversity, habitats and species of community interest. The fair correspondence between these sites and the areas of high geodiversity, suggests that there is a link between biodiversity and geodiversity, as hypothesized by numerous scholars (see [86] and references therein), and provides preliminary ground to test the biogeodiversity hypothesis in the Liguria region.

6. Conclusions

In this research, a quantitative GIS-based method of geodiversity assessment has been presented and tested on the Liguria region of Northern Italy. This method combines the quantitative computation of diversity indices representing the main components of geodiversity (geology, geomorphology, hydrogeology and pedology) with a heuristic approach for weighting them. The application of the semi-quantitative AHP methodology allowed to overcome the subjectivity in assigning weights, and then obtaining a more consistent GI index result. The weighted GI was then quantitatively compared with a non-weighted GI, confirming the higher reliability of the first in evidencing the analyzed territory features and characteristics.
The AHP method results, based on experts’ judgment, indicate that geological diversity and geomorphological diversity play the most important role in determining geodiversity. As a result, the AHP-weighted GI map highlights these two aspects: high GI values are obtained by the areas with great lithological and geomorphological variety, such as the western Ligurian Alps, the Sestri–Voltaggio Zone and the eastern Ligurian Apennines; low GI values are recorded in lithologically or geomorphologically uniform areas, such as the coastal alluvial plains.
The comparison between the weighted GI and the non-weighted GI was performed both qualitatively and quantitatively, with the calculation of Cohen’s kappa index. While there are differences between the two GI maps, the areas characterized by high non-weighted GI values are still largely the same as the weighted GI. Even in the non-weighted GI map, the major contributions to high GI values seem to result from the geological and geomorphological diversity, a situation that is consistent with the AHP results.
Furthermore, the low weight assigned to the soil–landscape units factor corresponds to the lower influence that it assumes in the studied area in terms of geodiversity. It must be stressed that both soil and land use are related and constrained by the geomorphological asset; in fact, soil accumulation and possible evolution are largely limited by the strong steepness of the slopes that are among the main geomorphological features. For the same reason, morphometry strongly affects land use, both in terms of urban expansion and of agricultural practices. Finally, the low soil-landscape units factor weight, by reducing its influence in the final calculation, allows to mitigate the limitation of using the coarse resolution only with available pedological data.
The final geodiversity maps can constitute a crucial tool for land planning and management, highlighting in a quantitative and objective way the variety, distribution and interaction among the main components of the physical landscape. This tool may play a crucial role in an area, which is renowned for its scenic and landscape variety, and highly impacted by tourism, primarily along the coastline. In fact, geodiversity should be implemented in the regional planning in order to improve the protection and valorization of the many peculiar features that constitute the landscape basis and that are continually threatened by urban expansion and soil sealing.
Moreover, the research allowed the underlining of the spatial relationships between geodiversity and biodiversity, considering the Natura 2000 sites. The great variability of habitats, descending mainly from over 2000 m of altitude range in short spatial distances and from the closeness of the mountains and the sea, confirms the strong relationship with geodiversity, which will be further investigated. This aspect may be crucial even in terms of climate change, as its consequences affect habitats at diverse altitude ranges, involving both migrators and sedentary species, or areas suffering drought conditions.
In conclusion, the present research can be the starting point for further studies, including investigating the influence of scale on the presented assessment method, including other parameters in the calculation, elaborating on the relationship between geodiversity and geosites and testing the biogeodiversity hypothesis, for which the present work has shown promising preliminary results.

Author Contributions

Conceptualization, A.F. and P.C.; methodology, A.F. and G.P.; software, A.F. and G.P.; validation, P.C. and F.F.; formal analysis, A.F. and G.P.; investigation, A.F. and P.C.; resources, F.F.; data curation, P.C.; writing—original draft preparation, A.F., F.F., G.P. and P.C.; writing—review and editing, F.F. and P.C.; visualization, A.F.; supervision, P.C.; project administration, A.F. and P.C.; funding acquisition, F.F. All authors have read and agreed to the published version of the manuscript.

Funding

This research received no external funding.

Institutional Review Board Statement

Not applicable.

Informed Consent Statement

Not applicable.

Conflicts of Interest

The authors declare no conflict of interest.

References

  1. Wiedenbein, F.W. Ein Geotopschutzkonzept für Deutschland. In Geotopschutz Probleme: Der Methodik und der Praktischen; University of Saarland: Saarbrucken, Germany, 1993. [Google Scholar]
  2. Sharples, C. Geoconservation in forest management-principles and procedures. Tasforest 1995, 7, 37–50. [Google Scholar]
  3. Eberhard, R. Pattern & Process: Towards a Regional Approach to National Estate Assessment of Geodiversity; Australian Heritage Commission: Camberra, Australia, 1997. [Google Scholar]
  4. Johansson, C.E. Geodiversitet i Nordisk Naturvård; Nordisk Ministerråad: Copenhagen, Denmark, 2000. [Google Scholar]
  5. Stanley, M. Editorial. Geodivers. Update 2001, 1, 1. [Google Scholar]
  6. Nieto, L.M. Geodiversidad: Propuesta de una definition integradora. Bol. Geol. Min. 2001, 112, 3–12. [Google Scholar]
  7. Australian Heritage Commission. Australian Natural Heritage Charter; Australian Heritage Commission: Canberra, Australia, 2002. [Google Scholar]
  8. Kozlowski, S. Geodiversity. The concept and scope of geodiversity. Prz. Geol. 2004, 52, 833–837. [Google Scholar]
  9. Serrano, E.; Ruiz-Flaňo, P. Geodiversity. A theoretical and applied concept. Geogr. Helv. 2007, 62, 140–147. [Google Scholar] [CrossRef]
  10. Gray, M. Geodiversity: Valuing and Conserving Abiotic Nature, 1st ed.; Wiley, J., Ed.; The Atrium, Southern Gate: Chichester, UK, 2004. [Google Scholar]
  11. Zwoliński, Z.; Najwer, A.; Giardino, M. Methods for assessing geodiversity. In Geoheritage: Assessment, Protection and Management; Reynard, E., Brilha, J., Eds.; Elsevier: Amsterdam, The Netherlands, 2018; pp. 27–52. [Google Scholar] [CrossRef]
  12. Pellitero, R.; Manosso, F.C.; Serrano, E. Mid- and large-scale geodiversity calculation in Fuentes Carrionas (NW Spain) and Serra do Cadeado (Paraná, Brazil): Methodology and application for land management. Geogr. Ann. Ser. A Phys. Geogr. 2014, 97, 219–235. [Google Scholar] [CrossRef]
  13. Panizza, M. The geomorphodiversity of the Dolomites (Italy): A key to geoheritage assessment. Geoheritage 2009, 1, 33–42. [Google Scholar] [CrossRef] [Green Version]
  14. JNCC. Common Standards Monitoring Guidance for Earth Science Sites; JNCC: Peterborough, UK, 2004. [Google Scholar]
  15. Gray, M. Geodiversity: Developing the paradigm. Proc. Geol. Assoc. 2008, 119, 287–298. [Google Scholar] [CrossRef]
  16. Holt-Wilson, T. Norfolk’s Earth Heritage: Valuing Our Geodiversity; Norfolk Geodiversity Partnership: Norfolk, UK, 2010. [Google Scholar]
  17. Ellis, N. The Geological Conservation Review (GCR) in Great Britain—Rationale and methods. Proc. Geol. Assoc. 2011, 122, 353–362. [Google Scholar] [CrossRef]
  18. Bradbury, J. A keyed classification of natural geodiversity for land management and nature conservation purposes. Proc. Geol. Assoc. 2014, 125, 329–349. [Google Scholar] [CrossRef]
  19. Seijmonsbergen, A.C.; de Jong, M.G.G.; de Graff, L.W.S.; Anders, N.S. Geodiversität von Vorarlberg und Liechtenstein—Geodiversity of Vorarlberg and Liechtenstein; Haupt Verlag: Bern, Switzerland, 2014. [Google Scholar]
  20. Kot, R. The point bonitation method for evaluating geodiversity: A guide with examples (Polish Lowland). Geogr. Ann. Ser. A Phys. Geogr. 2015, 97, 375–393. [Google Scholar] [CrossRef] [Green Version]
  21. Hjort, J.; Luoto, M. Geodiversity of high-latitude landscapes in northern Finland. Geomorphology 2010, 115, 109–116. [Google Scholar] [CrossRef]
  22. Ruban, D.A. Quantification of geodiversity and its loss. Proc. Geol. Assoc. 2010, 121, 326–333. [Google Scholar] [CrossRef]
  23. Pellitero, R.; González-Amuchastegui, M.J.; Ruiz-Flaňo, P.; Serrano, E. Geodiversity and geomorphosite assessment applied to a natural protected area: The Ebro and Rudron Gorges Natural Park (Spain). Geoheritage 2011, 3, 163–174. [Google Scholar] [CrossRef]
  24. Pereira, D.I.; Pereira, P.; Brilha, J.; Santos, L. Geodiversity assessment of Paraná State (Brazil): An innovative approach. Environ. Manag. 2013, 52, 541–552. [Google Scholar] [CrossRef] [Green Version]
  25. De Paula Silva, J.; Pereira, D.I.; Agular, A.M.; Rodrigues, C. Geodiversity assessment of the Xingu drainage basin. J. Maps 2013, 9, 254–262. [Google Scholar] [CrossRef] [Green Version]
  26. De Paula Silva, J.; Rodrigues, C.; Pereira, D.I. Mapping and Analysis of Geodiversity Indices in the Xingu River Basin, Amazonia, Brazil. Geoheritage 2015, 7, 337–350. [Google Scholar] [CrossRef] [Green Version]
  27. Tukiainen, H.; Bailey, J.J.; Field, R.; Kangas, K.; Hjort, J. Combining geodiversity with climate and topography to account for threatened species richness. Conserv. Biol. 2016, 31, 364–375. [Google Scholar] [CrossRef]
  28. Araujo, A.M.; Pereira, D.I. A new methodological contribution for the Geodiversity assessment: Applicability to Ceará State (Brazil). Geoheritage 2018, 10, 591–605. [Google Scholar] [CrossRef]
  29. Perotti, L.; Carraro, G.; Giardino, M.; de Luca, D.A.; Lasagna, M. Geodiversity Evaluation and Water Resources in the Sesia Val Grande UNESCO Geopark (Italy). Water 2019, 11, 2102. [Google Scholar] [CrossRef] [Green Version]
  30. Crisp, J.R.; Ellison, J.C.; Fischer, A. Current trends and future directions in quantitative geodiversity assessment. Progr. Phys. Geogr. 2020, 45, 514–540. [Google Scholar] [CrossRef]
  31. Zwoliński, Z. The routine of landform geodiversity map design for the Polish Carpathian Mts. In Geoecology of the Euroasiatic Alpids; Rojan, E., Łajczak, A., Eds.; Landform Analysis: Poznań, Poland, 2009; Volume 11, pp. 79–87. [Google Scholar]
  32. Benito-Calvo, A.; Pérez-González, A.; Magri, O.; Meza, P. Assessing regional geodiversity: The Iberian Peninsula. Earth Surf. Process. Landf. 2009, 34, 1433–1445. [Google Scholar] [CrossRef]
  33. Ferrero, E.; Giardino, M.; Lozar, F.; Giordano, E.; Belluso, E.; Perotti, L. Geodiversity action plans for the enhancement of geoheritage in the Piemonte region (north-western Italy). Ann. Geophys. 2012, 55, 487–495. [Google Scholar] [CrossRef]
  34. Panizza, M.; Piacente, S. Cultural geomorphology and geodiversity. In Geomorphosites; Reynard, E., Coratza, P., Regolini-Bissig, G., Eds.; Verlag Dr. Friedrich Pfeil: Munich, Germany, 2009. [Google Scholar]
  35. Gordon, J.E. Rediscovering a sense of wonder: Geoheritage, geotourism and cultural landscape experiences. Geoheritage 2012, 4, 65–77. [Google Scholar] [CrossRef]
  36. Li, W.; Zhu, J.; Fu, L.; Zhu, Q.; Xie, Y.; Hu, Y. An augmented representation method of debris flow scenes to improve public perception. Int. J. Geogr. Inf. Sci. 2021, 35, 1521–1544. [Google Scholar] [CrossRef]
  37. Quesada-Román, A.; Pérez-Umaña, D. State of the Art of Geodiversity, Geoconservation, and Geotourism in Costa Rica. Geosciences 2020, 10, 211. [Google Scholar] [CrossRef]
  38. Ilic, M.; Stojković, S.; Rundić, L.; Calic, J.; Sandić, D. Application of the geodiversity index for the assessment of geodiversity in urban areas: An example of the Belgrade City area, Serbia. Geol. Croat. 2016, 69, 325–336. [Google Scholar] [CrossRef]
  39. Santos, D.; Mansur, K.; Gonçalves, J.; Arruda, E.; Manosso, F. Quantitative assessment of geodiversity and urban growth impacts in Armação dos Búzios, Rio de Janeiro, Brazil. Appl. Geogr. 2017, 85, 184–195. [Google Scholar] [CrossRef]
  40. Saaty, T.L. A scaling method for priorities in hierarchical structures. J. Math. Psychol. 1977, 15, 234–281. [Google Scholar] [CrossRef]
  41. Saaty, T.L. The Analytic Hierarchy Process; McGraw-Hill: New York, NY, USA, 1980. [Google Scholar]
  42. Köppen, W. Das geographische System der Klimate. In Handbuch der Klimatologie; Köppen, W., Geiger, R., Eds.; Borntraeger: Berlin, Germany, 1936. [Google Scholar]
  43. Giammarino, S.; Capponi, G.; Crispini, L.; Giglia, G.; Piazza, M. Carta Geologica Della Liguria—Scala 1:200,000; LAC: Firenze, Italy, 2002. [Google Scholar]
  44. Boni, P.; Mosna, S.; Vanesi, M. La Pietra di Finale (Liguria Occidentale). Atti Ist. Geol. Univ. Pavia 1968, 18, 102–150. [Google Scholar]
  45. Fanucci, F.; Nosengo, S. Rapporti fra neotettonica e fenomeni morfogenetici del versante marittimo dell’Appennino Ligure e del margine continentale. Ital. J. Geosci. 1977, 96, 41–51. [Google Scholar]
  46. Brancucci, G.; Paliaga, G. Geomorphic characterization of the main drainage basins of maritime Liguria (Italy)—Preliminary results. Geogr. Fis. Din. Quat. 2005, 7, 59–67. [Google Scholar]
  47. Paliaga, G.; Faccini, F.; Luino, F.; Turconi, L.; Bobrowsky, P. Geomorphic processes and risk related to a large landslide dam in a highly urbanized Mediterranean catchment (Genova, Italy). Geomorphology 2019, 327, 48–61. [Google Scholar] [CrossRef]
  48. Progetto IFFI (Inventario dei Fenomeni Franosi in Italia) [Inventory of Landslide Phenomena in Italy]. Available online: https://www.isprambiente.gov.it/it/progetti/cartella-progetti-in-corso/suolo-e-territorio-1/iffi-inventario-dei-fenomeni-franosi-in-italia (accessed on 17 January 2021).
  49. Brandolini, P.; Faccini, F.; Paliaga, G.; Piana, P. Man-made landforms survey and mapping of an urban historical center in a coastal mediterranean environment. Geogr. Fis. Dinam. Quat. 2018, 41, 23–34. [Google Scholar] [CrossRef]
  50. Brandolini, P.; Cappadonia, C.; Luberti, G.M.; Donadio, C.; Stamatopoulos, L.; Di Maggio, C.; Faccini, F.; Stanislao, C.; Vergari, F.; Paliaga, G.; et al. Geomorphology of the Anthropocene in Mediterranean urban areas. Prog. Phys. Geogr. 2019, 44, 461–494. [Google Scholar] [CrossRef]
  51. Paliaga, G.; Faccini, F.; Luino, F.; Roccati, A.; Turconi, L. A clustering classification of catchment anthropogenic modification and relationships with floods. Sci. Total Environ. 2020, 740, 139915. [Google Scholar] [CrossRef]
  52. Mastronuzzi, G.; Aringoli, D.; Aucelli, P.; Baldassarre, A.; Bellotti, P.; Bini, M.; Biolchi, S.; Bontempi, S.; Brandolini, P.; Chelli, A.; et al. Geomorphological map of the Italian coast: From a descriptive to a morphodynamic approach. Geogr. Fis. Dinam. Quat. 2017, 40, 161–195. [Google Scholar] [CrossRef]
  53. Faccini, F.; Benedettini, A.; Firpo, M.; Perasso, L.; Poggi, F. Land-management and planning in karst areas: The ligurian case-study (Italy). Rend. Online Soc. Geol. Ital. 2012, 21, 611–613. [Google Scholar]
  54. Gestionale Speleologico Ligure [Ligurian Speleological Management]. Available online: https://www.catastogrotte.net/liguria/index.php (accessed on 6 May 2021).
  55. Paliaga, G.; Luino, F.; Turconi, L.; De Graff, J.V.; Faccini, F. Terraced landscapes on Portofino Promontory (Italy): Identification, geo-hydrological hazards and management. Water 2020, 12, 20. [Google Scholar] [CrossRef] [Green Version]
  56. Burlando, M.; Firpo, M.; Queirolo, C.; Rovere, A.; Vacchi, M. From geoheritage to sustainable development: Strategies and perspectives in the Beigua Geopark (Italy). Geoheritage 2011, 3, 63–72. [Google Scholar] [CrossRef]
  57. Faccini, F.; Roccati, A.; Firpo, M. Geohiking map of Mt. Penna and Mt. Aiona area (Aveto Park, Liguria). J. Maps 2012, 8, 293–303. [Google Scholar] [CrossRef] [Green Version]
  58. Marchesini, M.; Pagano, R. The Val Graveglia manganese district. Mineral. Rec. 2001, 32, 349–379. [Google Scholar]
  59. Faccini, F.; Paliaga, G.; Piana, P.; Gabellieri, N.; Angelini, S.; Coratza, P. The Geoheritage map of the Portofino Natural Park (Italy) as a tool for the management of a highly frequented protected area. J. Maps 2018, 14, 87–96. [Google Scholar] [CrossRef]
  60. Brandolini, P.; Faccini, F.; Piccazzo, M.; Robbiano, A. Geomorphology, Environmental geology and natural-cultural heritage of Palmaria, Tino and Tinetto islands (Portovenere Park, Italy). Mem. Descr. Carta Geol. D’italia 2009, 87, 15–28. [Google Scholar]
  61. Agnoletti, M.; Errico, A.; Santoro, A.; Dani, A.; Preti, F. Terraced Landscapes and Hydrogeological Risk. Effects of Land Abandonment in Cinque Terre (Italy) during Severe Rainfall Events. Sustainability 2019, 11, 235. [Google Scholar] [CrossRef] [Green Version]
  62. Melelli, L.; Vergari, F.; Liucci, L.; Del Monte, M. Geomorphodiversity index: Quantifying the diversity of landforms and physical landscape. Sci. Total Environ. 2017, 584, 701–714. [Google Scholar] [CrossRef] [PubMed]
  63. Bétard, F.; Peulvast, J.-P. Geodiversity hotspots: Concept, method and cartographic application for geoconservation purposes at a regional scale. Env. Manag. 2019, 63, 822–834. [Google Scholar] [CrossRef] [PubMed]
  64. Nobre da Silva, M.L.; Leite do Nascimento, M.A.; Leite Mansur, K. Quantitative assessments of geodiversity in the area of the Seridó Geopark project, Northeast Brazil: Grid and centroid analysis. Geoheritage 2019, 11, 1177–1186. [Google Scholar] [CrossRef]
  65. Menezes dos Santos, F.; de la Corte Bacci, D.; Saad, A.R.; da Silva Ferreira, A.T. Geodiversity index weighted by multivariate statistical analysis. Appl. Geomat. 2020, 12, 361–370. [Google Scholar] [CrossRef]
  66. Jenks, G.F. The data model concept in statistical mapping. Int. Yearb. Cartogr. 1967, 7, 186–190. [Google Scholar]
  67. Ligurian Regional Geoportal: Lithological Map of Liguria. Available online: https://srvcarto.regione.liguria.it/geoviewer2/pages/apps/geoportale/index.html?id=1907 (accessed on 7 May 2021).
  68. Ligurian Regional Geoportal: Hydrographical Network and Drainage Basins. Available online: https://srvcarto.regione.liguria.it/geoviewer2/pages/apps/geoportale/index.html?id=2070 (accessed on 7 May 2021).
  69. Ligurian Regional Geoportal: Digital Terrain Model, ed. 2017. Available online: https://srvcarto.regione.liguria.it/geoviewer2/pages/apps/geoportale/index.html?id=2056 (accessed on 7 May 2021).
  70. Riley, S.J.; DeGloria, S.D.; Elliot, R. A terrain ruggedness index that quantifies topographic heterogeneity. Int. J. Sci. 1999, 5, 23–27. [Google Scholar]
  71. Weiss, A. Topographic Position and Landform Analysis. In Proceedings of the ESRI User Conference, San Diego, CA, USA, 9–13 July 2001. [Google Scholar]
  72. L’Abate, G.; Costantini, E.; Barbetti, R.; Fantappiè, M.; Lorenzetti, R.; Magini, S. Carta dei Suoli D’italia 1:1,000,000 (Soil Map of Italy, Scale 1:1,000,000); Società geográfica: Firenze, Italy, 2015. [Google Scholar] [CrossRef]
  73. Pourghasemi, H.R.; Pradhan, B.; Gokceoglu, C. Application of fuzzy logic and analytical hierarchy process (AHP) to landslide susceptibility mapping at Haraz watershed, Iran. Nat. Hazards 2012, 63, 965–996. [Google Scholar] [CrossRef]
  74. Kaliraj, S.; Chandrasekar, N.; Magesh, N.S. Identification of potential groundwater recharge zones in Vaigai upper basin, Tamil Nadu, using GIS-based analytical hierarchical process (AHP) technique. Arab. J. Geosci. 2014, 7, 1385–1401. [Google Scholar] [CrossRef]
  75. Roccati, A.; Paliaga, G.; Luino, F.; Faccini, F.; Turconi, L. GIS-Based Landslide Susceptibility Mapping for Land Use Planning and Risk Assessment. Land 2021, 10, 162. [Google Scholar] [CrossRef]
  76. Saaty, T.L.; Vargas, L.G. Models, Methods, Concepts and Applications of the Analytic Hierarchy Process; Springer Science & Business Media: New York, NY, USA, 2012; p. 175. [Google Scholar]
  77. Shannon, C. A mathematical theory of communication. Bell. Syst. Tech. J. 1948, 27, 623–656. [Google Scholar] [CrossRef]
  78. Jost, L. Partitioning diversity into independent alpha and beta components. Ecology 2007, 88, 2427–2439. [Google Scholar] [CrossRef] [Green Version]
  79. Goepel, K.D. Implementing the Analytic Hierarchy Process as a Standard Method for Multi-Criteria Decision Making in Corporate Enterprises—A New AHP Excel Template with Multiple Inputs. In Proceedings of the International Symposium on the Analytic Hierarchy Process, Kuala Lampur, Malaysia, 23–26 June 2013; No. 10. Creative Decisions Foundation: Kuala Lampur, Malaysia, 2013; Volume 2, pp. 1–10. [Google Scholar]
  80. Van Vliet, J.; Bregt, A.K.; Hagen-Zanker, A. Revisiting Kappa to account for change in the accuracy assessment of land-use change models. Ecol. Model. 2011, 222, 1367–1375. [Google Scholar] [CrossRef]
  81. Baeza, C.; Lantada, N.; Amorim, S. Statistical and spatial analysis of landslide susceptibility maps with different classification systems. Environ. Earth Sci. 2016, 75, 1318. [Google Scholar] [CrossRef] [Green Version]
  82. Visser, H.; de Nijs, T. The Map Comparison Kit. Environ. Model. Softw. 2006, 21, 346–358. [Google Scholar] [CrossRef]
  83. Ferrando, A.; Faccini, F.; Poggi, F.; Coratza, P. Geosites Inventory in Liguria Region (Northern Italy): A Tool for Regional Geoconservation and Environmental Management. Sustainability 2021, 13, 2346. [Google Scholar] [CrossRef]
  84. Brandolini, P.; Faccini, F.; Robbiano, A.; Bulgarelli, F. Geomorphology and cultural heritage of the Ponci Valley (Finalese karstic area, Ligurian Alps). Geogr. Fis. Dinam. Quat. 2011, 34, 65–74. [Google Scholar]
  85. Coratza, P.; Vandelli, V.; Fiorentini, L.; Paliaga, G.; Faccini, F. Bridging terrestrial and marine geoheritage: Assessing geosites in Portofino Natural Park (Italy). Water 2019, 11, 2112. [Google Scholar] [CrossRef] [Green Version]
  86. Muellner-Riehl, A.N.; Schnitzler, J.; Kissling, W.D.; Mosbrugger, V.; Rijsdijk, K.F.; Seijmonsbergen, A.C.; Versteegh, H.; Favre, A. Origins of global mountain plant biodiversity: Testing the ‘mountain-geobiodiversity hypothesis’. J. Biogeogr. 2019, 46, 2826–2838. [Google Scholar] [CrossRef] [Green Version]
Figure 1. Lithological sketch map of the study area. (1) Debris cover; (2) alluvial and neogenic marine deposits; (3) marly limestone flysch and chaotic complexes; (4) intrusive or massive metamorphic rocks; (5) marls and shales; (6) foliated metamorphic rocks; (7) ophiolites; (8) sandstones and conglomerates; (9) limestones, dolomites and evaporites; and (10) silicic rocks. S-V: Sestri–Voltaggio Line. The main rivers are also shown: (a) Roja; (b) Centa; (c) Bormida di Millesimo; (d) Bormida di Spigno; (e) Orba; (f) Scrivia; (g) Trebbia; (h) Aveto; (i) Entella; (m) Graveglia; (n) Vara; and (o) Magra. Mountains: (1) Mt. Saccarello; (2) Mt. Beigua; (3) Mt. Maggiorasca; (4) Mt. Zatta; and (5) Mt. Gottero.
Sustainability 13 10376 g001
Figure 2. Geological and geomorphological features of the Liguria region. (a) Step-and-pool morphology (Rio di Lerca, Genoa metropolitan city); (b) paleo-landslide (Libia di Pecorara, La Spezia province); (c) Karst cave (Tana dell’Orpe, Savona province); (d) conglomerate cliffs (Promontorio di Portofino, Genoa metropolitan city); (e) natural mountain lake with periglacial morphologies (Lago delle Lame, Genoa metropolitan city); and (f) urban landscape (Genoa).
Sustainability 13 10376 g002
Figure 3. Flow chart showing the methodological steps for the geodiversity assessment.
Sustainability 13 10376 g003
Figure 4. Diversity indices maps: (a) geological diversity; (b) hydrogeological diversity; (c) geomorphological diversity; and (d) Soil–landscape unit diversity.
Sustainability 13 10376 g004
Figure 5. Geodiversity Index maps: (a) AHP-weighted geodiversity index and (b) non-weighted geodiversity index.
Sustainability 13 10376 g005
Figure 6. The spatial distribution of the K index, showing the spatialized discrepancies between the AHP-weighted GI and the non-weighted GI. In black the areas where k = 0, indicating total dissimilarity.
Sustainability 13 10376 g006
Figure 7. Geodiversity index map showing the sites of community interest belonging to the Natura 2000 network.
Sustainability 13 10376 g007
Table 1. Scale of preference between two criteria used in the pairwise comparison in AHP.
ScaleDegree of PreferenceDescription
1EquallyTwo factors contribute equally to the objective
3ModeratelyExperience and judgment slightly to moderately favour one factor over another
5StronglyExperience and judgment strongly or essentially favour one factor over another
7Very stronglyA factor is strongly favoured over another and its dominance is showed in practice
9ExtremelyThe evidence of favouring one factor over another is of the highest degree possible of an affirmation
2, 4, 6, 8IntermediateUsed to represent compromises between the preferences in weights 1, 3, 5, 7 and 9
ReciprocalsOppositeUsed for inverse comparison
Table 2. The results of the AHP evaluation.
CriteriaWeight (%)Error (%)
Geomorphology35.53.3
Lithology47.74.5
Hydrogeology9.00.4
Land Use7.80.6
Table 3. Kappa per geodiversity index class map comparison between the AHP weighted and the non-weighted one.
ClassVery HighHighAverageLowVery Low
Kappa0.7840.4470.4350.8071
Table 4. Quantitative comparison between the AHP-weighted GI and sites of community importance (S.C.I.).
GI ClassTotal Area (km2)Area within S.C.I. (km2)Area within S.C.I. (%)
Class 1: Very low1087.5271.224.94
Class 2: Low1247.2286.522.97
Class 3: Average1113.5266.523.93
Class 4: High1311.835026.68
Class 5: Very high657.7225.334.25
All classes
(entire Liguria region)
5417.71399.525.83
Publisher’s Note: MDPI stays neutral with regard to jurisdictional claims in published maps and institutional affiliations.

