Article

Comparison between Variable and Constant Refrigerant Flow Air Conditioning Systems in Arid Climate: Life Cycle Cost Analysis and Energy Savings

by
Georges Atallah
1,2 and
Faris Tarlochan
1,*
1
Department of Mechanical and Industrial Engineering, College of Engineering, Qatar University, Doha 2713, Qatar
2
Al Muftah Contracting Company W.L.L., Doha 875, Qatar
*
Author to whom correspondence should be addressed.
Sustainability 2021, 13(18), 10374; https://doi.org/10.3390/su131810374
Submission received: 1 September 2021 / Revised: 9 September 2021 / Accepted: 10 September 2021 / Published: 17 September 2021
(This article belongs to the Section Energy Sustainability)

Abstract

:
All over the world, there is a call to encourage sustainable energy thinking and implementation. There is an urgent need to consider sustainable solutions in any design projects that are able to reduce energy consumption. In the heating, ventilation, and air conditioning field, the rise of the variable refrigerant flow systems has made big progress. This study presents a life cycle cost analysis to evaluate the economic feasibility of constant refrigerant flow (CRF), and in particular, the conventional ducted unit air conditioning system and the variable refrigerant flow (VRF) system by using detailed cooling load profiles, as well as initial, operating, and maintenance costs. Two operating hours scenarios are utilized and the present worth value technique for life cycle cost analysis is applied to an existing office building located in Qatar, which can be conditioned by CRF and VRF systems. The results indicate that, although the initial cost of the VRF system is higher than that of the CRF system by 23%, the present worth cost of the VRF system is much lower than that of the CRF system at the end of the lifetime due to lower operating costs. There is also a significant energy saving of 27% by using VRF compared to the CRF. The implementation of these results on a national scale will promote the use of sustainable energy technologies such as the VRF system.

1. Introduction

Designing and selecting air conditioning systems involves many factors to be considered and these factors differ depending on the type of application. The primary goal in designing air conditioning systems is to provide thermal comfort with good indoor air quality while ensuring low energy consumption [1]. In a study published by the U.S. Department of Energy [2], it is mentioned that the buildings sector accounts for about 76% of the overall electricity consumption in the U.S. From this, the major energy consumption in these buildings is for heating, ventilating, and air conditioning, which accounts for 35% of the total building energy [
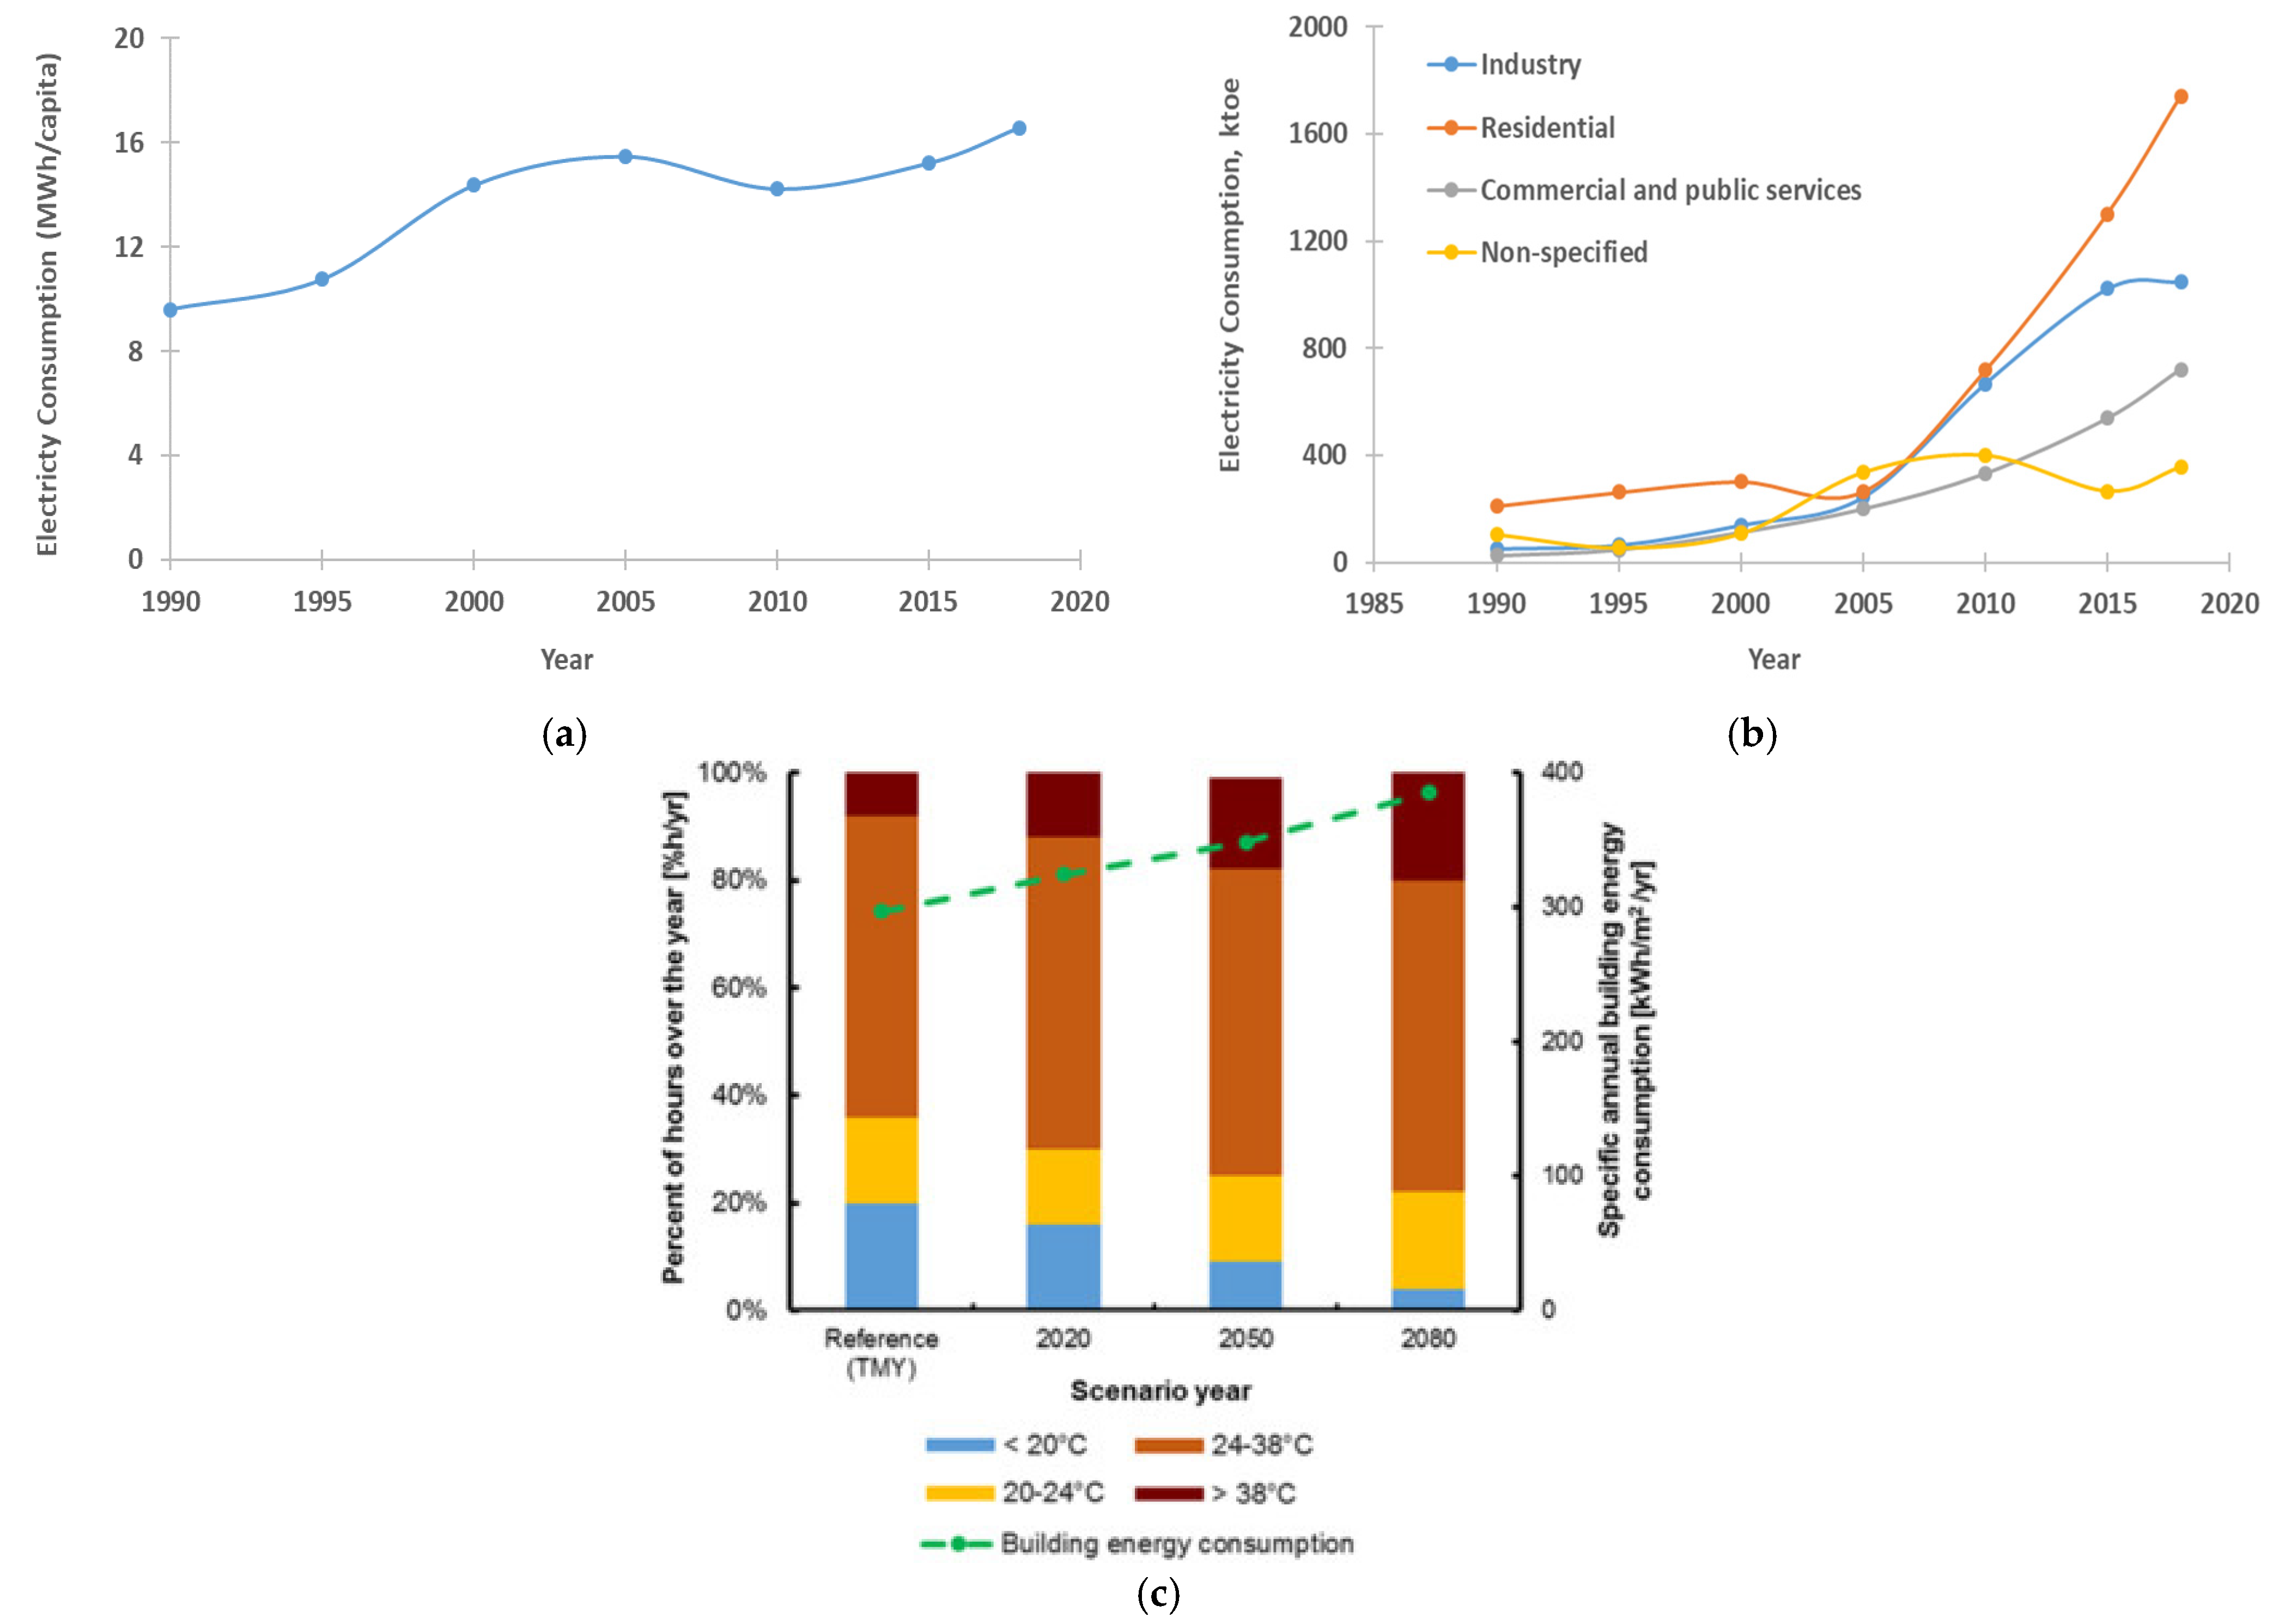
2]. In arid countries, such as those in the Gulf Cooperation Council (GCC), most of the energy in the building (commercial and residential) is used for cooling due to the extreme high temperature climate during summer, which typically lasts around 8 months. Typical temperatures in the summer are in the high 40 °Cs to low 50 °Cs. Besides this, in the last two decades, countries in the GCC such as Qatar are experiencing a large expansion of commercial and residential buildings due to an increase in population and economic activities. This increases the electrical energy consumption per capita are shown in Figure 1 and reported in the literature [3]. In Qatar, the air conditioning accounts for around 60–70% of Qatar’s total electricity demand [4]. In view of the high demand for electricity for cooling, it is important to increase the efficiency of building systems and technologies in order to reduce the overall demand for energy [2]. It is essential to select the most appropriate air conditioning system so that it can be used efficiently during its life cycle, keeping in mind that the energy sources are becoming scarcer around the world. One of the approaches that is worth considering is the usage of variable refrigerant flow systems (VRF) [5].
The indoor units of the air conditioning system in Qatar consists of constant air volume (CAV) and variable air volume (VAV). In CAV, the machine supplies the same quantity of air to the conditioned area (single-zone application), whereas in VAV, the tenants can control the temperature inside the room by reducing or increasing the air volume accordingly (multi-zone application where there are constant changing loads). Both systems can be used in ducted units and in package units and both systems are used in commercial and residential buildings in Qatar. The current work in this paper is looking from the refrigerant side of the cooling system, thus comparing the constant refrigerant flow (CRF) unit against the variable refrigerant flow (VRF) unit.
The VRF system can be best explained by using Figure 2. The system consists of multiple indoor units (IU), an outdoor unit (OU), and a variable speed controller. The electronic expansion valve (EEV) controls the mass flow rate in each of the indoor units. The electronic expansion valve (EEV) plays an important role in regulating the refrigerant flow rate through the heat exchanger of the indoor unit, while the inverter-driven variable speed compressors allow for a larger modulation capacity considering part load factors in the VRF systems. The VRF system allows each IU to be controlled independently and does not lose too much energy through ductwork like conventional systems [5]. Such VRF systems have been used widely in Japan since the 1980s and in the U.S. since 2002 [5]. An initial review on VRF systems was done by Aynur [6], who looked at the VRF system from the experimental and modeling perspective. It was reported that the VRF system has a high initial cost compared to the common air conditioning systems; however, due to the energy saving potential, the estimated payback period of the VRF system compared to conventional chiller system in a generic commercial building could be about 1.5 years. In another study, Patel et al. [7] reported that VRF could fetch energy savings between 10% and 40%. Regarding VRF system responsiveness, Herdendez [8] reported that responsiveness and sensitivity are related to the quantity of indoor evaporators that are connected to the system. A lot of other works have been done with the VRF system in terms of the system architecture [9,10,11], modeling and simulation [12,13,14,15,16,17,18], and experimental work and field testing [6,19,20,21,22,23]. The work surrounding VRF system architecture has looked at performance improvement and integrated system design. It was found that one of the significant benefits of this system is its flexibility. Future work on VRF architecture needs to focus on efficient ventilation methods. In the area of modeling and simulation, research areas are centered on steady state and transient models, as well as empirical and component-based modeling. It was found that there is a need for more user-friendly dynamic models that are easy to be implemented, focusing on empirical dynamic models as the way forward. There is also a need to standardize the different simulation tools being used. Most of the experimental testing using VRF was conducted in Asia and was focusing on the cooling mode. This is because of the hot and humid weather in most of these Asian countries where the studies were conducted. There is still room to evaluate physical performance of VRF in terms of system stability and defrosting.
Most of the reported work pertaining to VRF is done in Asia (Japan and China in particular), Europe, and the U.S. To the best of authors knowledge, not much work in terms of VRF systems has been conducted in arid regions such as the GCC countries. In such hot climates, a lot of energy is consumed from conventional air conditioning systems and the usage of the latest technology is important to reduce the energy demand for cooling [24,25,26]. In view of this, and as an initial step in this direction, the objective of this study is to prove the economic feasibility of the VRF system over the conventional system in cooling mode only, especially for the countries with hot climates such as Qatar. The cooling process is very crucial for such countries while the heating demand is negligible. The paper is organized as follows: In Section 2, the current case is discussed in detail. The building characteristics are listed and the conventional CRF system using traditional ducted units is explained. Then, the VRF technology is explained, and a VRF system is modeled to the existing office building while the same indoor units’ capacities are kept, so that the results remain accurate while comparing the energy consumption of the condensers between both systems. In Section 3, the discussion and the results are provided. In the final section, the conclusive remarks are stated.

2. Materials and Methods

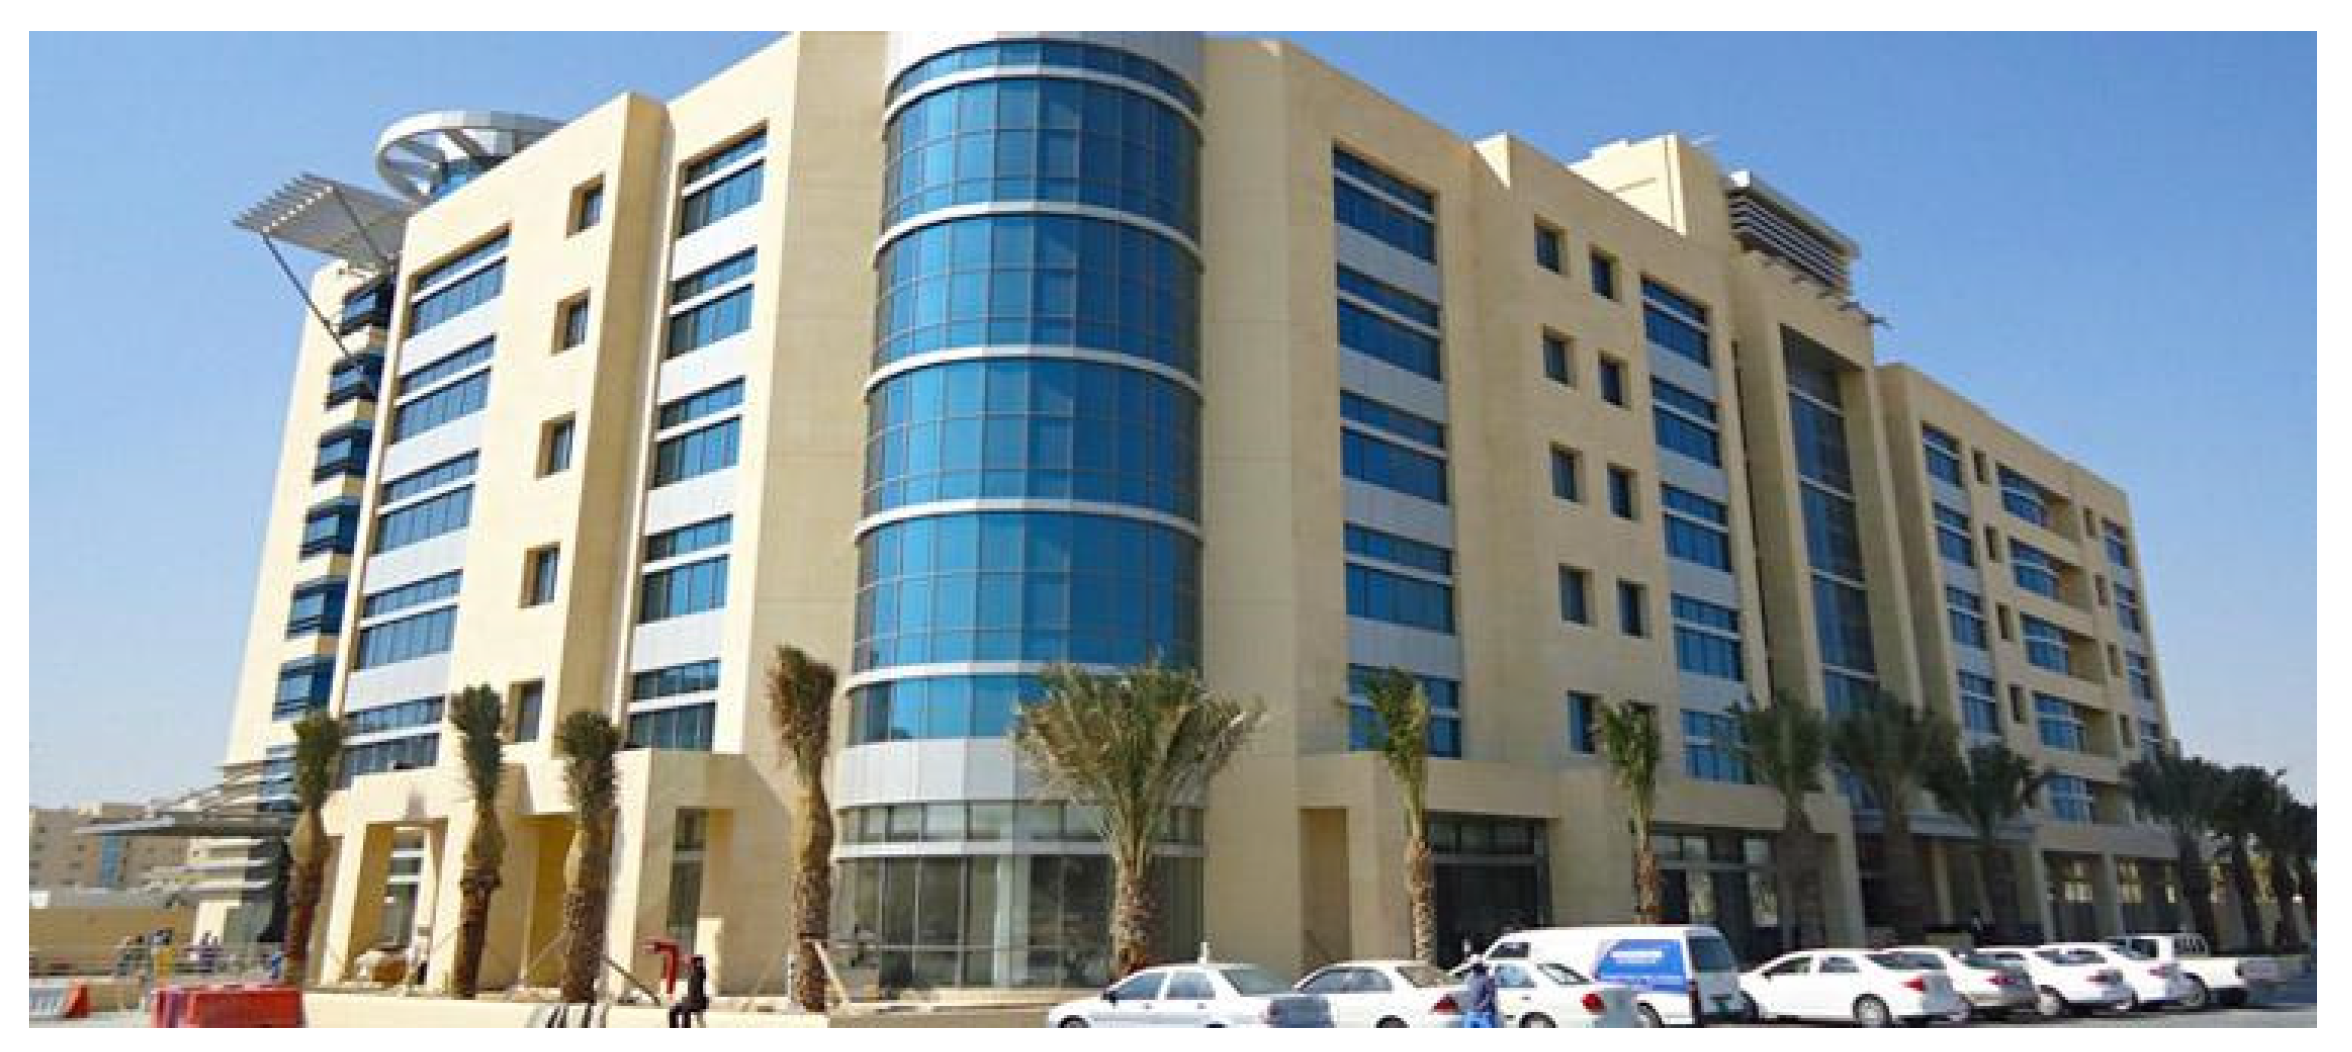
For the purpose of conducting a comprehensive life cycle cost analysis based on CRF and VRF, an existing building in Qatar was selected. The name of the building is Al Muftah Plaza located in the city of Doha (Figure 3). This building has two basements, a ground floor and five floors above ground. The total built up area is 18,102 m2 while the rentable area is 10,715 m2. The ground floor consists of two car showrooms covering an area of 1475 m2, while the upper floors consist of four offices each with an area of 1802 m2. The height of the ground floor is 3.5 m from the finished floor level to the false ceiling level and 1.1 m from the false ceiling level to the upper slab level. In the five upper floors, the height is 3.2 m between the two slabs, out of which 0.5 m is between the false ceiling and the upper slab. The two basements provide a parking space for 125 cars without any cooling services except for the elevator lobbies, which are served by independent split units. The most widely used air conditioning system in commercial and residential buildings (below 10 floors) in Qatar is the traditional ducted unit system, which connects one outdoor unit to one indoor ducted unit.
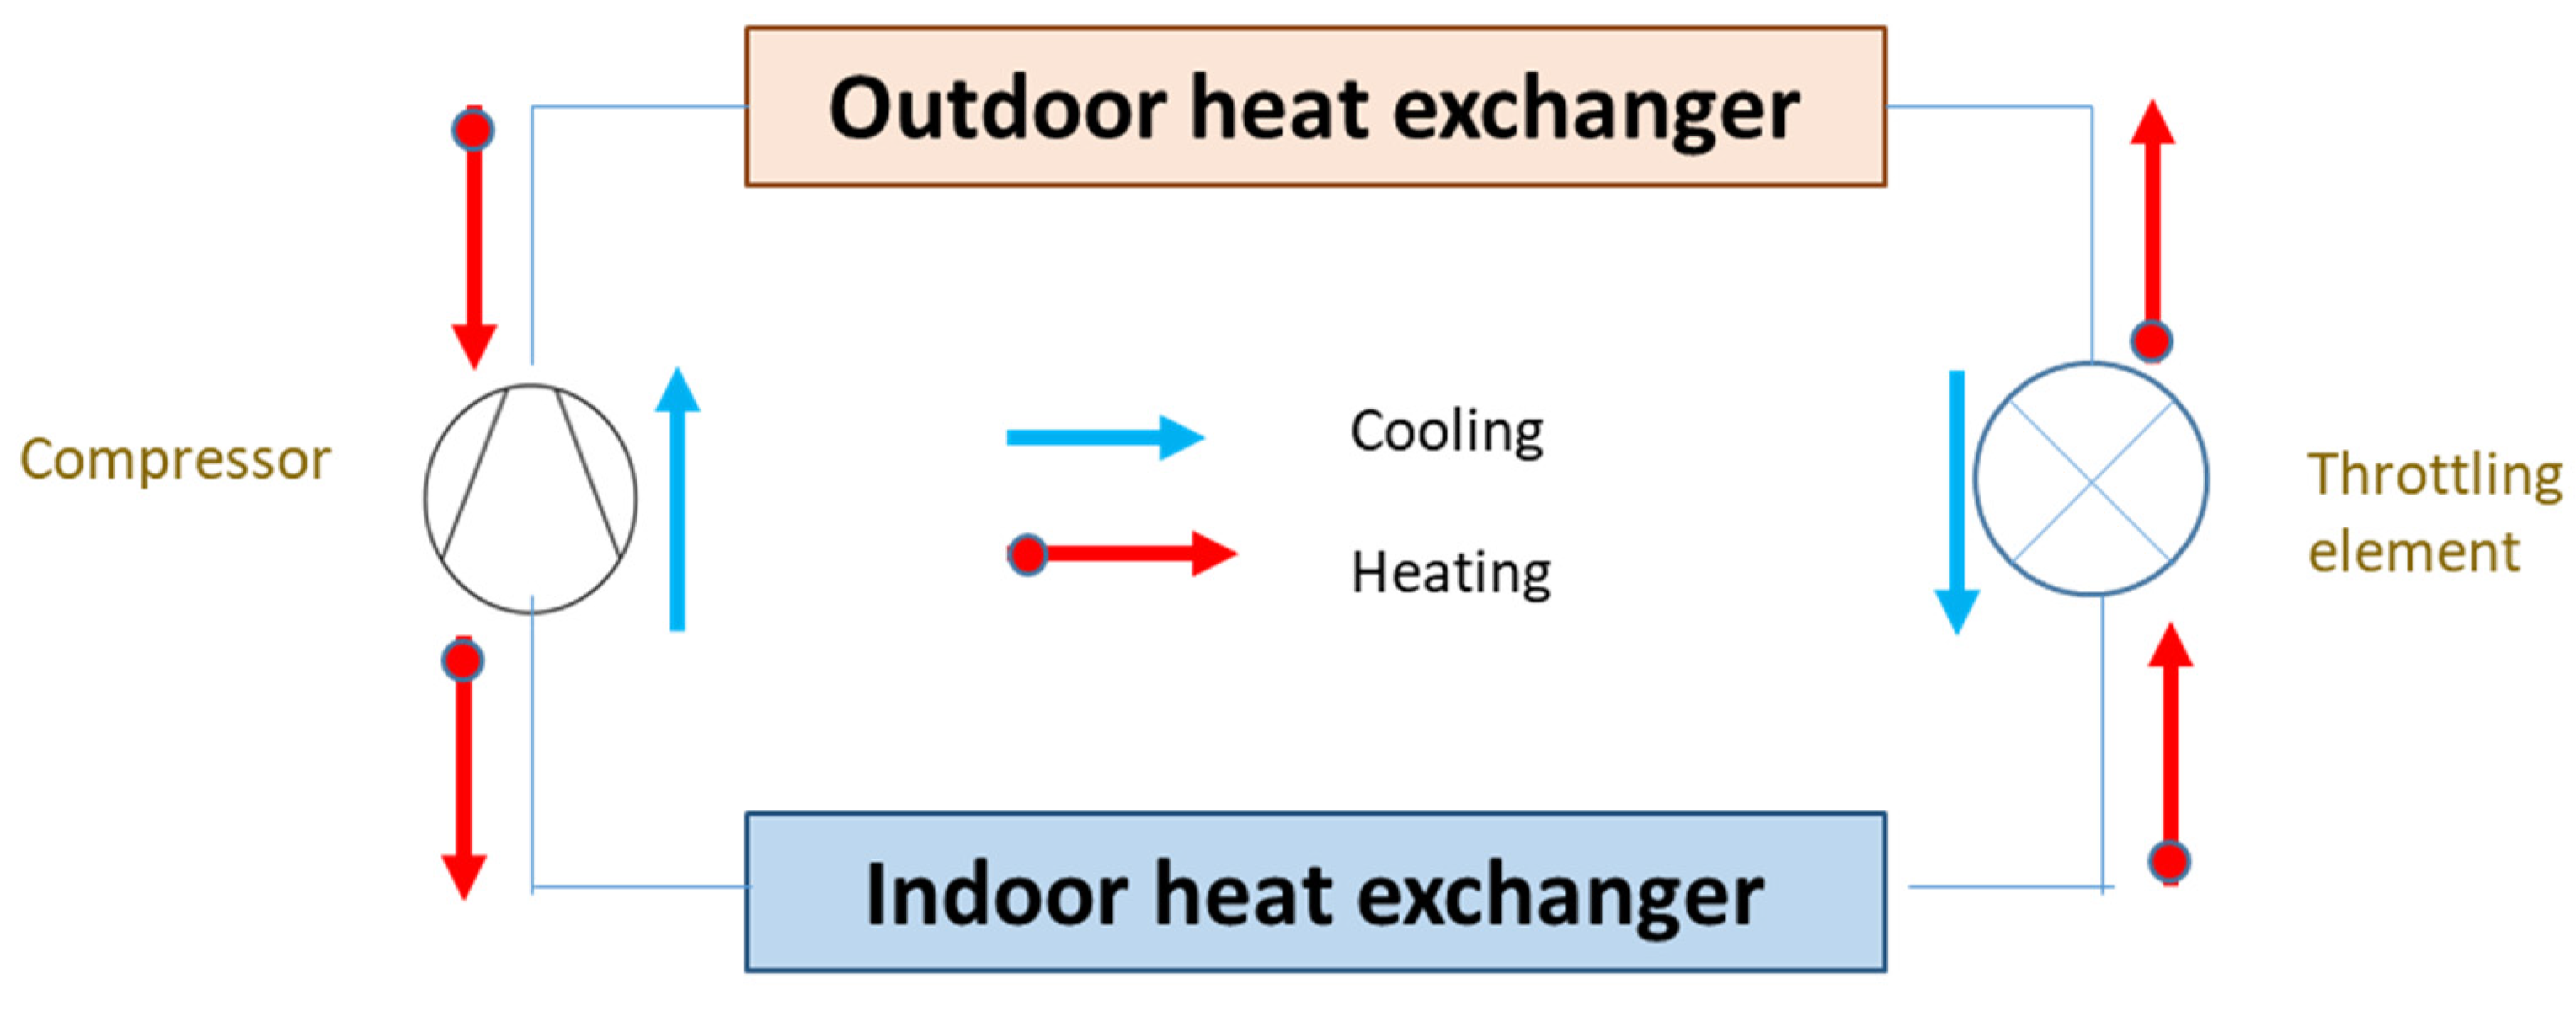
The operating principal of this air conditioning system is very simple, as shown in Figure 4. To cool the air inside a room, the compressor sucks low-temperature and low-pressure refrigerant gas, and with the help of a heat exchanger and a fan, it discharges high-temperature and high-pressure gas into the surrounding outdoor area and becomes high-pressure refrigerant liquid after transferring the latent heat. Then, a throttling element, usually an expansion valve, changes the high-pressure refrigerant liquid into low-temperature and low-pressure liquid and goes into the indoor heat exchanger. The internal fan helps the liquid evaporates and transforms into low-temperature and low-pressure refrigerant gas. The cycle continues to operate as long as there is a cooling demand. In this traditional system, there is a constant flow of refrigerant. It is an “on” and “off” mechanism so that when the compressor is performing its job, the entire refrigerant quantity is used in the process, whether the load is big or small, as long as there is a temperature difference and a need for cooling.
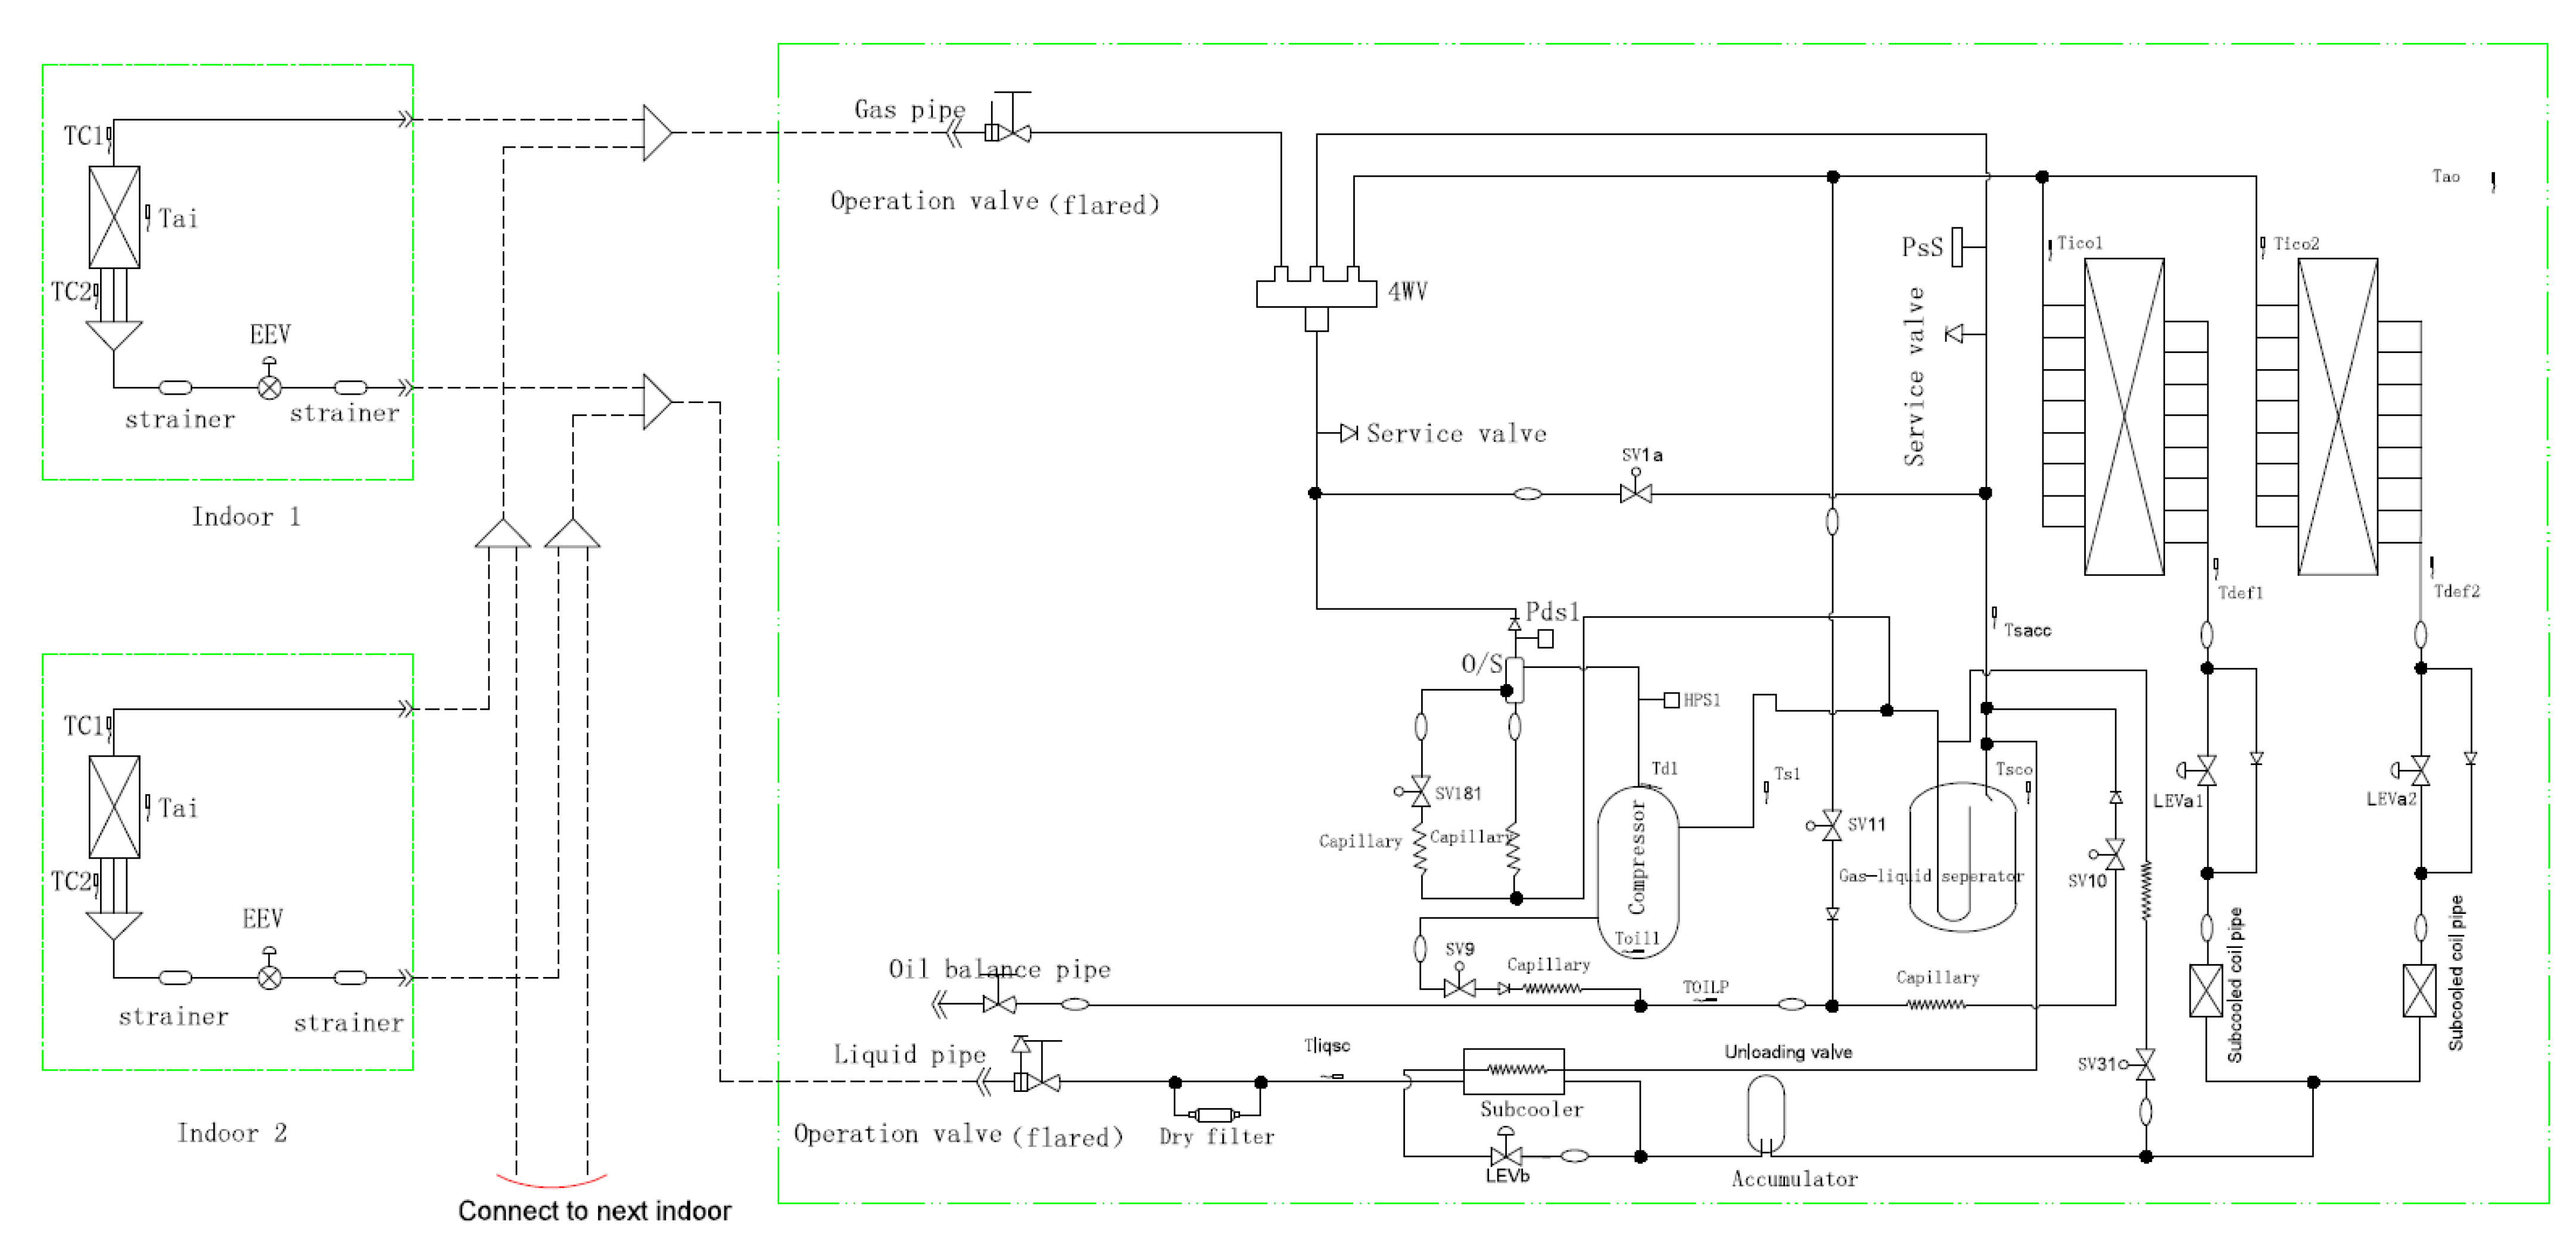
The VRF system allows us to connect multiple indoor units to a single outdoor unit or multiple ones if needed. The indoor units can vary between split, cassette, ducted, and other type of equipment [6]. In general, there are two piping configurations in a VRF system: the two-way and the three-way configuration. For this case study model, the cooling mode using only the two-way piping was studied, because the other configuration is generally used when there is a need for cooling and heating at the same time (Figure 5).
In the model used here, a VRF system for each office is considered. It comprises outdoor units depending on the total cooling capacity needed and indoor units as per the office layout. The total cooling system of one system cannot exceed 50 tons of refrigeration (TR) as per the manufacturer’s catalog. Two dedicated systems for all the common areas, such as corridors and elevator lobbies, were designed. Ducted indoor units were selected equal to CRF in order to focus the analysis on comparing the CRF and VRF outdoor units particularly in terms of energy savings, and generally in terms of life cycle cost analysis. In the following sections and after conducting a detailed heat load analysis, all the VRF system components were selected in detail. In this study, the ASHRAE Transfer Function Method (TFM) [27,28] was used for the calculation of the cooling load by using the well-known Hourly Analysis Program (HAP 4.9) [29,30,31] by Carrier (Carrier, Palm Beach Gardens, FL, USA), a company that provides solutions for air conditioning. The TFM method is a derivative of the Heat Balance Method and can predict the hourly cooling load of Al Muftah Plaza building. The heat transfer coefficients used in our study are listed in Table 1. For the cooling load estimation, it was assumed that the ‘design day’ is when there is relatively high humidity, little or no haze, and all internal loads are at their peak, which corresponds to the month of July. The HAP software utilizes the following input data before running the simulation: (1) climate data surrounding the building of interest; (2) information on the building material, such as that shown in Table 1; (3) the orientation of the building; (4) interior heat gain characteristics; (5) data on the HVAC system; (6) electricity tariff and energy source.

3. Results and Discussions

3.1. Cooling Loads

Hourly cooling loads of the sample building were calculated to determine the total cooling load required and to size the air conditioning system. After considering the external and internal heat parameters, the following total cooling load requirements were obtained, and they are divided into two groups: (a) rentable areas and (b) common areas. The cooling loads that were calculated are tabulated in Table 2 and Table 3 for rentable areas and common areas, respectively. The maximum cooling load required for the building is 466 TR, having its peak in the month of July, and that is the basis of the design.
Since this is an existing building, the installed units were checked and the data from the manufacturer was taken and is combined in Table 4 and Table 5 to compare against the calculated heat load in HAP (Table 2 and Table 3) and to be able to calculate the electrical cost of operations during our study. The total cooling load selected with the ducted units is 4% higher than the calculated load, which is acceptable and considered as a safety factor.
For the purpose of this study, the data sheets provided from York products from Johnson Controls were used for the VRF units, and the selection is shown in Table 6 and Table 7 along with the cooling capacities for both indoor units, which are matching with the ducted units and the outdoor units. It is clear that for multiple indoor units there is an outdoor VRF unit, and the combination ratio was kept as close as possible to 100% for the sake of having a fair comparison between the two systems. However, in real life, the VRF systems can allow for a combination ratio up to 130% depending on the projects’ requirements and the manufacturer’s recommendations. This will increase the energy savings of the system.

3.2. Life Cycle Cost Analysis

The life cycle cost (LCC) analysis adopted in this paper is very similar to that reported in the literature [32,33,34,35,36,37]. The net present value (NPV) is adopted in this paper to determine the LCC for both refrigeration systems. In order to have an accurate and fair comparison between the two air conditioning systems, a lifetime of 15 years was considered, and all the costs were taken into account, including initial, operating, and maintenance costs. The initial investment cost covers the main equipment of both systems such as the CRF and VRF units. Additionally, it covers the ducting, piping, insulation, dampers, grills and diffusers, and other accessories. The summary of the initial investment cost is tabulated in Table 8. The cost of diffusers and ducting works are the same since the same indoor unit quantities and capacities were selected in both systems. The VRF system is 23% more expensive than the traditional CRF system.
In this study, the outdoor units of both systems were compared and the indoor units were neglected since their electrical consumption is minimal compared to the outdoor units, and the same indoor units’ capacities in both systems were kept. Hence, the variation in the fans’ speed that is dependent on the cooling load is the same for the two type of systems and it was thus not considered in this study. First, the total power input required for the outdoor units of the CRF system was calculated to be 635 kW using the manufacturer’s datasheets. These numbers correspond to 100% of the cooling load capacity, since it is a constant refrigeration flow system as explained earlier.
Then, the power input for the VRF outdoor units was calculated at 100%, 75%, 50%, and 25% of cooling capacity, as shown in Table 9. Linear interpolation was also used to obtain the needed power input at these precise percentages. Based on the Air-Conditioning, Heating, and Refrigeration Institute (AHRI), the VRF units run on 100% load for 2% of the time only, while for the 75%, 50%, and 25% loads, they run 61.7%, 23.8%, and 12.5% of the time, respectively [38]. Most of the weight exists within the 50% and 75% loads with 85.5% of running hours. This is the main benefit of the VRF technology is using the variable speed compressors.
For this study, two operational scenarios are considered. The first scenario covers 12 h of air conditioning while the second covers 24 h, which is the case in Qatar, especially in the long summer season. The buildings cannot be left without air conditioning even at nighttime because of the high temperature and humidity. The average tariff obtained from Kahramaa (local power company, Kahramaa, Doha, Qatar) is 0.18 QAR per kWh, and it was used to calculate the total operating cost of the CRF and VRF systems in both scenarios. The air conditioning machines function 12 months per year, 25 days per months, and 12 h per day for the first scenario, and 24 h per day for the second scenario. The running time of the ducted units is 70% considering that the compressor rests once it reaches the set temperature point and restarts again when the inside temperature rises [39]. The operating cost is calculated by using the following formula:
Operating cost = sum of (weight × running hours) × Tariff
The details of the operating cost for both scenarios are tabulated in Table 10 and Table 11. The operating cost of the CRF is 38% higher than the VRF for both scenarios. Next, the maintenance cost is added and then the present worth value is used to determine the payback time over the years. The manpower needed to perform the maintenance works for both systems are almost identical because the number and capacities of indoor units are the same. Therefore, the cost of maintenance and spare parts used are the same except for the outdoor units, since the number of CRF outdoor units is 137 compared to 24 outdoor units for the VRF system. There is an additional cost of 18,000 QAR for the CRF system due to failing compressors per year [39].
The initial, operating, and maintenance costs for the two systems are developed in this study. A life cycle cost (LCC) analysis allows us to compare the CRF and VRF systems. The life of each system is considered to be 15 years. LCC analysis is based on the following interest and inflation rates, as depicted in Table 12. The present worth cost technique is used to compare the total costs (initial, operating, and maintenance) of the two alternative systems (CRF and VRF) taking into account the two operating scenarios (Scenarios 1 and 2) over the 15 years period.
An example of variation of overall present worth costs for both systems is shown in Figure 6 and Figure 7 for representation purposes. Based on Table 12, for Scenario 1 (12 h operation) the present worth cost for the VRF system is 7–15% lower if compared to the CRF system, and for Scenario 2 (24 h operation), the present worth cost for VRF system is 10–18% lower if compared to the CRF system. For longer operating hours, the VRF system shows a bigger advantage. The VRF cost is higher at the beginning, but after a certain number of years (approximately after 5 years) the VRF system becomes more economically efficient. The VRF system consumes less power input than the CRF system by 27% for both scenarios. This reduction can have a significant impact on a national level when implementing green building techniques such as the VRF technology in the air conditioning industry. The impact of the reduction in energy consumption due to VRF technology implementation can be appreciated through visualizing it through CO2 reduction [40]. In the equivalency calculator, the energy reduction can be converted to carbon dioxide-equivalent greenhouse gas emissions reduction. Details of this benefit are shown in Figure 8. In summary, by using VRF over CRF, an equivalent amount of 311,820 kg of CO2 greenhouse gas can be reduced.

4. Conclusions

When comparing the VRF and CRF systems in this study, the initial, operating, and maintenance costs were calculated for Al Muftah Plaza building in Qatar. The present worth cost method and the LCC analysis were used for two different scenarios. For Scenario 1 (12 h operation), the present worth cost for the VRF system is 7–15% lower if compared to the CRF system, and for Scenario 2 (24 h operation), the present worth cost for the VRF system is 10–18% lower if compared to the CRF system. For longer operating hours, the VRF system shows a bigger advantage. The VRF cost is higher at the beginning, but after a certain number of years (approximately after 5 years) the VRF system becomes more economically efficient. The power input needed for the VRF system is 27% lower than the CRF system, which can make a tremendous impact on a national level when sustainable energy methods are implemented such as the VRF technology. An equivalent amount of 311,820 kg of CO2 greenhouse gas is reduced by changing from CRF to VRF technology. VRF technology provides energy savings because the system consists of (1) a variable speed air cooling compressor, (2) reduced fan energy due to reduced ductwork, and (3) dedicated outside air systems with energy recovery [41]. Such new technologies like VRF should be investigated further to identify potential barriers to the market. As such, the next step forward is to investigate the usage of VRF in residential buildings and to develop strategies for implementing VRF systems.

Author Contributions

G.A.: Method Investigation, Computation, Implementation, Writing—Original Draft and Drawing. F.T.: Conceptualization, Methodology, Writing—Original Draft and Revision, Supervision. Both authors have read and agreed to the published version of the manuscript.

Funding

This research received no external funding.

Data Availability Statement

Not applicable.

Acknowledgments

The authors would like to acknowledge Al Muftah Contracting Company W.L.L. company (Doha, Qatar) for assisting this research in terms of providing useful field data and the usage of the transfer function method (TFM) through the software Hourly Analysis Program (HAP) by Carrier. The authors would also like to thank Qatar National Research Foundation (QNRF) (Doha, Qatar) for funding the open access fees for the publication of this manuscript.

Conflicts of Interest

The authors declare no conflict of interest.

References

  1. Layeni, A.T.; Olanrewaju, A.I.; Nwaokocha, C.N.; Waheed, M.A.; Giwa, S.O.; Kuye, S.I.; Adedeji, K.A. Comparative engineering economic analysis of a variable refrigerant flow and mini-split air conditioning system design. Arid Zone J. Eng. Technol. Environ. 2019, 15, 55–66. [Google Scholar]
  2. Department of Energy. An Assessment of Energy Technologies and Research Opportunities. Chapter 5: Increasing Efficiency of Building Systems and Technologies. In Quadrennial Technology Review; Department of Energy: Washington, DC, USA, 2015. [Google Scholar]
  3. Al-Badi, A.; Almubarak, I. Growing energy demand in the GCC countries. Arab. J. Basic Appl. Sci. 2019, 26, 488–496. [Google Scholar] [CrossRef] [Green Version]
  4. Sanaullah, A. Qatar Leads Region in District Cooling Regulation. Available online: https://thepeninsulaqatar.com/article/05/04/2020/Qatar-leads-region-in-district-cooling-regulation (accessed on 12 August 2021).
  5. Wan, H.; Cao, T.; Hwang, Y.; Oh, S. A review of recent advancements of variable refrigerant flow air conditioning systems. Appl. Therm. Eng. 2020, 169, 114893. [Google Scholar] [CrossRef]
  6. Aynur, T.N. Variable refrigerant flow systems: A review. Energy Build. 2010, 42, 1106–1112. [Google Scholar] [CrossRef]
  7. Patel, K.; Jain, P.K.; Koli, D.K. A review of a HVAC with VRF system. Int. J. Innov. Res. Sci. Technol. 2015, 1, 8–10. [Google Scholar]
  8. Hernandez, A.C.; Fumo, N. A review of variable refrigerant flow HVAC system components for residential application. Int. J. Refrig. 2020, 110, 47–57. [Google Scholar] [CrossRef]
  9. Kwon, L.; Hwang, Y.; Radermacher, R.; Kim, B. Field performance measurements of a VRF system with sub-cooler in educational offices for the cooling season. Energy Build. 2012, 49, 300–305. [Google Scholar] [CrossRef]
  10. Meng, J.; Liu, M.; Zhang, W.; Cao, R.; Li, Y.; Zhang, H.; Gu, X.; Du, Y.; Geng, Y. Experimental investigation on cooling performance of multi-split variable refrigerant flow system with microchannel condenser under part load conditions. Appl. Therm. Eng. 2015, 81, 232–241. [Google Scholar] [CrossRef]
  11. Kim, J.; Lee, J.; Choi, H.; Lee, S.; Oh, S.; Park, W.-G. Experimental study of R134a/R410A cascade cycle for variable refrigerant flow heat pump systems. J. Mech. Sci. Technol. 2015, 29, 5447–5458. [Google Scholar] [CrossRef]
  12. Crawley, D.B.; Lawrie, L.K.; Pedersen, C.O.; Winkelmann, F.C. Energy plus: Energy simulation program. ASHRAE J. 2000, 42, 49–56. [Google Scholar]
  13. Liu, X.; Hong, T. Comparison of energy efficiency between variable refrigerant flow systems and ground source heat pump systems. Energy Build. 2010, 42, 584–589. [Google Scholar] [CrossRef] [Green Version]
  14. Li, Y.M.; Wu, J.Y. Energy simulation and analysis of the heat recovery variable refrigerant flow system in winter. Energy Build. 2010, 42, 1093–1099. [Google Scholar] [CrossRef]
  15. Raustad, R.; Nigusse, B.; Domitrovic, R. Technical Subtopic 2.1: Modeling Variable Refrigerant Flow Heat Pump and Heat Recovery Equipment in Energy Plus; University of Central Florida: Orlando, FL, USA, 2013. [Google Scholar]
  16. Chung, M.H.; Yang, Y.K.; Lee, K.H.; Lee, J.H.; Moon, J.W. Application of artificial neural networks for determining energy-efficient operating set-points of the VRF cooling system. Build. Environ. 2017, 125, 77–87. [Google Scholar] [CrossRef]
  17. Cheung, H.; Braun, J.E. Performance comparisons for variable-speed ductless and single-speed ducted residential heat pumps. Int. J. Refrig. 2014, 47, 15–25. [Google Scholar] [CrossRef]
  18. Sun, H.; Ding, G.; Hu, H.; Ren, T.; Xia, G.; Wu, G. A general simulation model for variable refrigerant flow multi-split air condi-tioning system based on graph theory. Int. J. Refrig. 2017, 82, 22–35. [Google Scholar] [CrossRef]
  19. Yun, G.Y.; Lee, J.H.; Kim, H.J. Development and application of the load responsive control of the evaporating temperature in a VRF system for cooling energy savings. Energy Build. 2016, 116, 638–645. [Google Scholar] [CrossRef]
  20. Yu, X.; Yan, D.; Sun, K.; Hong, T.; Zhu, D. Comparative study of the cooling energy performance of variable refrigerant flow systems and variable air volume systems in office buildings. Appl. Energy 2016, 183, 725–736. [Google Scholar] [CrossRef] [Green Version]
  21. Guo, Y.; Li, G.; Chen, H.; Hu, Y.; Shen, L.; Li, H.; Hu, M.; Li, J. Development of a virtual variable-speed compressor power sensor for variable refrigerant flow air conditioning system. Int. J. Refrig. 2017, 74, 73–85. [Google Scholar] [CrossRef]
  22. Park, D.Y.; Yun, G.; Kim, K.S. Experimental evaluation and simulation of a variable refrigerant- flow (VRF) air-conditioning system with outdoor air processing unit. Energy Build. 2017, 146, 122–140. [Google Scholar] [CrossRef]
  23. Zhang, D.; Cai, N.; Gao, D.; Xia, X.; Huang, X.; Zhang, X. Experimental investigation on operating performance of digital variable multiple air conditioning system. Appl. Therm. Eng. 2017, 123, 1134–1139. [Google Scholar] [CrossRef]
  24. Sudhakar, K.; Winderl, M.; Priya, S.S. Net-zero building designs in hot and humid climates: A state-of-art. Case Stud. Therm. Eng. 2019, 13, 100400. [Google Scholar] [CrossRef]
  25. Ketwong, W.; Deethayat, T.; Kiatsiriroat, T. Performance enhancement of air conditioner in hot climate by condenser cooling with cool air generated by direct evaporative cooling. Case Stud. Therm. Eng. 2021, 26, 101127. [Google Scholar] [CrossRef]
  26. Al Horr, Y.; Tashtoush, B.; Chilengwe, N.; Musthafa, M.; Mohamed Musthafa Gulf Organisation. Operational mode optimization of indirect evaporative cooling in hot climates. Case Stud. Therm. Eng. 2021, 25, 100893. [Google Scholar] [CrossRef]
  27. Mao, C.; Baltazar, J.-C.; Haberl, J.S. Comparison of ASHRAE peak cooling load calculation methods. Sci. Technol. Built Environ. 2019, 25, 189–208. [Google Scholar] [CrossRef]
  28. Sassine, E.; Younsi, Z.; Cherif, Y.; Antczak, E. Thermal performance evaluation of a massive brick wall under real weather conditions via the Conduction Transfer function method. Case Stud. Constr. Mater. 2017, 7, 56–65. [Google Scholar] [CrossRef]
  29. Zaphar, S.; Sheworke, T. Computer Program for Cooling Load Estimation and Comparative Analysis with Hourly Analysis Program (HAP) Software. Int. J. Latest Technol. Eng. Manag. Appl. Sci. 2018, 7, 53–61. [Google Scholar]
  30. Ayadi, O.; Al-Dahidi, S. Comparison of solar thermal and solar electric space heating and cooling systems for buildings in different climatic regions. Sol. Energy 2019, 188, 545–560. [Google Scholar] [CrossRef]
  31. Alhamad, I.M.; Alsaleem, M.H.; Taleb, H. Natural ventilation potential strategies in warm winter climate zones—A case study of Dubai. In Proceedings of the 2018 Advances in Science and Engineering Technology International Conferences (ASET); IEEE: Piscataway, NJ, USA, 2018; pp. 1–4. [Google Scholar] [CrossRef]
  32. AlRwashdeh, S.S.; Ammari, H. Life cycle cost analysis of two different refrigeration systems powered by solar energy. Case Stud. Therm. Eng. 2019, 16, 100559. [Google Scholar] [CrossRef]
  33. Balbis-Morejón, M.; Cabello-Eras, J.; Rey-Hernández, J.; Rey-Martínez, F. Energy Evaluation and Energy Savings Analysis with the 2 Selection of AC Systems in an Educational Building. Sustainability 2021, 13, 7527. [Google Scholar] [CrossRef]
  34. Moschetti, R.; Brattebø, H. Combining Life Cycle Environmental and Economic Assessments in Building Energy Renovation Projects. Energies 2017, 10, 1851. [Google Scholar] [CrossRef] [Green Version]
  35. Fantozzi, F.; Gargari, C.; Rovai, M.; Salvadori, G. Energy Upgrading of Residential Building Stock: Use of Life Cycle Cost Analysis to Assess Interventions on Social Housing in Italy. Sustainability 2019, 11, 1452. [Google Scholar] [CrossRef] [Green Version]
  36. Neugebauer, S.; Forin, S.; Finkbeiner, M. From Life Cycle Costing to Economic Life Cycle Assessment—Introducing an Economic Impact Pathway. Sustainability 2016, 8, 428. [Google Scholar] [CrossRef] [Green Version]
  37. Shim, J.; Song, D.; Kim, J. The Economic Feasibility of Passive Houses in Korea. Sustainability 2018, 10, 3558. [Google Scholar] [CrossRef] [Green Version]
  38. AHRI Standard 1230 with Addendum 1; AHRI: Arlington, VA, USA, 2010; pp. 19–20.
  39. Al Muftah Contracting Company W.L.L. Available online: https://www.almuftah.com/our-companies/almuftah-contracting-company-civil (accessed on 12 August 2021).
  40. United States Environmental Protection Agency. Greenhouse Gas Equivalencies Calculator. Available online: https://www.epa.gov/energy/greenhouse-gas-equivalencies-calculator (accessed on 12 August 2021).
  41. Thornton, B.; Wagner, A. Variable Refrigerant Flow Systems; General Services Administration by Pacific Northwest, National Laboratory: San Francisco, CA, USA, 2012.
Figure 1. Electricity consumption in Qatar (a) per capita and (b) by sector; (c) climate and building energy demand modeling (image source: Andric et al., The results from climate and building energy demand modelling (30 August 2021), used under CC BY 4.0).
Sustainability 13 10374 g001
Figure 2. Simplified VRF diagram [5].
Sustainability 13 10374 g002
Figure 3. Case study building (Al Muftah Plaza).
Sustainability 13 10374 g003
Figure 4. Conventional operating system.
Sustainability 13 10374 g004
Figure 5. VRF system components.
Sustainability 13 10374 g005
Figure 6. Present worth cost for Scenario 1—12 h running (interest rate 3%, inflation rate 3%).
Sustainability 13 10374 g006
Figure 7. Present worth cost for Scenario 2—24 h running (interest rate 3%, inflation rate 3%).
Sustainability 13 10374 g007
Figure 8. The amount of CO2 reduction due to utilization of VRF technology in one building (case study).
Sustainability 13 10374 g008
Table 1. Values of the heat transfer coefficient (U).
Heat Gain SourcesU-Value (W/m2·K)
1Wall7.271
2Glass18.96
3Door9.67
4Roof2.94
5Partition16.12
Table 2. Required cooling load (rentable areas).
FloorAreaCalculated Capacity (TR)
Ground FloorShowroom-0119.9
Showroom-0227.9
First FloorOffice-123
Office-27.2
Office-324.1
Office-416.7
Typical Floor—2nd to 4th FloorOffice-169
Office-221.6
Office-372.3
Office-450.1
Fifth FloorOffice-123
Office-27.2
Office-324.1
Office-416.7
Table 3. Required cooling load (common areas).
FloorAreaCalculated Capacity (TR)
Ground FloorMain Entrance Lobby10.6
First FloorHallway With Male And Female W.C10.4
Second FloorHallway With Male And Female W.C10.4
Third FloorHallway With Male And Female W.C10.4
Fourth FloorHallway With Male And Female W.C10.4
Fifth FloorHallway With Male And Female W.C10.4
Table 4. Existing ducted units (rentable areas).
FloorAreaQTYSelected Capacity (TR)Total Capacity (TR)
Ground FloorShowroom-0163.3119.86
Showroom-0273.9627.72
11.311.31
First FloorOffice-143.9615.84
32.998.97
Office-223.967.92
Office-363.9623.76
11.941.94
Office-453.3116.55
Typical Floor—2nd to 4th FloorOffice-1123.9647.52
92.9926.91
Office-263.9623.76
Office-3183.9671.28
Table 5. Existing ducted units (common areas).
FloorAreaQTYSelected Capacity (TR)Total Capacity (TR)
Ground FloorMain Entrance Lobby21.633.26
13.313.31
First FloorHallway With Male And Female W.C13.963.96
23.316.62
Second FloorHallway With Male And Female W.C13.963.96
23.316.62
Third FloorHallway With Male And Female W.C13.963.96
23.316.62
Fourth FloorHallway With Male And Female W.C13.963.96
23.316.62
Fifth FloorHallway With Male And Female W.C13.963.96
23.316.62
Table 6. VRF selection (rentable areas).
FloorAreaQuantity VRF Indoor UnitsCapacity (TR)Total Capacity (TR)Quantity VRF Outdoor UnitsCooling Capacity (TR)Total Capacity (TR)Ratio (%)
Ground FloorShowroom-0163.3319.98119.3619.36101.2
Showroom-0273.7526.25126.326.3101.8
11.731.73
First FloorOffice-143.7515123.8823.8898.8
32.818.43
Office-223.757.518.198.1990.8
Office-363.7522.5124.5124.5199.8
11.91.9
Office-453.3316.65117.0617.0699.5
Typical Floor—2nd to 4th FloorOffice-1123.7545323.8871.6498.8
92.8125.29
Office-263.7522.538.1924.5790.8
Office-3183.7567.5324.5173.5399.8
31.95.7
Office-4153.3349.95317.0651.1899.5
Fifth FloorOffice-143.7515123.8823.8898.8
32.818.43
Office-223.757.518.198.1990.8
Office-363.7522.5124.5124.5199.8
11.91.9
Office-453.3316.65117.0617.0699.5
Table 7. VRF selection (common areas).
FloorAreaQuantity VRF Indoor UnitsCapacity (TR)Total Capacity (TR)Quantity VRF Outdoor UnitsCooling Capacity (TR)Total Capacity (TR)Ratio (%)
Ground FloorMain Entrance Lobby23.757.5131.6131.6199
13.333.33
First FloorHallway With Male And Female W.C13.753.75
23.336.66
Second FloorHallway With Male And Female W.C13.753.75
23.336.66
Third FloorHallway With Male And Female W.C13.753.75131.6131.6197.7
23.336.66
Fourth FloorHallway With Male And Female W.C13.753.75
23.336.66
Fifth FloorHallway With Male And Female W.C13.753.75
23.336.66
Table 8. Initial investment cost.
CRF Cost (QAR)VRF Cost (QAR)
CRF equipment720,000
VRF equipment 1,289,000
Ducting/dampers/insulation902,000902,000
Piping + insulation373,000350,000
Diffusers387,000387,000
Total2,382,0002,928,000
Table 9. Power input for VRF outdoor units (kW).
Load100%75%50%25%
Power Input (kW)581.82402.17234.8449.93
Table 10. Operating cost (Scenario 1).
Scenario 1 (12 h) Operating Cost (QAR)
LoadingWeightageRunning Hours per YearkWh VRFkWh CRFVRFCRF
100%2%7241,8911,598,842208,597287,792
75%61.70%2221893,300
50%23.80%857201,211
25%12.50%45022,469
Total3,6001,158,8701,598,842
Table 11. Operating cost (Scenario 2).
Scenario 2 (24 h) Operating Cost (QAR)
LoadingWeightageRunning Hours per YearkWh VRFkWh CRFVRFCRF
100%2%9655,8552,131,789278,129383,722
75%61.70%29621,191,067
50%23.80%1142268,281
25%12.50%60029,958
Total48001,545,1612,131,789
Table 12. Sensitivity analysis of varying inflation and interest rates.
Analysis Type
Rate CategoryA1A2A3A4A5A6A7A8A9
Inflation (%)036036036
Interest (%)3334.654.654.65777
Publisher’s Note: MDPI stays neutral with regard to jurisdictional claims in published maps and institutional affiliations.

