Article

Environmental and Climate Challenges to Agriculture in Poland in the Context of Objectives Adopted in the European Green Deal Strategy

by
Konrad Prandecki
1,*,
Wioletta Wrzaszcz
1 and
Marek Zieliński
2
1
Department of Agricultural Economics, Agricultural Policy and Rural Development, Institute of Agricultural and Food Economics, National Research Institute, 20 Świętokrzyska St., 00-002 Warsaw, Poland
2
Department of Economics of Agricultural and Horticultural Holdings, Institute of Agricultural and Food Economics, National Research Institute, 20 Świętokrzyska St., 00-002 Warsaw, Poland
*
Author to whom correspondence should be addressed.
Sustainability 2021, 13(18), 10318; https://doi.org/10.3390/su131810318
Submission received: 4 August 2021 / Revised: 2 September 2021 / Accepted: 7 September 2021 / Published: 15 September 2021

Abstract

:
The European Green Deal strategy, prepared in 2019, involves a number of challenges for European agriculture. These challenges are broadly linked to a need for agriculture to undertake actions in order to improve environmental and climate protection, which will require changes in agricultural practices and the currently observed industrialization processes of agriculture that are destabilizing ecosystems and climate. In view of the diversity of agriculture and its impacts on the environment, it is important to identify the challenges faced by the EU Member States. The aim of this paper is to identify the main environmental and climate challenges that agriculture in Poland will have to face due to the current European Green Deal strategy and its objectives, taking into account the organizational changes in this sector so far and the existing forms of environmental protection in rural areas. The paper is based on empirical data from the Farm Structure Survey conducted by Statistics Poland in 2005, 2007 and 2016, data on greenhouse gas emissions of agricultural origin gathered by the National Centre for Emissions Management (KOBiZE), data from the European Commission, the General Directorate for Environmental Protection and the Institute of Soil Science and Plant Cultivation—State Research Institute concerning the delimitation of the Natura 2000 areas in Poland and the Institute of Agricultural and Food Economics—National Research Institute on three national variants of High Nature Value Farmland areas delimited for the needs of the European Commission, as well as data from the Ministry of Agriculture and Rural Development regarding the delimitation of the less favoured areas with high natural value. In addition, a literature review was conducted indicating the links between agriculture, the environment and climate. The results of the study illustrate the state of Polish agriculture and the changes in this sector in the context of environmental and climate challenges. The results also identify the most difficult areas that will require practical solutions in the future to implement the European Green Deal strategy in Poland. The findings will provide an important basis for policy makers in terms of effective support of agriculture and for the scientific community with regard to agricultural research, which should be particularly developed in order to be able to adapt the agricultural sector to new challenges.

1. Introduction

Growing environmental and climate problems are forcing the search for effective solutions in economic activities, including agriculture. Great importance in this regard is attributed to the popularization of appropriate production practices. The direction of development of European agriculture is of particular importance for solving environmental and climate problems. Strategies and sustainability programmes have been in place for years and, despite initiating the desired direction of change in agriculture, are still insufficient in relation to the identified needs. In December 2019, the European Commission issued a Communication on the European Green Deal Strategy [1], which was intended to launch further international action to achieve ambitious climate and environmental objectives.
According to the European Commission premises, the European Green Deal is a new growth strategy aimed at building a modern, resource-efficient and competitive economy that will achieve net-zero greenhouse gas emissions by 2050, in which economic growth will be decoupled from the use of natural resources. The strategy aims to protect and improve the EU’s natural capital and to protect citizens’ health and well-being from environmental risks and adverse effects [1]. Community action is intended to put the European economy and society on a sustainable track, and this transformation affects all sectors of the economy, including agriculture. The European Green Deal is part of the objectives of the UN 2030 Agenda for Sustainable Development and the Sustainable Development Goals.
The Farm to Fork strategy and Biodiversity Strategy for 2030, which are key parts of the planned transition, are at the centre of the European Green Deal. They emphasize a new and better balance between nature, food systems and biodiversity in order to protect the health and well-being of citizens while increasing the EU’s competitiveness and resilience [2,3]. Taking into consideration increasing consumers’ interests in the nutritional value of food with special properties, food produced in Europe should be safe, nutritious and of high quality, and the way it is produced should be safe for the natural environment and climate neutral. The development of such considerations requires introducing some changes at various stages of the food chain. Farmers are at the beginning of the food chain, which determines their decisive role in the implementation of “Farm to Fork” and the Biodiversity Strategy. However, it should be stressed that the effectiveness of the agricultural sector in implementing the actions included in these two strategies will depend on future actions taken by farmers. These activities, as part of their agricultural practices, should combat climate change, protect the natural environment and not detract from biodiversity.
One of the EU’s priority areas of action is combating climate change. The European Commission aims to achieve climate neutrality in the 2050 perspective [4], which should be considered a necessary but very ambitious target. Achieving this target requires the introduction of both mythological measures, i.e., further reductions in greenhouse gas emissions and adaptation to changing climatic conditions. The scale of these changes and the need for long-term planning necessitate the creation of a new section of Community law—climate law, the redesign of the existing climate strategy and the adaptation of the EU sectoral policies to the objective of climate neutrality.
These changes will also include agriculture, which is one of the sectors strongly linked to the changing climate. On the one hand, agricultural production is dependent on climate conditions, and, on the other hand, agriculture is considered one of the more serious sources of greenhouse gas emissions, accounting for less than 10% of Community emissions (excluding the LULUCF sector—Land Use, Land Use Change and Forestry sector) [5]. At the same time, due to the specific nature of agricultural processes, emission reduction opportunities are difficult to implement. This means that climate policy can have a significant impact on the future shape of agriculture in the EU.
The changes caused by the adoption of the European Green Deal strategy will create both new opportunities and challenges. The fundamental problem may be a change in thinking about the environment and nature in the context of business. As long as there is no conviction in the public consciousness of the benefits of biodiversity conservation, there will be a belief that costs are the dominant role in the actions taken. However, this requires internalizing the value of biodiversity into the economic calculus.
An important way for the EU agricultural sector to make an additional contribution to the Farm to Fork and Biodiversity strategies in the 2030 perspective and the demands specified in its proposal for climate law will be to take appropriate action under the new EU Common Agricultural Policy (CAP). According to the findings of the European Parliament and the Council so far, the next CAP, which is due to enter into force on 1 January 2023, will place even greater emphasis on promoting smart, resilient and diversified agriculture, while ensuring food security and increasing environmental and climate concerns. The new CAP will be an asset to increase its alignment with local (regional) needs and the environmental and climate risks in particular in individual EU Member States, but at the same time, it will increase the responsibility of Member States for the proper implementation of this policy [6]. There is therefore a need to identify and assess the possibility for national agriculture to meet the EU’s ambitious environmental and climate challenges.
The aim of the paper is to identify the main environmental and climate challenges that agriculture in Poland will have to face due to the current strategy of the European Green Deal and its objectives, taking into account the organisational changes in this sector so far and the existing forms of nature protection in rural areas.
The main aim of the paper was achieved by three detailed purposes:
  • The identification of current organisational changes observed in agriculture that are particularly important in the context of implementing the European strategy of environmental and climate protection;
  • The evaluation of the state of biodiversity protection based on legal forms of the environmental protection of rural areas;
  • The assessment of tendencies in greenhouse gas emission of agricultural origin.

2. Theoretical Background

Agriculture is an important sector of the economy, both in Poland and in other countries of the world. The volume of agricultural production determines the possibilities of ensuring food security. At the same time, the scope of agricultural practices provided determines the impact of agriculture on the state of the natural environment, the absorption of environmental components, as well as the impact on the climate, including the scale of greenhouse gas emissions. Considering the natural environment in agricultural activities is a prerequisite for its continuation. The appropriate state of the natural environment is an elementary basis for agricultural activity, without which it would not have been possible to carry it out. These dependencies exaggerate the importance of broadly understood agricultural practices in the context of the implementation of the European Green Deal strategy, which will be tooled by the 2020+ CAP instruments. In economic practice, the quantity and quality of water and soil, as well as the state of biodiversity of the ecosystem, are usually not taken into account. Due to the time-shifting environmental impacts of current production decisions, the issue of natural resources—their quantity and quality—and their importance in shaping the future production and economic performance of the farm is often overlooked in the economic decision-making process.
Climate change is, among others, a side effect of human activity. Obviously, it also originates in natural processes, but scientific findings and statistics clearly show that climate processes are increasingly violent, unnatural in nature and that the scale of human impact on the climate is large enough to reach tipping point, causing an imbalance in nature [7]. In particular, increased greenhouse gas emissions into the atmosphere as a direct factor in today’s climate change are mainly considered to be the result of human activity. Increased greenhouse gas (GHG) levels cause many phenomena that affect the accelerated heating of the Earth’s atmosphere, which in turn contributes to the disturbance of climatic conditions on Earth. As a result, climate change involves not only an increase in temperature, but also changes in, among others, precipitation, humidity, wind force and the occurrence of snow cover, which affect the occurrence of species of flora and fauna in a given ecosystem. In this context, the findings of the European Commission [8], as well as Houghton [9] and Cowie [10], are therefore of particular concern, stressing that even if decisive global action is now taken to halt all greenhouse gas emissions, their effects on the world could be felt for decades to come. One of them may therefore be a further loss of biodiversity.
Due to the deteriorating state of the natural environment in the EU, including the increasing effects of climate change, in December, the European Commission prepared a Communication on the European Green Deal. The communication aimed to initiate international action to achieve economic objectives with much stronger respect for environmental and pro-climate practices [1]. It updates the EC’s commitment to address climate and environmental problems, which have been identified as the most important task facing society today. The implementation of the European Green Deal requires a number of measures to improve the natural environment and stabilise the climate by developing effective European actions. Dozens of initiatives are planned for the period 2020+. The agricultural sector is directly linked to the Farm to Fork Strategy, the Biodiversity Strategy and the Climate Pact.
The aim of the Farm to Fork strategy is to create a fair, healthy and environmentally friendly food system. The strategy identifies the main objectives for the different agricultural practices that should be achieved by 2030, namely [2]:
  • The use of pesticides. The objective is to reduce the use of chemical pesticides and their risks by 50 percent; more dangerous pesticides should be reduced by 50 percent. The negative impact of pesticide use in agriculture on soil, water and air pollution was identified as a justification for the adopted objectives.
  • The use of fertilizers. The objective is to reduce nutrient losses by at least 50 percent without allowing soil fertility to deteriorate and a 20 percent reduction in the use of fertilizers. Nutrient surplus in the environment is an important source of air, soil and water pollution, having a negative impact on biodiversity and climate, which has led to the adoption of targets for rationalizing the management of fertilizers on farms.
  • The sale of antimicrobials. In this respect, the objective was to reduce by 50 percent the sales of antimicrobials intended for farmed animals and used in aquaculture. This is due to the increase in the resistance of microorganisms to anti-remedies, resulting from their widespread use in the treatment of animals and humans. The increase in this resilience leads to around 33,000 deaths in the EU every year, which prejudges the need for changes in European agriculture in this area.
  • The popularization of organic farming. An ambitious target has been adopted in this area, namely: the area of agricultural land used in accordance with the principles of organic farming should be 25 percent. The adoption of such an ambitious target was determined both by its importance in the conservation of environmental resources (environmentally friendly agricultural practices) and its positive impact on the climate and biodiversity. The implementation of the Farm to Fork strategy should contribute to the application of solutions that fit into the circular economy.
Farming requires the involvement of the basic components of the natural environment and the physical space of land. The objectives set out above for European agriculture involve adequate soil management, thereby posing a number of organizational challenges to agricultural practice. This is a specific kind of good, because the land is an example of the private and public good. The scarcity of this resource highlights the need for its due protection. The soil is not merely a factor of production, a spatial basis for economic activity [11], a component of fixed assets in balance sheet terms or private good in generic terms, but a place of natural production and environmental processes, cultural and symbolic value [12]. According to Schumacher, the soil is man’s greatest wealth [13]. The useful value of the soil changes under the influence of agrotechnical procedures, and the quality of these treatments affects the viability of microorganisms, which further determines the fertility of the soil [14,15]. Soil is the main storage of carbon on land. The more that carbon accumulates in the soil, the less carbon dioxide (CO2) will be in the atmosphere, reducing progressive climate change. However, soil can also be a source of greenhouse gases, and specifically agricultural practices can cause nitrogen gas emissions into the atmosphere. The soil should be properly treated in the agricultural production process through agricultural practices ensuring its high quality, as well as appropriate agrotechnology to protect production capacity, regulate water relations, protect the land against erosive capacity, etc. The result of proper land management are extensive external benefits, such as biodiversity conservation and climate stabilisation.
The announcement of the European Green Deal also results in the EU Biodiversity Strategy 2030 [3]. Its primary objective is to ensure the restoration, resilience and adequate protection of all ecosystems by 2050. The role of ecosystems is enormous, as they also perform various essential functions for humans, providing food, fresh water, clean air and shelter for many species, further reducing the occurrence of pests and diseases and contributing to climate regulation. As indicated in the report presented by the Intergovernmental Scientific and Political Platform on Biodiversity and Ecosystem Functioning [16], global biodiversity is declining as a result of changing land use and marine waters, the direct exploitation of natural resources, as well as climate change.
In the EU, there are still negative changes occurring in the environment. The conditions of many valuable natural habitats related to the agricultural sector are deteriorating. Moreover, the number of birds in the agricultural landscape and the population of wild bees are declining [17,18,19]. This is particularly worrying in terms of the Natura 2000 areas and areas with extensive agriculture conducted in adjacence of valued environmental components designated within delimitation of the High Nature Value farmlands (HNVfs) in the EU [20,21,22,23,24]. These problems intensify the need for the EC to develop a biodiversity strategy aimed at increasing protected areas particularly valuable to biodiversity, including the Natura 2000 areas [1]. The achievement of the goals for 2030 is to be carried out through two pillars of actions. First of all, the EU will continue actions in order to prepare a coherent network of protected areas. Secondly, steps will be taken to develop an ambitious environment recovery plan. In the next 10 years, the network of valuable natural areas will be extended to 30% of the total area of the EU. In addition, around 10% of agricultural areas will include components of landscapes with high diversity, such as buffer zones, hedges, wastelands, non-productive trees, wetlands and others. It should be emphasized that their value is important in the process of CO2 sequestration, in the limitation of wind and water erosion and in the better adaptation to and mitigation of climate changes.
The European Commission aims to achieve climate neutrality by 2050 [4]. This objective will be pursued gradually. The effort is now focused on achieving at least a 55% reduction in greenhouse gases compared to the 1990 levels. This objective is to be achieved by 2030 for the entire European Union. The climate targets adopted for the coming years must undoubtedly be considered ambitious, forcing changes in specific sectors and the implementation of solutions corresponding to the circular economy. The changes made should be considered appropriate, but at the same time, they have not been fully implemented. An EU-wide reduction target has been set, but at the same time, no decisions have been taken on the binding recreation of country-specific targets or their distribution between various reduction mechanisms, i.e., the European Union Emissions Trading System (EU-ETS) and the Effort Sharing Regulation (ESR) [25]. In addition, there is a discussion within the EU on the reform of the LULUCF Regulation, which could have a significant impact on the shape of climate policy. One of the proposed solutions is to combine the agricultural sector with the LULUCF in order to jointly account for emissions and set a separate reduction target for them.
Agriculture accounts for around 24% of global greenhouse gas emissions [26]. These emissions mainly come from three sources, i.e., carbon dioxide (CO2), nitrous oxide (N2O) and methane (CH4). In the case of CO2, the emission value is considered to be comparable to the capacity of cultivated crops to absorb it [27]. For this reason, attention is mainly focused on the other two gases, which are more harmful than CO2. It is estimated that agriculture is responsible for around 60% global emissions of N2O and 50% of CH4. Agriculture is therefore one of the most important economic sectors in terms of responsibility for climate change.
The Common Agricultural Policy plays an important role in popularizing the desired activities in agriculture. The functioning of EU agriculture is based on the principles of the CAP, which was one of the first Community policies. Since the early 1990s, successive reforms have become increasingly linked to the need to protect the environment and climate. The first major reform was the MacSharry reform of 1992, then the Agenda 2000. Further significant changes to the Common Agricultural Policy took place in 2003, when the Fischler reform (the so-called Luxembourg) was introduced, and in 2013, another important reform was introduced, which was finally adopted in 2015. Its aim was to promote sustainable agriculture and innovation. This reform resulted in the introduction of a greening mechanism aimed at European farmers’ compliance with sustainable agricultural practices aimed at protecting the soil and protecting biodiversity [28]. Work is currently underway on the new agricultural policy financial perspective (2020+). The changes of the instruments should serve the objective achievement set out in the European Green Deal Strategy. The novelty of the Common Agricultural Policy development will be the new enhanced conditionality and the introduction of eco-schemes.
The objectives set out in the European Strategy should be considered ambitious but at the same time necessary in the context of the observed processes taking place in the environment and climate. Despite future potential difficulties in achieving them, it is necessary to create solutions to improve the current state towards the intended one—sustainable development. Increasing climate change and environmental problems (including pollution and depletion of its resources, declining biodiversity) force additional systemic international action, often based on new legal guidelines and European standards. The European Environment Agency identifies several important areas where action needs to be taken to make change possible. These areas include: (a) strengthening ways of implementing, integrating and cohering policies; (b) developing a more systemic, long-term policy frameworks and related objectives; (c) pursuing international actions towards sustainable development; (d) promoting innovation through social action; (e) increasing investment and reorienting finances; (f) managing risk and ensuring socially just transitions; and (g) connecting knowledge with action [29]. The European Green Deal strategy should contribute to accelerating agricultural change in the intended direction, i.e., on the one hand, to stepping up efforts to achieve the objectives pursued and, on the other hand, to mitigating the negative effects and external costs of these economic processes, which will be carried out as a result of market and global conditions. It is therefore important to outline the problem areas that will challenge the agricultural sector, then develop corrective actions, including building the ecological awareness of society, especially farmers, and promoting the desired environmental and climate action. Taking into consideration the significant fragmentation of agriculture in Poland, it is particularly important to implement appropriate agricultural practices in as many farms as possible. These issues will be discussed in this paper.

3. Materials and Methods

Taking into consideration detailed aims of the paper, the methodological part consists of three paragraphs corresponding with subsequent aims presented in introduction.

3.1. Evaluation of Agriculture Organization

The research was based on public data from Statistics Poland, namely, the 2005, 2007 and 2016 Farm Structure Survey (FSS) results. These data were collected on the basis of a uniform methodology that made it possible to investigate trends in Polish agricultural sector, including organic farming. The analysis concerns all individual agricultural holdings with at least 1 ha of agricultural land in a good agricultural and environmental condition. Additionally, sectoral data were used, prepared by the Institute of Agricultural and Food Economics—National Research Institute, concerning specific market analysis for the indicated years, as well as the European Medicines Agency for available and comparable data, e.g., 2011 and 2018 [30,31,32,33], for the sector. They analysed the features of the agricultural sector of Poland in the context of the European Green Deal objectives. The general picture of agriculture of Poland covered farms’ characteristics concerning their production and economic potential, as well as typology. The direction of farms’ development was indicated, which was the basis of the main environmental challenges for agriculture designation. The research focused on fertilizer management (use of fertilizers and balances), use of plant protection products, development of organic farms, as well as antibiotic use. Presented statistics for the agricultural sector correspond with the main purpose presented in the Farm to Fork strategy of the European Green Deal.

3.2. Biodiversity Evaluation

One of the elements of the European Green Deal is a strategy for the protection of biodiversity by 2030. The basic aim of this strategy will be to provide legal protection of at least 30% of land and sea areas with high natural value, including strict protection of least 10% of these areas. In this context, it becomes important to assess the current state of national areas with high natural value and to identify opportunities to strengthen their contribution by 2030. It is also important to establish selected characteristics concerning agriculture in municipalities (gminas) with different saturation of areas with high nature value.
In Poland, biodiversity is primarily protected by the Natura 2000 network, in which rural areas are an important element. In addition to the potential of national areas, the protection of biodiversity is also determined by the HNVfs areas, which were designated for the needs of the Ministry of Agriculture and Rural Development (MARD) and the European Commission under the current CAP [24]. It should be emphasized that the HNVfs indicator—expressed as the share of HNVfs in total utilised agricultural area (UAA)—is 1 of 32 agro-environmental indicators developed by Eurostat for monitoring the impact of agriculture on the environment and 1 of 45 context indicators for monitoring the effects of actions under the current CAP [34]. In Poland, the designation of HNVfs areas was conducted in accordance with methodology of their delimitation adopted in the EU [22,23]. It should be added that, in Poland, the methodological approach to designating HNVfs areas is similar to that used in Germany, where such areas are also divided into three zones, namely, zones with (1) exceptionally high natural value, (2) very high natural value and (3) moderate natural value [35,36].
The high importance of areas supporting biodiversity in Poland is also indicated by the value of the Natural and Tourist Value Index (NTVI), which is the share of value components of the environment including permanent grasslands, forests, waters reservoirs and other areas not subjected to anthropopressure in total area and located in adjacent of all UAA of each gmina. The advantage of this indicator is the possibility of indicating areas favourable to protection of biodiversity in terms of gminas with the Natura 2000 and HNVfs areas and others. This indicator was established by the Institute of Soil Science and Plant Cultivation—State Research Institute (ISSPC-SRI) in order to establish (from 2019) a zone of national Less-Favoured Areas with specific natural constraints (LFA specific type zone I) [37,38,39,40]. The need for conducting this work resulted from the guidelines of the European Commission (EC) and arrangements specified in the Regulation of the European Parliament and Council no. 1305/2013, according to the selection of LFA characterized by specific natural constraints should ensure continuation of land management in order to protect the environment and maintain tourist potential of these areas [6,41].
The analysis of the Natura 2000 areas in Poland was based on the data from the EC for 2020; the Generate Directorate for Environmental Protection (GDEP) and the ISSPC-SRI for 2018. In the analysis of the national HNVfs areas, data from the ISSPC-SRI and the IAFE—NRI for 2018 were used [24,38,42]. In addition, the ISSPC-SRI data for 2017 regarding the value of the NTVI in terms of gminas and the MARD data for 2019 regarding the LFA areas with specific natural constraints in Poland were used [43].
In addition, this study indicated selected characteristics for gminas with different saturation of high nature value areas. This type of analysis was conducted for gminas where the share of the Natura 2000 areas in total area and the share of the HNVfs areas in total UAA of gminas was over 90% in comparison to gminas without such areas. To achieve this goal, the data from the Agency for Restructuring and Modernization of Agriculture (ARMA) for 2019 and ISSPC-SRI for 2017 were used.

3.3. Evaluation of Climate Aspect of Agriculture

Two types of information sources were mainly used to assess climate challenges. Firstly, these are the national and EU strategies and legal regulations which indicate the commitments to reduce greenhouse gas emissions and the paths to achieve the targets.
Secondly, statistical data have been used to assess the implementation of the European Green Deal in the context of climate change. Their use is only complementary. They mainly serve to show the scale of the problems and to verify the assumptions made. For this purpose, data on GHG emissions of agricultural origin published by the National Centre for Emissions Management (KOBiZE) were used. These are the data that are used to report national emissions to the Community, as part of global agreements, and are used by the national statistical office.
Information from the above sources was supplemented by relevant scientific studies. The reasoning was based on a critical analysis of the above sources of information.

4. Results

4.1. The General Data about Agriculture

After the accession of Poland to the EU in 2004, agriculture has changed significantly in terms of the number of farms and their production profiles. There was a decrease in the number of farms by almost one-fifth compared to 1.7 million farms (with at least 1 ha of agricultural land) in 2005. In 2016, there were 1.4 million individual farms with an average surface about 9 ha of agricultural land. The majority of farms have an area of up to 5 ha (54%; 2016). Simultaneously, the total area of agricultural land in a good agricultural condition was around 13 million, while the standard output of the sector was EUR 21,824 million (2016). In the analysed years, about two-thirds of farms in total were characterised by average standard production up to EUR 8000, which qualified the farms to the class of very small units. During this period, there were significant changes in the field of the carried out agricultural production. Many farms resigned from livestock production—the number of farms with livestock decreased by 43% (from 1.3 million farms in 2005 to 713,000 farms in 2016). This was tantamount to the growing population of non-livestock farms [44]. In the last decade, the process of farm specialization has been observed—the number of specialized agricultural holdings increased significantly (mainly farms specialized in field crops) at the expense of those with mixed production (especially with mixed livestock and crop production). In 2016, 64% all farms were specialized in crop production (in the fields of permanent crops, horticulture), while 11% specialized in rearing grazing livestock and 2% in granivores (pigs and poultry). Simultaneously, mixed farms, especially those with livestock production, are not numerous and were additionally reduced over the analysed period (in 2016, 23% of farms were qualified as mixed farms based on the value of standard output). A significant part of non-specialized farms relinquished from livestock production during this period, solely or mainly in favour of field crops. The presented changes in the amount and profile of farming at the sectoral and farm levels determine the general supply for agricultural means of production, e.g., fertilizers, plant protection products and medicines for rearing livestock.

4.2. Agriculture vs. Farm to Fork Strategy

The Farm to Fork strategy draws attention to a few aspects connected with production organization—crop and livestock agricultural activity, as well as the production system. Statistics for the sector and specific farms’ groups that correspond with the F2F strategy are presented in Table 1. The first detailed purpose indicated in the strategy refers to pesticide use because the potential risk to the environment connected with pollution of soil, water and air [2]. The Commission will take action to reduce the use and risk of chemical and more hazardous pesticides. According to the data for Polish agricultural sector, each third farm does not use chemical crop protection products. Such statistics are the effect of an extensive organization of significant part of Polish farm. However, at the sectoral level, the consumption of chemicals still increases, which is proved in the changes of crop protection products use (per thousand tonnes of active substance), as well as unit inputs (per ha of field and permanent crops). From 2005–2016, the amount of active substance used per hectare of cultivated crops increased by 72%, which was the effect of the process of farms’ specialization.
Next to pesticides, fertilization management is the primary area of the Farm to Fork strategy. The excess of nutrients in the environment is a major source of air, soil and water pollution, negatively impacting biodiversity and climate. The Commission will act to reduce nutrient losses and fertilizer use while ensuring that there is no deterioration in soil fertility. Referring to the nutrient losses, the objective indicator is the balance of the main macroelements, e.g., nitrogen, phosphorus and potassium. Taking into consideration the average values of balances for the agricultural sector, their outcomes do not pose potential risks to the natural environment because of relatively low balances. It is worth mentioning that during the study period, the average balances decreased significantly as an effect of natural fertilization limitations (less than a half of farms did not use those fertilizers) and a slight mineral fertilization increase (in total). Finally, the effectiveness of the use of nutrients in agricultural production improved. Unfortunately, phosphorus and potassium values, which were over 100, indicated that at the sectoral level, P and K inputs were too small to cover crop needs, as well as during crop production, natural resources accumulated in the soil were depleted. However, the population of farms in terms of fertilizers management is diverse. Although it is worth emphasizing that the share of farms with excessive balances of N, P and K is significant (above safe levels for the environment, i.e., 21%, 22% and 26% in 2016, respectively), it should be noticed that their share has decreased over time.
The Farm to Fork strategy specifies a long-term target regarding antimicrobials for farmed animals that is correlated with the scale and specialization of farms. According to public statistics, livestock population expressed in livestock units decreased over time by around 13%, to less than 6 million LU in 2016 (Table 1). This process was accompanied by significant portion of farms withdrawing from this agricultural activity. In 2016, every second farm was a livestock farm. Simultaneously, the share of population of specialised farms in livestock production was comparable, which informs about the process of livestock production concentration in specialized farms. The data from the European Surveillance of Veterinary Antimicrobial Consumption (ESVAC) programme, launched in 2009 by the European Medicines Agency, shows that estimated population correction unit (PCU)—that is applied as a replacement for the size of the food-producing animal population that could potentially be treated with antimicrobials—increased by almost one-fifth between 2011 and 2018 [31]. At the same time, the sales of veterinary agents, measured in the main indicator expressing the sales is milligrams of active ingredient sold per PCU, increased by about one-third. Those tendencies are not beneficial to Polish animal sector and proved significant changes in antimicrobial agents use per unit of livestock production. Those processes were accompanied by noticeable changes in the structure of antimicrobial use. According to antimicrobial classification, classes from A (meaning to avoid; they are contraindicated for use in food-producing animals) to D (to use wisely; if possible, these antibiotics should be used as a first-line treatment) were specified. In Poland, microbials classified in the D category are in the majority, but the share of those antimicrobials decreased. Simultaneously, antimicrobials that act more intensively are becoming more and more popular (particularly those classified to category C and B).
Organic farming development is the fourth area of the Farm to Fork strategy. Organic farming, whose significance in realization of the European Green Deal is underlined, is one of the most important agricultural systems that are beneficial for the environment. The development of this agricultural system is important for the achievement of the main purpose of the Farm to Fork strategy, as well as the Biodiversity strategy. In those two EU strategic documents, the need for significant organic farming development (organic production) is the priority. During the analysed period—after Poland’s accession to the EU—there was a dynamic, more than five-fold increase in the number of certified organic farms (form 3000 to 16,100) and an almost seven-fold increase in the number of farms under transition (from 1000 to 7000). This was accompanied by changes in the agricultural land cultivated according to organic rules (more than seven-fold increase—from 49,600 to 367,500 ha in the case of certificated crops, and a more than three-fold increase in crops under transition—from 20,000 to 74,600 ha of crops under transition, respectively). Despite the relatively high dynamics of organic farming development, it is still a niche system in terms of farm numbers, as well as the assigned agricultural land (Table 1). It is worth noting that organic farms characterized by definitely greater production potential and the differences between these farm groups have intensified over time. The process of increasing area is accompanied by the simplification of organic production in the form of livestock production withdrawal. In 2016, only 16% of all organic farms conducted crop and livestock production—named mixed farms.

4.3. Biodiversity Protection Based on Legal Rules

In Poland, the legal basis of the establishment and operation of the Natura 2000 areas is the Nature Conservation Act from 16 April 2004 [47]. In Poland, this network currently covers 6.8 million ha, including 6.1 million ha of land area. They mainly include forests and agricultural areas, the shares of which are 54.5% and 35.1%, respectively. So far, 985 areas have been included to the Natura 2000 network. It should be emphasized that Poland makes a special contribution to protect the natural resources of this network in the case of 12 types of natural habitats; over 50% of these areas in the EU are located in Poland. The same concerns five plant species and eight animal species, over 50% of which in the EU can be found in Poland [43,48,49,50,51,52,53].
In Poland, the share of the Natura 2000 areas in land area is 19.6% and is higher than the EU average (EU-27), which is currently 18.0%. In the EU countries, the share of these areas is varied. The largest shares of them are in Slovenia and Croatia and amount to 38% and 37% respectively, and the lowest are in Denmark, Latvia and Sweden, accounting for 8%, 12% and 12%, respectively. In the EU, forests and agricultural areas have the largest share in the Natura 2000 areas, namely, 46% and 38%, respectively [48,54].
As shown in Figure 1, the distribution of the Natura 2000 areas in Poland is varied. These areas are present in 69.9% of all gminas. It should be noted that there are 75 gminas where the share of network areas in total area is at least 90.0% [55,56].
In Poland, farms with an extensive agricultural production surrounded by valued components, such as permanent grasslands, forests, wetlands, wastelands and water reservoirs, play important roles in protection and enrichment of biodiversity [24]. In this context, domestic HNVfs areas, where extensive farming is linked with a high biodiversity in the landscape, are important [20,57,58]. The designation of these areas in Poland under the current CAP was carried out on the basis of three scenarios depending on the value of the environmental components located adjacent to extensive UAA in gminas. The areas of moderate, high and exceptionally high natural value have been delimitated (Figure 2, Figure 3 and Figure 4). Their shares are now 12.5, 16.0 and 27.1%, respectively, of the total UAA in Poland [24,42].
According to the figures in Table 2, in Poland, there is a lower stocking density expressed in livestock unit (LU) per 1 ha of UAA in gminas with high saturation of the Natura 2000 or HNVfs areas compared to gminas without such areas, which proves that these gminas have a more extensive organizations of agricultural production. A characteristic feature of these gminas is their unfavourable conditions for agricultural production, which is reflected by their low average in the Valorization Index of Agricultural Production Space (VIAPS). The VI APS is a domestic index that is commonly used to measure the environmental conditions of agricultural areas in Poland. This index can reach up to 120 points [59]. Moreover, they have a large share of valued environmental components, such as the share of permanent grasslands in UAA and forests and water reservoirs in total area.
The protection of biodiversity is the priority of the Natura 2000 areas. This network covers 19.6% of total area of Poland. The areas which are also important are those with extensive agriculture adjacent to valued environmental components meeting requirements of the HNVfs areas, whose share in total UAA in Poland ranges from 12.5 to 27.1%. However, it should be noted that the potential of areas supporting biodiversity in Poland is even greater. This is indicated by the NTVI index established by the ISSPC-SRI for all gminas in order to delimit new areas in Poland (from 2019) with specific natural constraints (LFA specific type zone I). It was established that, currently, the average NTVI index for gminas in Poland is 35.6% per 100%, and for gminas with the NTVI ≥35.6%, the average value of this index is 49.4% (Figure 5). This means that in these gminas, nearly 50% of total area located in adjacent of UAA include valued environmental components. It should be added that the area of gminas with the NTVI index ≥35.6% constitutes 57.7% area of Poland. These gminas have 67.5% of permanent grasslands, 75.9% of forests and 70.1% of water reservoirs in Poland [37,38,39].

4.4. Climate Challenges to Agriculture in Poland Based on Tendencies in Greenhouse Gas Emissions and the European Green Deal Objectives

Climate changes in Poland are already visible. Temperature analyses in Poland show that in recent years its average values have been 1.5 degrees Celsius higher than the average for 1981 to 2010 [60]. This seems to be a minor change, but according to the IPCC [61], raising the average temperature by 2 degrees is indicative of irreversible, perhaps even catastrophic, changes in the climate. The IMGW [62] reports that the average temperatures in July 2021 were 2.1 degrees higher than the average for 1991 to 2020.
The effects of these changes are already visible in agriculture. First of all, agricultural drought should be mentioned, which has occurred five times in the last decade. It occurred in the following years: 2015, 2016, 2018, 2019 and 2020 [63]. The effects of violent meteorological phenomena causing damage to infrastructure, livestock and crops are also significant. In addition, there is a noticeable risk of a decrease in animal welfare, which in the long run may result in a reduction in the profitability of animal production. In these areas, adaptation to climate change will be of greatest importance. A visible effect of climate change is an earlier vegetation crop season. Taking into account the above, new species of cultivated crops or the appropriate adaptation of existing crop varieties to changes in the environment and climate are gaining in importance.
The reduction of GHG emissions in the agricultural sector have a slightly different nature compared with other economic sectors. Firstly, it is impossible to completely reduce emissions in this sector because livestock production always leads to producing GHG emissions. In theory, this could be compensated by increasing the absorption capacity, but it should be remembered that this sector has a lower reduction capacity than other sectors. Secondly, it is necessary to maintain a certain level of food production, which is based on the needs of the population and food security. This means that emissions reductions should always be complementary to food security. Thirdly, GHG emissions in agriculture are linked to changing climatic and meteorological conditions, which means that emission estimates are only approximate. In the long term, with the easy availability of appropriate technologies, perhaps this problem will be solved, but at the moment, it is quite difficult to identify who is responsible for emissions according to the ‘polluter pays’ principle. Fourthly, farms are characterized by diversity in production types, which makes it difficult to implement an appropriate climate policy. This is particularly evident in Poland, which has a large number of small farms. According to the preliminary results of the Agricultural Census, in 2020, the total number of farms was over 1.3 million. The average area of such a farm was 11.1 ha [64]. Given their diversity in production, we can imagine how difficult it is to create a climate policy that targets such a number of actors with different production characteristics.
Agriculture in the EU is classified as a non-ETS sector, i.e., not included in the trading of greenhouse gas emission permits. In these sectors, emissions reductions are achieved by setting targets at the state level. This process involves setting an overall reduction target for the EU as a whole, which is then shared between the EU ETS (about 40% of emissions) and non-ETS (about 60% of emissions). Targets for these sectors are set at the EU-wide level. Under the EU ETS, targets are met through market-based methods and result from decisions by the economic operators in the system. In the case of non-ETS, decisions are made at the state level, i.e., binding reduction limits are set based on individual states’ targets and capabilities. Not only is the final target defined, but also the path to achieve this target, from which only slight deviations are allowed. In practice, this means that the final target and annual targets are set for each Member State, and countries are required to submit periodic reports.
In 2020, the phase covering the 2013–2020 targets was completed. During this period, the European Union was to achieve a 20% reduction of greenhouse gas emissions compared to 1990. This represented a 21% reduction in the ETS sector compared to 2005 and a 10% reduction in the non-ETS sector (also compared to 2005).
It should be noted that the reduction targets are accounted for in relation to two different years. In the case of calculating the total reduction, it is 1990, which results from international agreements, i.e., the United Nations Framework Convention on Climate Change—UNFCCC, and in the case of action at the EU level, from internal regulations, i.e., the Climate & Energy Package. On its basis, the ETS was established and the non-ETS sectors were identified using the most recent data available at that time, i.e., 2005, as a benchmark. The lack of a clear distinction between these benchmarks often causes problems of interpretation. The introduction of the two different periods was motivated by the desire to achieve the most effective emissions reductions at the EU level and to comply with international commitments.
The 10% reduction target in non-ETS sectors was set for the EU as a whole. Decisions on effort sharing between individual countries were enshrined in the effort sharing decision—ESD. In practice, this meant that emission changes in individual countries ranged from −20% to +20%. These differences were due to the economic situation of individual countries and the potential for emissions reductions. This was also important in the case of Poland, which made huge emissions reductions in the 1990s as a result of economic restructuring and market changes but was still recovering from the economic collapse in 2005. In this situation, forcing it to reduce emissions would entail worsening its economic problems. For this reason, the reduction target for Poland, for 2020, was +14%. This target meant that Polish agriculture could also increase its emissions by 14%.
Due to the complexity of collecting, analysing and verifying data, official emissions statistics for 2020 are not yet available. The latest data available are for 2018 and were published in 2020. For this reason, we will not be 100% sure for two more years whether the non-ETS targets have been met. This is problematic because, based on 2018 data, it appears that between 2013 and 2018, the total ESD emissions in Poland comparing to targets result in overachievement amounting to ca. 6 Mt CO2 eq. [65]. However, it should be stressed that over the same period, the increase in agricultural GHG emissions was about 7.88% (Table 3), which is well below the 2020 target. This means that agriculture has most likely met its commitments.
Projections for further emissions reductions are not optimistic. Based on the GHG emissions monitoring methods used in Poland, which are in line with international standards, emissions from the agricultural sector are expected to increase in the long term (Figure 6). Its scale is small—only 4% by 2040—but it is quite troublesome because such a change could be considered contrary to the objectives of achieving climate neutrality. This can be offset by greater emissions reductions in other sectors or an increase in absorption capacity, but such a policy would be extremely difficult to implement. It is therefore worth bearing in mind that Polish climate policy in the agricultural sector faces enormous challenges in reversing existing trends.
More detailed analyses of agricultural emissions reductions show that they are distributed proportionally between crop and livestock management (Figure 7). This shows that national climate policy in agriculture must be integrated, i.e., take into account changes in both field crops and livestock management.
A small decrease in emissions is projected for 2030, which should be considered insufficient in the context of the Community’s commitments. This means that reduction efforts must be stepped up and that more emphasis must be placed on climate targets in the national agricultural policy.
When assessing the reduction effort, the mandatory arrangements for annual emission allocations (AEAs) published in the decision of the European Commission of 16 December 2020 should be taken into account [67]. They may serve as a basis for assessing what the emissions reductions pathway should actually look like (Table 4). The reference point is the emissions in the non-ETS sectors in 2005, which were 192,472,253 tonnes CO2 eq. This shows that the 2018 decisions setting a 7% reduction in emissions for Poland in non-ETS sectors, including agriculture, remain in force. This is certainly good news for Poland.
The above data indicate the need to increase the reduction effort, but there are difficulties in implementing it. These are largely due to the emissions inventory method adopted. It is in line with international standards but based on simple indicators of national emission sources, i.e., the number of animals, the area cultivated and the amount of fertilizers used [65]. The method does not take into account many low-carbon agricultural practices, making it very difficult to meet international commitments. In practice, based on current methods, emissions reductions are possible by reducing herds, converting arable land to permanent grassland (and thus reducing yields) or reducing fertilizer use. In practice, it therefore entails a reduction in agricultural production. Such an approach is unacceptable from the point of view of farmers, for whom the scale of production is a determinant of profitability and competitiveness, as well as for the state, whose task is to ensure food security. At the same time, such a monitoring system fails to recognise part of the reduction effort made by farmers resulting from the use of low-carbon agricultural practices. The use of such a method of monitoring emissions means that efforts undertaken under the agri-climate policy are not visible in the reports. At the same time, it is extremely difficult to change the monitoring system, as it requires appropriate field studies to be carried out as a basis for the development of emissions reduction factors for individual practices, the creation of an appropriate system for the collection of statistical data on the practices used and the recalculation of existing emissions according to the new methodology. In accordance with the findings of the Climate Convention, this refers to the whole period, i.e., in the case of Poland, data up to 1988.

5. Discussion

The Farm to Fork strategy—one of the most important elements of the European Green Deal—indicated the targets that should be achieved in the agricultural sector in the 2030 perspective [2]. Those targets referred to different aspects of agricultural activity, e.g., agricultural intensification measured based on fertilization management, as well as pesticides—and chemical crop protection products—inputs, use of antimicrobials and the development of organic farming. Unfortunately, in the strategy, the year of reference for the EU countries was not indicated, nor was the agricultural level of specified target achievement. The data presented in this paper can be the basis for evaluating the condition of the agricultural sector and observed tendencies that are connected with the Farm to Fork strategy’s targets.
The need for pesticides reduction was indicated in the strategy. Taking into account the growing tendency in the intensity of active substances use per field and permanent crops over the study period, as well as farms’ specialization towards crop production, the limitation of those practices can be difficult, especially in the context of growing resistance of crop pests to pesticides [68]. It is also worth mentioning that, still, the pesticide intensity use in Poland is significantly lower in comparison to other EU countries, and a major part of farms does not use chemical crop production products and the targets of the Farm to Fork strategy do not concern this farm group. On the other hand, the highest values of intensity measured in active substance per 1 ha are observed in the cultivation of permanent crops [33,52]. Taking into consideration that 4% of farms in total are specialized in this agricultural activity, the target specified in the strategy can particularly be perceptible to those farm groups.
As pointed out in the strategy, more rational fertilization management is needed. To achieve the reduction of nutrient losses, as well as fertilizers inputs, the identification of potential irrationality in nutrient management is the priority [46,69]. At the national level the balance of N—the main microelement used in agriculture—is low, and its effectiveness of use is high, which indicates that there are no potential risks to the environment at the national level. In the case of P and K, the balances are negative, and the effectiveness of their use indicates fewer inputs in comparison to crop needs and soil content. However, agriculture is diverse in this respect, which is confirmed in the significant portion of farms with balance surpluses of NPK. In the case of the interpretation of the fertilization target at the level of each farm, it can be the challenge for a significant portion of farms to decrease the level of fertilization intensity.
The progress in farms’ specialization is observed in the use of antimicrobials. Specialized farms with high production scales are linked with the use of treatments that can result in the quality of agricultural products and health of animals and humans [70]. This determines the significance of legal regulation to limit private activity with regard to animal treatment. The research results indicated a change in the use of stronger and more dangerous substances in animal treatment, which could result from animal resistance to weaker antibiotics. In the scale of the whole sector and farms’ withdrawal from livestock production, the phenomenon of the excessive use of antibiotics is not the priority challenge, but in the case of specialized farms, with a high scale production and livestock density.
Organic farming is a niche in the Polish market. The achievement of a strategic goal may be a huge challenge for the sector. Apart from long-term positive tendencies in organic farming development, those farms are particularly fragile to the organic payment rules that determine their income [71]. Multi-annual financial support boosted the development of this sector, but the scale of organic production still differs significantly from strategic expectations. Additionally, organic farms in Poland are characterized by considerably higher production potentials. The larger area of organic farms compared to conventional farms has an economic reason—less value-added per area unit, which preconditions the need to pursue more extensive farming and to seek external sources of financial support, including those mainly in the form of governmental programmes [44]. Unfortunately, larger farms are only a small part of Poland’s agricultural structure.
In the EU, the importance of protecting high natural value areas is becoming extremely important. Taking into account the decisions of the EC regarding the need to strengthen role of these areas, it should be emphasized that Poland currently has—in comparison to many other EU countries—a significant potential. This is indicated by a large share of the Natura 2000 areas in total area and HNVfs areas in total UAA, but they are important not only in this context. Poland has an even greater potential of areas protecting biodiversity. This is indicated by the high value of the NTVI index in many gminas in Poland. Using their potential would make an additional contribution to the achievement of the EU target of increasing the share of areas with high natural value by 2030. It should be emphasized that the future use of their potential in this respect will primarily depend on the type of agricultural practices undertaken by farms from these areas under the new CAP. In Poland, the faint possibility of implementing activities related to the protection of biodiversity still often lacks or features an insufficient level of solutions functioning in the case of many farms aimed at full integration of production and environmental protection [72,73]. This situation is mainly expressed by the still unfavourable direction of changes of the national Farm Bird Index (FBI) between 2000 and 2019, which generally results from the unfavourable condition of their habitats, including those related to agriculture. This situation occurs mainly outside the Natura 2000 areas, where this indicator is at a fairly stable level. In 2018, in Poland, this index reached the lowest value in the entire reporting period (since 1990) [74,75]. The same direction of changes in the FBI index also occurs across the EU. Between 2000 and 2016, the value of the FBI index in the EU decreased by 14.2% and by 13.4% in Poland [76,77]. A significant challenge for the EU—including Poland—is how to manage the process of strengthening the importance of areas with high natural value by 2030. It is worth adding that this process should minimize potential negative economic effects for farms from these areas.
In the light of the presented data, there are many uncertain areas that cause difficulties in achieving the climate targets set out in the European Green Deal and related documents. In this respect, three main areas of uncertainty can be distinguished:
-
changes at the level of the EU climate policy;
-
inadequate emissions monitoring system;
-
difficulties in estimating the propensity of farmers to implement low-carbon practices.
In theory, there should be no doubt at the European Union level. The AEAs published in December 2020 should be considered as the current and valid pathway towards reduction targets in the agricultural sector. However, it does raise some doubts. The increase in the overall EU reduction target from a 40% to a 55% reduction in emissions compared to 1990 is not included in this document. It is therefore unclear whether the increase in emissions reductions is to be met entirely by the ETS sector or whether an adjustment to non-ETS commitments will be required. If so, this will require the ESR and the AEAs to be updated. Moreover, these changes will certainly mean an increase in reduction commitments. According to experts, this can mean an increase in the reduction effort, up to 16% [78]. In the case of Poland, it would be very difficult, if not impossible, to achieve such a target, as it would cause serious economic difficulties in the agricultural sector. It is uncertain when decisions will be made in this regard, but the lack of clear information must be considered one of the main barriers to the effective implementation of climate policy in agriculture. In this case, it is important to emphasise that this concerns a country which, a year ago, had the right to be on a pathway of increasing emissions, not reducing them. Such an abrupt change may not only be difficult to implement but also incomprehensible to farmers.
An additional element of uncertainty is the proposal to amend the LULUCF Regulation. In the existing emissions reduction system, the LULUCF has been regarded as an additional element that is somewhat on the side of the system described above. The European Commission has proposed three lines of change. Among these is a proposal for a separate sector for emissions reductions, i.e., joint accounting for emissions from agriculture and the LULUCF—the so-called AFOLU—has attracted considerable interest and thus has the potential to be implemented. Initially, it seems that such a solution would be beneficial as it would give more prominence to the specificity of emissions reductions in the agricultural sector and link it to land management, which is largely related to agriculture. As a result, it seems that the AFOLU sector would be a natural, logical solution. However, this idea also raises a number of controversies which have so far not been clarified in the discussion of this concept. In the case of Poland, this solution may not quite work either. Long-term projections, i.e., until 2040, predict a slight increase of about 4% in GHG emissions from agriculture. Over the same period, the absorption capacity of the LULUCF sector is projected to decline significantly. This poses a risk that the potential AFOLU sector could deviate significantly from the planned climate neutrality policy in the 2050 perspective and thus force the agricultural sector to make a much greater reduction effort than it is implied by the currently adopted policy solutions, i.e., keeping the non-ETS mechanism unchanged.
The third element introducing uncertainty at the European Union level is the proposal to create a new section of law, the European Climate Law, which is a direct result of the implementation of the European Green Deal. The proposal for this document was presented in December 2020, so its assumptions are known, but its adoption in its final form is yet to come. The European Climate Law is intended to be the long-term pillar of climate policy in the EU. The lack of certainty about its form creates a sense of temporariness about current climate policy, not only in the agricultural sector.
The GHG emissions monitoring system in Poland should be considered as a Tier 2 solution, according to the IPCC typology. Emission factors, in most cases, are based on international research rather than national circumstances. Taking into account technological progress and in particular the need to demonstrate the scale of application of low-carbon agricultural practices, it is necessary to introduce Tier 3 elements, i.e., elements based on direct research related to the agricultural practice concerned. However, creating such a comprehensive system is extremely difficult and, in practice, requires several years of preparation. This is certainly necessary, but it will not make it possible in the coming years to meet the obligations of the Member States within the European Union, where a linear approach to emissions reductions is applied. This means that in order to meet the AEAs in the coming years, the agri-climate policy has to take other reduction measures that can be shown in the reports.
Furthermore, it should be taken into account that a change to a more detailed system will not necessarily lead to an automatic reduction in emissions. Closer monitoring may result in some practices having lower emissions and other having higher emissions, de facto with no impact on reports. Irrespective of this, the result will be improved knowledge of the impact of agriculture on the climate.
As part of the Common Agricultural Policy, Poland is introducing a number of measures referred to as eco-schemes. Their aim is, among other things, to reduce agricultural GHG emissions. At the time of writing this paper, detailed solutions in this respect have not been known yet. It is therefore difficult to assess how they will be perceived by farmers, i.e., how willing they will be to implement them. On the one hand, many farmers are aware of the need for low-carbon practices and are already trying to implement appropriate solutions, while on the other hand, a large number of farms in Poland and the statistically small scale of production on a single farm mean that undertaking low-carbon investments may be difficult and unprofitable for these entities. Overly complicated procedures can effectively discourage efforts.

6. Conclusions

The results of the study illustrate the state of Polish agriculture and the changes taking place in this sector in the context of environmental and climate challenges, as well as identifies the most difficult areas that in the future will require practical solutions to implement the European Green Deal strategy in Poland. Based on the empirical studies, the conclusions are as follows:
  • The strategic goals presented in the European Green Deal, the Farm to Fork strategy and the Strategy of Biodiversity are very ambitious in the 2030 perspective, but still, based on observed environmental and climate changes, the defined goal is justified, as is undertaking activities that will mitigate and adapt agriculture to new external conditions.
  • Based on the presented direction of the development of Polish agriculture, we can observe that the process of specialization and farming concentration will require specific practices aimed at achieving strategic European goals achievement.
  • Taking into consideration strategic goals connected with pesticide, fertilizer and antibiotic management, their limited use, as well as the implementation of more rational practice application at the sector level, will be some organizational challenge for agriculture. However, it is worth mentioning that the point of reference in this transformation will be very important (e.g., established year as the starting point in measuring the achievement of strategic goals; the level of goal achievement—a farm, some farming types or the country/sector level; an average recommended value to achieve for Europe in total or individual threshold for each European country). However, each strategic goal can be a serious challenge for the specific farm groups; in the case of pesticide limitation—for farms specialized in permanent crops; fertilizer management—for farms with intensive crop production; and antibiotics—especially for specialized farms with the huge scale of livestock production. It is worth underlining that organic production development at the sector level will be the grave challenge for the sector because of its niche significance on the agricultural market, which results from social awareness and profitability.
  • Taking into consideration the previous direction of agricultural development, additional policy initiatives are required to effectively transform the sector towards environmental sustainability.
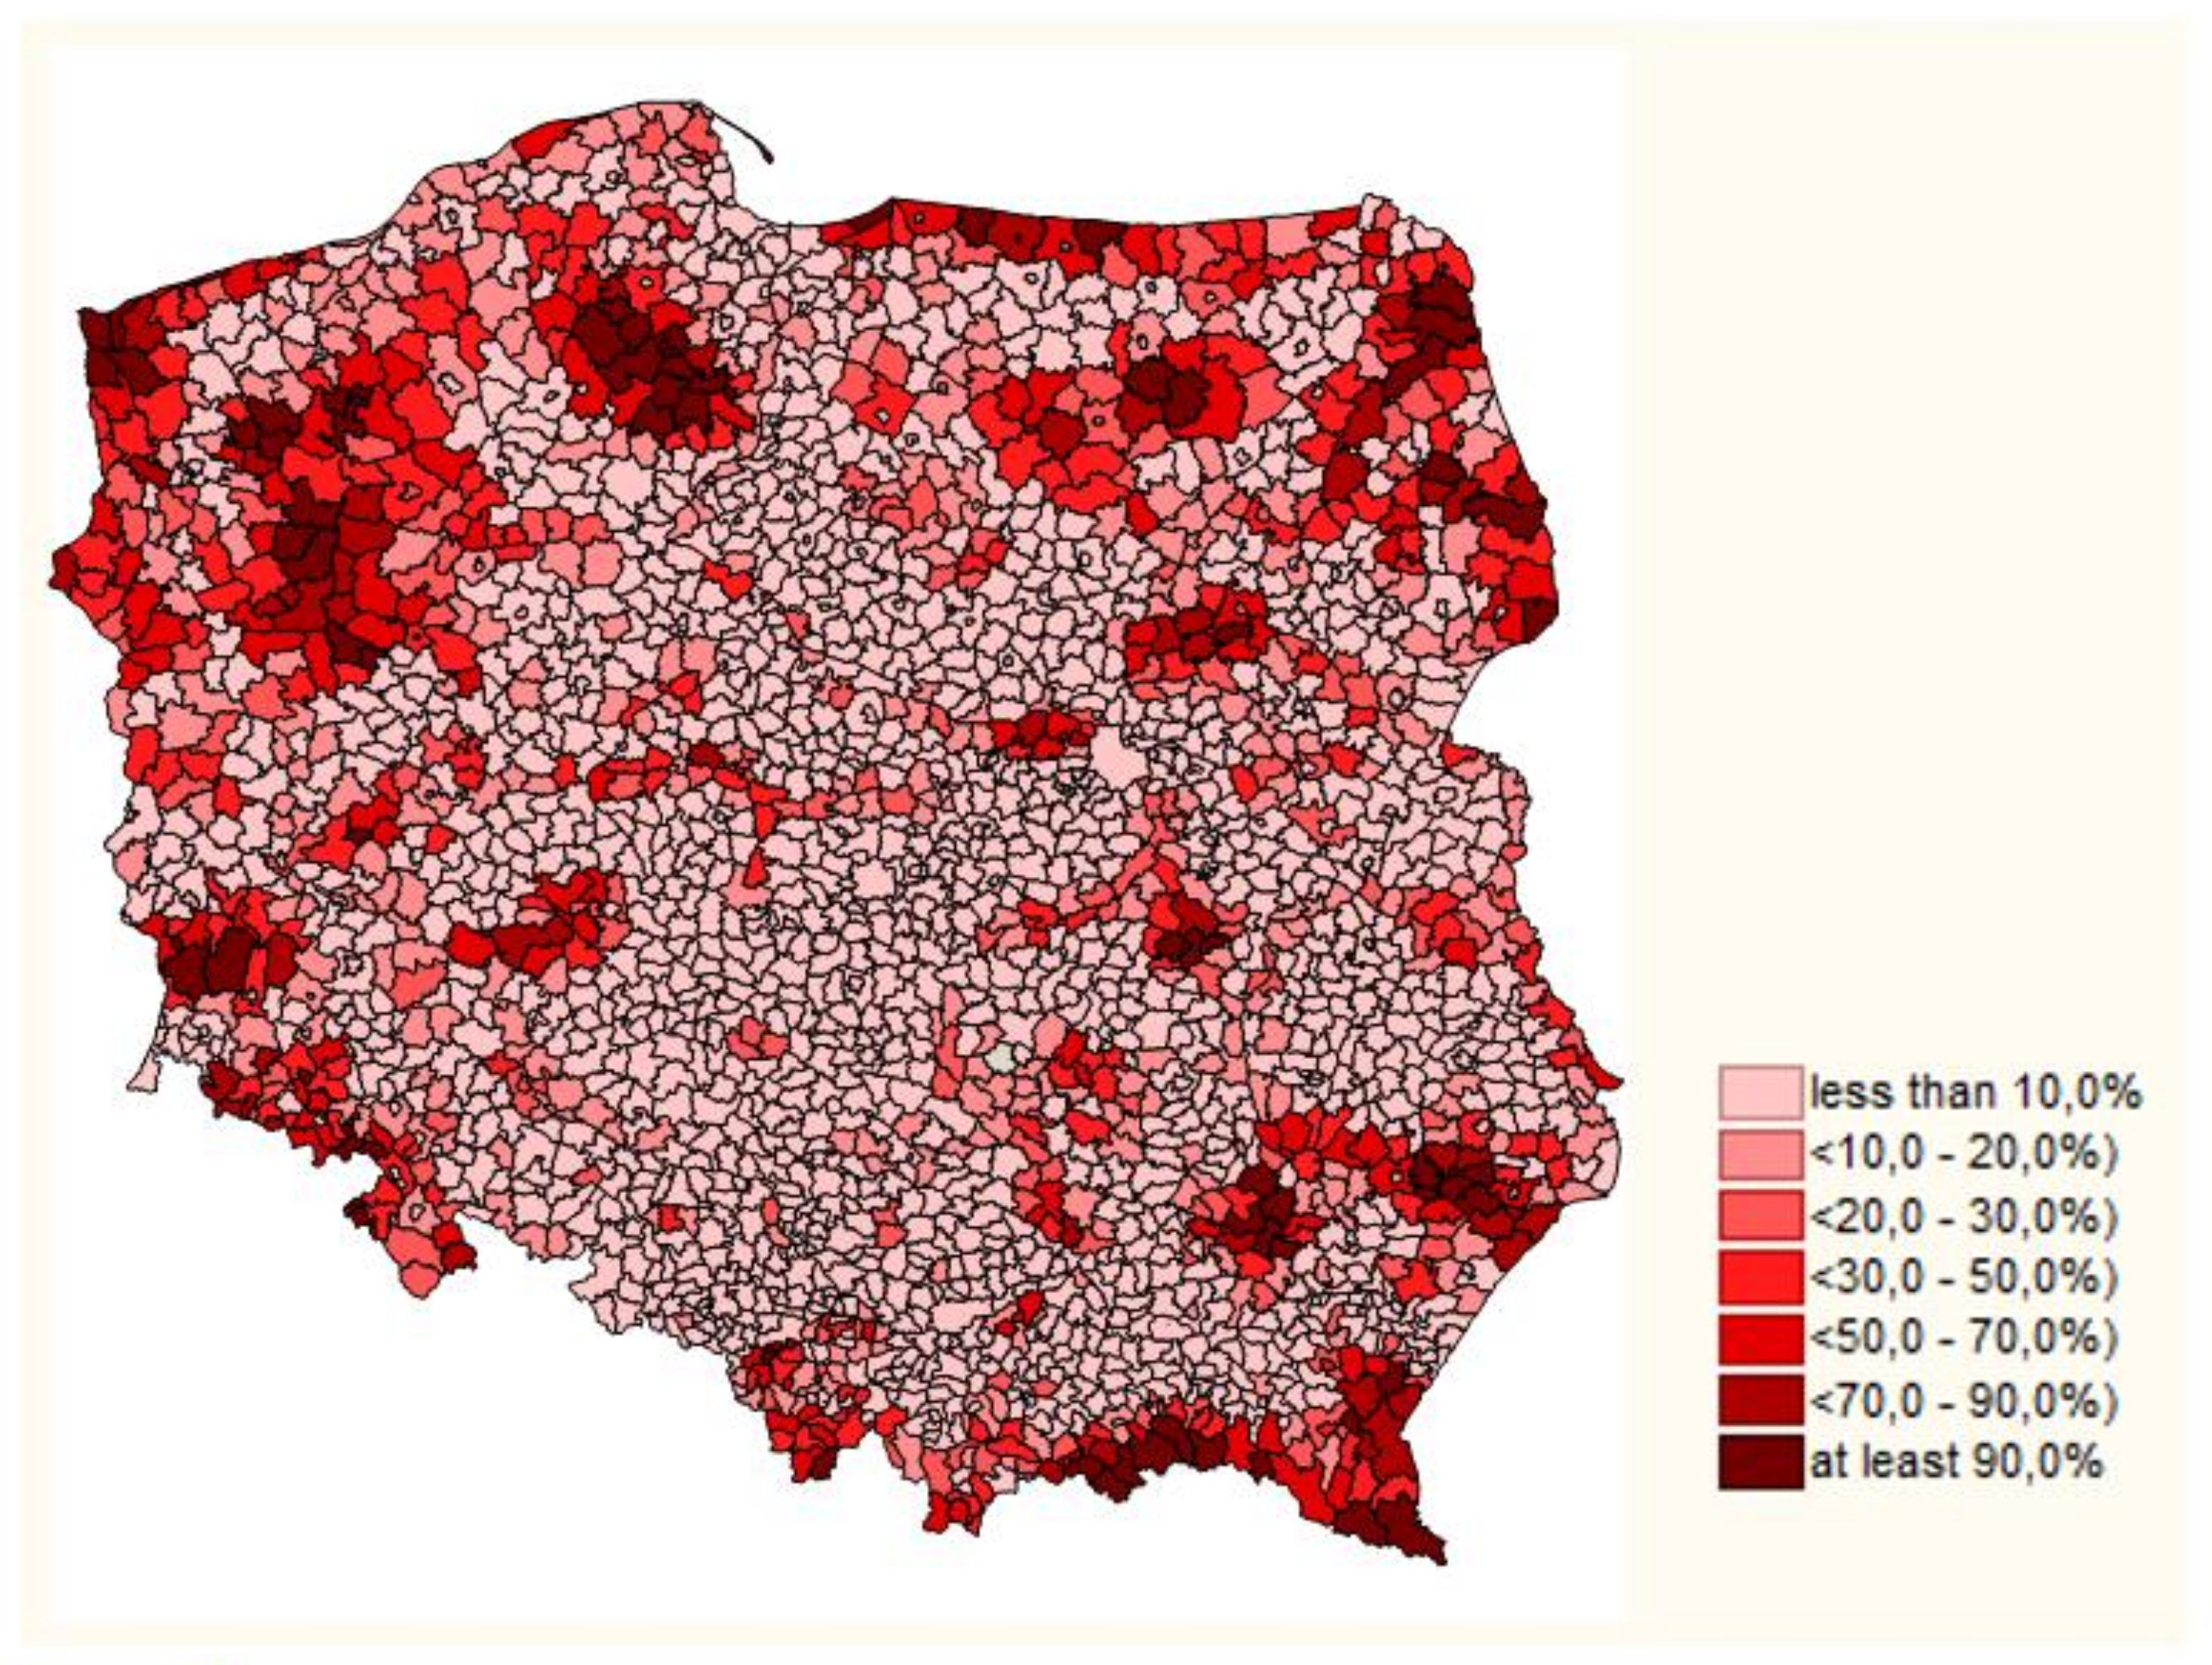
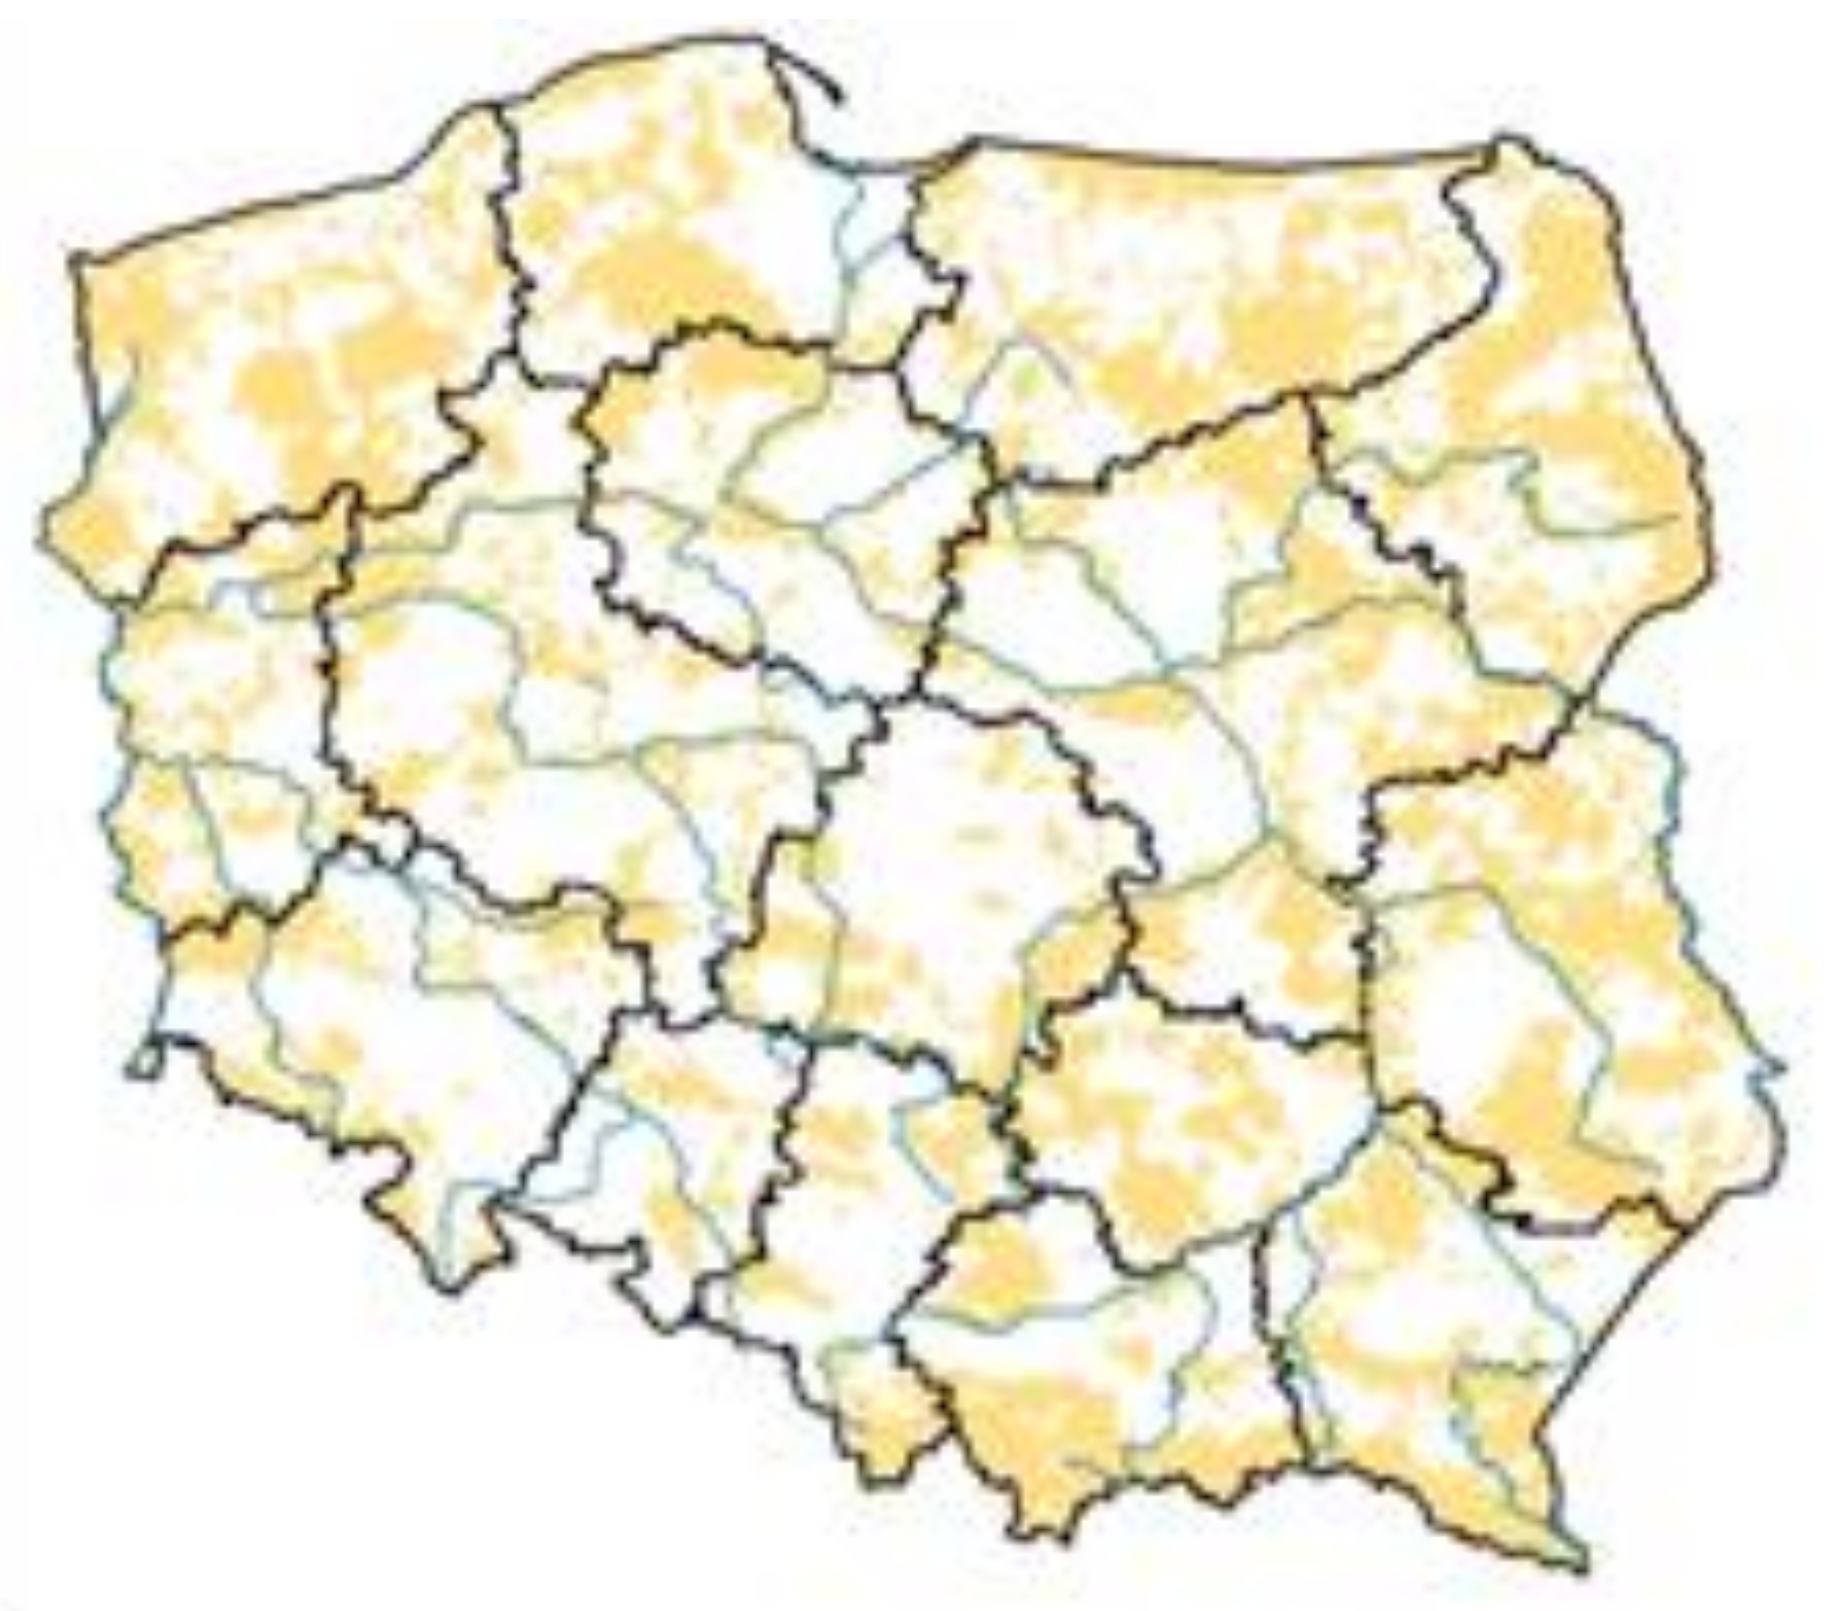
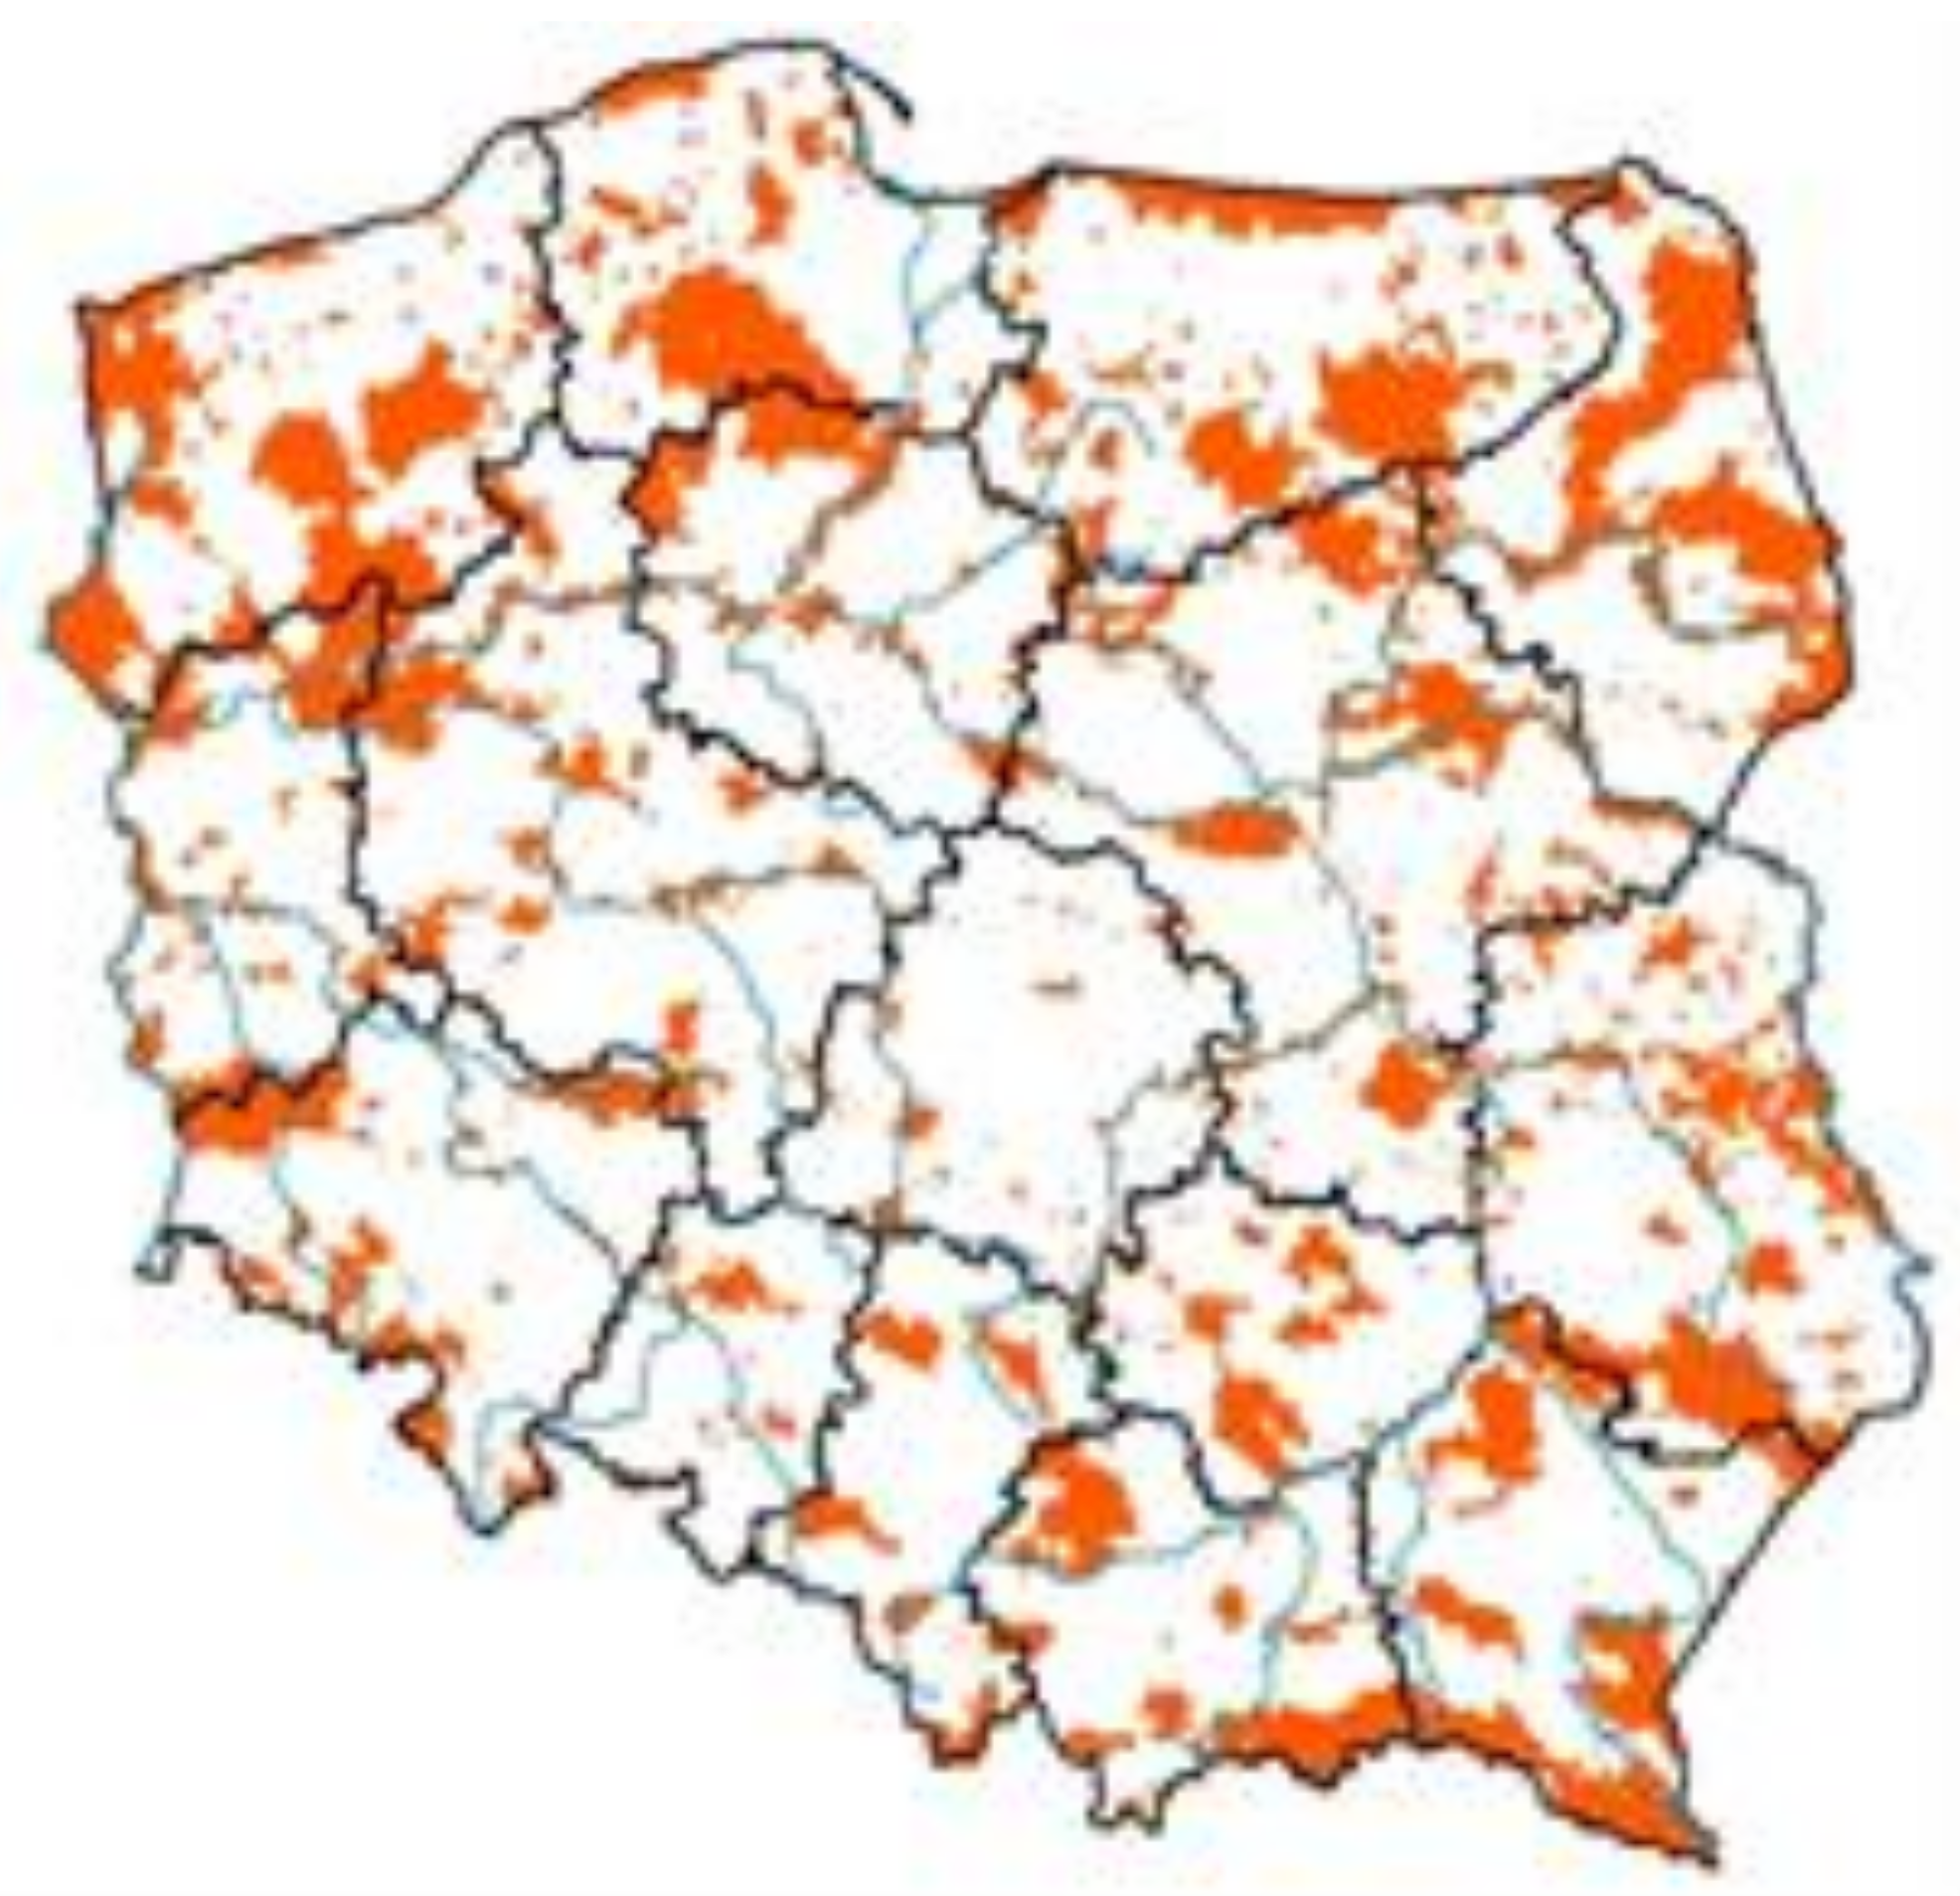
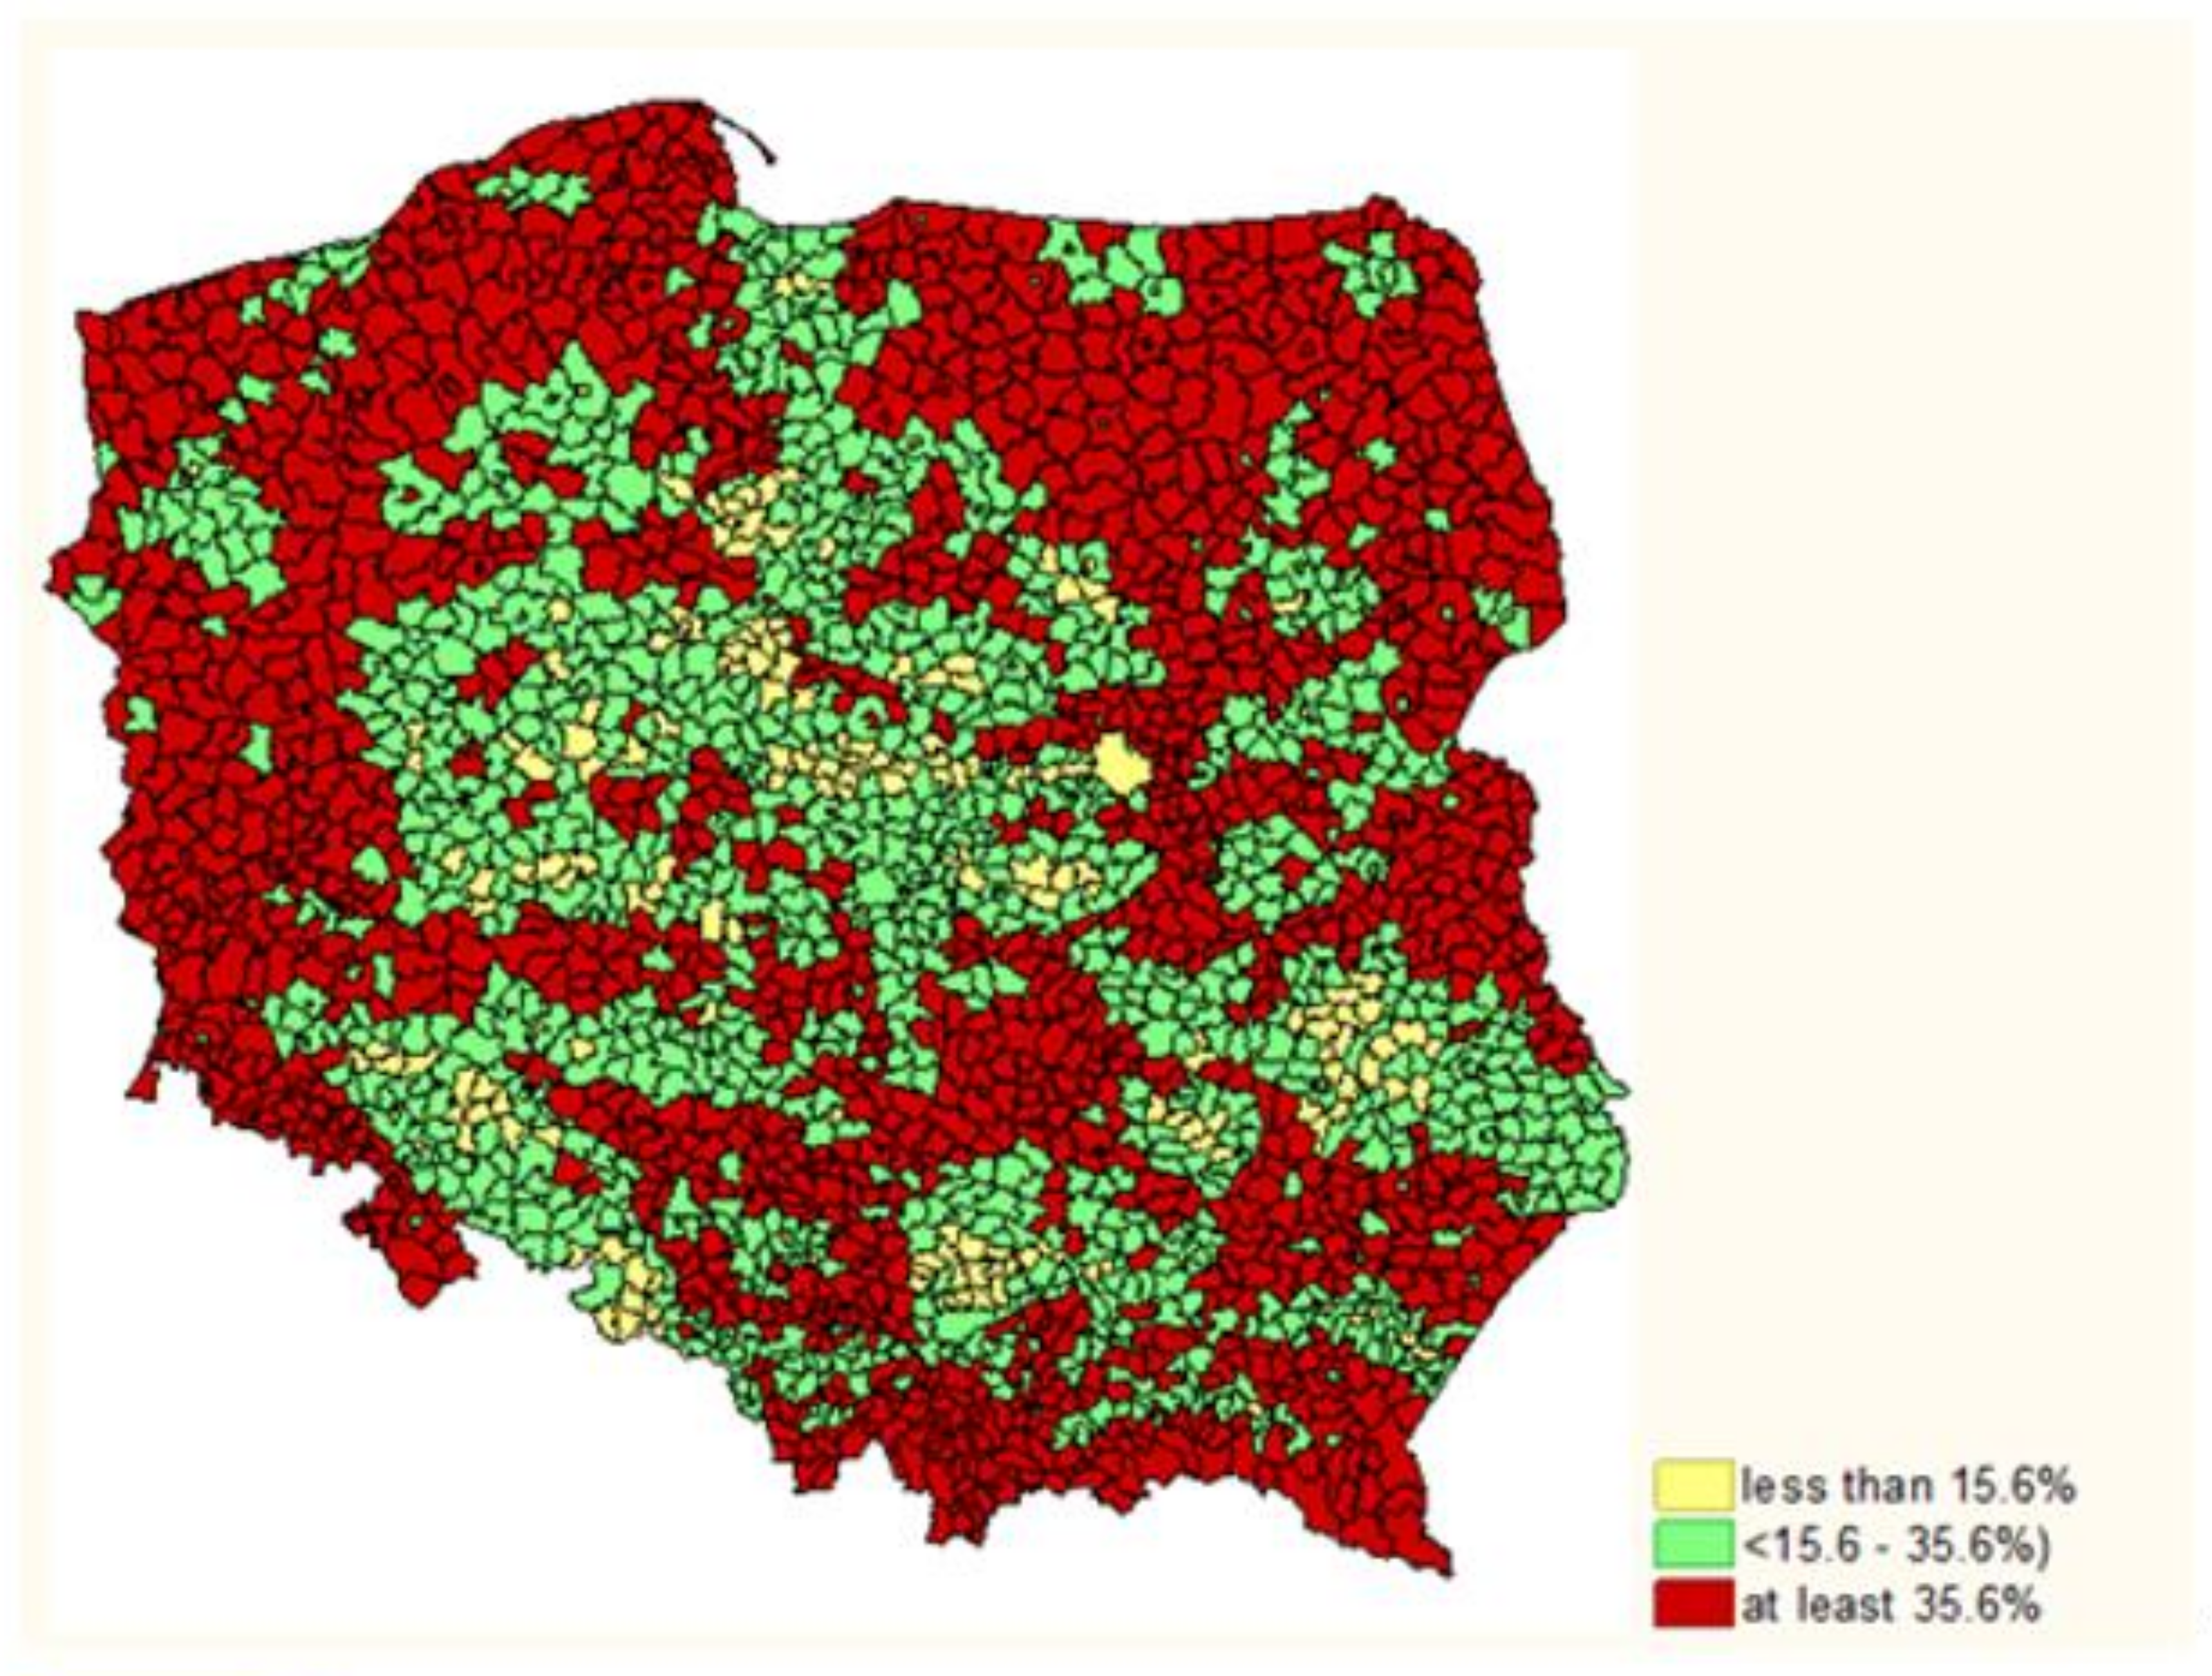
  • Poland has a significant potential of areas with high natural value. First of all, this is indicated by the share of the Natura 2000 areas in the total area and the HNVfs areas in the total UAA. In addition, many areas dedicated to biodiversity protection are also outside of these areas. This is evidenced by the high values on the NTVI index of many gminas in Poland. This indicator, expressed as the share of valued environmental components, such as permanent grasslands, forests, water reservoirs and other areas not subject to anthropopressure in total area located in adjacent of UAA in gminas, shows Poland’s potential to increase the importance of areas supporting biodiversity by 2030. However, much will depend primarily on future actions undertaken in the agricultural sector aimed at their protection.
  • In Poland, there is still a process of biodiversity decline in many areas related to agriculture. In the agricultural sector, there is an urgent need for more care for their condition. However, it should be noted that by taking additional measures for support of biodiversity, this sector will face the challenge of their implementation without losing productivity and effectiveness in conditions of increasing competitive pressure from other EU countries.
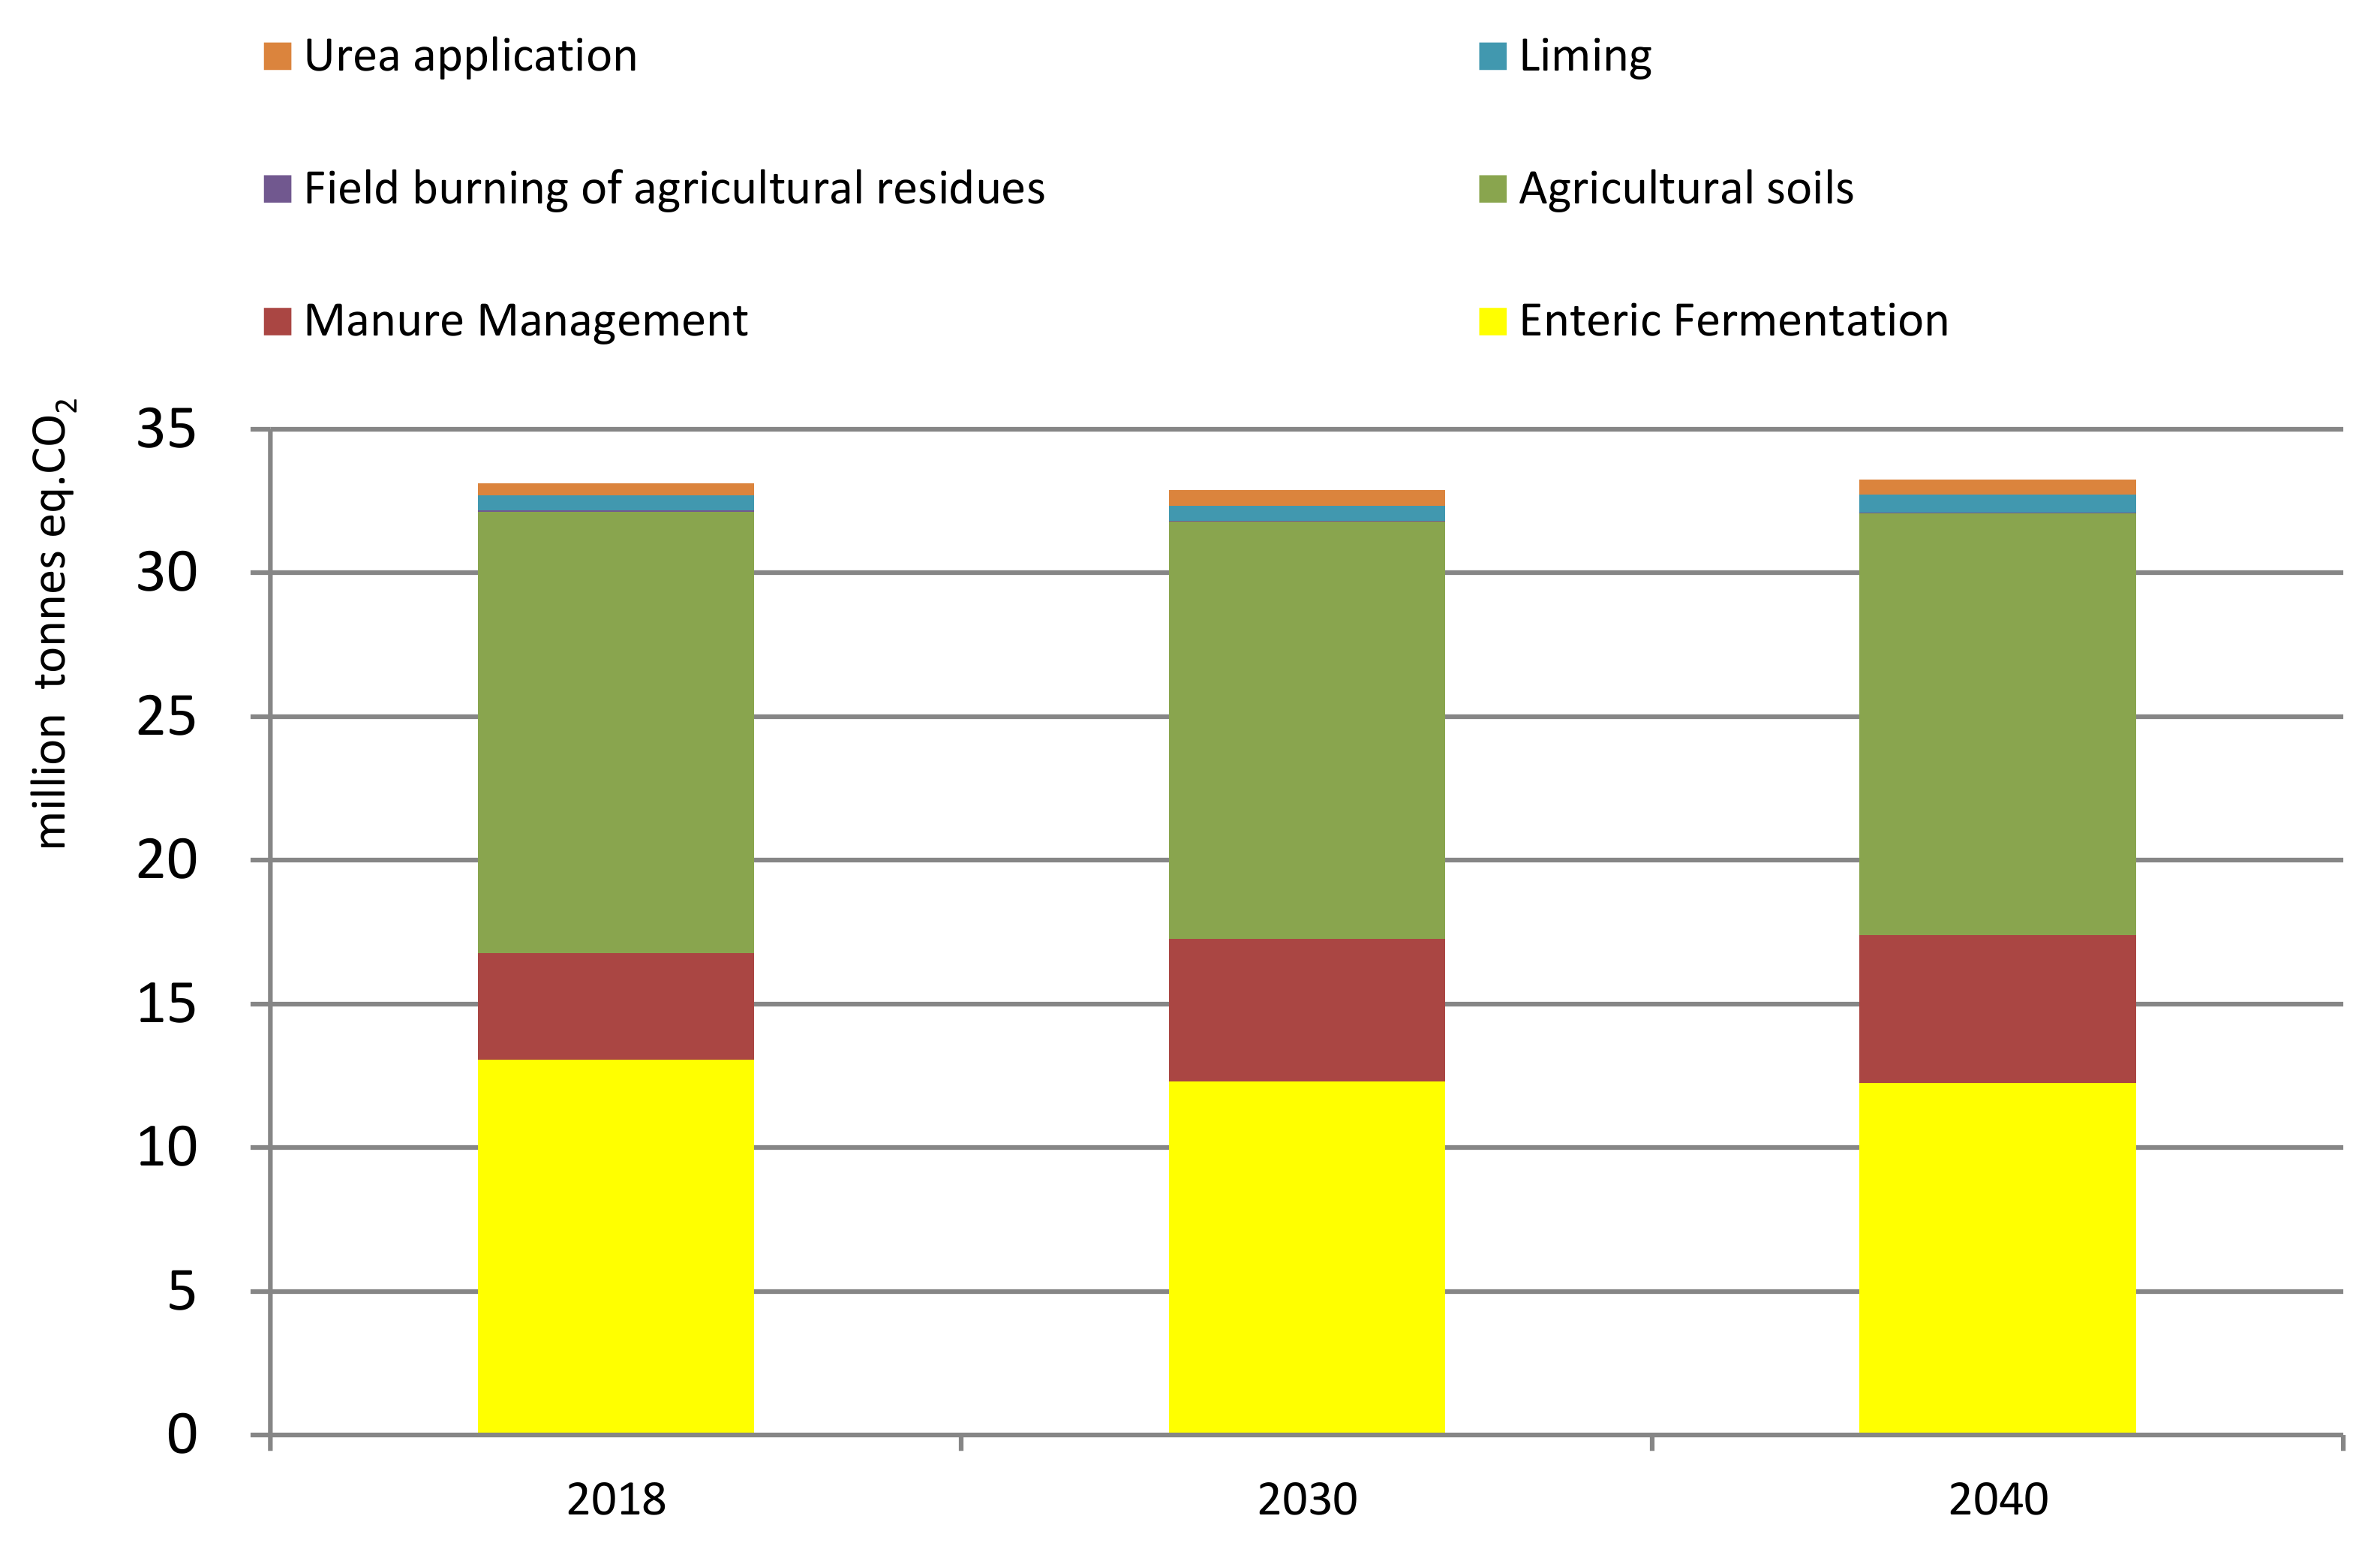
  • Meeting the Community’s commitments to reduce greenhouse gas emissions will require an enormous effort. It is related to the need to reverse the existing trends, as agriculture in Poland so far has been characterised by increasing emissions of these gases. As a result, the change is much more profound than the Community findings suggest.
  • Meeting the target is likely to require a change in the method of collecting data on GHG emissions and the way they are reported to include low-carbon agricultural practices. Under the current system, emissions depend mainly on the number of animals and the cultivated area, rather than on management practices.

Author Contributions

Conceptualization, K.P. and W.W. and M.Z.; methodology, K.P. and W.W. and M.Z.; software, K.P. and W.W. and M.Z.; validation, K.P. and W.W. and M.Z.; formal analysis, K.P. and W.W. and M.Z.; investigation, K.P. and W.W. and M.Z.; resources, K.P. and W.W. and M.Z.; data curation, K.P. and W.W. and M.Z.; writing—original draft preparation, K.P. and W.W. and M.Z.; writing—review and editing, K.P. and W.W. and M.Z.; visualization, K.P. and W.W. and M.Z.; supervision, K.P. and W.W. and M.Z.; project administration, K.P. and W.W. and M.Z.; funding acquisition, K.P. and W.W. and M.Z. All authors have read and agreed to the published version of the manuscript.

Funding

This research was funded by Institute of Agricultural and Food Economics—National Research Institute, Poland.

Conflicts of Interest

The authors declare no conflict of interest.

References

  1. European Commission. Communication from the Commmission to the European Parliament, The European Council, The Council, The European Economic and Social Commmittee and The Commmittee of the Regions, The European Green Deal; European Commission: Brussels, Belgium, 2019. [Google Scholar]
  2. European Commission. Communication from the Commmission to the European Parliament, The European Council, The Council, The European Economic and Social Commmittee and The Commmittee of the Regions, Farm to Fork Strategy for a Fair, Healthy and Environmentally-Friendly Food System; European Commission: Brussels, Belgium, 2020. [Google Scholar]
  3. European Commission. Communication from the Commission to the European Parliament, The Council, The European Economic and Social Committee and The Committee of the Regions, EU Biodiversity Strategy for 2030; European Commission: Brussels, Belgium, 2020. [Google Scholar]
  4. European Commission. Communication from the Commission to the European Parliament, The Council, The European Economic and Social Committee, The Committee of the Regions and European Investment Bank. A Clean Planet for All a European Strategic Long-Term Vision for a Prosperous, Modern, Competitive and Climate Neutral Economy; European Commission: Brussels, Belgium, 2018. [Google Scholar]
  5. Eurostat. Air Emissions Accounts by NACE Rev. 2 Activity (env_ac_ainah_r2). Available online: https://ec.europa.eu/eurostat/databrowser/view/env_ac_ainah_r2/default/table?lang=en (accessed on 15 April 2020).
  6. European Commission. Regulation of the European Parliament and of the Council Establishing Rules on Support for Strategic Plans to be Drawn Up by Member States under the Common Agricultural Policy (CAP Strategic Plans) and Financed by the European Agricultural Guarantee Fund (EAGF) and by the European Agricultural Fund for Rural Development (EAFRD) and repealing Regulation (EU) No 1305/2013 of the European Parliament and of the Council and Regulation (EU) No 1307/2013 of the European Parliament and of the Council; European Commission: Brussels, Belgium, 2018. [Google Scholar]
  7. IPCC. Climate Change 2013: The Physical Science Basis Working Group I Contribution to the IPCC 5th Assessment Report Intergovernmental Panel on Climate Change; IPCC: Geneva, Switzerland, 2013. [Google Scholar]
  8. European Commission. Communication from the Commission to the European Parliament, The Council, The European Economic and Social Committee and The Committee of the Regions. Forging a Climate-Resilient Europe—The New EU Strategy on Adaptation to Climate Change; European Commission: Brussels, Belgium, 2021. [Google Scholar]
  9. Houghton, J. Global Warming, 3rd ed.; Cambridge University Press: Cambridge, UK, 2004. [Google Scholar]
  10. Cowie, J. Climate Change, Biological and Human Aspects; Cambridge University Press: Cambridge, UK, 2007. [Google Scholar]
  11. Czyżewski, A.; Henisz, A. Ekonomia czynnika ziemi i jej współczesne znaczenie. In Współczesne Problemy Agrobiznesu w Polsce; Czyżewski, A., Ed.; Akademia Ekonomiczna w Poznaniu: Poznań, Poland, 2001; pp. 33–36. [Google Scholar]
  12. Błąd, M. Kulturowe funkcje wsi i rolnictwa. In Wielofunkcyjność Rolnictwa: Kierunki Badań, Podstawy Metodologiczne i Implikacje Praktyczne; Wilkin, J., Ed.; Instytut Rozwoju Wsi i Rolnictwa Polskiej Akademii Nauk: Warszawa, Poland, 2010; pp. 165–170. [Google Scholar]
  13. Wilkin, J. Wielofunkcyjność Rolnictwa. Kierunki Badań, Podstawy Metodologiczne i Implikacje Praktyczne; Instytut Rozwoju Wsi i Rolnictwa Polskiej Akademii Nauk: Warszawa, Poland, 2010. [Google Scholar]
  14. Singh, J.S.; Pandey, V.C.; Singh, D.P. Efficient soil microorganisms: A new dimension for sustainable agriculture and environmental development. Agric. Ecosyst. Environ. 2011, 140, 339–353. [Google Scholar] [CrossRef]
  15. Manteuffel, R. Filozofia Rolnictwa; PWN: Warszawa, Poland, 1987. [Google Scholar]
  16. IPBES. Available online: https://ipbes.net/news/ipbes-global-assessment-preview (accessed on 17 March 2020).
  17. European Commission. Report from The Commission to The European Parliament and The Council the Mid-Term Review of The EU Biodiversity Strategy to 2020; European Commission: Brussels, Belgium, 2015. [Google Scholar]
  18. Jeliazkov, A.; Mimet, A.; Charge, A.; Jiguet, F.; Devictor, V.; Chiron, F. Impacts of agricultural intensification on bird communities: New insights from a multi-level and multi-facet approach of biodiversity. Agric. Ecosyst. Environ. 2016, 216, 9–22. [Google Scholar] [CrossRef]
  19. Nieto, A.; Roberts, S.P.M.; Kemp, J.; Rasmont, P.; Kuhlmann, M.; García Criado, M.; Biesmeijer, J.C.; Bogusch, P.; Dathe, H.H.; De Meulemeester, T.; et al. European Red List of Bees; European Commission: Brussels, Belgium, 2014. [Google Scholar]
  20. Stoate, C.; Baldi, A.; Beja, P.; Boatman, N.D.; Herzon, I.; van Doorn, A.; de Snoo, G.R.; Rakosy, L.; Ramwell, C. Ecological impact of early 21st century agricultural change in Europe—A review. J. Environ. Manag. 2009, 91, 22–46. [Google Scholar] [CrossRef] [PubMed]
  21. Strohbach, M.W.; Kohler, M.L.; Dauber, J.; Klimek, S. High Nature Value farming: From indication to conservation. Ecol. Indic. 2016, 57, 557–563. [Google Scholar] [CrossRef]
  22. European Commission. Practices to Identify, Monitor and Assess HNV Farming in RDPs 2014–2020; Working Document; Directorate-General for Agriculture and Rural Development: Brussels, Belgium, 2016. [Google Scholar]
  23. European Commission. Technical Handbook on the Monitoring and Evaluation Framework of the Common Agricultural Policy 2014–2020; Directorate-General for Agriculture and Rural Development: Brussels, Belgium, 2017. [Google Scholar]
  24. Jadczyszyn, J.; Zieliński, M. Assessment of farms from High Nature Value Farmland areas in Poland. Ann. PAAAE 2020, XXII, 3. [Google Scholar] [CrossRef]
  25. European Union. Regulation (EU) 2018/842 of The European Parliament and of The Council of 30 May 2018 on Binding Annual Greenhouse Gas Emission Reductions by Member States from 2021 to 2030 Contributing to Climate Action to Meet Commitments under the Paris Agreement and Amending Regulation (EU) No 525/2013; L 156/26-42; European Union: Maastricht, The Netherlands, 2018. [Google Scholar]
  26. IPCC. Climate Change 2014: Mitigation of Climate Change. Contribution of Working Group III to the Fifth Assessment Report of the Intergovernmental Panel on Climate Change; Edenhofer, O.R., Pichs-Madruga, Y., Sokona, E., Farahani, S., Kadner, K., Seyboth, A., Adler, I., Baum, S., Brunner, P., Eickemeier, B., et al., Eds.; Cambridge University Press: Cambridge, UK, 2018. [Google Scholar]
  27. IPCC-Intergovernmental Panel on Climate Change. IPCC Guidelines for National Greenhouse Gas Inventories, National Greenhouse Gas Inventories Programme. 2006. Available online: http://www.ipcc-nggip.iges.or.jp/public/2006gl/vol4.html (accessed on 12 May 2021).
  28. Siekierski, C. Uwarunkowania rozwoju polskiego rolnictwa w kontekście zmian ustrojowych, integracji z UE oraz ewolucji wspólnej polityki rolnej. Zagadnienia Ekonomiki Rolnej 2020, 1, 122–137. [Google Scholar]
  29. European Environment Agency. The European Environment—State and Outlook 2020: Knowledge for Transition to a Sustainable Europe; Publications Office of the European Union: Luxembourg, 2019. [Google Scholar]
  30. EMA-European Medicines Agency. Sales of Veterinary Antimicrobial Agents in 25 EU/EEA Countries in 2011; Third ESVAC report; European Medicines Agency: Amsterdam, The Netherlands, 2013. [Google Scholar]
  31. EMA-European Medicines Agency. Sales of Veterinaty Antimicrbial Agents in 31 European Countries in 2018, Trends from 2010 to 2018; Tenth ESVAC Report; European Medicines Agency: Amsterdam, The Netherlands, 2020. [Google Scholar]
  32. Zalewski, A. Rynek środków Produkcji dla Rolnictwa; Stan i perspektywy, Analizy Rynkowe; IERiGŻ-PIB: Warszawa, Poland, 2007; Available online: https://ierigz.waw.pl/publikacje/analizy-rynkowe/rynek-srodkow-produkcji-dla-rolnictwa/1936,4,3,0,1320093637.html (accessed on 20 June 2021).
  33. Zalewski, A. Rynek środków Produkcji dla Rolnictwa; Stan i perspektywy, Analizy Rynkowe; IERiGŻ-PIB: Warszawa, Poland, 2020; Available online: https://ierigz.waw.pl/publikacje/analizy-rynkowe/rynek-srodkow-produkcji-dla-rolnictwa/23648,4,3,0,nr-47-2020-rynek-srodkow-produkcji-dla-rolnictwa.html (accessed on 20 June 2021).
  34. Zomeni, M.; Martinou, A.F.; Stavrinides, M.C.; Vogiatzakis, I.N. High nature value farmlands: Challenges in identification and interpretation using Cyprus as a case study. Nat. Conserv. 2018, 31, 53–70. [Google Scholar] [CrossRef] [Green Version]
  35. Hünig, C.; Benzler, A. Das Monitoring der Landwirtschaftsflachen mit hohem Naturwert in Deutchland; BfN-Skripten 476; The German Federal Agency for Nature Conservation (Bundesamt für Naturschutz): Bonn, Germany, 2017. [Google Scholar]
  36. Benzler, A. Drawing on national experience for identifying HNV farmland at European scale: HNV farmland monitoring. In Proceedings of the Expert Workshop Revising the JRC/EEA EU-Level HNV Farmland Methodology, Vienna, Germany, 12 June 2017. [Google Scholar]
  37. Łopatka, A.; Koza, P.; Siebielec, G. Propozycja Metodyki Wydzieleń Zasięgów Obszarów ONW Typ Specyficzny Wg Tzw. Kryteriów Krajowych; IUNG-Instytut Uprawy Nawożenia i Gleboznawstwa: Puławy, Poland, 2017. [Google Scholar]
  38. Zieliński, M.; Sobierajewska, J. Functioning of farms from areas of High Natural Values at the background of other farms. Probl. Agric. Econ. 2018, 356, 3. [Google Scholar] [CrossRef]
  39. Zieliński, M.; Łopatka, A.; Koza, P. Assessment of the Functioning of Farms in Less-Favored Areas and in Areas of Significant Natual Value (LFA Specific type Zone I). Probl. Agric. Econ. 2020, 364, 3. [Google Scholar]
  40. Ministerstwo Rolnictwa i Rozwoju Wsi. Program Rozwoju Obszarów Wiejskich; MRiRW-Ministerstwo Rolnictwa i Rozwoju Wsi: Warszawa, Poland, 2021.
  41. European Commission. Updated Guidelines for Applying Common Criteria to Identify Agricultural Areas with Natural Constraints; Joint Research Centre: Brussels, Belgium, 2016. [Google Scholar]
  42. Matyka, M.; Jugowar, J.L.; Kowalczyk, A.; Kozyra, J.; Łopatka, A.; Piórkowski, H.; Radzikowski, P.; Siebielec, G. Ocena Rezultatów Wdrażania Programu Rozwoju Obszarów Wiejskich na Lata 2014–2020 w Latach 2014–2018; Zadanie II-środowisko i klimat. Raport końcowy; MRiRW-Ministerstwo Rolnictwa i Rozwoju Wsi: Warszawa, Poland, 2019.
  43. Rozporządzenie Ministra Rolnictwa i Rozwoju Wsi z Dnia 1 Lutego 2019 r Zmieniające Rozporządzenie w Sprawie Szczegółowych Warunków i Trybu Przyznawania Pomocy Finansowej w Ramach Działania “Płatności dla Obszarów z Ograniczeniami Naturalnymi lub Innymi Szczególnymi Ograniczeniami” Objętego Programem Rozwoju Obszarów Wiejskich na lata 2014-2020. Dz. U 2019 poz. 262. Available online: http://isap.sejm.gov.pl/isap.nsf/DocDetails.xsp?id=WDU20190000262 (accessed on 20 June 2021).
  44. Dudek, M.; Wrzaszcz, W. On the Way to Eco-Innovations in Agriculture: Concepts, Implementation and Effects at National and Local Level. The Case of Poland. Sustainability 2020, 12, 4839. [Google Scholar] [CrossRef]
  45. Goraj, L.; Bocian, M.; Cholewa, I.; Nachtman, G.; Tarasiuk, R. Współczynniki Standardowej Produkcji “2007” dla Celów Wspólnotowej Typologii Gospodarstw Rolnych; Instytut Ekonomiki Rolnictwa i Gospodarki Żywnościowej-Państwowy Instytut Badawczy (IERiGZ-PIB): Warszawa, Poland, 2012. [Google Scholar]
  46. Wrzaszcz, W.; Kopiński, J. Gospodarka Nawozowa Gospodarstw Indywidualnych w Polsce w Kontekście Ochrony Środowiska; Studia i Monografie nr 178; Instytut Ekonomiki Rolnictwa i Gospodarki Żywnościowej-Państwowy Instytut Badawczy (IERiGZ-PIB): Warszawa, Poland, 2019. [Google Scholar]
  47. Ustawa z Dnia 16 Kwietnia 2004 r. o Ochronie Przyrody, Dz.U. 2004 Nr 92, poz.880. Available online: https://isap.sejm.gov.pl/isap.nsf/DocDetails.xsp?id=WDU20040920880 (accessed on 20 June 2021).
  48. European Commission. Natura 2000: Nature and Biodiversity Newsletter; European Commission: Brussels, Belgium, 2020; p. 48. [Google Scholar]
  49. Generalny Dyrektor Ochrony Środowiska. Realizacja Dyrektywy Ptasiej i Dyrektywy Siedliskowej; Generalny Dyrektor Ochrony Środowiska: Warszawa, Poland, 2017.
  50. GDOŚ. Natura 2000 w Polsce. Available online: https://natura2000.gdos.gov.pl/natura-2000-w-polsce (accessed on 12 September 2019).
  51. GIOŚ. Wskaźnik Liczebności Ptaków Krajobrazu Rolniczego. Available online: http://www.monitoringptakow.gios.gov.pl/ptaki-krajobrazu-rolnego (accessed on 19 August 2019).
  52. GUS-Statistics Poland. Rocznik Statystyczny Rolnictwa/Statistical Yearbook of Agriculture; Główny Urząd Statystyczny/Statistics: Warsaw, Poland, 2018.
  53. MRiRW. Diagnoza Sektora Rolno-Spożywczego i Obszarów Wiejskich w Polsce Przygotowana dla Potrzeb Opracowania Planu Strategicznego Wspólnej Polityki Rolnej na Lata 2023–2027; Ministerstwo Rolnictwa i Rozwoju Wsi: Warszawa, Poland, 2020.
  54. Europejski Trybunał Obrachunkowy. Należy dołożyć starań, by wdrożyć sieć Natura 2000 z pełnym wykorzystaniem jej potencjału; Europejski Trybunał Obrachunkowy: Luksemburg, 2017. [Google Scholar]
  55. Baza Danych Obszarów Natura 2000 w Polsce. GDOŚ, IUNG–PIB. Available online: https://www.gdos.gov.pl/baza-danych (accessed on 24 August 2018).
  56. Adamski, M.; Jarzębowski, S.; Józwiak, W.; Kagan, A.; Mirkowska, Z.; Skarżyńska, A.; Sobierajewska, J.; Zieliński, M.; Ziętara, W.; Żekało, M.; et al. Przedsiębiorstwo i Gospodarstwo Rolne Wobec Zmian Klimatu i Polityki Rolnej; Monografie Programu Wieloletniego; Instytut Ekonomiki Rolnictwa i Gospodarki Żywnościowej-Państwowy Instytut Badawczy (IERiGZ-PIB): Warszawa, Poland, 2019. [Google Scholar]
  57. Benedetti, Y. Trends in High Nature Value farmland studies: Asystematic review. Eur. J. Ecol. 2017, 3, 19–32. [Google Scholar] [CrossRef] [Green Version]
  58. Gardi, C.; Visioli, G.; Conti, F.D.; Scotti MMenta, C.; Bodini, A. High Nature Value Farmland: Assessment of Soil Organic Carbon in Europe. Front. Environ. Sci. 2016, 4, 47. [Google Scholar] [CrossRef] [Green Version]
  59. Jadczyszyn, J.; Kopiński, J.; Kuś, J.; Łopatka, A.; Madej, A.; Matyka, M.; Musiał, W.; Siebielec, G. Rolnictwo na Obszarach Specyficznych. Powszechny Spis Rolny 2010; GUS-Statistics Poland: Warszawa, Poland, 2013.
  60. IMGW. Klimat; Instytut Meteorologii i Gospodarki Wodnej–Państwowy Instytut Badawczy: Warszawa, Poland, 2019. Available online: https://www.imgw.pl/badania-nauka/klimat (accessed on 19 December 2020).
  61. IPCC. Global Warming of 1.5 °C. An. IPCC Special Report on the Impacts of Global Warming of 1.5 °C above Pre-Industrial Levels and Related Global Greenhouse Gas Emission Pathways, in the Context of Strengthening the Global Response to the Threat of Climate Change, Sustainable Development, and Efforts to Eradicate Poverty; Masson-Delmotte, V., Zhai, P., Pörtner, H.-O., Roberts, D., Skea, J., Shukla, P.R., Pirani, A., Moufouma-Okia, W., Péan, C., Pidcock, R., et al., Eds.; IPCC: Geneva, Switzerland, 2018. [Google Scholar]
  62. IMGW. IMGW-PIB Raport: Klimat w Polsce—Lipiec. 2021. Available online:https://www.imgw.pl/wydarzenia/imgw-pib-raport-klimat-w-polsce-lipiec-2021 (accessed on 23 August 2021).
  63. IUNG. System Monitoringu Suszy Rolniczej. Komentarz Agrometeorologa. Available online: http://www.susza.iung.pulawy.pl/komentarz/ (accessed on 24 August 2021).
  64. GUS. Informacja o Wstępnych Wynikach Powszechnego Spisu Rolnego 2020; Główny Urząd Statystyczny/Statistics: Warszawa, Poland, 2021.
  65. Ministry of Climate. Poland’s National Inventory Report 2020; Ministry of Climate: Warsaw, Poland, 2020.
  66. KOBiZE. Czwarty Raport Dwuletni dla Konwencji Stron Ramowej Konwencji Narodów Zjednoczonych w Sprawie Zmian Klimatu; KOBiZE, IOŚ-PIB: Warszawa, Poland, 2020. [Google Scholar]
  67. European Commission. Commission/implementing Decision (EU) 2020/2126 of 16 December 2020 on setting out the annual emission allocations of the Member States for the period from 2021 to 2030 pursuant to Regulation (EU) 2018/842 of the European Parliament and of the Council; European Commission: Brussels, Belgium, 2020. [Google Scholar]
  68. Pandian, S.; Ramesh, M. Development of Pesticide Resistance in Pests. A Key Challenge to the Crop Protection and Environmental Safety. In Pesticides in Crop Production: Physiological and Biochemical Action; Srivastava, P.K., Singh, V.P., Singh, A., Tripathi, D.K., Singh, S., Prasad, S.M., Chauhan, D.K., Eds.; Wiley: Hoboken, NJ, USA, 2020. [Google Scholar]
  69. Rakshit, A.; Singh, H.B.; Sen, A. Nutrient Use Efficiency: From Basics to Advances; Springer: Berlin/Heidelberg, Germany, 2015. [Google Scholar]
  70. European Medicines Agency; Committee for Medicinal Products for Veterinary use (CVMP); Committee for Medicinal Products for Human Use (CHMP). Categorisation of Antibiotics in the European Union; EMA/CVMP/CHMP/682198/2017; European Medicines Agency: Amsterdam, The Netherlands, 2019. [Google Scholar]
  71. Nachtman, G. Sytuacja Produkcyjno-Ekonomiczna Gospodarstw Ekologicznych w Polsce w Latach 2013–2018; Studia i monografie, Nr 181; IERiGŻ-PIB: Warszawa, Poland, 2021. [Google Scholar]
  72. GIOŚ. Stan środowiska w Polsce; Raport 2014; Główny Inspektorat Ochrony Środowiska: Warszawa, Poland, 2014. Available online: http://www.gios.gov.pl/images/dokumenty/pms/raporty/GIOS_raport_2014.pdf (accessed on 20 June 2021).
  73. GIOŚ. Stan środowiska w Polsce; Raport 2018; Główny Inspektorat Ochrony Środowiska: Warszawa, Poland, 2018. Available online: https://www.researchgate.net/publication/330105270_Stan_srodowiska_w_Polsce_Raport_2018 (accessed on 20 June 2021).
  74. GIOŚ. Available online: https://monitoringptakow.gios.gov.pl/ptaki-krajobrazu-rolniczego.html (accessed on 25 March 2021).
  75. Chylarecki, P.; Chodkiewicz, T.; Neubauer, G.; Sikora, A.; Meissner, W.; Woźniak, B.; Wylegała, P.; Ławicki, Ł.; Marchowski, D.; Betleja, J.; et al. Trendy Liczebności Ptaków w Polsce; GIOŚ: Warszawa, Poland, 2018.
  76. EEA. Available online: https://www.eea.europa.eu/data-and-maps/indicators/abundance-and-distribution-of-selected-species-9/assessment (accessed on 12 May 2021).
  77. Eurostat. Available online: http://appsso.eurostat.ec.europa.eu/nui/show.do?dataset=env_bio2&lang=en (accessed on 12 May 2021).
  78. CAKE-Centrum Analiz Klimatyczno-Energetycznych. Zmiana Celów Redukcyjnych Oraz cen Uprawnień do Emisji Wynikająca z Komunikatu “Europejski Zielony Ład”. In Centre for Climate and Energy Analyses, Krajowy Ośrodek Bilansowania i Zarządzania Emisjami; Instytut Ochrony Środowiska–Państwowy Instytut Badawczy: Warszawa, Poland, 2020. [Google Scholar]
Figure 1. Percentage share of the Natura 2000 areas in total area of gminas in Poland. Source: own study based on data from the GDEP and ISSPC-SRI for 2018.
Sustainability 13 10318 g001
Figure 2. HNVfs areas with moderate natural value in Poland. Source: own study based on [24].
Sustainability 13 10318 g002
Figure 3. HNVfs areas with high natural value in Poland. Source: own study based on [24].
Sustainability 13 10318 g003
Figure 4. HNVfs areas with exceptionally high natural value in Poland. Source: own study based on [24].
Sustainability 13 10318 g004
Figure 5. Areas (gminas) with an NTVI index ≥ 35.6% in Poland. Source: own study based on [37,38,39].
Sustainability 13 10318 g005
Figure 6. Projection of greenhouse gas emissions from agriculture from 2018–2040. Source: [65,66].
Sustainability 13 10318 g006
Figure 7. Projection of greenhouse gas emissions from agriculture from 2018–2040 taking into account emission sources. Source [65,66].
Sustainability 13 10318 g007
Table 1. Changes in agricultural sector taking into consideration F2F purposes.
No.SpecificationAnalysed PeriodChange in:
Units%
1.Pesticides in agriculture200520162016-052016/05
1.1Crop protection products’ use (in thousand tonnes of active substance)16.025.59.559.0
1.2Crop protection products’ use/crops (kg of active substance/ha)1.32.20.971.5
1.3Farms without chemicals in crop production (% of farms in total)#33.9##
1.4Farms specialized in crop production (% of farms in total)45.463.618.2#
2.Fertilizers in agriculture200720162016-072016/07
2.1The average balance of N (kg/ha)43.833.0−10.8−24.7
2.2The average balance of P (kg/ha)5.7−0.4−6.1x
2.3The average balance of K (kg/ha)8.2−0.5−8.7x
2.4Effectiveness of N use (%)63.372.99.6x
2.5Effectiveness of P use (%)71.0102.231.2x
2.6Effectiveness of K use (%)86.5100.714.2x
2.7Farms with excessive balance of N (% of total farms)27.420.5−6.9x
2.8Farms with excessive balance of P (% of total farms)40.822.0−18.8x
2.9Farms with excessive balance of K (% of total farms)30.125.6−4.5x
2.10Farms with mineral fertilization (% of total farms)83.675.9−7.7x
2.11Mineral fertilization per farm (N in kg/ha)64.969.64.77.2
2.12Mineral fertilization per farm (P2O5 in kg/ha)26.222.4−3.8−14.5
2.13Mineral fertilization per farm (K2O in kg/ha)30.936.05.116.5
2.14Farms with natural fertilization (% of total farms)62.648.1−14.5x
3.Livestock production and antimicrobials for farmed animals
Livestock sector200520162016-052016/05
3.1Livestock population (in thousand LU 1)6779.35923.5−855.8−12.6
3.2Farms with livestock production (%)72.451.0−21.4x
3.3Farms specialised in livestock production (%)12.613.30.7x
3.4Farms with high density—LU/ha above 2 (%)1.282.240.96x
Antimicrobials for farmed animals201120182018-112018/11
3.4Estimated PCU 2 (in thousand tonnes)39294672743.018.9
3.5Sale of veterinary antimicrobial agents (mg/PCU)126.2167.441.232.6
3.6Sale of 3rd- and 4th-generation cephalosporins (B category) (mg/PCU)0.10.30.2200.0
3.7Sale of fluoroquinolones (B category) (mg/PCU)7.110.93.853.5
3.8Sale of polymyxins (B category) (mg/PCU)4.17.43.380.5
Sales of the veterinary antimicrobial (% of mg/PCU in total):
3.9Tetracyclines (D category), (% of mg/PCU in total)38.128.3−9.8x
3.10Penicillins (D category), (% of mg/PCU in total)24.033.09.0x
3.11Sulfonamides (D category), (% of mg/PCU in total)11.43.9−7.5x
3.12Macrolides (C category), (% of mg/PCU in total)5.412.16.7x
3.13Fluoroquinolones (B category), (% of mg/PCU in total)6.06.50.5x
3.14Polymyxins (B category), (% of mg/PCU in total)3.54.40.9x
4.Organic farming200520162016-052016/05
4.1Organic farms with certificate in total farm population (%)0.181.151.0x
4.2Organic production on agricultural land in total area (%)0.382.792.4x
4.3Organic farms in transition in total farm population (%)0.060.500.4x
4.4Organic production on agricultural land in transition in total area (%)0.150.570.4x
4.5Organic farms with crop and livestock production (% of organic farms)84.716.2−68.5x
4.6Average organic farm area (ha/farm)19.337.718.495.3
4.7Average organic farm area to average farm (ratio)2.53.91.4x
1 LU—Livestock Units [45]; 2 A population correction unit (PCU) has been established as a denominator for the sales data. Source: own calculations based on aggregated Statistics Poland data from Farm Structure Surveys 2005, 2007 and 2016 [30,31,32,33,46].
Table 2. Selected characteristics of gminas depending on the share of the Natura 2000 and HNVfs areas in Poland.
Gminas without the Natura 2000 AreasGminas with the Natura 2000 Areas Representing
over 90% of Total Area
Gminas without HNVfs AreasGminas with HNVfs Areas over 90% of Total UAA:
Moderate
Natural Value
High
Natural Value
Exceptionally High Natural Value
The Valorization Index of Agricultural Production Space (points) 167.751.369.955.555.455.6
Share of permanent grasslands in UAA (%) 218.144.210.433.135.735.4
Share of forests in total area (%) 320.756.426.145.355.152.4
Share of water reservoirs in total area (%) 41.16.01.63.55.55.7
Stocking density (LU) per 1 ha of UAA 50.60.30.480.410.360.32
Source: 1,2,3,4 data for 2017 from the Institute of Soil Science and Plant Cultivation—State Research Institute in Pulawy (Poland); 5 data for 2019 from the ARMA.
Table 3. National emissions of greenhouse gases for 1988–2018 (selected years) by source categories [kt CO2 eq.].
IPCC Sector19882005201020152018
1.
Energy
476,176.95331,489.27342,037.42319,237.48342,087.58
2.
Industrial Processes and Product Use
31,040.0624,872.8224,151.3127,821.9924,891.89
3.
Agriculture
49,190.5830,699.3930,705.1230,741.6333,117.07
4.
Land-Use, Land-Use Change and Forestry
−19,855.61−51,046.32−34,514.38−31,983.73−36,451.04
5.
Waste
21,931.1017,059.6716,032.4713,873.0312,759.83
6.
Other
NONONONONO
TOTAL (with LULUCF)558,483.08353,413.21378,411,95359,690.40376,405.33
TOTAL (without LULUCF)578,338.69404,459.53412,926.32391,674.13412,856.37
Source: [65].
Table 4. Annual emission allocations for Poland for each year of the period from 2021 to 2030 pursuant to Article 4(3) of Regulation (EU) 2018/842, adjusted in accordance with Article 10 of that Regulation (in thousand tonnes of CO2 equivalent).
Area2021202220232024202520262027202820292030
Poland215,005204,377201,205201,205194,860191,688188,516188,516182,171178,999
European Union2,226,3872,141,9752,098,628,3782,055,2812,011,9351,968,5881,925,2411,881,8941,838,5471,795,200
Source: own studies based on [67].
Publisher’s Note: MDPI stays neutral with regard to jurisdictional claims in published maps and institutional affiliations.

