Article

Food Insecurity and Related Factors among Farming Families in Takhar Region, Afghanistan

1
Institute of Agricultural Economics and Development, Chinese Academy of Agricultural Sciences, Beijing 100081, China
2
Faculty of Agriculture, Takhar University, Takhar 3702, Afghanistan
3
Department of Macroeconomics and Agricultural Economics, Institute of Economics, Poznan University of Economics and Business, 61-875 Poznan, Poland
*
Author to whom correspondence should be addressed.
Sustainability 2021, 13(18), 10211; https://doi.org/10.3390/su131810211
Submission received: 1 August 2021 / Revised: 8 September 2021 / Accepted: 8 September 2021 / Published: 13 September 2021

Abstract

:
Improved food security remains a major challenge for policymakers in Afghanistan. The objective of this study is to investigate the prevalence and drivers of food insecurity among farming households in the Takhar region of Afghanistan. Household questionnaire survey datasets were obtained from 262 farmers via multi-stage sampling across four districts. The Household Food Insecurity Access Scale (HFIAS) was constructed to assess the prevalence of food insecurity, and an ordered probit econometric model was used to identify the factors influencing the prevalence rates in farming families. The findings indicate that 66.79% of the farming households were food insecure, whilst 30.53% were severely food insecure. After adjustment of socio-economic and demographic characteristics of families, the ordered probit results reveals that household head education, dependency ratio, farm income, access to non-agricultural income, livestock unit, group membership, borrowing, farm diseases, flood, and war significantly influenced farming households’ food insecurity in the study area. Our findings highlight the urgent requirement for policies and initiatives to support farmers to improve their overall food security. Such strategies should focus on introducing improved farming techniques, enhancing farmer education levels, livestock development programs, building and empowering farmers groups, creating credit access to households, and providing humanitarian food support.

1. Introduction

Food insecurity is a condition where there is an inadequate quantity of affordable, appropriately nutritional, and secure food or the capacity to achieve enough food in a socially acceptable way is restricted [1,2]. Food insecurity is categorized as inadequate food consumption, inadequate food access, and vulnerability to subsistence mechanisms that produce sufficient food regularly and are not resilient in shock [3].
Despite some improvement in addressing global malnutrition and hunger, food security remains the main concern for individuals and households worldwide [2,4]. The recent estimates by FAO in 2018 [5] show that 26.4% of the world’s inhabitants are food insecure. In fact, since the turn of the century, starvation has increased, with 821 million people listed as undernourished, mainly due to weather shocks and conflicts [6,7]. The United Nations Food and Agricultural Organization (FAO) warned that there had been a recent uptick in worldwide starvation due to the impact of COVID-19, signaling the requirement for better monitoring of who is experiencing food insecurity [8,9,10]. Most of the poor inhabitants in the world live in developing nations [6,11]. For instance, in the Asian continent, with two-thirds of the overall starving people, the starving people have decreased in south Asia, with an increase in west Asia [12].
Hunger and food insecurity are major concerns in Afghanistan, where most of the country’s inhabitants live under the poverty line, with severe household food insecurity [13,14]. The World Bank report indicates that 61% of Afghanistan’s people who live in poverty have limited access to basic food [15]. Hence, malnourishment is one of the most severe health and development challenges. Additionally, micronutrient deficiencies are associated with malnourishment among families [16]. More than 30% of the population in Afghanistan does not meet the minimum requirements of daily food (2100 kilocalories per person) [17]. Limited dietary variety is another aspect of nutrition insecurity in Afghanistan, where people depend on only wheat bread as a staple food, only occasionally consuming fish, meat, eggs, dairy products, nuts, and pulses [18]. Poor dietary diversity implies that the Afghan diet is very deficient in proteins and other micro-nutrients.
Food insecurity stems directly from long-term and short-term factors such as conflict, COVID-19, poverty, low productivity of agriculture, climate change, soil erosion, lack of proper planning, lack of adequate infrastructure, macroeconomic imbalance, population growth, food supply, inequality, rising food prices, and unemployment, among others [13,14,19,20]. The outcomes of these factors influence the food stability and livelihoods of millions of people. Even though Afghanistan has made significant gains in developing economic and social services, food insecurity remains the main challenge. FAO report suggests that in 2021, Afghanistan’s food security level declined dramatically, while acute food insecurity rose from 35% in November 2020 to 42% in March 2021 due to the conflict, COVID-19, and high food prices [14]. Nearly 70% of the inhabitants depend on farming for their food and income, and agriculture accounts for almost 26% of the GDP. Agriculture is the key source of Afghanistan’s food supply [21]. Cereal crops play a central role in Afghans’ diet. Cereal represents almost 91% of crop production [22]. However, Afghanistan is still a grain-scarce nation, and consumption of grain quickly rises over time, leading to a rising shortage between production and consumption. The majority of grain crops are used for self-consumption due to the inadequate production capacity. Afghanistan still imports large quantities of grain, which results in food price variability and variation in food stability [19]. Moreover, the food stability supplies are increasingly impacted by weather variability through changes in the production and price of food. These variations in the yield of the crop and domestic food production can adversely affect the food stability supplies, and consequently, food insecurity [23].
Food insecurity is prevalently high in rural regions of Afghanistan, where 70% of the inhabitants live [15], with traditional farming dominating the production of agriculture. The severity of food insecurity and vulnerability of farming households mostly depends on poor agricultural practice [13,14]. Farming households have significant potential to increase food security by ensuring the accessibility of food through production, decreasing food costs through an increased food supply, and generating income [24]. However, Afghanistan faces problems in reaching food security: their production remains low and hampered by several elements such as a lack of agricultural inputs, credit access, extension service, farmer organization, and market access [25,26,27]. Additionally, the appearance of new problems, such as conflict, increases household vulnerability to food insecurity through deep economic recessions, unemployment, increased inflation, and eroded finances for social security and health [17,19]. Conflict affects the food supply chain from production, harvesting, processing, marketing, and transportation in locations where farming is the main income source. As a result, the decline in food security heightens tensions and conflict risks. Due to these causes, farming families face an increased risk of undernourishment [17,28]. There is an urgent requirement to improve agricultural productivity and decrease food insecurity in rural societies in Afghanistan. These objectives are hindered due to the lack of information on food security and necessary policies to improve agricultural productivity, particularly staple crops. Nevertheless, there is an urgent requirement to document the food insecurity and associated factors among farming households.
Moreover, empirical findings also indicate that food security is primarily unstable in developing nations, including Afghanistan [17,29,30,31]. Access to sufficient food for most farming households differs in different regions due to proneness to shocks of households and other threats [30]. These variations of food security are influenced by demographic factors (age, gender, marital status, family size, and dependency ratio), economic factors (farm input, land size, livestock ownership, credit access, membership, and extension access), farm income, and non-agricultural income flood, farm diseases, and war; these factors affect food insecurity through the agricultural production channels and rural income [32,33,34,35]. The magnitude and direction of the association among these parameters and farming households’ food insecurity vary across studies [3,24,34,35,36,37,38]. For example, a study was conducted on household food insecurity in East Africa by Gebre and Rahut [4], and results indicated that age of a head of household, family size, and crop loss, are positively significant, and education level, household income, borrowing money from informal and formal, group members, and livestock unit are negatively associated with prevalent household food insecurity. Another study carried out in Ethiopia showed that the household head age and taking a loan were significantly negatively correlated, and family size, household head sex, and marital status were significantly positively linked with food insecurity [3]. The food insecurity drivers carried out in Zambia showed that farming members and off-farm income were significantly associated negatively and positively, respectively, with the prevalence of household food insecurity [33]. The study put having a large household size as positively, and total non-farm income as negatively correlated with food insecurity [39]. In a review of studies regarding food insecurity analysis in Afghanistan, Oskorouchi et al. found a positive and significant relationship between flood and food insecurity [40]. Another study by D’Souza et al. reported that there was a direct and significant correlation between war and household food insecurity [17]. Another study by Gao et al. found that income and household size are important determinants of the level of food security [41]. However, these studies on Afghanistan only examined the effect of flood and conflict on the level of food insecurity at the national level rather than using evidence of farming household food insecurity at the household level.
In Afghanistan, as with other developing countries, the food insecurity problem is somewhat neglected in scientific studies, particularly at the household level. To the best of our knowledge, analysis of the factors influencing farming household food insecurity at various levels of severity using household survey data has never been conducted in Afghanistan. There is no such research in Afghanistan, and hence finding literature has been challenging. This study seeks to fill this gap in the literature on food security in Afghanistan. Furthermore, we found this study to be the first scientific study to concentrate on micro-econometric food insecurity assessment in the research area. In addressing this research gap, our study responds to the following questions: (1) What is the food insecurity prevalence among farming households in Afghanistan? (2) What are the factors that affect farming household food insecurity prevalence in Afghanistan? The value-addition of the article and its originality is the use of the Household Food Insecurity Access Scale, a nine-item method and ordered probit model used to assess the household food insecurity prevalence and find factors correlated to food insecurity on the basis of primary data in the analyzed country. The remainder of this manuscript is categorized as follows. In the second section, we develop the material and methods. In the third section, the results and discussion are elaborated. The fourth section highlights the conclusions and recommendations of the study.
While our article focuses on drivers of food insecurity between farming households in Afghanistan, the approach and procedure are important to policymakers and practitioners across the developing countries who are concerned about understanding the determinants of food insecurity among family farming. Identifying policies that can help decrease the prevalence of food insecurity is also broadly appropriate to other developing countries where subsistence agriculture is practiced.

2. Methods

2.1. Description of Research Area

The study was carried out in selected farming communities in the rural Takhar region, Afghanistan. Takhar is located between latitudes 36°40′11.28″ N and longitudes 69°28′42.43″ E. It has a local steppe climate with a usual temperature of 16.8 °C and a mean rainfall of 383 mm [42]. Takhar has over 1,053,852 inhabitants, distributed across 17 districts, with 80% of the people located in rural areas [43]. The proportion of females and males in the Takhar region is nearly equal, with a mean size of households of 7.8, which is less than the national level of 8.12 [18]. The area of geographical is 1.2 million hectares, of which 57% is mountains or semi-mountainous topography, and 37% is plains [18]. In Takhar, 54.5% of the population is lives in poverty, and 56.7% of the population above the age of 15 years is unemployed. The working population comprises 41% working for six months, and 2.3% having worked for less than six months [18]; about 56% of the households in Takhar own farmland. Agriculture is the central source of household income and livelihoods, and 75% of the households rely on agriculture. Various crops, including grain crops such as wheat, maize, rice, vegetables, and fruits, are produced in Takhar. Among cereals grown, wheat represents the dominant crop, especially in terms of land cultivation and the number of producers. Overall, the average yield is considerably lower than the countrywide level [43]. Livestock keeping is also an important task for farming families [26].

2.2. Sampling Technique and Collection of Data

In this research, household survey data were used. The data were collected from the active wheat-producing families in four districts in the Takhar region, Afghanistan, in November 2020. A multi-stage sampling method was used to choose district, community, and household samples as described below:
Stage I: Four districts (Talu-qun, Farkhar, Warsaj, and Kalfgan) were purposely selected as they are easily accessible wheat producers. Stage II: Purposeful selection of four communities per district from the main agricultural producing areas of the district. Stage III: A representative of the household sample (i.e., 79, 71, 52, and 60 families from Talu-qun, Farkhar, Kalfgan, and Warsaj, respectively) were nominated using a simple random walk sampling technique. This technique of sampling is appropriate in the current research since the study area’s population is homogeneous in terms of the means of livelihood. This procedure yielded 262 farming households, from which a wide-ranging dataset was obtained through personal interviews of household heads. Data was taken using a standardized interviewer-administered questionnaire that was derived from a variety of sources. The questioner covered various subjects, including the Household Food Insecurity Access Scale (HFIAS) nine-question survey [44], characteristics of the head of the family, family characteristics, farm characteristics, institutional characteristics, and livelihood shocks. For the most part, an initial study was undertaken to measure the clarity of the questionnaire and applicability before the actual survey and get a different evaluation to determine the size of the sample. After providing the essential training for data collectors and administrators on confidentiality, collection of data, the objective of the study, and their significance, the actual data collection process was facilitated by six collectors of data and two supervisors.

2.3. Measurement of Household Food Insecurity

Food insecurity in farming households was calculated using the framework of the United States Agriculture Department’s nine-question survey on household food insecurity approach (Table 1) [44]. This model has the benefit of having been verified, confirmed, and regularly used by published scientific articles to measure household food insecurity in developing nations and Afghanistan [45,46,47]. The Household Food Insecurity Access Scale (HFIAS) approach is based on the assumption that food insecurity experience (access to food) causes probable reactions and answers that can be addressed and quantified through a survey and summarized on a scale [44]. In the indicator of HFIAS, respondents are asked nine questions about food insecurity occurrence and occurrence frequency over a 30-day recall period. The question of the occurrence denotes an increasing food insecurity level. The frequency of question occurrence is asked as a follow-up to each occurrence question to define how often the situation happened. For example, if the answer of the respondent “yes” to questions of occurrence, a frequency of occurrence questioned to determine whether the situation rarely occurred (once or twice), sometimes (three to ten times), or often(more than ten times) in the past month [44]. The HFIAS approach produces food insecurity (food access) information at the household level.
Following the HFIAS, four ordinal food insecurity categories were established (food secure, moderate food insecure, mild food insecure, and severe food insecure). The category of food-secure was allocated when answers to all nine questions were “no” or that they experience anxiety, but only rarely. The category of mild food insecurity corresponds to worrying sometimes or often about food, and/or having undesirable food, and/or having limited variety. The category of moderate food insecurity describes a condition of a monotonous diet and/or unwanted food sometimes or often and/or has started to cut back on the amount by decreasing meal size or the number of meals, rarely or occasionally. Decreasing portion size often and/or skipping meals and/or going hungry at least rarely qualifies a household for severe food insecurity [44].
Based on the procedure prepared by Coates et al. [44], the research investigated two indexes of HFIAS: Household Food Insecurity Access Scale prevalence: HFIASP, a categorical variable, and Household Food Insecurity Access Scale Score: HFIAS score, a continuous variable. A standard procedure of scoring was used; questions of occurrence were named 1–9. Where the response to the occurrence of the question was “no”, the occurrence frequency was named 0. Where the occurrence question was “yes”, the occurrence frequency was consequently named as 1 for all cases where the condition rarely occurred, 2 for sometimes, and 3 for often in the past 30 days. In short, each question of occurrence was allocated four different codes (e.g., Q1 was labeled as Q1 = 0 for no condition, Q1 = 1 for infrequent occurrence, Q1 = 2 for the occurrence of occasional, or Q1 = 3 for the occurrence of frequent) (Table 1). However, The HFIAS score was measured by adding the code of frequency of occurrence, which gives the continuous measurement of the level of food insecurity with households obtaining scores of between 0 and 27. However, according to the score, the minimum score of 0 showed the most food security families, and a maximum score of 27 showed more food-insecure households.
HFIAP was measure in two stages. In Stage 1, Household Food Insecurity Access (HFIA), a group variable was measured for each family by using the assigned codes of the food insecurity mark each household fell under. Therefore, four groups of food insecurity were generated consecutively (1 = food secure, 2 = mildly food insecure, 3 = moderate food insecure, and 4 = severe food insecure). In Stage 2, we measured the percentage of the household that falls in each of the four categories of food insecurity by dividing the household member in one group by the all number of households in the four groups, multiplied by 100.
Household food insecurity access categorical variable was calculated from Table 1 as:
Food secure = 1 if (Q1 = 0 or Q1 = 1) and Q2 = 0 and Q3 = 0 and Q4 = 0 and Q5 = 0 and Q6 = 0 and Q7 = 0 and Q8 = 0 and Q9 = 0
Mild food insecure = 2 if (Q1 = 2 or Q1 = 3 or Q2 = 1 or Q2 = 2 or Q2 = 3 or Q3 = 1 or Q4 = 1 and Q5 = 0 and Q6 = 0 and Q7 = 0 and Q8 = 0 and Q9 = 0)
Moderate food insecure = 3 if (Q3 = 2 or Q3 = 3 or Q4 = 2 or Q4 = 3 or Q5 = 1 or Q5 = 2 or Q6 = 1 or Q6 = 2 and Q7 = 0 and Q8 = 0 and Q9a = 0)
Severity food insecure = 4 if (Q5 = 3 or Q6 = 3 or Q7 = 1 or Q7 = 2 or Q7 = 3 or Q8 = 1 or Q8 = 3 or Q9 = 1 or Q9 = 2 or Q9 = 3)

2.4. Analytical Approach

In this study, the target variable was the food insecurity levels in farming households with the status of food secure, mild food insecure (marginal food secure), moderate food insecure, and severe food insecure, which is ordinal in nature as the degree of severity increases. For investigating such ordinal data, literature employs an ordered logit and probit framework [48,49]. Nevertheless, selecting between the two approaches is primarily a matter of convenience and which method is more widely used in the particular field of study [50]. However, this research uses the ordered probit framework, as this model has wider applicability to measure the ordinal nature of the dependent variable. Following Greene [49] and Long [51], Equation (2) specifies:
y i = x i β + ε i
where y i = household food insecurity with four levels in increasing level of food insecurity, coded as 1 = food secure, 2 = mild food insecure, 3 = moderate food insecure, and 4 = severe food insecure; x i = vector of observed nonrandom explanatory variables determining the farm household food insecurity; and ε i = an error of random term with mean 0 and variance 1. The ordinal variable   y i is related to y i , based on the household choice (i) between the alternative (0, 1, 2, …, j) and in relation to numerous threshold point μ j ( μ 0 = y μ j = ∞), as recognized in the models below [52]:
y i = { 1   if   y i μ 2     Food   secure                       2   if     μ 2 <   y i μ 3     Mildly   food   insecure             3   if   μ 3   <   y i μ 4   Moderately   food   insecure       4   if   y i > μ 4     Severly   food   insecure          
The μ show the thresholds or cut-points to be predicted for any category. Thus, as indicated by [50], the equation for the likelihood with four observed outcomes for the ordered probit model will be:
Prob   ( P i j = p   [ μ j 1      <  y i   ≤    μ j ] = ( μ J 1 x i β  <   ε i     μ I x i β ) =   θ   ( μ j X i   β )     θ     ( μ j 1 x i β )
where θ = the Cumulative Distribution Function (CDF) of ε i ; β is coefficients of regression for ( x i ) and j is the response categories.
As Greene [49] points out, since there is no meaningful condition mean purpose and, in the ordered probability, models’ marginal effects are difficult to know, the effects of the change in the explanatory variables on cell likelihoods are usually measured. The model specifies:
α p r o b ( c e l l j ) α x i   = [ θ   ( μ j 1   x i β ) θ   ( μ j x i   β ) ]   β
With θ being the standard normal density function. In this light of the preceding discussion, the empirical model of this study is specified as:
F S i j   = Logit ( y ) = α j + β 1 x 1 + β 2 x 2 + + β n x n + ε i
In this model, the dependent variable (food insecurity level), assessed by the HFIAS score, is examined according to exogenous variables observed. The α j parameters, named threshold or breakpoints, are in increasing order ( α 1 < α 2 < …) [48]. The ordered cumulative numbers are j = 1, 2, …, j − 1; here, j is represents the categorical variable of ordinal [52]. In this manuscript j = 4.
The main limitation of the ordered probit technique that creates the single crossing result is the linearity of the single index construction. In addition to this problem, the model sometimes becomes too restrictive, due also to its other two assumptions: distributional assumption and constant threshold assumption [53]. Furthermore, the model cannot report the separate heterogeneity that is likely to be present on microdata at the household level [51]. Despite these limitations, the approach has been broadly used in the literature over the previous four decades or so (see, for instance, [50]). This study, thus, uses an ordered probit model while acknowledging its limitations.

3. Results and Discussion

3.1. Descriptive Results

The descriptive statistics of the explanatory factors used in this research are presented in Table 2. Several explanatory factors were included to predict the effect of socio-economic drivers on the food insecurity level in farming households. They mainly include factors related to socio-economics, such as household head age, education level, gender, marital status, farming experience, family size, dependency ratio, farm income, non-farm income, land size, livestock, membership, extension contact, borrowing, farm disease, war, and flood variables. The summary of results for socio-economic factors in the entire sample indicates that the mean household head age value was 50.1 years, suggesting that wheat farmers in the Takhar province are commonly middle aged. The findings also show that the typical household head is 93.12% likely to be a male or male-headed household, 91.22% likely to be married, and their average farming experience is likely to be 28 years. The respondents had relatively poor education; 54.58% had no formal education, and 16.03% had primary education, while 17.17% and 12.21% had secondary and tertiary education, respectively.
The average household size was made up of 9.14 members, and the average mean of dependency ratio was made up of 4.00 persons (Table 2). In this research, the mean yearly farm income was AF 64,000.99 (USD 800.33). More than half of the respondents (53.43%) had non-agricultural income. The farm household’s average land size was 3.77 hectares; however, most households were categorized as under less than one hectare. Livestock ownership is a vital asset in farm households in Takhar province; the average number of livestock owned by a farm household was 15.00, ranging from ox to horse, goat, cattle, milking cow, non-milking cow, sheep, and mule. The percentage of farm households participating in any group membership was 46.94%, while the average farm household access to extension service was 41.98%. Another critical item to point out is borrowing money from informal sources. As many 63.36% of the farm families have experience borrowing money from informal rural credit in this sample size. The majority of the respondents, 62.21%, had food shortages due to war. Around 64.50% of the households reported farm disease affects their food shortage, while 70.61% of the households demonstrated that flooding affects household food security.

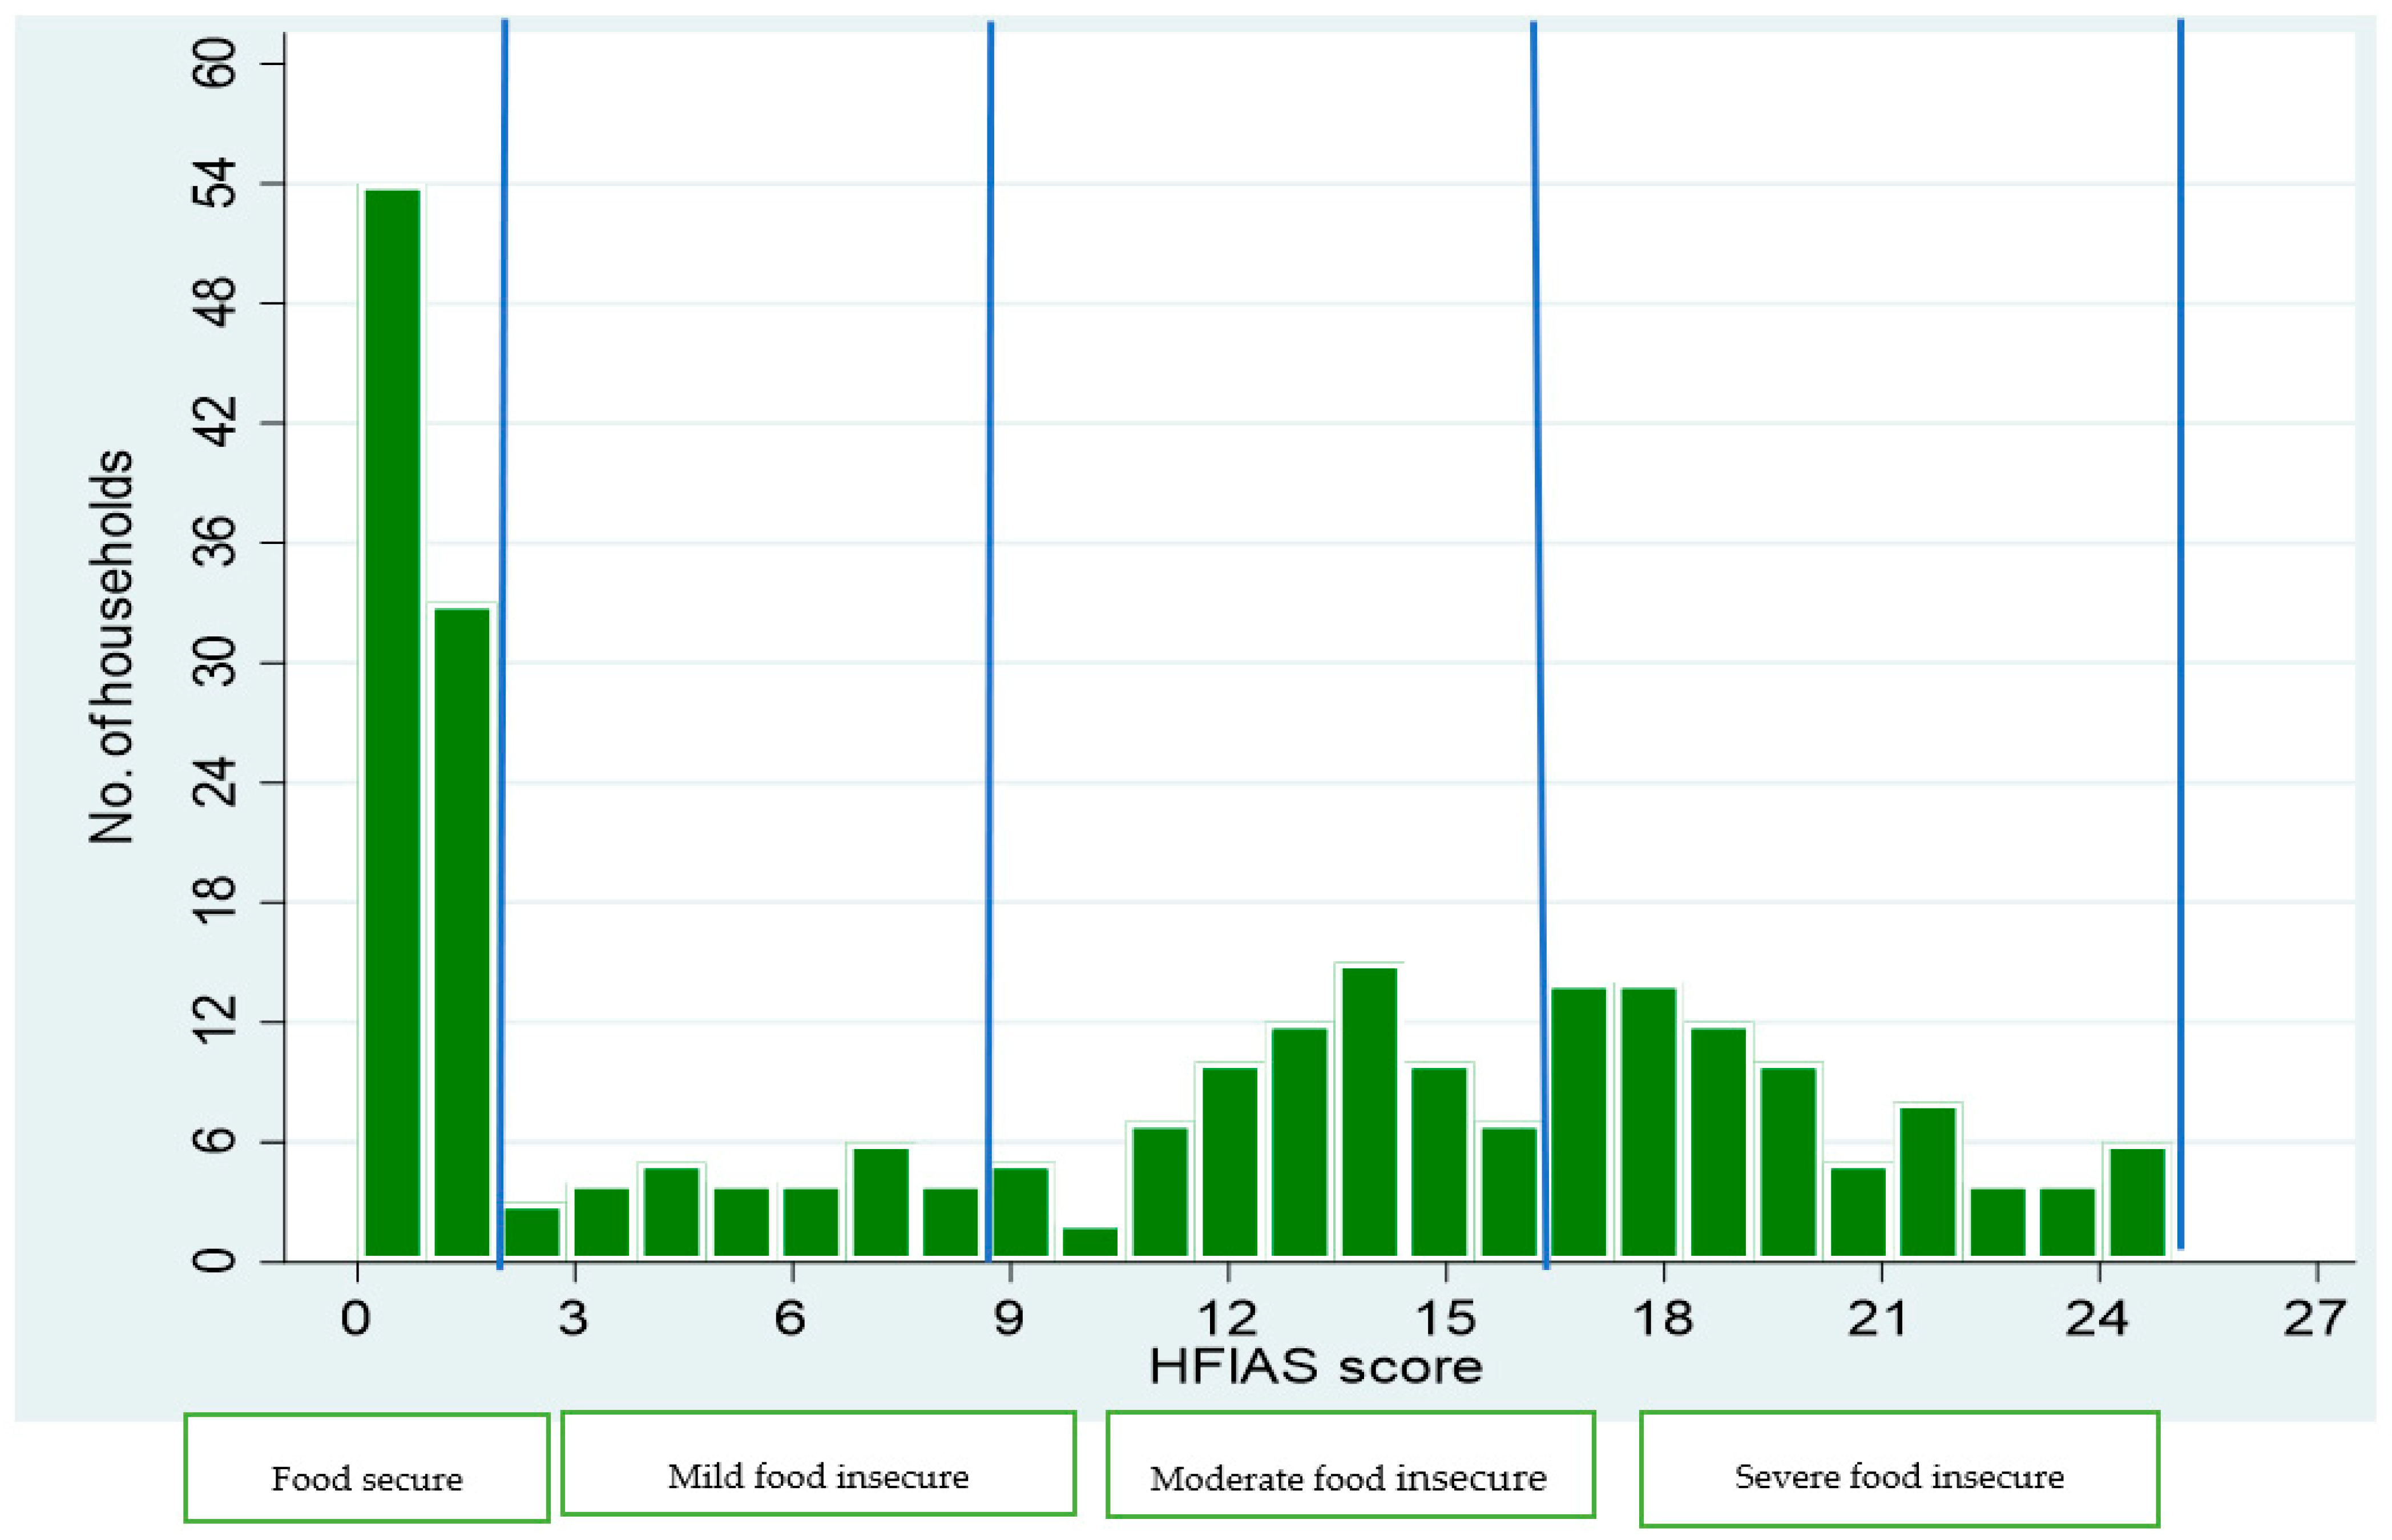
3.2. Household Food Insecurity Status

Table 3 provides the status of food insecurity prevalence rates in farming households. Accordingly, out of 262 surveyed farming households, the food insecurity prevalence was found to be 33.21%, 11.07%, 25.19%, and 30.53% as food secure, mild food insecure, moderate food insecure, and severe food insecure, respectively. Moreover, Figure 1 summarizes the distribution of farm households by HFIAS score. The finding indicates that about 20.6% (54) of the households have a zero household food security score; they have experienced none of the food insecurity, and more than half, 55.7% (246) of households, recorded a high household food insecurity score. Thus, the identified food insecurity prevalence estimate is much higher, which may be because most farm households have been unable to produce sufficient food at the household level, perhaps due to the low efficiency of farmers and traditional agriculture, prolonged conflicts, a lack of adequate infrastructure, rising food prices, and lack of supports to households. However, relevant intervention on food security programs should be considered in the study areas.
In the study area, food insecurity risk indicates a variation across districts in this result. Households under severe food insecurity are much higher in the Talu-qun district (34.18%) and Kalafgan district (44.23%) than the average of total households (30.53%) in the study area Table 3. This may be due to the low agricultural production, weak extension services, high conflict, high proportion of farm disease, high proportion of flood, and low proportion of livestock ownership. These findings are proof of concerns that food insecurity is a multi-dimensional phenomenon faced differently by different household types and groups of the population [54,55].
Table 4 indicates the socio-economic factors of the sample study based on the level of food insecurity in households. Aggregate findings show that most of the explanatory variables are significantly related to moderate and severe food insecurity in the farming household. The specific results indicate that an increasing level of education seems to be linked with the food security category. The education level is reduced in the severe food insecurity groups. In addition, the large size of family and dependency ratio in farming households were correlated with more incidence of food insecurity. Farm income and access to non-agricultural income appeared to be influenced by severe and moderate food insecurity factors most often.
The interview results in Table 4 also indicate that the average livestock number owned was lower among households of severe food insecurity, while it was higher in food-secure categories in the research area. Regarding the institution factor, farming households struggling with food insecurity had the lowest access to group membership and extension contact, while there was higher access in the food-secure category. As a result, farming households with experience borrowing money from informal credit resources are located mainly in the food insecurity category. In addition, the incidence of farm disease, which causes food shortage in food-secure households, was small, but it was large in food-insecure families.

3.3. Factors Affecting Household Food Insecurity Prevalence

We present in Table 5 the coefficient estimate and p-values from the ordered probit techniques as marginal effects for food insecurity. Since the coefficient of ordered probit does not express us if there is a variation in the status of food insecurity due to the variation in an independent variable, the marginal effects (post-estimation) are considered in this part. These marginal effects are construed according to the sign and group.
Education level was found to have a statistically significant association with food insecurity in farming households. This result revealed that with an increase in the level of education, there was a 12.4% and 3.7%, respectively, more likelihood of farm households being in the food secure and mild food insecure groups. In contrast, it was approximately 6.4% and 9.6% less likely that these respondents were from farmers’ households characterized by moderate and severe food insecurity, respectively. Further, this result indicates that a farm household head with a low education level was more likely to be food insecure (Table 5). This finding is supported by recent research in South Africa, Iran, Ethiopia, and East Africa [4,11,45,56]. Our finding may be explained by education as the key to obtaining information on better agriculture production, better family planning, increased household saving, better adoption of agricultural technologies, increased productivity through improved manufacturing, and better decision making. However, education played a key role in enhancing people’s abilities to establish a better aspect in the fight against severe food insecurity. An educated farmer or head of the family is more likely to adopt diversification actions of income, adopt new technologies in farming, reach a higher productivity level, and improve food security.
The findings demonstrate that a large dependency ratio of members generates more stress in a farming household’s food security. For one unit increase in dependency ratio size, the probability of a household being in the food secure and mild food insecure (marginally food secure) categories decreases. In contrast, there is a rise in the chance of the household being in the moderate and severe food insecure categories (Table 5). This result is consistent with recent research in Nepal and Rwanda [57,58]. This could be because the big dependency ratio (less than 15 and above 65 years old) imposes their food demand on the active member. A higher dependency ratio reduces per capita income in the household and consumption, affecting the household members’ well-being. These findings support the implementation of community-based education, which could result in lower birth rates and, as a result, a smaller dependency ratio.
Based on our findings, yearly farm income represents a significant factor linked with food insecurity status in farmers’ families. The results indicated that one additional unit increase in farm income (yearly) raises the likelihood of experiencing food security and mild food insecurity (marginally food secure) and reduces the susceptibility of farm households to moderate and severe food insecurity (Table 5). This may be because when farms’ marginal productivity and contribution to the family income increase, the farm household food security is expected to increase. This result aligns with a study conducted in Ethiopia by Sani and Kemaw [59]. Thus, this research recommends that due to the high level of food insecurity in Afghanistan, more investments are needed in the agricultural sector.
Non-agriculture income was confirmed to be an essential factor in determining the food insecurity prevalence in farmers’ households. Our finding indicates that the family that receives non-agriculture income was 11.5% more likely to be in the food security and 3.4% more likely in the mild food insecure (marginally food secure) categories, while 5.7% were less likely to be in the moderate group, and 9.2% were less likely to be in the severe food insecure category than those who did not receive non-agricultural income (Table 5). This may be due to the fact that farming households receiving non-farm income can increase access to and utilization of food for their diet. This result agrees with a study reported from Nigeria [60]. Our result indicates a slight difference or inconsistency with the research conducted in Zambia [33]. They reported that in farm household non-agricultural income decreased the chance of farm households being food secure. However, this study encourages households to pay attention to non-agricultural income to improve food security.
The livestock unit, which is the sum of livestock number, changed to the unit of common (livestock owned by the household head) was an important factor linked with food insecurity status in farm households. An increase in livestock number improved the probability of the farm household being in the food secure and mild food insecure categories, while it reduced the chance of being in the moderate and severe food insecure classes (Table 5). This may be because livestock ownership effectively provides milk, meat, and other high-quality products of dairy and improves the quantity of nutritious food available to the household. Further, livestock sales, which typically include live animals, increase income, which may develop the household’s buying power, supporting livestock ownership’s significance on the increased farm household food insecurity. This finding is supported by recent research performed in East Africa and Ethiopia [4,11]. However, the government must formulate strategies that focus on increasing livestock production in the research region, as livestock is a crucial food insecurity driver.
The other forecaster that is an important variable for food insecurity is the membership of farmer organizations. The estimation of the econometric model demonstrates that farmer membership decreases the chance of farmers’ families being in the severe food insecurity category by 8.5%, while such a household was 5.7% less likely to be in the moderate food insecure, 3.1% more likely to be in the mild food insecure, and 11.1% more likely to be in the high food secure categories (Table 5). This may be because membership of farmer organizations avails the member benefits, such as farmer input support, access to credit, and training for members. Moreover, farmers groups also allow members to share their experiences among farmers and other existing groups. This result is consistent with several earlier studies conducted in Zambia, and Kenya [24,33]. This finding suggested that supporting farmers’ association and the empowerment of existing formal and informal groups, mainly through mobilizing of community, should be encouraged by government and private organizations. Furthermore, official registration should be facilitated and there should be priority for farmers groups at offices of the agricultural district.
According to this study, borrowing money from informal rural creditors was another associated factor in farmers’ household food insecurity. The results show that the farm households who do not receive a loan from informal credit sources in rural areas have a chance to be placed in food secure (13.4%) and mild food insecurity (3.3%) categories. The farm households that receive a loan from informal rural creditors are more likely to be placed in moderate (7.2%) and severe (9.5%) food insecurity categories (Table 5). This indicates that the risk of being in moderate and severe food insecure categories for the farm household who received a loan from informal rural money lenders was higher than the farm households who did not take a loan from informal rural credit. This result can be attributed to the fact that farm households borrowing money from informal rural credit resources with a high-interest amount per month repayment rate may reduce their income and production. This result is supported by the findings of the study carried out in Southern Ethiopia by Mota et al. [35]. Our finding contradicts a study by Gebre and Rahut [4] in East Africa, who found a positive relationship between a taken loan from informal sources and food security. This research encourages giving consideration to formal credit; access to formal credit in the farm household has its own contribution to decreasing the severity of food insecurity. Thus, the government should pay attention to creating formal agricultural credit and soft loan resources for farmers to increase farming household food security.
In addition, farm disease was a significant variable linked with food insecurity in farmers’ households in the research area. This finding indicates that farm disease increased the chance of households being in moderate and severe food insecurity by 8.3% and 10.7%, respectively. In contrast, the increased chance of farm households that did not experience farm disease being in the food secure and mild food insecurity categories were 15.4% and 3.5%, respectively (Table 5). This may be because farm disease reduces the quantity of production and quality of food crops; losses may be chronic or catastrophic, which may reduce farm household food status. This finding is consistent with a similar study carried out in Niger by Zakari and Song [61]. Similarly, a global report on food crises demonstrated that farm diseases, especially livestock diseases, are the key factors driving acute food insecurity in Afghanistan [62]. As such, this finding encourages the government to introduce policies to combat farm disease, which could improve food security.
Flooding was another major factor that caused food insecurity in farm households. The result indicates that farm households that have experienced floods in the previous years tend to present a decline in food security by 15.7%, while such households were 3.2% less likely to be in the mild food insecure category, 8.6% more likely to be in the moderate food insecure category, and 10.3% more likely to be in the severe food insecure category. This could be due to the fact that flood influences agricultural systems in several ways, such as crop damaging and causing persistently low productivity that could lead to severe food shortage in farming households. This finding agrees with recent research conducted in Afghanistan, and Niger [40,61].
The impact of conflicts on creating pressures on farm household food security is shown in Table 5. Households exposed to higher conflict levels experienced a decline in food security and mild food insecurity by 13.1% and 3.2%, respectively. By comparison, there was 6.9% and 9.3% more chance that households fell into the moderate and severe food insecurity categories. This finding indicates that the risk of families in the higher conflict level area being severely food insecure was higher than households that were not in higher conflict level areas. This may be because of high food prices, joblessness, lack of market, lack of education access, decreased agricultural productivity, and lack of food access in higher conflict levels areas. This study finding was consistent with previous research in Afghanistan [17,40,62,63].

4. Conclusions and Policy Implications

Our result highlights the high food insecurity prevalence among farming families in Afghanistan. From econometric model estimation, the significant predictors of food insecurity were the education level, dependency ratio, and farm income, access to non-agriculture income, livestock units, farmer organization membership, informal credit, farm disease, flood, and war. The findings indicated that farming households with a high degree of household head education, a high farm income, access to non-agriculture income, and large livestock units were less likely to be food insecure. The farming household with a large dependency ratio size and who took a loan from informal rural sources were more likely to be food insecure. Similarly, farming households that experienced food shortages because of farm disease, flood, and war were significantly linked with food insecurity.
Based on these empirical findings, the present article indicated some issues related to policy in Afghanistan. The responsible body should create adequate awareness for family planning to reduce dependency ratio sizes. Due to the significance of education in improving food security, the progress of community-based education should be systemically approached. Mainly, a household with a low education level should prioritize increasing education access, while the present educational institutions in the region should be supported. Enabling access to non-agricultural income for farming households would be significant to help them improve food security. Livestock sector development programs should be considered a necessary intervention in improving rural household food security. Given that a high output value has a probability of improving food security, effort should be intensified to increase the agricultural productivity through better production techniques (such as improved agricultural systems, building strong farmer’s associations, creating access to credit to households, and access to information on farm diseases). Comprehensively better productivity will lead to income growth which translates into increased purchasing power, which will increase food expenditure and, in turn, decrease food insecurity. Finally, further studies should be carried out to recognize other food insecurity drivers in each specific case because this objective is broad.

Author Contributions

Z.H.: Conceptualization, funding acquisition, supervision of the study, and review, and editing; S.A.S.: investigation, resources, methodology, formal analysis, visualization and writing of the manuscript; S.S.: visualization, supervision and review, and editing; R.R.: data collection and review and editing; S.Y.A.: data collection; G.M.: review and editing; K.N.: review and editing. All authors have read and agreed to the published version of the manuscript.

Funding

This work was received funding support from the Innovation Project on theory and Policy of Agriculture and Rural Modernization (ASTIP)–IAED-2021-02.

Institutional Review Board Statement

Not applicable.

Informed Consent Statement

Not applicable.

Data Availability Statement

The data supporting the finding of this study are available from the Institute of Agricultural Economics and Development, Chinese Academy of Agricultural Sciences.

Conflicts of Interest

The authors declare that there are no conflict of interest.

References

  1. Sarlio-Lähteenkorva, S.; Lahelma, E. Food insecurity is associated with past and present economic disadvantage and body mass index. Nutrition 2001, 131, 2880–2884. [Google Scholar] [CrossRef]
  2. FAO. The State of Food Insecurity in the World, Addressing Food Insecurity in Protracted Crises; FAO: Rome, Italy, 2010; Available online: http://www.fao.org/3/i1683e/i1683e (accessed on 31 July 2021).
  3. Gebrie, Y.F. Bayesian regression model with application to a study of food insecurity in household level: A cross sectional study. BMC Public Health 2021, 21, 619. [Google Scholar] [CrossRef]
  4. Gebre, G.G.; Rahut, D.B. Prevalence of household food insecurity in East Africa: Linking food access with climate vulnerability. Clim. Risk Manag. 2021, 33, 100333. [Google Scholar] [CrossRef]
  5. Fao, I.; UNICEF; WFP; WHO. The state of food security and nutrition in the world 2019. In Safeguarding Against Economic Slowdowns and Downturns; FAO: Rome, Italy, 2019; Available online: https://docs.wfp.org/api/documents/WFP-0000106760/download/ (accessed on 31 July 2021).
  6. Fao, I.; UNICEF; WFP; WHO. The State of food security and nutrition in the world 2018. In Building Climate Resilience for Food Security and Nutrition; FAO: Rome, Italy, 2018; Available online: https://www.unicef.org/media/47636/file/UNICEF-StateOfFoodSecurity.pdf (accessed on 31 July 2021).
  7. Nosratabadi, S.; Khazami, N.; Abdallah, M.B.; Lackner, Z.; Band, S.S.; Mosavi, A.; Mako, C. Social Capital contributions to food security: A comprehensive literature review. Foods 2020, 9, 1650. [Google Scholar] [CrossRef]
  8. WFP. Risk of Hunger Pandemic as COVID-19 Set to Almost Double Acute Hunger by End of 2020. Available online: https://insight.wfp.org/covid-19-will-almost-doublepeople-in-acute-hunger-by-end-of-2020-59df0c4a8072 (accessed on 31 July 2021).
  9. Lee, A.C.; Morling, J. Coronavirus disease 2019: Emerging lessons from the pandemic. Public Health 2020, 186, A1. [Google Scholar] [CrossRef]
  10. Otekunrin, O.A.; Otekunrin, O.A.; Fasina, F.O.; Omotayo, A.O.; Akram, M. Assessing the zero hunger target readiness in Africa in the face of COVID-19 pandemic. J. Sustain. Agric. 2020, 35, 213–227. [Google Scholar] [CrossRef]
  11. Ayele, A.W.; Kassa, M.; Fentahun, Y.; Edmealem, H. Prevalence and associated factors for rural households food insecurity in selected districts of east Gojjam zone, Northern Ethiopia: Cross-sectional study. BMC Public Health 2020, 20, 202. [Google Scholar] [CrossRef] [PubMed] [Green Version]
  12. Fao, I.; UNICEF; WFP; WHO. The State of Food Security and Nutrition in the World 2020; FAO: Rome, Italy, 2020; Available online: http://www.fao.org/3/ca9692en/ca9692en.pdf (accessed on 31 July 2021).
  13. Samim, S.; Zhiquan, H. Assessment of food security situation in Afghanistan. SVU-Int. J. Agric. Sci. 2020, 2, 356–377. [Google Scholar] [CrossRef]
  14. FAO. Integrated Food Security Phase Classification in Afghanistan; FAO: Rome, Italy, 2021; Available online: http://www.ipcinfo.org/ (accessed on 31 July 2021).
  15. World Bank. Afghanistan Development Surviving the Storm; World Bank: Rome, Italy, 2020; Available online: https://openknowledge.worldbank.org/handle/10986/34092 (accessed on 31 July 2021).
  16. Poole, N.; Amiri, H.; Amiri, S.M.; Farhank, I.; Zanello, G. Food production and consumption in Bamyan Province, Afghanistan: The challenges of sustainability and seasonality for dietary diversity. Int. J. Agric. Sustain. 2019, 17, 413–430. [Google Scholar] [CrossRef]
  17. D’Souza, A.; Jolliffe, D. Conflict, food price shocks, and food insecurity: The experience of Afghan households. Food Policy 2013, 42, 32–47. [Google Scholar] [CrossRef] [Green Version]
  18. CSO. Socio-Demographic and Economic Survey. Survey Report of Central Statistic Organisation 2018. Available online: https://afghanistan.unfpa.org/sites/default/files/pub-pdf/SDES-Ghor-English-Low-Resolution-Version.pdf (accessed on 17 July 2021).
  19. Samim, S.; Zhiquan, H.; Wen, Y.; Amini, S.Y.; Eliw, M. Assessment of Cereal self-sufficiency and food balance projection in Afghanistan. Asian J. Agric. Ext. Econ. Sociol. 2021, 39, 38–51. [Google Scholar] [CrossRef]
  20. Gohar, A.; Ward, F.; Amer, S. Economic performance of water storage capacity expansion for food security. J. Hydrol. 2013, 484, 16–25. [Google Scholar] [CrossRef]
  21. Kakar, K.; Xuan, T.D.; Haqani, M.I.; Rayee, R.; Wafa, I.K.; Abdiani, S.; Tran, H.-D. Current situation and sustainable development of rice cultivation and production in Afghanistan. Agriculture 2019, 9, 49. [Google Scholar] [CrossRef] [Green Version]
  22. Mughal, M.; Fontan Sers, C. Cereal production, undernourishment, and food insecurity in South Asia. Rev. Dev. Econ. 2020, 24, 524–545. [Google Scholar] [CrossRef]
  23. Schmidhuber, J.; Tubiello, F.N. Global food security under climate change. Proc. Natl. Acad. Sci. USA 2007, 104, 19703–19708. [Google Scholar] [CrossRef] [Green Version]
  24. Mwangi, V.; Owuor, S.; Kiteme, B.; Giger, M.; Jacobi, J.; Kirui, O. Linking Household food security and food value chains in North West Mt. Kenya. Sustainability 2020, 12, 4999. [Google Scholar] [CrossRef]
  25. Elham, H.; Zhou, J.; Diallo, M.; Ahmad, S.; Zhou, D. Economic Analysis of smallholder maize producers: Empirical evidence from Helmand, Afghanistan. J. Agric. Sci. 2020, 12. [Google Scholar] [CrossRef]
  26. Omerkhil, N.; Chand, T.; Valente, D.; Alatalo, J.M.; Pandey, R. Climate change vulnerability and adaptation strategies for smallholder farmers in Yangi Qala District, Takhar, Afghanistan. Ecol. Indic. 2020, 110, 105863. [Google Scholar] [CrossRef]
  27. Tavva, S.; Aw-Hassan, A.; Rizvi, J.; Saharawat, Y. Technical efficiency of wheat farmers and options for minimizing yield gaps in Afghanistan. Outlook Agric. 2017, 46, 13–19. [Google Scholar] [CrossRef]
  28. Odjidja, E.N.; Hakizimana, S. Data on acute malnutrition and mortality among under-5 children of pastoralists in a humanitarian setting: A cross-sectional standardized monitoring and assessment of relief and transitions study. BMC Res. Notes 2019, 12, 434. [Google Scholar] [CrossRef] [PubMed] [Green Version]
  29. Dercon, S.; Christiaensen, L. Consumption risk, technology adoption and poverty traps: Evidence from Ethiopia. J. Dev. Econ. 2011, 96, 159–173. [Google Scholar] [CrossRef] [Green Version]
  30. Sileshi, M.; Kadigi, R.; Mutabazi, K.; Sieber, S. Analysis of households’ vulnerability to food insecurity and its influencing factors in East Hararghe, Ethiopia. J. Econ. Struct. 2019, 8, 41. [Google Scholar] [CrossRef]
  31. Capaldo, J.; Karfakis, P.; Knowles, M.; Smulders, M. A Model of Vulnerability to Food Insecurity; Food and Agriculture Organization (FAO): Rome, Italy, 2010; pp. 1838–2521. [Google Scholar]
  32. Ogunniyi, A.I.; Omotoso, S.O.; Salman, K.K.; Omotayo, A.O.; Olagunju, K.O.; Aremu, A.O. Socio-economic Drivers of food security among rural households in Nigeria: Evidence from Smallholder maize farmers. Soc. Indic. Res. 2021, 155, 583–599. [Google Scholar] [CrossRef]
  33. Nkomoki, W.; Bavorová, M.; Banout, J. Factors associated with household food security in Zambia. Sustainability 2019, 11, 2715. [Google Scholar] [CrossRef] [Green Version]
  34. Nkegbe, P.K.; Abu, B.M.; Issahaku, H. Food security in the savannah accelerated development authority zone of Ghana: An ordered probit with household hunger scale approach. Agric. Food Secur. 2017, 6, 35. [Google Scholar] [CrossRef] [Green Version]
  35. Mota, A.A.; Lachore, S.T.; Handiso, Y.H. Assessment of food insecurity and its determinants in the rural households in Damot Gale Woreda, Wolaita zone, southern Ethiopia. Food Secur. 2019, 8, 1–11. [Google Scholar] [CrossRef] [Green Version]
  36. Maziya, M.; Mudhara, M.; Chitja, J. What factors determine household food security among smallholder farmers? Insights from Msinga, KwaZulu-Natal, South Africa. Agrekon 2017, 56, 40–52. [Google Scholar] [CrossRef]
  37. Silvestri, S.; Sabine, D.; Patti, K.; Wiebke, F.; Maren, R.; Ianetta, M.; Carlos, Q.F.; Mario, H.; Anthony, N.; Nicolas, N.; et al. Households and food security: Lessons from food secure households in East Africa. Agric. Food Secur. 2015, 4, 23. [Google Scholar] [CrossRef] [Green Version]
  38. Phami, P.; He, J.; Liu, D.; Ding, S.; Silva, P.; Li, C.; Qin, Z. Exploring the Determinants of Food Security in the Areas of the Nam Theun2 Hydropower Project in Khammuan, Laos. Sustainability 2020, 12, 520. [Google Scholar] [CrossRef] [Green Version]
  39. Rubhara, T.T.; Mudhara, M.; Oduniyi, O.S.; Antwi, M.A. Impacts of cash crop production on household food security for smallholder farmers: A case of Shamva District, Zimbabwe. Agriculture 2020, 10, 188. [Google Scholar] [CrossRef]
  40. Oskorouchi, H.R.; Sousa-Poza, A. Floods, food security, and coping strategies: Evidence from Afghanistan. Agric. Econ. 2021, 52, 123–140. [Google Scholar] [CrossRef]
  41. Gao, C.; Fei, C.J.; McCarl, B.A.; Leatham, D.J. Identifying Vulnerable households using machine learning. Sustainability 2020, 12, 6002. [Google Scholar] [CrossRef]
  42. Belda, M.; Holtanová, E.; Halenka, T.; Kalvová, J. Climate classification revisited: From Köppen to Trewartha. Clim. Res. 2014, 59, 1–13. [Google Scholar] [CrossRef] [Green Version]
  43. Alamyar, R.; Boz, I. Problems and solutions in rice production and marketing in Takhar Province of Afghanistan. J. Int. J. Sci. Res. Manag. 2018, 6, 839–844. [Google Scholar] [CrossRef]
  44. Coates, J.S.A.; Bilinsky, P. Household Food insecurity access scale (HFIAS) for measurement of household food access: Indicator guide (v.3). In Food and Nutrition Technical Assistance Project; Academy for Educational Development: Washington, DC, USA, 2007. [Google Scholar]
  45. Devereux, S.; Tavener-Smith, L. Seasonal food insecurity among farm workers in the northern cape, South Africa. Nutrients 2019, 11, 1535. [Google Scholar] [CrossRef] [Green Version]
  46. Rautela, G.; Ali, M.K.; Prabhakaran, D.; Narayan, K.M.V.; Tandon, N.; Mohan, V.; Jaacks, L.M. Prevalence and correlates of household food insecurity in Delhi and Chennai, India. Food Secur. 2020, 12, 391–404. [Google Scholar] [CrossRef]
  47. USDA. International Food Security, Assessment 2018–2028; United States Department of Agriculture (USDA): Washington, DC, USA, 2018. Available online: https://www.ers.usda.gov/webdocs/publications/89391/gfa-29.pdf?v=0 (accessed on 17 July 2021).
  48. Cordero-Ahiman, O.V.; Vanegas, J.L.; Beltrán-Romero, P.; Quinde-Lituma, M.E. Determinants of food insecurity in rural households: The case of the Paute River basin of Azuay Province, Ecuador. Sustainability 2020, 12, 946. [Google Scholar] [CrossRef] [Green Version]
  49. Greene, W.H. Econometric Analysis, 7th ed.; Pearson: London, UK, 2012. [Google Scholar]
  50. Long, J.S.; Long, J.S. Regression Models for Categorical and Limited Dependent Variables, 1st ed.; Sage Publications: London, UK; Volume 1997, pp. 114–145.
  51. Greene, W.H.; Hensher, D.A. Modeling Ordered Choices: A Primer, 1st ed.; Cambridge University Press: Cambridge, UK, 2010; Volume 2010, pp. 109–119. [Google Scholar]
  52. Wooldridge, J.M. Econometric Analysis of Cross Section and Panel Data, 2nd ed.; MIT Press: London, UK, 2010; Volume 108, pp. 504–509. [Google Scholar]
  53. Boes, S.; Winkelmann, R. Ordered response models. Allg. Stat. Arch. 2006, 90, 167–181. [Google Scholar] [CrossRef]
  54. Barrett, C.B. Measuring Food insecurity. Science 2010, 327, 825–828. [Google Scholar] [CrossRef] [PubMed]
  55. Drimie, S.; Casale, M. Multiple stressors in Southern Africa: The link between HIV/AIDS, food insecurity, poverty and children’s vulnerability now and in the future. AIDS Care 2009, 21, 28–33. [Google Scholar] [CrossRef] [Green Version]
  56. Mohammadi Nasrabadi, F.; Omidvar, N.; Khoshfetrat, M.; Kolahdooz, F. Household food insecurity in the Islamic republic of Iran: A systematic review and meta-analysis. East. Mediterr. Health J. 2014, 20, 698–706. [Google Scholar] [CrossRef] [PubMed]
  57. Maharjan, K.L.; Joshi, N.P. Determinants of household food security in Nepal: A binary logistic regression analysis. J. Mt. Sci. 2011, 8, 403–413. [Google Scholar] [CrossRef] [Green Version]
  58. Bolarinwa, O.D.; Ogundari, K.; Aromolaran, A.B. Intertemporal evaluation of household food security and its determinants: Evidence from Rwanda. Food Secur. 2020, 12, 179–189. [Google Scholar] [CrossRef]
  59. Sani, S.; Kemaw, B. Analysis of households food insecurity and its coping mechanisms in WesternEthiopia. Agric. Food Econ. 2019, 7, 1–20. [Google Scholar] [CrossRef] [Green Version]
  60. Babatunde, R.O.; Qaim, M. Impact of off-farm income on food security and nutrition in Nigeria. Food Policy 2010, 35, 303–311. [Google Scholar] [CrossRef]
  61. Zakari, S.; Ying, L.; Song, B.J.S. Factors influencing household food security in West Africa: The case of Southern Niger. Sustainability 2014, 6, 1191–1202. [Google Scholar] [CrossRef] [Green Version]
  62. FSIN. Global Report on Food Crises: Joint Analysis for Better Decisions; FSIN: Rome, Italy; Washington, DC, USA, 2020; Available online: https://www.fsinplatform.org/global-report-food-crises-2020 (accessed on 17 July 2020).
  63. Bove, V.; Gavrilova, E. Income and livelihoods in the war in Afghanistan. World Develop. 2014, 60, 113–131. [Google Scholar] [CrossRef] [Green Version]
Figure 1. Distribution of farming households by HFIAS Score. Source: own survey.
Sustainability 13 10211 g001
Table 1. Household Food Insecurity Access questions.
No. Questions of Occurrence (in the Past 30 Days)
Q1Did you worry that your family would not have sufficient food?
Q2Did you or any family member not able to eat the types of foods you preferred due to lack of money?
Q3Did you or any family member have to eat a limited variety of food because of a lack of resources?
Q4Did you or any family member have to eat low food diversity because of lack of resources?
Q5Did you or any family member have to eat a smaller meal than you felt you required because there was insufficient food?
Q6Did you or any family member have to eat fewer meals in a day because there was not sufficient food?
Q7Was there ever no food to eat of any kind in your family due to lack of resources to get food?
Q8Did you or any family member go to sleep at night hunger because there was not sufficient food?
Q9Did you or any family member go a whole day and night without eating anything due to there was not sufficient food?
Source Adapted from Coats et al. [44].
Table 2. Characteristics of households surveyed.
VariablesDescriptionMeanSD%
AgeHousehold head’s age (year)50.112.42
Gender:Gender of household head (1 = male)0.930.25
Male93.12%
Education level:Household head education levels1.871.09
None54.58%
Primary16.03%
Secondary17.17%
Tertiary12.21%
Farming experienceTotal experience of farming (years)2812.99
Marital statusMarital status of the households head0.910.28
Married91.22%
Household sizeHousehold size in number9.143.26
Dependency ratio #Number of dependency ratio (inactive labor force) in household4.002.22
Farm incomeAmount of income the farmers make per year from their farm (Afghani)64000.99AF (800.33 US$)45.03
Non-farm income:Received non-agricultural income (1 if yes, 0 otherwise)0.530.49
yes53.43%
Land sizeActual land size in hectare3.773.16
Livestocklivestock number owned by the household15.0012.98
MembershipHousehold have membership in any social group such as a farmers association or cooperative (1 if yes, 0 otherwise)0.460.50
yes46.94%
Access to extensionAccess to extension service (1 if yes, 0 otherwise)0.410.49
yes41.98%
Informal creditHousehold has experience borrowing money from the informal sources in 2020 (1 if yes, 0 otherwise)0.630.48
Yes63.36%
Farm diseaseIf household food shortage is caused by farm disease (1 if yes, 0 otherwise)0.640.47
Yes64.50%
Flood:If household food shortage is caused by flooding (1 if yes, 0 otherwise)0.700.45
yes70.61%
War:If household food shortage is caused by war (1 if yes, 0 otherwise) 0.620.48
Yes62.21%
Note: n = 262; SD: standard deviation; SD%: this cell denotes the standard deviation (SD) unless noted otherwise (%). # Dependency ratio denotes the proportion of the economically inactive labor force(less than 15 and above 65 years old) [18]. Source: own survey.
Table 3. Classification of the households by prevalence of food insecurity status and geography.
Status of Food InsecurityTalu-qunKalafganFarkharWarsajTotal
Food secure3013242087
(37.97)(25.00)(33.80)(33.33)(33.21)
Mild food insecure2712829
(2.53)(13.46)(16.90)(13.33)(11.07)
Moderate food insecure209181966
(25.31)(17.31)(25.35)(31.67)(25.19)
Severe food insecure27 23171380
(34.18)(44.23)(23.94)(21.67)(30.53)
Total79527160262
(100)(100)(100)(100)(100)
Note: Pearson Chi2 (df = 9) = 17.91 prob. = 0.036. Source: own calculation.
Table 4. Summary statistics indicating typical values of the included variable by the of different food insecurity levels.
FactorsFood SecureMild Food InsecureModerate Food InsecureSevere Food Insecure
Household head Age (year)50.6348.6249.1050.91
Household head gender0.950.900.950.90
Education level
None11.8811.830.7645.45
Primary42.8511.9030.9514.28
Secondary71.116.6611.1111.11
Tertiary62.512.512.512.5
Farming experience (year)29.9726.1025.6928.63
Marital status (1 = married)0.970.750.830.96
Household size8.838.629.229.6
Dependency ratio2.313.723.954.27
Farm income82.7158.315854.27
Non-farm income (1 =yes)0.820.510.370.35
Land size (hectare)4.03.633.164.0
Livestock19.7516.5811.129.58
Membership in group (1 =yes)0.700.420.390.30
Access of extension (1 = yeas)0.620.310.360.28
Informal credit (1= yeas)0.360.680.750.81
Farm disease (1 = yeas)0.370.720.730.85
Flood (1 =yeas)0.580.510.790.84
War (1 =yeas)0.400.650.660.82
Source: own calculation.
Table 5. Average marginal effects’ ordered probit regression factors influencing the prevalence of level of household food insecurity.
Marginal Effects
VariablesCoefficient Food Insecurity
Food SecureMildModerateSevere
Household head Age (year)0.011−0.002−0.0010.0010.002
(0.015)(0.003)(0.001)(0.002)(0.002)
Household head Sex (1 = male)−0.2770.0500.018−0.023−0.044
(0.522)(0.088)(0.037)(0.036)(0.090)
Household head education level (year)−0.646 ***0.124 ***0.037 ***−0.064 ***−0.096 ***
(0.140)(0.028)(0.013)(0.020)(0.022)
Farming experience (year)−0.0180.0030.001−0.002−0.003
(0.013)(0.003)(0.001)(0.001)(0.002)
Marital status (1 = married)0.473−0.099−0.0190.0560.062
(398)(0.089)(0.012)(0.053)(0.046)
Household size0.046−0.009−0.0030.0050.007
(0.047)(0.009)(0.003)(0.005)(0.007)
Dependency ratio0.123 *−0.024 *−0.007 *0.012 *0.018 *
(0.072)(0.014)(0.004)(0.008)(0.011)
Farm income (Afghani)−0.008 ***0.002 ***0.000 ***−0.001 ***−0.001 ***
(0.003)(0.001)(0.000)(0.000)(0.000)
Non-farm income (1 = yes)−0.606 **0.115 **0.034 **−0.057 **−0.092 **
(0.281)(0.052)(0.018)(0.028)(0.044)
Land size (hectare)0.006−0.001−0.0000.0010.001
(0.048)(0.009)(0.003)(0.005)(0.007)
Livestock−0.035 ***0.007 ***0.002 ***−0.003 ***−0.005 ***
(0.011)(0.002)(0.001)(0.001)(0.002)
Membership in social group
(1 = yeas)
−0.573 **0.111 **0.031 **−0.057 **−0.085 **
(0.271)(0.053)(0.016)(0.029)(0.040)
Access of extension (1 = yeas)−0.0910.0180.005−0.009−0.014
(0.282)(0.054)(0.016)(0.028)(0.042)
Informal credit (1 = yeas)0.674 **−0.134 **−0.033 **0.072 **0.095 **
(0.298)(0.062)(0.015)(0.036)(0.040)
Farm disease (1 = yeas)0.769 **−0.154 **−0.035 **0.083 **0.107 **
(0.306)(0.065)(0.015)(0.038)(0.040)
Flood (1 = yeas)0.766 **−0.157 **−0.032 **0.086 **0.103 **
(0.324)(0.070)(0.014)(0.042)(0.040)
War (1 = yeas)0.659 **−0.131 **−0.032 **0.069 **0.093 **
(0.316)(0.065)(0.016)(0.036)(0.093)
cut1−0.981
(1.029)
cut2−0.098
(1.02)
cut31.574
(1.028)
Log-likelihood−257.51
Wald chi 2 (17) = 176.243
Prob > chi 2   = 0.000
Pseudo R 2   = 0.255
Number of obs = 262
*** at 1% statistically significant, ** at 5% level of significance, and * at 10% level of significance. Source: own survey.
Publisher’s Note: MDPI stays neutral with regard to jurisdictional claims in published maps and institutional affiliations.

