Article

The Environmental-Economic Performance of a Poblano Family Milpa System: An Emergy Evaluation

by
Miguel Angel Avalos-Rangel
1,
Daniel E. Campbell
2,
Delfino Reyes-López
3,
Rolando Rueda-Luna
4,
Ricardo Munguía-Pérez
1 and
Manuel Huerta-Lara
1,*
1
Posgrado en Ciencias Ambientales, Benemérita Universidad Autónoma de Puebla, Puebla 72570, Mexico
2
Department of Mechanical, Industrial, and Systems Engineering, University of Rhode Island, Kingston, RI 02881, USA
3
Facultad de Ciencias Agrícolas y Pecuarias, Benemérita Universidad Autónoma de Puebla, Teziutlan 73965, Mexico
4
Departamento de Investigación en Ciencias Agrícolas, Benemérita Universidad Autónoma de Puebla, Puebla 72570, Mexico
*
Author to whom correspondence should be addressed.
Sustainability 2021, 13(16), 9425; https://doi.org/10.3390/su13169425
Submission received: 15 July 2021 / Revised: 19 August 2021 / Accepted: 19 August 2021 / Published: 22 August 2021

Abstract

:
The family milpa system (FMS) is of great importance to food security and the livelihoods of rural families in Mexico. However, the performance of the system can be compromised due to inappropriate agricultural practices. Therefore, a suitable evaluation strategy is required to identify the best management of resources. Nonetheless, at present, there is no holistic understanding around the nature–society interface that allows us to predict the global behavior of the FMS. Thus, this study assesses the global performance of a Poblano FMS through emergy-based indices. The emergy evaluation was carried out by accounting for the available energy of different qualities used in the system, which were subsequently converted to one kind of energy (solar emjoules). The percentage of renewable emergy (%Ren) used in the system was 72.16%. The emergy self-support ratio (ESR) showed that 74% of the emergy used came from free local resources. The emergy investment ratio (EIR) of 0.36 indicated that the emergy use was efficient. The emergy yield ratio (EYR) was 3.78, which in terms of net emergy (NE), was equivalent to a gain of 1.35 × 10¹⁶ sej ha−1 y−1. The environmental loading ratio (ELR) was 0.39, which indicated a low potential environmental impact. The emergy sustainability index (ESI) was high (9.80) compared to other agricultural systems. The performance of the FMS is superior compared to other agricultural systems, including ecologic and recycling systems. However, the use of resources is not optimum and needs to be improved to reach maximum empower.

1. Introduction

The eradication of poverty and hunger are some of the sustainable development goals of the 2030 United Nations agenda [1]. However, poverty mainly affects rural areas, since approximately 80% of the world’s poverty is concentrated in these places [2]. The productivity, profitability, and sustainability of small-scale (family) agricultural systems are key to the eradication of rural poverty [3,4,5]; but also, for the enhancement of food security, because family farming plays a relevant role in rural food security [6].
The milpa is a crop production system [7,8], mainly consisting of an association of maize (Zea mays L.), squash (Cucurbita spp.), and bean (Phaseolus spp.); however, different annual and perennial plants can also be included [8]. This system varies according to the agricultural environment and local culture [9], and it plays an important role in preserving biodiversity [10]. The family milpa system (FMS) in Mexico guarantees family sustenance, but sometimes also provides some financial support, since a surplus in agricultural production generates some economic income [11]. Because the FMS is essential for rural families, proper management of the system’s resources should be ensured. For this, an appropriate evaluation strategy is required, which allows guaranteeing the permanent availability of food and family income.
Every environmental system includes an interface between ecological systems and society [12]. The FMS is a socioeconomic system that exists at the environmental–economic interface. Therefore, the understanding of this interface is key to understanding the FMS; however, understanding of the nature–society interface of the FMS is scarce. Nonetheless, some studies have addressed it, such as Diemont et al. [13], who reported a study that used emergy evaluation to assess the milpa system in Chiapas, Mexico, but it was carried out on agroforestry systems, and the parallel production of multiple products was not considered in the evaluation. Nevertheless, several studies have reported emergy evaluations of agricultural systems, including grain crops [14], maize forage [15], legume species [16], and regional and national agricultural systems [17,18].
Everything is connected in the universe within an energy hierarchy [12,19,20]. Thus, for a long time, energy has been used as a common metric to evaluate economic–environmental systems; however, it was not considered that the different kinds of available energy are not equivalent in their ability to do work [12]. Therefore, the evaluation of energy-based systems requires a procedure that allows such equivalence to be established. The emergy evaluation method allows expressing the different kinds of available energy in equivalents of one single kind of energy [12,21,22,23]. Emergy is the available energy of one kind (usually solar energy) used to make a good or service [12,23,24]. Emergy-based indices are used to assess the global performance of the system, which allows us to propose resource management strategies that maximize emergy flow or maximize empower (sej/unit time) through the system [12,20,25].
The FMS provides food and sometimes income for the rural families of San Bernardino Tepenene, but rural poverty and food insecurity have not been eradicated. However, there is no holistic understanding around the nature–society interface of the FMS, gained through an equivalent accounting of resources that allows knowing diverse aspects about the global behavior of the system. Therefore, research should be carried out to understand the global performance of the FMS in San Bernardino Tepenene, since this lack of knowledge prevents the identification of suitable strategies for the use of resources to maximize its environmental-economic performance.
This study aims to assess the environmental-economic performance of the FMS in San Bernardino Tepenene through the application of emergy-based indices (percent of renewable emergy, Emergy Self-support Ratio, Emergy Yield Ratio, Environmental Loading Ratio, Net Emergy, Emergy Investment Ratio, and Emergy Sustainability Index) and the comparison of such indices with those of other similar or related crops. The combination of the information from these indices will help us better understand the global behavior of milpa systems. Nevertheless, the knowledge provided in this study is important for decision-making and policies involved in the management of the environmental-economic performance of the FMS in the San Bernardino Tepenene community and elsewhere. The purpose of better management is that rural food security improves, and rural poverty decreases, through the development of sustainable food production and increased sustenance and financial support gained from the FMS. Therefore, this research has an important application in the eradication of poverty and hunger, as well as in the sustainable rural development of highly marginalized communities.

2. Materials and Methods

2.1. Study Area

This mixed methods research (qualitative-quantitative research approaches) reports a case study that was carried out in the agricultural year 2018 in the San Bernardino Tepenene community, which belongs to the municipality of Tzicatlacoyan Puebla, Mexico, within the Mixteca poblana. This community is located at a latitude/longitude of 18°52’46.87”/−98°5’48.97”, with an approximate extension of 769,500 m2 and an altitude of 2100–2200 m above sea level (masl). The climate is temperate sub-humid with most rainfall in the summer [26]. The average annual temperature range and rainfall in 2007–2018 were 8–23.5 °C and 900 mm, respectively. The predominant vegetation is oak trees (Quercus spp.), maguey plants (Agave spp.), subabul trees (Leucaena leucocephala), and palm plants (Brahea dulcis) [26]. The agricultural practice in the community is small-scale family farming, which is carried out in an average production area of less than 20,000 m2. The products produced are mainly destined for self-consumption. Therefore, the energy required for the human family’s metabolism is mainly provided by the products of the FMS. A small percentage of community inhabitants (7.7%) lack access to food [27] and the population lives in a highly marginalized state [28] due to the lack of opportunities for development [29].

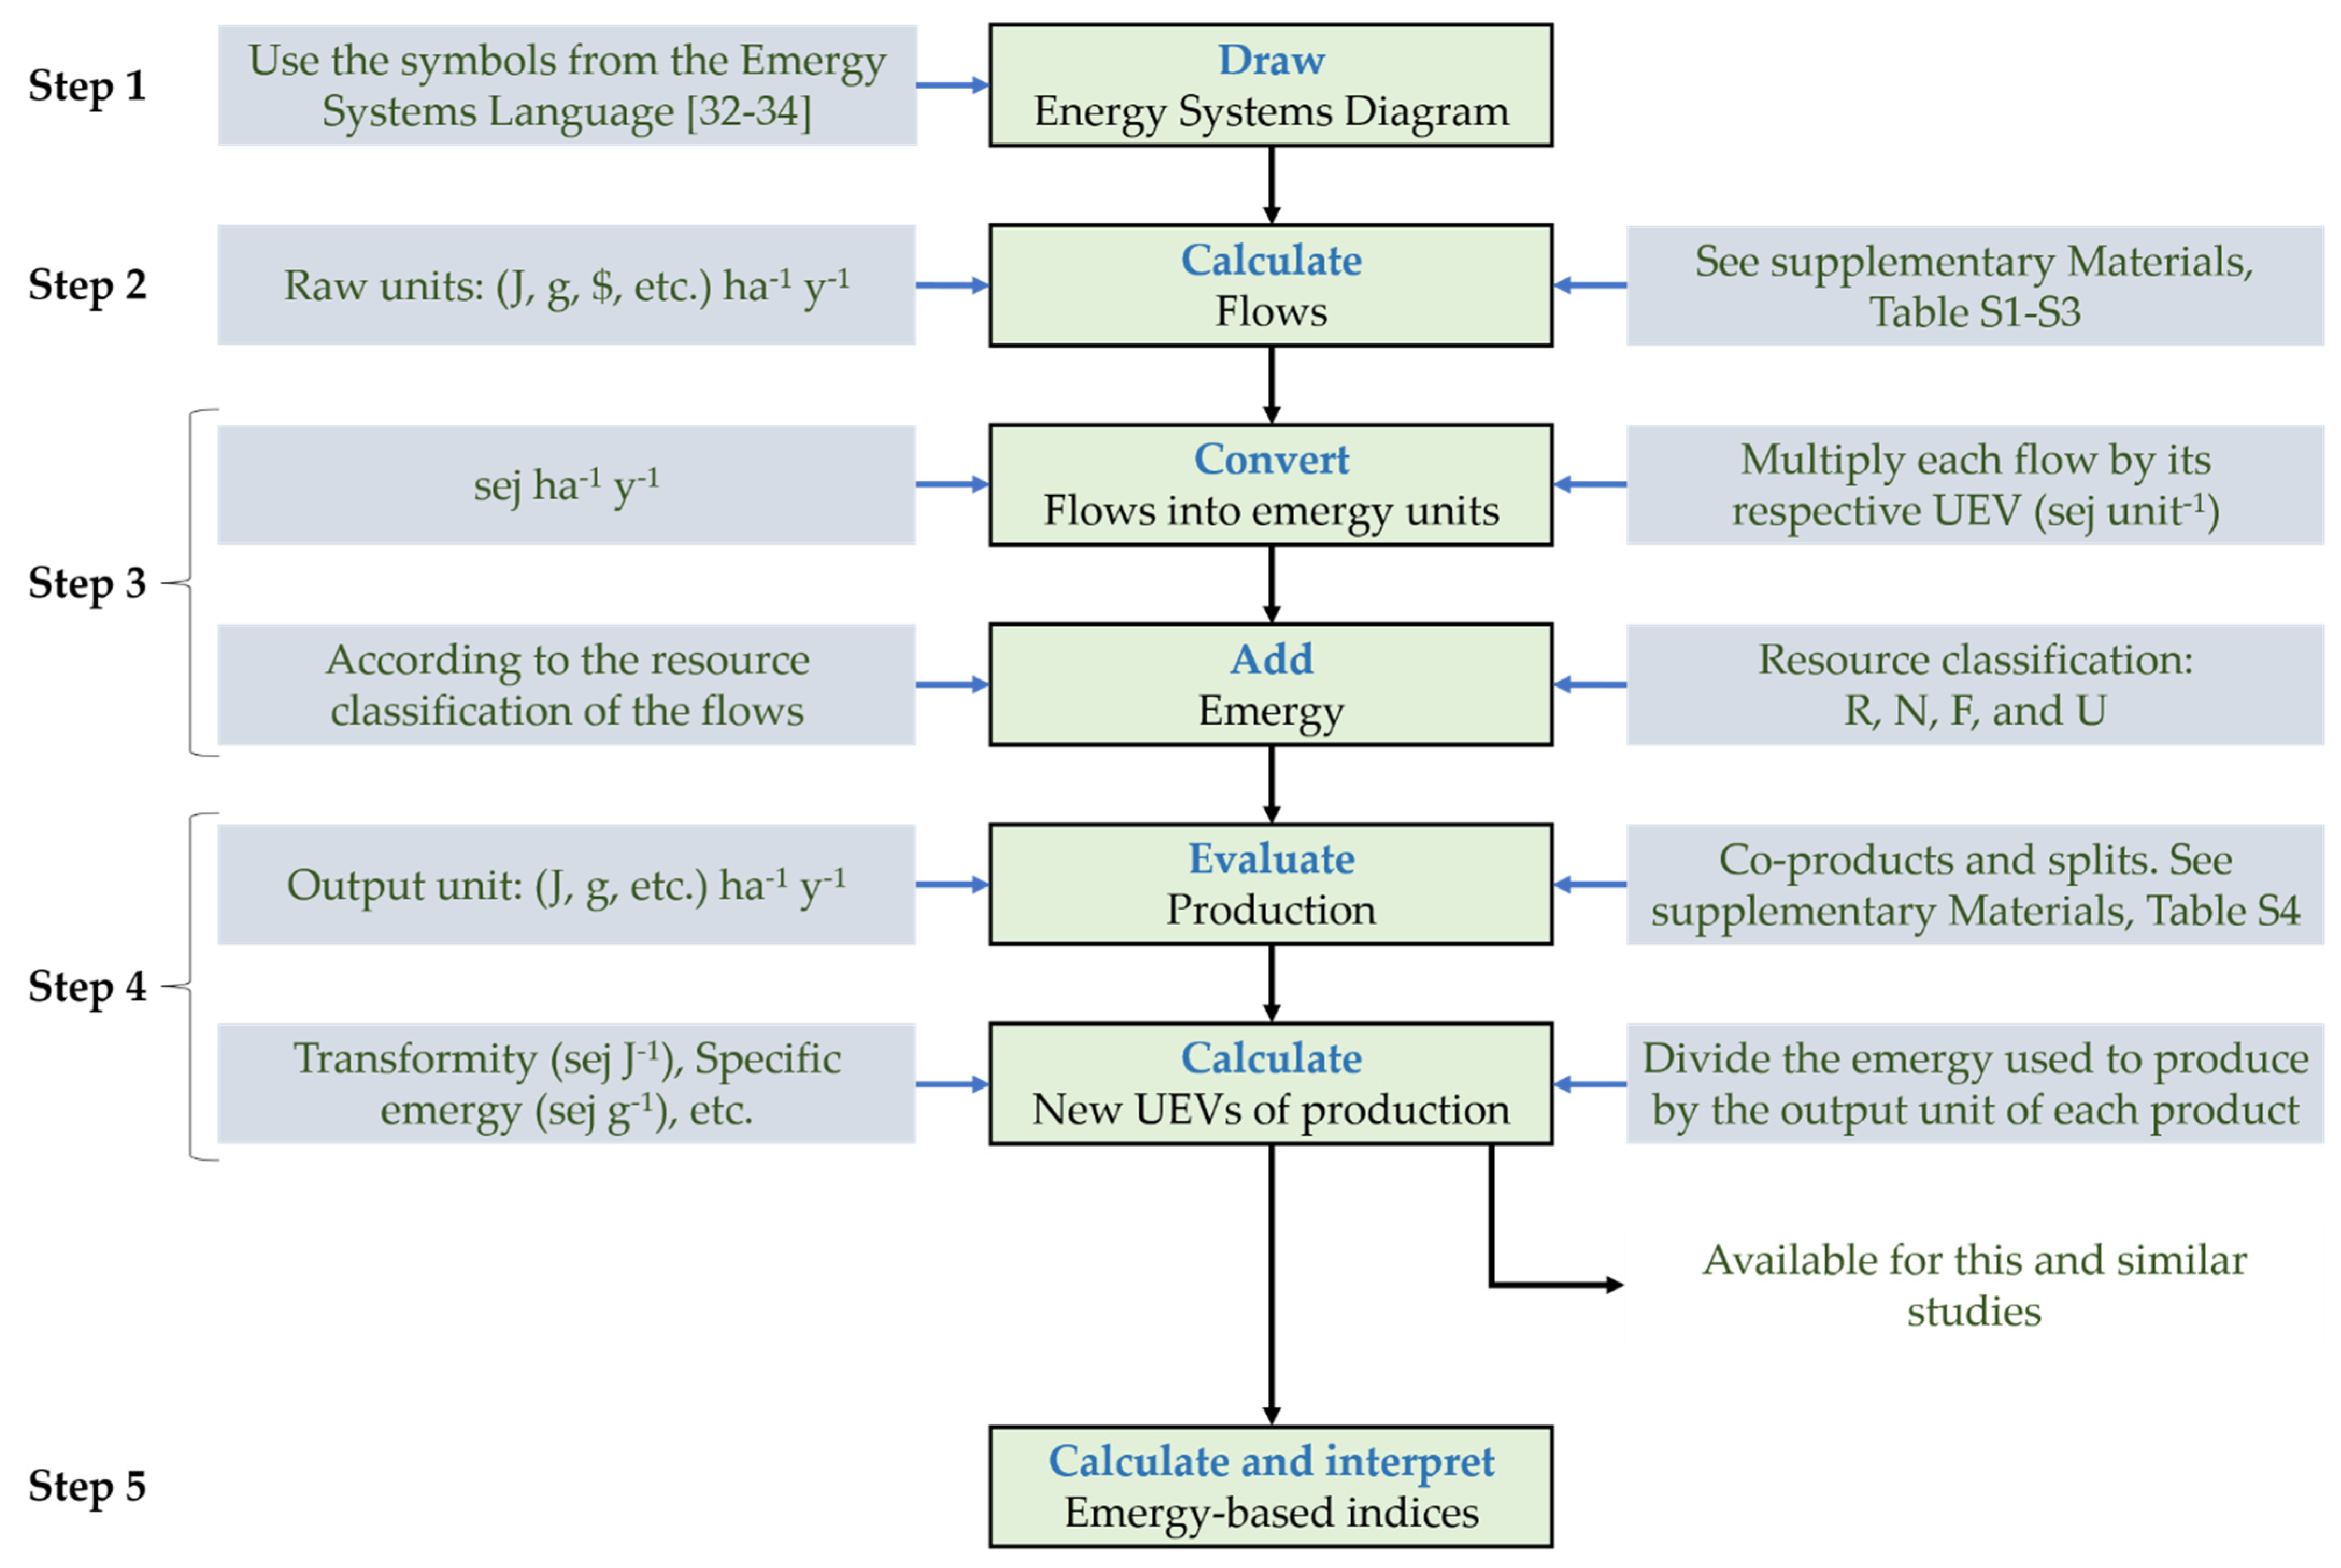
2.2. Emergy Evaluation

Emergy evaluation was performed according to the procedures reported by Odum [12], Brown and Ulgiati [20], Campbell [30], and Buonocore et al. [31]. A summary of the steps in this procedure is shown below (see Figure 1):
  • Make an energy systems diagram using the symbols from the Energy Systems Language [32,33,34].
  • Calculate the flows used per hectare per year in raw units (J, g, or US$) (see Supplementary Materials, Tables S1–S3).
  • Convert the flows into equivalents of one kind of energy (solar equivalent exergy (J)) by multiplying each exergy flow by its respective UEV (Unit Emergy Value in solar emjoules per Joule, sej J−1) to obtain the solar emergy of the exergy flow. Add the emergy inputs according to the resource classification of the flows (local renewable resources “R”, local non-renewable resources “N”, and purchased resources “F”, which are fed back from the larger economy), as well as the total emergy used “U” (U = R + N + F). A standard table was used to display the emergy calculations.
  • Evaluate the production in your system and calculate the UEV (emergy required per unit of output) of the co-products and splits. The grain yield was calculated considering five subplots of 24 m2. The UEV of the co-products and splits of the FMS, in this case their transformity, was calculated by dividing the emergy used for production by the exergy of each product (see Supplementary Materials, Table S4).
Some algebraic rules are required to accurately assign emergy to flows: (1) All source emergy is assigned to the process output; (2) The emergy of each co-product corresponds to the total emergy used; (3) When the output product is divided, the emergy is assigned to each branch of the split based on the percentage of the total outflow on the pathway; (4) The emergy in feedbacks cannot be counted twice, and when the co-products are reunited, they cannot be added to equal a sum greater than the source emergy from which they were derived [12,35]. However, in farming, some inputs produced in the prior year should be counted in the emergy required for crops in the present year, since the rule of separation in time takes precedence [36]. Thus, the reinforcing feedbacks from the agricultural year 2017 (seed, forage, organic matter of plant residues, and family labor) were counted, when appropriate, as part of the emergy base for activities of the agricultural year 2018, and they were considered as local renewable resources (R). Since the amount of squash and bean plant residues and forage produced during the previous year is unknown, we used the current production data to estimate the emergy of squash and bean plant residues and forage used in the current year. Some studies report accounting for reinforcing feedbacks from past years: Diemont et al. [13] included the seeds produced from the harvests of previous years as a renewable input; Alfaro-Arguello et al. [37] counted renewable family labor as part of the emergy base; and Wang et al. [38] reported that the contribution of recycled biomass cannot be comprehensively and reasonably represented, to some extent, by the fourth algebraic rule to assign emergy to flows.
5.
Calculate and interpret emergy-based performance indices.
Figure 1. Scheme of the emergy evaluation procedure.
Sustainability 13 09425 g001

2.3. Emergy-Based Indices

  • The percent of renewable emergy (%Ren) is the portion of the total emergy used that is from renewable sources [20,39,40]. A high %Ren is required to achieve high sustainability of a system in the long term [20,40,41].
    % R e n = ( R / U )   ( 100 )
  • Emergy Self-support Ratio (ESR). The index indicates the proportion of emergy from local sources [42,43].
    E S R = ( R + N ) / U
  • Emergy Yield Ratio (EYR) is a measure of the ability of the larger system to exploit local resources by investing purchased resources; when EYR = 1, the local resources are not being exploited effectively, and the system provides the same amount of emergy that was invested from the purchased resources [20,39].
    E Y R = Y / F
  • Environmental Loading Ratio (ELR) is an indicator of the environmental pressure caused by the production process [20,39]. The lower the ELR, the lower the environmental pressure. If some case studies are considered, an ELR value lower than two, between two and ten, or higher than ten indicates a low, moderate, or high environmental impact, respectively [20].
    E L R = ( N + F ) / R
  • Net Emergy (NE) is the potential contribution of a system or process to the next larger system. A system should provide an amount of emergy at least equal to the cost of the emergy required to obtain such contribution; a system has positive net emergy when it has an emergy cost less than its contribution to production [21].
    N E = Y F
  • Emergy Investment Ratio (EIR). This ratio determines if an investment in the system is economical based on the matching of purchased resources with free local resources; a system is economical if its EIR is less than or equal to the EIR prevailing in the region [12]. EIR is higher as more purchased emergy is used and lower as more local emergy is used. When the EIR value is higher, production increases, but emergy is used less efficiently [12].
    E I R = F / ( R + N )
    where R is local renewable resources. N is local non-renewable resources. F is purchased resources. U is total emergy used (R + N + F) and Y is emergy yield.
  • Emergy Sustainability Index (ESI). Sustainability is a function of yield, renewability, and load on the environment; therefore, it is suggested that the ratio between the yield of processes and the load it generates on the environment can be used as an index of sustainability [41]. The higher the ESI, the greater the sustainability of the system.
    E S I = E Y R / E L R

2.4. Data Gathering and Sample Size

The data used to calculate the renewable resource input to the system were viewed in and extracted from the NASA Prediction of Worldwide Energy Resources (NASA POWER) data access viewer [44]. Sunlight, wind, rain, and evapotranspiration are the local renewable resources considered in the analysis of the FMS (but, in this study, the reinforcing feedbacks were also considered as local renewable resources). The sunlight PAR (Photosynthetically Active Radiation) was added without a risk of double counting, because it is from a different exergy source than the heating effect of the sun used to generate wind and rain [36]; however, wind and rain are planetary co-products and, therefore, if both resources are added, there will be double counting [36]. Then, the total emergy of local renewable resources was calculated by adding the local sunlight emergy to the largest of the rain and wind (plus the reinforcing feedback emergy). The evapotranspiration was estimated from meteorological data and crop coefficients using the FAO Penman-Monteith method [45].
The soil was considered as a non-renewable resource because there is a net loss due to erosion, and its recovery can take several years. The estimation of net topsoil loss in the productive area was determined by identifying the degree of erosion through the geographic digital space of the SEMARNAT [46], which was used, successively, to reveal the range of topsoil loss according to the soil erosion classification by the FAO [47]. The FMS in the San Bernardino Tepenene community is located in an area where water erosion predominates. The degree of erosion is classified as “light” and it has a range of topsoil loss of less than 10,000 kg ha−1 y−1 [47]; we used the intermediate value of this range to estimate the net topsoil loss. Groundwater is considered an indispensable, non-renewable resource for crops. However, this resource was not considered in the FMS, since it is a seasonal cropping system that depends 100% on rainwater, because groundwater is inaccessible due to the highly marginalized state of the community. Crops are lost in some agricultural years due to lack of water.
The data quantifying the purchased resources in the FMS were obtained through participant observations and a survey, in which a verbal questionnaire was used as a measurement instrument. The yearly average currency exchange rate for 2018 was calculated according to data from Banco de México [48]. Fuel consumption was determined using data obtained from the Portal of Energy Efficiency Indicators and Vehicle Emissions of the Instituto Nacional de Ecología y Cambio Climático [49].
We used the new reference GEB (Geobiosphere Emergy Baseline) of 12.00 × 1024 seJ y−1, which is a synthesis that resulted from three calculation procedures [50]. Therefore, the UEVs with a different reference GEB were adjusted using the appropriate equivalency factors (See Supplementary Materials, Table S5). The equivalency factors were obtained from the ratio of the new baseline to the previous ones [51,52]. The UEV of squash plant residues was assumed to be similar to the UEV for bean plant residues, since we did not find works that reported the UEV for squash plant residues; however, this study allowed obtaining the UEV of these residues and all the co-products of the FMS. The UEV of labor was calculated through the emergy required to support it [53], in this case, the emergy of the food produced that the family consumes and the input emergy of the money destined for family consumption, whose value was divided by the total energy required to carry out the labor in the FMS. However, we assumed that the available energy expended in metabolic work delivers the emergy of the farmer’s knowledge and experience [54].
The sample size was calculated by Equations (8) and (9) [55]. The family was considered as the unit of analysis.
n = p ( 1 p ) / s e 2  
where n’ = unadjusted sample number; p = probability; se = standard error.
n = n / [ 1 + ( n   / N ) ]
where n = sample size; N = population size.
The sample size was calculated with an error of 0.05 and a probability of 0.80. The size of the population was determined according to the number of inhabited individual living places in the community of San Bernardino Tepenene in 2010, which was 209 [56]. According to Equations (8) and (9), the number of sample units was:
n = 0.8 ( 1 0.8 ) 0.05 2 = 0.16 0.0025 = 64 n = 64 [ 1 + ( 64 209 ) ] = 64 1.31 = 49

3. Results

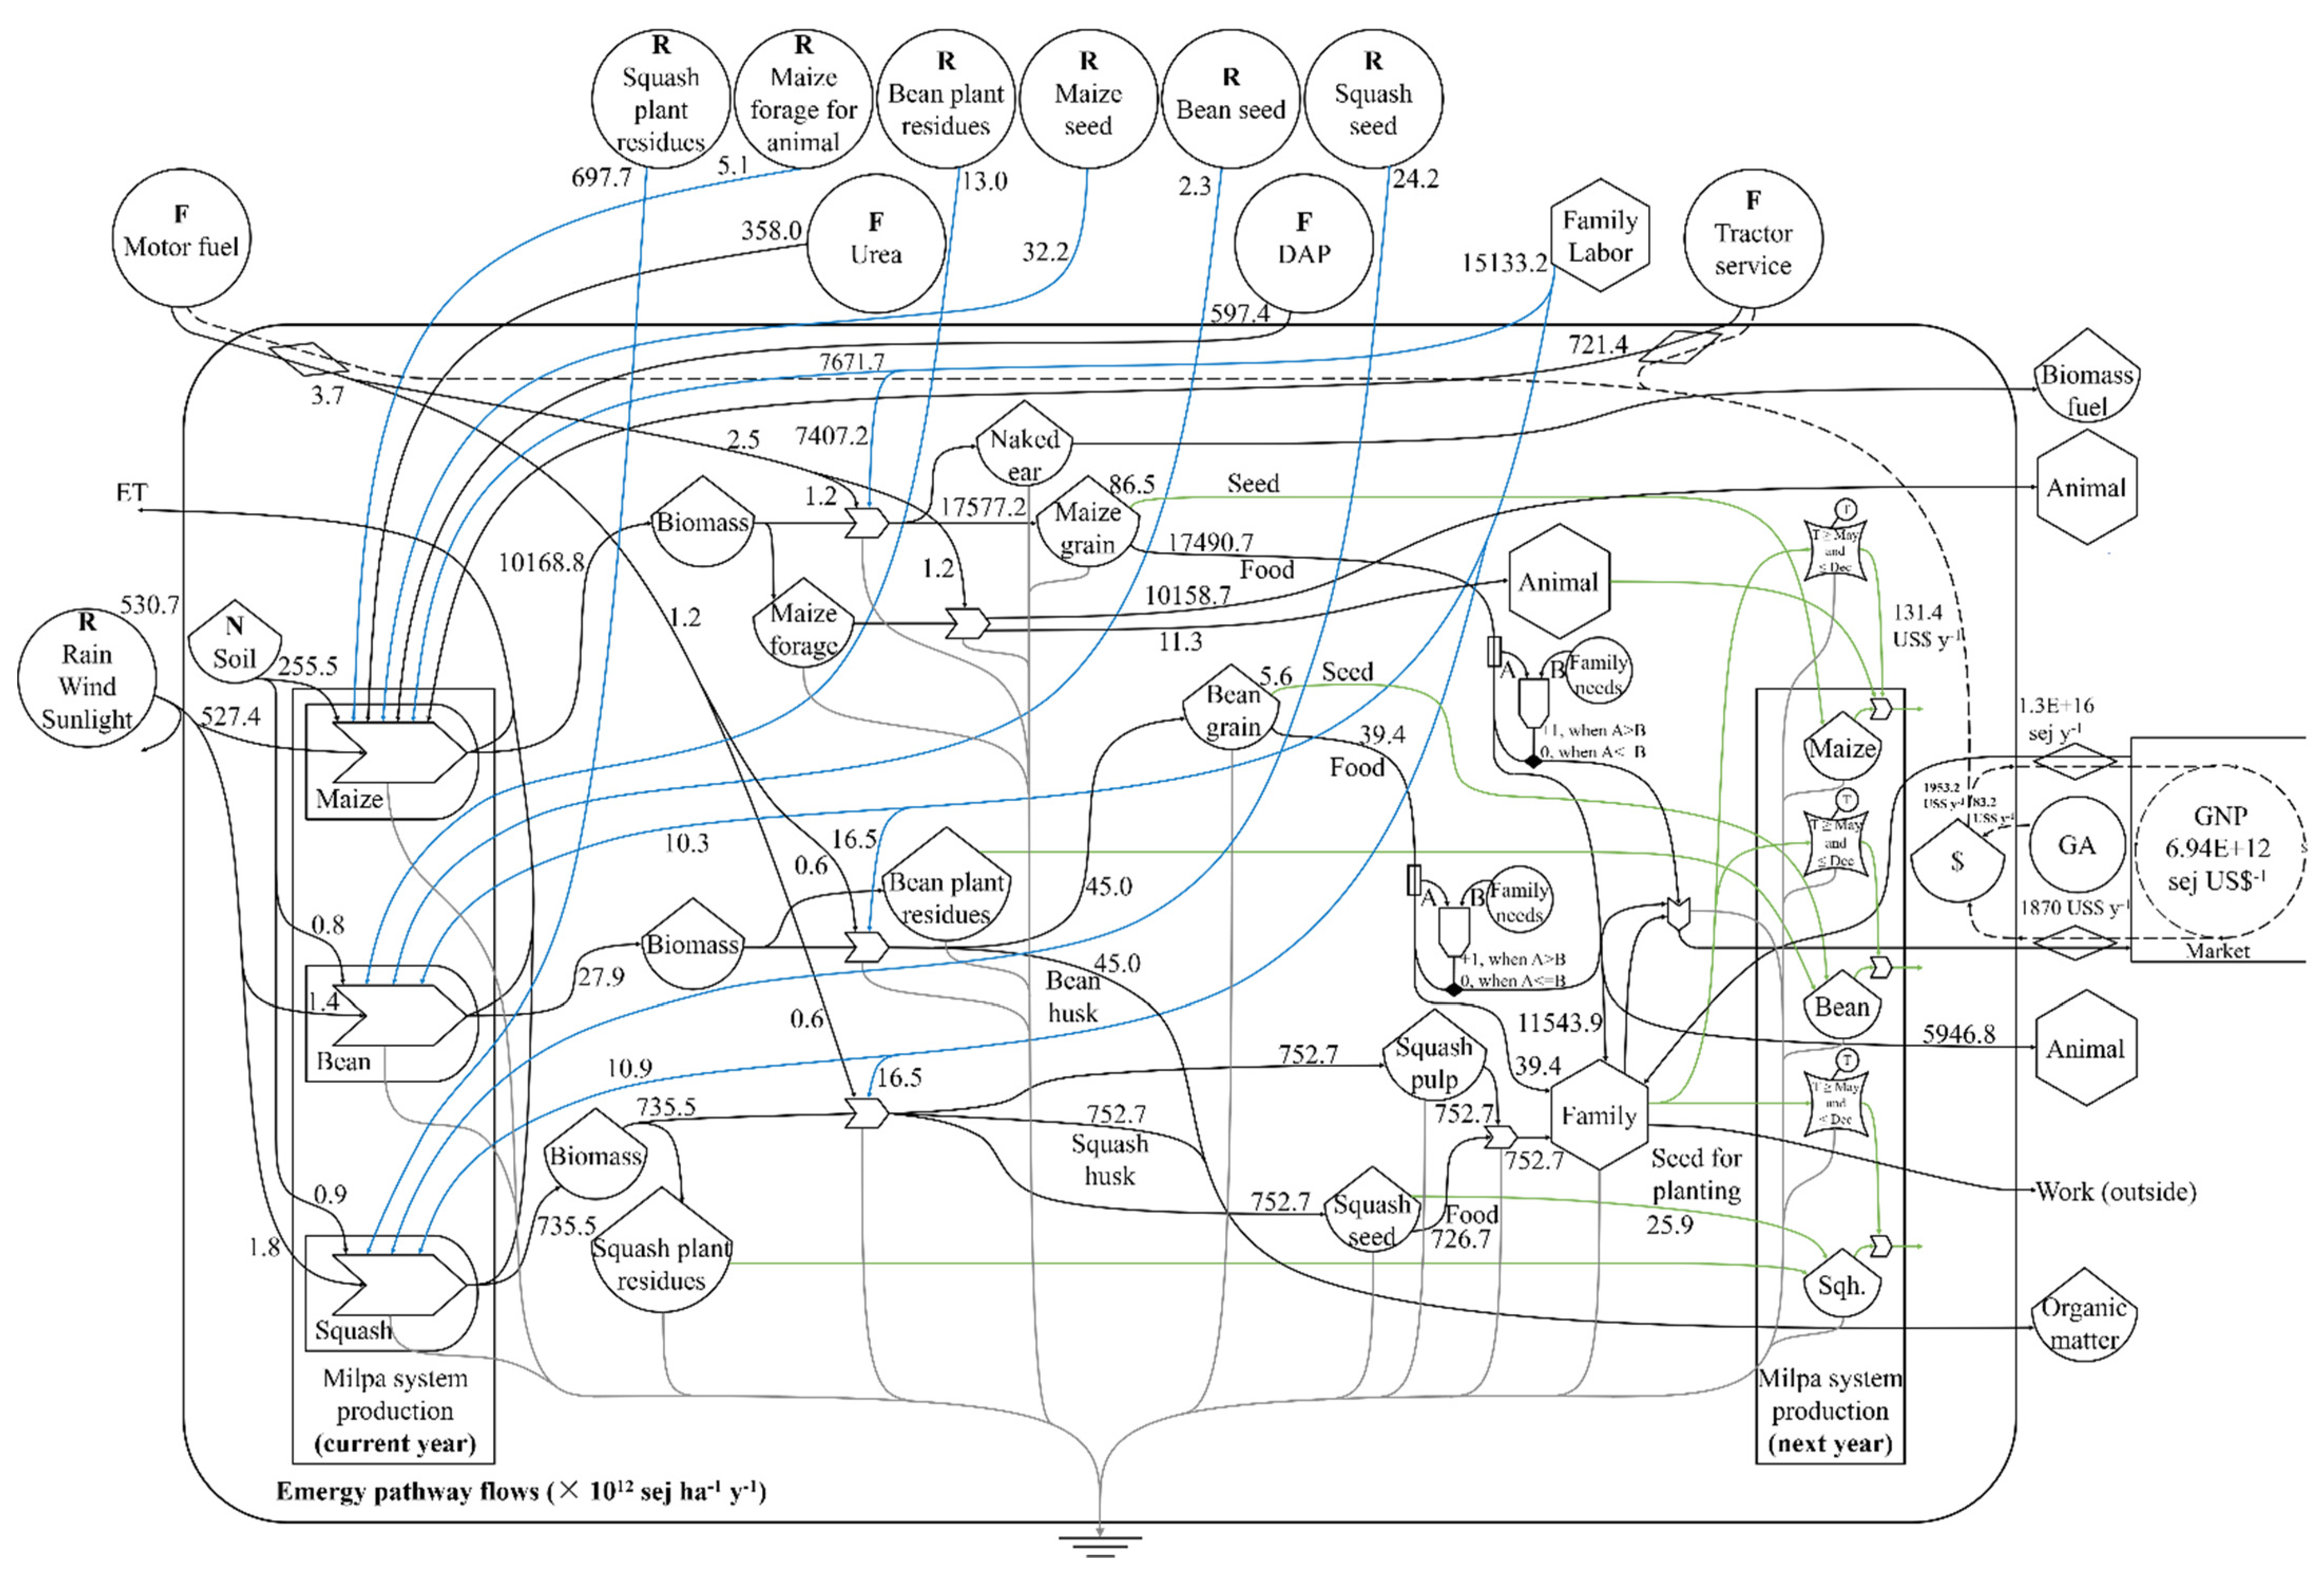
3.1. Emergy Diagram Description of the FMS

Figure 2 shows the resources used in the production of crops from the FMS, as well as the emergy flow supporting the production of several co-products and splits. The grains or seeds (maize grain, bean grain, and squash seed) were divided (split) into biomass consumed as food, and the biomass used as seed for next year’s crop. In the community, the purchased resources (F) used for the production of crops from the FMS are regularly obtained with the income received from temporary jobs, government assistance, and/or the income from the sale of agricultural products. The fertilizers were provided in-kind by the government. In this study, the money provided by the government was used to pay for a fraction of the tractor service (64.03%). Therefore, we only considered the tractor service in the emergy evaluation and not the government assistance to avoid double counting. The food produced in the FMS (maize grain, bean grain, squash seed, and squash pulp) is largely consumed by the family, but if there is a surplus, it is marketed; however, no surplus was recorded in this study. The same process is carried out in the FMS every agricultural year. The seeds for planting, maize forage, and the organic matter of plant residues are the products of farm production in past years that are used to support production in the current year. These lagged inputs were used as input from the past year considered as feedback to the current production of the FMS. These reinforcing pathways maximize the performance and sustainability of the system [12].

3.2. Local Renewable Resources

Table 1 shows the emergy used in the FMS during the agricultural year evaluated in the San Bernardino Tepenene community. Local renewable resources constituted the largest emergy input to the FMS. The total emergy used in the system (U) was 1.84 × 10¹⁶ sej ha−1 y−1, of which 1.33 × 10¹⁶ sej ha−1 y−1 was renewable, which corresponds to 72.16% (0.18% from the sunlight, 2.70% from the rain, and the remaining 69.28% of the total emergy used from the reinforcing feedbacks). Among the reinforcing feedbacks, the renewable field labor and post-harvest labor accounted for the highest proportions of the emergy used in the FMS; the proportion of total emergy use attributable to these resources was 33.07% and 31.98%, respectively. The high amount of local renewable resources has a positive impact on the performance and sustainability of the FMS.

3.3. Local Non-Renewable Resources

The amount of local non-renewable resources used in the FMS was low. The amount of emergy used attributable to the soil resource was 2.57 × 10¹⁴ sej ha−1 y−1, which corresponds to a portion of the total emergy used of 1.40% (Table 1). This result has a favorable effect on the environmental pressure caused by the production process on the system, which is linked to higher sustainability.

3.4. Purchased Resources

The amount of non-free purchased resources used in the FMS was low. The proportion of the total emergy used attributable to the purchased resources was 26.44% (Table 1). Among these resources, the non-renewable field labor accounted for the largest fraction of the emergy of purchased resources used, followed by the non-renewable post-harvest labor, the total amount of fertilizer, tractor service, and fuel. The proportion of total emergy used attributable to these resources was, respectively, 8.79%, 8.50%, 5.20% (1.95% from the urea, 1.82% from the nitrogen-DAP, and 1.43% from the phosphorus-DAP), 3.93%, and 0.02% (Table 1). The low amount of non-free purchased resources allows the FMS to be economical.

3.5. Production Efficiency

Table 2 shows the value of agricultural production in units of energy (J), and the transformity calculated for seven co-products produced in the FMS (a–g), of which four were divided (split) into two branches (b1, b2; d1, d2; e1, e2; f1, f2). The squash plant residue was the co-product of crop production that had the highest efficiency, since it had the lowest transformity, followed by maize forage, then bean plant residue. These residues that are co-products of squash, maize, and bean production had transformities of 2.15 × 10⁵, 2.21 × 10⁵, 3.49 × 10⁵ sej J−1, respectively. Maize grain, bean grain, and squash seed are the edible crops produced in order of their production efficiencies, which are 3.56 × 10⁵, 8.12 × 10⁵, and 6.69 × 10⁶ sej J−1, respectively. These seed crops are followed by squash pulp, which is an edible product, but with a lower energy density and a higher transformity, 1.76 × 10⁷ sej J−1, and thus it is not a strictly equivalent product to the higher energy density grains. These results indicate that for equivalent products, the higher the transformity, the higher the emergy used to produce the same amount of product (i.e., the efficiency is lower).

3.6. Emergy-Based Indices

% R e n = ( 1.33 × 10 16 1.84 × 10 16 ) ( 100 ) = 72.16
The value of Index 1, %Ren, indicates that 72.16% of the total emergy used was renewable. This result indicates the high number of renewable resources used within the FMS. With this, the system can achieve better performance and sustainability.
E S R = 1.33 × 10 16 + 2.57 × 10 14 1.84 × 10 16 = 0.74
The ESR value indicates that 74% of the total emergy used in the FMS was local; therefore, the remaining 26% was purchased from outside the system in the form of goods and services. The data show the high self-sufficiency of the system, achieved mainly by our assumptions with regard to reinforcing feedbacks.
E Y R   = 1.84 × 10 16 4.86 × 10 15 = 3.78
The EYR value greater than one (3.78) indicates that the FMS provided more emergy than that required from the purchased resources. This result indicates the high ability of the system to exploit local resources by investing purchased resources.
E L R = 2.57 × 10 14 + 4.86 × 10 15 1.33 × 10 16 = 0.39
The ELR value of 0.39 indicates low loading on the environment by the productive process of the FMS. The result favors the sustainability of the system.
N E = 1.84 × 10 16 4.86 × 10 15 = 1.35 × 10 16   s e j   h a 1   y 1
The potential contribution of emergy provided by the FMS is indicated by index 5, NE, with a value of 1.35 × 10¹⁶ sej ha−1 y−1, which shows the ability of the system to provide an amount of emergy greater than the cost of the emergy required to obtain it.
E I R = 4.86 × 10 15 1.33 × 10 16 + 2.57 × 10 14 = 0.36
The EIR value of 0.36 indicates that the FMS had greater use of the free emergy (local) in relation to the emergy that has an economic cost (purchased resources), and this result implies that the emergy use was efficient, and the FMS was economical compared to other systems of the region.
E S I = 3.78 0.39 = 9.80
The ESI value of 9.80 indicates relatively high sustainability for the production process of the FMS, and the higher this value, the greater the sustainability of the system.

4. Discussion

This study provides knowledge that allowed us to better understand the global performance of the FMS in the San Bernardino Tepenene community. This knowledge, which was based on comparison of the FMS indices with other grain, legume, and cucurbit production systems, including ecologic, recycling, and optimized agricultural systems (see Table 3), is as follows: (1) The renewability of the FMS is high, (2) the self-sufficiency of the FMS is high, (3) the FMS provides a higher emergy contribution than was invested from purchased resources, (4) the FMS provides a positive net emergy to the region, (5) the environmental impact caused by the FMS production process is low, (6) the emergy use is efficient, (7) the FMS is economical, and (8) the sustainability of the FMS is high.
A system maximizes its performance and is sustainable (i.e., it prevails in competition) when feedback reinforces it [12] (pp. 279–280). The high reinforcing feedback of the FMS allows more useful energy to be processed and for the system to move toward maximizing empower. Nevertheless, the FMS should continue optimizing the use of resources through reinforcing feedbacks to maximize the emergy flow and attain greater sustainability. However, it is clear that greater empower through the system does not necessarily ensure greater sustainability (see Table 3), since a sustainable system is characterized by maximizing empower, but through the reinforcing pathways [12].
The production of conventional agricultural systems in Mexico has been enhanced by mechanization, the improvement of varieties, and the use of agrochemicals [8,11], which causes greater dependence on purchased resources and lower use of local natural resources. From this trend, we infer that the FMS might have poor performance indicators. Therefore, we expected that the FMS would use a low fraction of renewable emergy, the self-sufficiency of the system would be low, the production process would cause a moderate or high environmental impact, the emergy use would not be efficient, the system would not be economical, and the sustainability of the system would be low. However, these assumptions did not match our findings.
The inhabitants of the San Bernardino Tepenene community do not have the resources to use irrigation technology; therefore, the availability of water for their crops is reduced. Rainwater comprises a high proportion of the total use of local renewable resources, but family labor is the primary local renewable resource used in the system. The fraction of renewable emergy used in the FMS is not low since family labor provides a significant renewable emergy input, and it even comprises more than half of the emergy used in the system. The results indicate that of the total emergy used in the system, 72.16% is derived from local renewable resources, and the remaining percentage (27.84%) was due to the sum of local non-renewable resources and purchased resources. A high %Ren is required to achieve sustainability of a system in the long term [20,40,41]. Therefore, sustainable production of the FMS in San Bernardino Tepenene depends on the quantity of renewable resources used. The FMS used fewer renewable resources compared to some production systems highly dependent on local natural resources. For example, agroforestry systems in Chiapas, Mexico had a %Ren emergy of 72–97%. The agroforestry systems of Chiapas that had the majority of the land dedicated to milpa agriculture had the lowest %Ren, 72% and 74% [13]. These values were similar to that in the FMS. However, the FMS used a quantity of renewable resources higher than that of the ecological bean production system in Markazi, Iran (53.69%) [16] and the field cucumber (Cucumis sativus) production system of 26 Chinese provinces (30%) [64]. Intensive production systems, which rely on machinery and high amounts of purchased inputs, use a much lower amount of renewable resources compared to the FMS in San Bernardino Tepenene. For example, Houshyar et al. [14] reported a %Ren of 0.17% and 0.87% for maize and wheat (Triticum aestivum) production systems in southwestern Iran, respectively; however, the calculation of these values only considered sunlight and thus they are not directly comparable to our values. Furthermore, the medium-input and high-input bean production systems had a low %Ren of 4.76% and 3.35% [16].
Since there is no information about the renewable fraction for the region from which the families in San Bernardino Tepenene receive wages, we used the renewable fraction for Mexico from the most recent year published in NEAD (www.emergy-nead.com/country/data (accessed on 15 March 2021) to calculate the labor renewability. Therefore, we need studies to determine the renewable fraction for the region from which the families of the rural community receive wages.
San Bernardino Tepenene belongs to a municipality where 83.20% of the population has an income below the welfare line [27]. The low income of this population prevents them from investing in products and services to support agricultural production; however, some farmers receive agricultural inputs in-kind and financial support from the government. Nevertheless, agricultural systems dependent on external inputs have required increasing use of these external resources, which results in inefficient systems that damage the environment and hinder food production [66]; therefore, food production systems should become more self-sufficient. This is achieved when the system increases its efficiency by using more local resources, and fewer external resources. ESR is the ratio used to measure the proportion of emergy from local sources [42,43]. The ESR value of 0.74 for the FMS in San Bernardino Tepenene indicated that the use of local resources (74%) is 2.8 times higher than the use of purchased resources (26%). The FMS used a high quantity of local resources compared to other agricultural systems. Such as the wheat production systems of several provinces in China, which had ESR values of 0.13–0.20, depending on the climatic zone [63] and the field cucumber production system of 26 Chinese provinces (0.11) [64]. Even the ESR value of the FMS was higher than that of the optimized agricultural system proposed by Wang et al. [18] in Shandong, China, whose value was 0.50.
High crop yield can contribute to food security in highly marginalized rural communities. A study carried out in rural areas of Yucatan, Mexico reported that the FMS and the family orchard provide an average of 63.70% of food needs [67]. When the yield increases, the contribution of food for the family also increases; if even a part of the production can be sold to get an income, families are much better off. With this, the family can buy food and complement their diet. EYR shows the capacity of the system to exploit local resources by investing outside resources from the economy [20,39]. The FMS in San Bernardino Tepenene registered an EYR value of 3.78, which indicated the capacity of the system to exploit local resources and provide an emergy about 3.7 times greater than the emergy invested from purchased resources. The amount of emergy provided with this yield was indicated by the NE (net emergy) value of 1.35 × 10¹⁶ sej ha−1 y−1. The EYR value in this study was higher than that of the wheat, maize–wheat double cropping, and maize production systems in Hebei, China, which were 1.19, 1.23, and 2.35, respectively [61]; the fodder maize system in Denmark, which had a value of 1.24 [15]; the bean production systems in Markazi, Iran (1.17–1.28) [16]; and the field cucumber production system of 26 Chinese provinces (1.13) [64]. The EYR value of the FMS was much lower than that of some of the agroforestry systems of Chiapas, Mexico [13], which had EYRs up to 50.72, but it was only slightly lower than the agroforestry systems with a majority of the land dedicated to the milpa (4.53 and 4.58); however, these agroforestry systems mimic natural ecosystems, and their successful management requires recycling instead of using more purchased inputs. This traditional management system allows high performance through the efficient use of emergy that is achieved by using more local resources and less purchased resources to support production. Therefore, traditional knowledge plays a significant role in the proper performance of production systems. Even this knowledge has been recognized for contributing to sustainable development and could benefit decision-making processes [68,69].
ELR measures the environmental pressure caused by the production process [20,39]. The lower the ELR, the lower the environmental pressure. The ELR of the FMS in San Bernardino Tepenene, with a value of 0.39, was within the low range of ELR values. ELR values lower than two have been reported for several systems with low environmental pressure: The wheat–maize double-cropping system in North China fertilized with chemical fertilizers (1.79), chemical fertilizers-crop straw (1.67), chemical fertilizers-biogas residues (1.27), and chemical fertilizers-mushroom residue (1.94), considering the emergy loss of recycled resources [38]; the tagasaste (Chamaecytisus proliferus) system (0.70) in Australia [65]; and the case of the agroforestry systems (0.03–0.38) in Chiapas, Mexico [13]. The highest ELR values within the agroforestry systems in Chiapas were those with the majority of the land dedicated to the milpa (0.36 and 0.38), which were very similar to that of the FMS. ELR values within the moderate range have been reported for the fodder maize system in Denmark (5.20) [15], the lupin/wheat (Lupinus angustifolius/Triticum aestivum) rotation system (5.50), and the lupin/wheat rotation system grown between tagasaste trees (2.30) in Australia [65]. ELR values within the high range have been reported in the wheat and maize production systems of southwestern Iran (77.95–115.20 and 374.73–570.54, respectively) [14], the bean production systems in Markazi, Iran (16.81–39.66) [16], and in the field cucumber production system of 26 Chinese provinces (18.42) [64].
EIR measures the emergy matching, which allows us to identify how efficient the emergy use is and if a system is economically attractive [12]. The FMS in San Bernardino Tepenene had an EIR value of 0.36. This value indicated that a large number of free resources were used compared to purchased resources and that the emergy use was efficient. If the EIR value for Mexico of 4.53 [60] and an EIR value for Nayarit, Mexico of 2.43 [70] are assumed to be reasonable for Puebla, the EIR value of the FMS would be lower than the regional value. This means that the system would be economical and might have a commercial advantage compared to systems with a higher EIR value, since systems with a lower EIR use fewer purchased resources and maximize the system output with locally available resources, which means a lower cost for the yield and, therefore, a lower sale price for products can be offered in the market. Nevertheless, the appropriate value of EIR should be carefully considered, since a system can be displaced by more economically intensive systems; therefore, in planning, an EIR value equal to the regional value is often adopted to avoid or slow such displacement [12].
When we compared the EIR value of the FMS with other systems, we observed that EIR values lower than one were found in the lupin/wheat rotation, tagasaste, and lupine/wheat rotation grown between tagasaste trees in Australia, which had EIR values of 0.50, 0.60, and 0.80, respectively [65]. EIR values higher than one have been reported for the bean production systems in Markazi, Iran (3.57–6.03) [16]; the wheat production systems of several provinces in China [63] that have the largest wheat planting areas (4.15–7.18); the field cucumber production system of 26 Chinese provinces (8.64) [64]; and almost all the farm management scenarios examined in the wheat and maize systems of southwestern Iran, which had EIR values of 1.38–3.55 and 0.99–3.25, respectively [14]. However, the rainfed maize/wheat rotation system at the Research Farm in Uttarakhand, India [62] had EIR values lower than one in most of its treatments (0.21–0.73), including the 100% recommended dose of inorganic fertilizers (0.57), but the system had EIR values higher than one in the treatments of 50% inorganic fertilizers + 50% vermi-compost (2.03), and 50% inorganic fertilizers + 50% poultry manure (1.46). All these values indicated that the quantity of purchased resources used was up to more than six times greater than the quantity of free resources used locally. Nevertheless, the free emergy from the environment and the purchased emergy from the economy should be matched according to theory in the best development alternatives [12] (pp. 164–171).
The EIR value that we assume in this study for the next larger system is too general and does not correspond to the year of the study. Therefore, the EIR value of the next larger systems to the FMS in the San Bernardino Tepenene community (municipality, state, and nation) should be determined.
The sustainability of the FMS is high, if we compare it to other grain, legume, and cucurbit production systems, including ecologic, recycling, and optimized agricultural systems, except for the reported agroforestry systems of Chiapas; however, the sustainability of the FMS is close to the sustainability of the agroforestry systems with the majority of the land dedicated to the milpa (Table 3). ESI, or the ratio between the yield of the process and the estimated environmental damage caused, has been used to evaluate the sustainability of processes [39,41]. Therefore, ESI was used to assess the sustainability of the production process of the FMS. The ESI value of the FMS in San Bernardino Tepenene was 9.80; this value was greater than the ESI of the fodder maize system in Denmark, which registered a value of 0.24 [15]; the bean production systems in Markazi, Iran (0.03–0.08), where the ecologic system had the highest ESI value [16]; the field cucumber production system of 26 Chinese provinces (0.08) [64]; the rainfed maize/wheat rotation system [62] at the Research Farm in Uttarakhand, India (0.15–1.16); and the wheat–maize double-cropping recycling agricultural systems [38] in North China (0.57–1.35), considering the emergy loss of recycled resources. However, the agroforestry systems in Chiapas, Mexico, which use a large quantity of renewable resources [13], had much higher ESI values (up to 1739.85). This value reveals the dimensions of the possibilities that can be achieved with a suitable management system and the realization that the FMS in San Bernardino Tepenene can attain greater sustainability. Nevertheless, the fact that the FMS had an ESI value that was close to those of the agroforestry systems in Chiapas, Mexico [13] with the majority of the land dedicated to milpa agriculture (11.93 and 12.59) indicates that the degree of possible improvement may be limited.
This study concludes that the performance of the FMS was determined by the growth of the main crops in a specific culture and environment. Therefore, more studies are required to understand the economic-environmental behavior of the milpa system with other varieties of plants in other environments and cultures.

5. Conclusions

The emergy evaluation allowed us to gain a holistic understanding around the nature–society interface of the FMS since the environmental and economic inputs were expressed on a common basis. The results indicated that the global performance of the FMS is superior as determined by the values of its emergy indicators compared to other grain, legume, and cucurbit production systems, including ecologic, recycling, and optimized agricultural systems, since the FMS has high renewability, self-sufficiency, yield, and sustainability, has low loading on the environment, is economical, and the emergy use is efficient. However, the use of resources in the FMS is not optimum and needs to be improved to reach its maximum performance (maximum empower). However, our findings depend on the available data for the next larger systems, which are too general and outdated. Therefore, we need to carry out future research to evaluate the next larger systems, i.e., the municipality, state, and nation. Later, we will be able to carry out experimental evaluations and computer simulations. This future work will be useful in the challenges related to development alternatives, performance, and selection of models, which will provide increasingly effective tools for the development of sustainable agricultural systems and the eradication of poverty and hunger in rural communities.

Supplementary Materials

The following are available online at https://www.mdpi.com/article/10.3390/su13169425/s1, Table S1: Input flows calculation for maize crop in Table 1, Table S2: Input flows calculation for bean crop in Table 1, Table S3: Input flows calculation for squash crop in Table 1, Table S4: Calculations of annual production of the co-products and splits in Table 2, Table S5: GEBs and their respective equivalency factor for adjusting the UEVs to a reference GEB of 12.00 × 1024 seJ y−1. Refs [71,72,73,74,75,76,77,78,79,80,81,82,83,84,85,86,87] are cited in supplementary files.

Author Contributions

Conceptualization, M.A.A.-R., D.E.C., D.R.-L., R.R.-L., R.M.-P. and M.H.-L.; methodology, M.A.A.-R. and D.E.C.; validation, M.A.A.-R., D.E.C., D.R.-L., R.R.-L., R.M.-P. and M.H.-L.; formal analysis, M.A.A.-R.; investigation, M.A.A.-R.; resources, M.A.A.-R.; data curation, M.A.A.-R.; writing—original draft preparation, M.A.A.-R.; writing—review and editing, M.A.A.-R., D.E.C., D.R.-L., R.R.-L., R.M.-P. and M.H.-L; visualization, M.A.A.-R. and D.E.C.; supervision, M.H.-L.; project administration, M.H.-L.; funding acquisition, M.A.A.-R. All authors have read and agreed to the published version of the manuscript.

Funding

Partial coverage of the APC was funded by the Benemérita Universidad Autónoma de Puebla in Mexico.

Institutional Review Board Statement

Not applicable.

Informed Consent Statement

Not applicable.

Data Availability Statement

Data is contained within the article and detailed in Supplementary Materials.

Acknowledgments

We thank CONACYT for supporting the first author (Fellowship holder number: 294172). We wish to thank Higinio López-Sánchez for reviewing and improving the manuscript. We thank Cesar Calderón-Fabián for his help in the laboratory. We are grateful to the rural families in San Bernardino Tepenene Puebla, Mexico for their participation in this study.

Conflicts of Interest

The authors declare no conflict of interest.

References

  1. Resolution Adopted by the General Assembly on 25 September 2015, Transforming Our World: The 2030 Agenda for Sustainable Development. United Nations, 2015; p. 35. Available online: https://www.eea.europa.eu/policy-documents/resolution-adopted-by-the-general (accessed on 3 March 2021).
  2. World Bank. Poverty and Shared Prosperity 2020: Reversals of Fortune; World Bank: Washington, DC, USA, 2020; p. 178. [Google Scholar]
  3. Grubbström, A.; Sooväli-Sepping, H. Estonian family farms in transition: A study of intangible assets and gender issues in generational succession. J. Hist. Geogr. 2012, 38, 329–339. [Google Scholar] [CrossRef]
  4. Fan, S.; Brzeska, J.; Keyzer, M.; Halsema, A. From Subsistence to Profit: Transforming Smallholder Farms; International Food Policy Research Institute: Washington, DC, USA, 2013; p. 30. [Google Scholar]
  5. Wegren, S.K.; O’Brien, D.J. Introduction to symposium: Smallholders in communist and postcommunist societies. J. Agrar. Chang. 2018, 18, 869–881. [Google Scholar] [CrossRef]
  6. FAO. Año Internacional de la Agricultura Familiar. 2015. Available online: www.fao.org/family-farming-2014/es (accessed on 13 August 2017).
  7. Watters, R.F. Shifting Cultivation in Latin America; FAO: Rome, Italy, 1971. [Google Scholar]
  8. Ebel, R.; Pozas-Cárdenas, J.G.; Soria-Miranda, F.; Cruz-González, J. Manejo orgánico de la milpa: Rendimiento de maíz, frijol y calabaza en monocultivo y policultivo. Terra Lat. 2017, 35, 149–160. [Google Scholar] [CrossRef] [Green Version]
  9. Birol, E.; Villalba, E.R.; Smale, M. Farmer preferences for milpa diversity and genetically modified maize in Mexico: A latent class approach. Int. Food Policy Res. Inst. 2009, 14, 521–540. [Google Scholar] [CrossRef] [Green Version]
  10. Pérez-García, O.; del Castillo, R.F. The decline of the itinerant milpa and the maintenance of traditional agrobiodiversity: Crops and weeds coexistence in a tropical cloud forest area in Oaxaca, Mexico. Agric. Ecosyst. Environ. 2016, 228, 30–37. [Google Scholar] [CrossRef]
  11. Sánchez-Morales, P.; Hernández Ortiz, P. Sistema milpa. Elemento de identidad campesina e indígena; Programa de Intercambio, Diálogo y Asesoría en Agricultura Sostenible y Soberanía Alimentaria; PIDAASSA: Distrito Federal, Mexico, 2014; p. 25. [Google Scholar]
  12. Odum, H.T. Environmental Accounting: Emergy and Environmental Decision Making; Wiley: New York, NY, USA, 1996; p. 370. ISBN 0-471-11442-1. [Google Scholar]
  13. Diemont, S.A.W.; Martin, J.F.; Levy-Tacher, S.I. Emergy evaluation of Lacandon Maya indigenous swidden agroforestry in Chiapas, Mexico. Agrofor. Syst. 2006, 66, 23–42. [Google Scholar] [CrossRef]
  14. Houshyar, E.; Wu, X.F.; Chen, G.Q. Sustainability of wheat and maize production in the warm climate of southwestern Iran: An emergy analysis. J. Clean. Prod. 2018, 172, 2246–2255. [Google Scholar] [CrossRef]
  15. Ghaley, B.B.; Kehli, N.; Mentler, A. Emergy synthesis of conventional fodder maize (Zea mays L.) production in Denmark. Ecol. Indic. 2018, 87, 144–151. [Google Scholar] [CrossRef]
  16. Asgharipour, M.R.; Shahgholi, H.; Campbell, D.E.; Khamari, I.; Ghadiri, A. Comparison of the sustainability of bean production systems based on emergy and economic analyses. Environ. Monit. Assess. 2019, 191, 21. [Google Scholar] [CrossRef] [PubMed]
  17. Lewandowska-czarnecka, A.; Selene, L.; Nienartowicz, A.; Piernik, A. Energy and emergy analysis for assessing changes in Polish agriculture since the accession to the European Union. Ecol. Modell. 2019, 412, 108819. [Google Scholar] [CrossRef]
  18. Wang, Q.; Ma, Z.; Ma, Q.; Liu, M.; Yuan, X.; Mu, R.; Zuo, J.; Zhang, J.; Wang, S. Comprehensive evaluation and optimization of agricultural system: An emergy approach. Ecol. Indic. 2019, 107, 105650. [Google Scholar] [CrossRef]
  19. Brown, M.T.; Odum, H.T.; Jorgensen, S.E. Energy hierarchy and transformity in the universe. Ecol. Modell. 2004, 178, 17–28. [Google Scholar] [CrossRef]
  20. Brown, M.T.; Ulgiati, S. Emergy Analysis and Environmental Accounting. Encycl. Energy 2004, 2, 329–354. [Google Scholar] [CrossRef]
  21. Ulgiati, S.; Brown, M.T.; Bastianoni, S.; Marchettini, N. Emergy-based indices and ratios to evaluate the sustainable use of resources. Ecol. Eng. 1995, 5, 519–531. [Google Scholar] [CrossRef]
  22. Brown, M.T.; Ulgiati, S. Energy quality, emergy, and transformity: H.T. Odum’s contributions to quantifying and understanding systems. Ecol. Modell. 2004, 178, 201–213. [Google Scholar] [CrossRef]
  23. Campbell, D.E.; Wigand, C.; Schuetz, N.B. The Real Wealth Purchased in a Fish Dinner. In Emergy Synthesis 8: Theory and Applications of the Emergy Methodology, Proceedings of the 8th Biennial Emergy Research Conference, Center for Environmental Policy, Gainesville, FL, USA, 16–18 January 2014; Brown, M.T., Sweeney, S., Campbell, D.E., Huang, S., Rydberg, T., Ulgiati, S., Eds.; University of Florida: Gainesville, FL, USA, 2015; Abstract Number 9; pp. 61–82. [Google Scholar]
  24. Ulgiati, S.; Brown, M.T. Emergy and ecosystem complexity. Commun. Nonlinear Sci. Numer. Simul. 2009, 14, 310–321. [Google Scholar] [CrossRef]
  25. Campbell, D.E. Proposal for including what is valuable to ecosystems in environmental assessments. Environ. Sci. Technol. 2001, 35, 2867–2873. [Google Scholar] [CrossRef] [PubMed] [Green Version]
  26. Pérez-Avilés, R.; Huerta-Lara, M.; Barreiro-Zamorano, S.M.; Silva-Gómez, S.E.; Hernández-Zepeda, J.S. Traspatio Campesino Sustentable San Bernardino Tepenene, Tzicatlacoyan, Puebla; Benemérita Universidad Autónoma de Puebla: Puebla, Mexico, 2015; p. 163. ISBN 978-607-487-928-5. [Google Scholar]
  27. CONEVAL; Medición de la Pobreza. Pobreza a Nivel de Municipio 2010–2015, Mexico, 2017. Available online: www.coneval.org.mx/Medicion/Paginas/Pobreza-municipal.aspx (accessed on 3 December 2017).
  28. CONAPO; Datos abiertos del índice de marginación. Índice de marginación por municipio 1990-2015, Mexico, 2016. Available online: http://conapo.gob.mx/es/CONAPO/Datos_Abiertos_del_Indice_de_Marginacion (accessed on 8 October 2017).
  29. CONAPO. Índice De Marginación Por Localidad 2010; Consejo Nacional de Población: Distrito Federal, Mexico, 2012; p. 55. ISBN 978-607-427-128-7. [Google Scholar]
  30. Campbell, D.E. Emergy analysis of the Cobscook Bay ecosystem. In The Changing Bay of Fundy: Beyond 400 Years, Proceedings of the 6th Bay of Fundy Workshop, Cornwallis, NS, Canada, 29 September 2004; Percy, J.A., Evans, A.J., Wells, P.G., Rolston, S.J., Eds.; The Bay of Fundy Ecosystem Partnership: Dartmouth, NS, Canada, 2005; pp. 374–386. [Google Scholar]
  31. Buonocore, E.; Vanoli, L.; Carotenuto, A.; Ulgiati, S. Integrating life cycle assessment and emergy synthesis for the evaluation of a dry steam geothermal power plant in Italy. Energy 2015, 86, 476–487. [Google Scholar] [CrossRef]
  32. Odum, H.T. An emergy circuit language for ecological and social systems: Its physical basis. In Systems Analysis and Simulation in Ecology; Academic Press: New York, NY, USA, 1971; Volume 2, pp. 139–211. [Google Scholar]
  33. Odum, H.T. Environmental, Power and Society; Wiley: New York, NY, USA, 1971; p. 432. [Google Scholar]
  34. Odum, H.T. Ecological and General Systems: An Introduction to Systems Ecology, Revised edition; University Press of Colorado: Niwot, CO, USA, 1994; p. 644. ISBN 0-87081-320-x. [Google Scholar]
  35. Brown, M.T.; Herendeen, R.A. Embodied energy analysis and emergy analysis: A comparative view. Ecol. Econ. 1996, 19, 219–235. [Google Scholar] [CrossRef]
  36. Campbell, D.E.; (University of Rhode Island, Kingston, RI, USA). Personal communication, 2021.
  37. Alfaro-Arguello, R.; Diemont, S.A.W.; Ferguson, B.G.; Martin, J.F.; Nahed-Toral, J.; Álvarez-Solís, J.D.; Pinto-Ruíz, R. Steps toward sustainable ranching: An emergy evaluation of conventional and holistic management in Chiapas, Mexico. Agric. Syst. 2010, 103, 639–646. [Google Scholar] [CrossRef]
  38. Wang, X.; Li, Z.; Long, P.; Yan, L.; Gao, W.; Chen, Y.; Sui, P. Sustainability evaluation of recycling in agricultural systems by emergy accounting. Resour. Conserv. Recycl. 2017, 117, 114–124. [Google Scholar] [CrossRef]
  39. Ulgiati, S.; Brown, M.T. Monitoring patterns of sustainability in natural and man-made ecosystems. Ecol. Modell. 1998, 108, 23–36. [Google Scholar] [CrossRef]
  40. Brown, M.T.; Brandt-Williams, S.; Tilley, D.; Ulgiati, S. Emergy synthesis: An Introduction. In Emergy Synthesis 1: Theory and Applications of the Emergy Methodology, Proceedings of the 1st Biennial Emergy Research Conference, Center for Environmental Policy, Gainesville, FL, USA, 2–4 September 1999; Brown, M.T., Ed.; University of Florida: Gainesville, FL, USA, 2000; Abstract Number 1; pp. 1–14. [Google Scholar]
  41. Brown, M.T.; Ulgiati, S. Emergy-based indices and ratios to evaluate sustainability: Monitoring economies and technology toward environmentally sound innovation. Ecol. Eng. 1997, 9, 51–69. [Google Scholar] [CrossRef]
  42. Lei, K.; Zhou, S.; Wang, Z. Ecological Emergy Accounting for a Limited System: General Principles and a Case Study of Macao; Science Press: Beijing, China; Springer: Berlin/Heidelberg, Germany, 2014; p. 196. ISSN 2194-3222. [Google Scholar]
  43. Wang, C.; Wang, Y.; Geng, Y.; Wang, R.; Zhang, J. Measuring regional sustainability with an integrated social-economic-natural approach: A case study of the Yellow River Delta region of China. J. Clean. Prod. 2016, 114, 189–198. [Google Scholar] [CrossRef]
  44. NASA Prediction Of Worldwide Energy Resources; Data Access Viewer. Available online: https://power.larc.nasa.gov/ (accessed on 4 January 2019).
  45. Allen, R.G.; Pereira, L.S.; Raes, D.; Smith, M. Evapotranspiración del Cultivo, Guías Para la Determinación de los Requerimientos de Agua de los Cultivos; FAO: Rome, Italy, 2006; Volume 56, p. 298. [Google Scholar]
  46. SEMARNAT; Sistema Nacional de Información Ambiental y de Recursos Naturales, Espacio Digital Geográfico, Mapas Estatales. 2020. Available online: www.gob.mx/semarnat/acciones-y-programas/sistema-nacional-de-informacion-ambiental-y-de-recursos-naturales (accessed on 27 January 2020).
  47. FAO. A Provisional Methodology for Soil Degradation Assessment; FAO: Rome, Italy, 1979. [Google Scholar]
  48. Banco de México; Mercados, Portal del Mercado Cambiario. 2019. Available online: www.banxico.org.mx/ (accessed on 11 January 2019).
  49. SEMARNAT, INECC, SENER, CONUEE, Secretaría de Economía, PROFECO; Portal de Indicadores de Eficiencia Energética y Emisiones Vehiculares. Available online: www.ecovehiculos.inecc.gob.mx (accessed on 7 June 2019).
  50. Brown, M.T.; Campbell, D.E.; De Vilbiss, C.; Ulgiati, S. The geobiosphere emergy baseline: A synthesis. Ecol. Modell. 2016, 339, 92–95. [Google Scholar] [CrossRef]
  51. Brandt -Williams, S.L. Emergy of Florida Agriculture; Handbook of Emergy Evaluation: A Compendium of Data for Emergy Computation Issued in a Series of Folios, Folio 4 (2nd Printing); The Center for Environmental Policy, University of Florida: Gainesville, FL, USA, 2002; Volume 40. [Google Scholar]
  52. Brown, M.T.; Ulgiati, S. Emergy assessment of global renewable sources. Ecol. Modell. 2016, 339, 148–156. [Google Scholar] [CrossRef] [Green Version]
  53. Ulgiati, S.; Brown, M.T. Labor and services as information carriers in emergy-LCA accounting. J. Environ. Account. Manag. 2014, 2, 163–170. [Google Scholar] [CrossRef]
  54. Campbell, D.E.; Lu, H. Emergy Evaluation of Formal Education in the United States: 1870 to 2011. Systems 2014, 2, 328–365. [Google Scholar] [CrossRef] [Green Version]
  55. Hernández-Sampieri, R.; Fernández-Collado, C.; Baptista-Lucio, P. Metodología de la Investigación, 4th ed.; Mc Graw Hill Interamericana: Distrito Federal, Mexico, 2006; p. 850. ISBN 970-10-5753-8. [Google Scholar]
  56. SEDESOL; Catálogo de Localidades. Available online: www.microrregiones.gob.mx/catloc/contenido.aspx?refnac=211930008 (accessed on 8 September 2017).
  57. Campbell, D.E.; Erban, L.E. A Reexamination of the Emergy Input to a System from the Wind. In Emergy Synthesis 9: Theory and Applications of the Emergy Methodology, Proceedings of the 9th Biennial Emergy Research Conference, Center for Environmental Policy, Gainesville, FL, USA, 7–9 January 2016; Brown, M.T., Sweeney, S., Campbell, D.E., Huang, S., Rydberg, T., Ulgiati, S., Eds.; University of Florida: Gainesville, FL, USA, 2017; Abstract Number 7; pp. 13–20. [Google Scholar]
  58. Santagata, R.; Viglia, S.; Fiorentino, G.; Liu, G.; Ripa, M. Power generation from slaughterhouse waste materials. An emergy accounting assessment J. Clean. Prod. 2019, 223, 536–552. [Google Scholar] [CrossRef]
  59. Brandt-Williams, S.L. Evaluation of Watershed Control of Two Central Florida Lakes: Newnans Lake and Lake Weir. Ph.D. Thesis, University of Florida, Gainesville, FL, USA, 1999. [Google Scholar]
  60. NEAD. Data for Mexico, 2014. Data Modified (Update, 2021). Available online: www.emergy-nead.com/country/data (accessed on 15 March 2021).
  61. Wang, X.; Chen, Y.; Sui, P.; Gao, W.; Qin, F.; Zhang, J.; Wu, X. Emergy analysis of grain production systems on large-scale farms in the North China Plain based on LCA. Agric. Syst. 2014, 128, 66–78. [Google Scholar] [CrossRef]
  62. Singh, R.J.; Ghosh, B.N.; Sharma, N.K.; Patra, S.; Dadhwal, K.S.; Mishra, P.K. Energy budgeting and emergy synthesis of rainfed maize-wheat rotation system with different soil amendment applications. Ecol. Indic. 2016, 61, 753–765. [Google Scholar] [CrossRef]
  63. Zhao, H.; Zhai, X.; Guo, L.; Liu, K.; Huang, D.; Yang, Y.; Li, J.; Xie, S.; Zhang, C.; Tang, S.; et al. Assessing the efficiency and sustainability of wheat production systems in different climate zones in China using emergy analysis. J. Clean. Prod. 2019, 235, 724–732. [Google Scholar] [CrossRef]
  64. Zhao, H.; Zhai, X.; Guo, L.; Yang, Y.; Li, J.; Ren, C.; Wang, K.; Liu, X.; Zhan, R.; Wang, K. Comparing protected cucumber and field cucumber production systems in China based on emergy analysis. J. Clean. Prod. 2019, 236, 117648. [Google Scholar] [CrossRef]
  65. Lefroy, E.; Rydberg, T. Emergy evaluation of three cropping systems in southwestern Australia. Ecol. Modell. 2003, 161, 195–211. [Google Scholar] [CrossRef] [Green Version]
  66. Funes-Monzote, F.R. Eficiencia Energética en Sistemas Agropecuarios: Elementos Teóricos y Prácticos Para el Cálculo y Análisis Integrado, 1st ed.; Asoc. Cuba. Técnicos Agrícolas y For: Matanzas, Cuba, 2009; p. 37. [Google Scholar]
  67. de Salazar-Barrientos, L.L.; Magaña-Magaña, M.Á. Aportación de la milpa y traspatio a la autosuficiencia alimentaria en comunidades mayas de Yucatán. Estud. Soc. 2016, 24, 23. [Google Scholar]
  68. El Chami, D.; Daccache, A.; El Moujabber, M. How Can Sustainable Agriculture Increase Climate Resilience? A Systematic Review. Sustainability 2020, 12, 3119. [Google Scholar] [CrossRef] [Green Version]
  69. IPCC. Climate Change 2014: Synthesis Report. Contribution of Working Groups I, II and III to the Fifth Assessment Report; Writing Team, T.C., Pachauri, R.K., Meyer, L.A., Eds.; Intergovernmental Panel on Climate Change: Geneva, Switzerland, 2014; p. 151. [Google Scholar]
  70. Brown, M.T.; Green, P.; Gonzalez, A.; Venegas, J. Emergy Anlysis Perspectives, Public Policy Options, and Development Guidelines for the Coastal Zone of Nayarit, Mexico; University of Florida, Center for Wetlands and Water Resources: Gainesville, FL, USA, 1992; Volume 2, pp. 4–5. [Google Scholar]
  71. Garratt, J.R. Review of drag coefficients over oceans and continents. Mon. Weather Rev. 1977, 105, 915–929. [Google Scholar] [CrossRef] [Green Version]
  72. Reiter, E.R. Atmospheric Transport processes, Part I: Energy Transfers and Transformations, 1st ed.; U.S. Atomic Energy Commission, Division of Technical Information: Oak Ridge, TN, USA, 1969; p. 253.
  73. Campbell, D.E. A Note on the Uncertainty in Estimates of Transformities Based on Global Water Budgets. In Emergy Synthesis 2: Theory and Applications of the Emergy Methodology, Proceedings of the 2nd Biennial Emergy Research Conference, Center for Environmental Policy, Gainesville, FL, USA, 20–22 September 2001; Brown, M.T., Odum, H.T., Tilley, D., Ulgiati, S., Eds.; University of Florida: Gainesville, FL, USA, 2003; Abstract Number 25; pp. 349–353. [Google Scholar]
  74. INCAP/OPS. Tabla de Composición de Alimentos de Centroamérica, 2nd ed.; Serviprensa: Guatemala, Guatemala, 2012; p. 126. [Google Scholar]
  75. Guillen-Trujillo, H.A. Sustainability of Ecotourism and Traditional Agricultural Practices in Chiapas, Mexico. Ph.D. Thesis, University of Florida, Gainesville, FL, USA, 1998. [Google Scholar]
  76. Nerson, H.; Paris, H.S.; Paris, E.P. Fruit shape, size and seed yield in Cucurbita pepo. Acta Hortic. 2000, 510, 227–230. [Google Scholar] [CrossRef]
  77. Valdés-Restrepo, M.P.; Ortiz-Grisales, S.; Vallejo-Cabrera, F.A.; Baena-García, D. Variabilidad en frutos y semillas de Cucurbita moschata Duch. y Cucurbita argyrosperma subsp. sororia L.H. Bailey Merrick & D.M. Bates. Acta. Agron. 2014, 63, 282–293. [Google Scholar]
  78. Chí-Sánchez, F.A.; Alvarado-López, C.J.; Cristóbal-Alejo, J.; Reyes-Ramírez, A. Características morfológicas y determinación de minerales por μ-XRF en fruto de calabaza (Cucurbita moschata Duch). Agrociencia 2020, 54, 683–690. [Google Scholar] [CrossRef]
  79. Fandika, I.R.; Kemp, P.D.; Millner, J.P.; Horne, D.J. Yield and water use efficiency in buttercup squash (Cucurbita maxima Duchesne) and heritage pumpkin (Cucurbita pepo Linn). Aust. J. Crop. Sci. 2011, 5, 742–747. [Google Scholar]
  80. Muñoz-Tlahuiz, F.; de Guerrero-Rodríguez, J.D.; López, P.A.; Gil-Muñoz, A.; López-Sánchez, H.; Ortiz-Torres, E.; Hernández-Guzmán, J.A.; Taboada-Gaytán, O.; Vargas-López, S.; Valadez-Ramírez, M. Producción de rastrojo y grano de variedades locales de maíz en condiciones de temporal en los valles altos de Libres-Serdán, Puebla, México. Rev. Mex. Cienc. Pecu. 2013, 4, 515–530. [Google Scholar]
  81. Escalante-Estrada, J.A.; Rodríguez-González, M.T.; Escalante-Estrada, Y.I. Nitrógeno, distancia entre surcos, rendimiento y productividad del agua en dos cultivares de frijol. Bioagro 2015, 27, 75–82. [Google Scholar]
  82. Escalante-Estrada, J.A.S.; Rodríguez-gonzález, M.T. Biomass and yield of common bean (Phaseolus vulgaris L.) as a function of the nitrogen source. USDA 2017, 60, 77–78. [Google Scholar]
  83. Campbell, D.E. A Revised Solar Transformity for Tidal Energy Received by the Earth and Dissipated Globally: Implications for Emergy Analysis. In Emergy Synthesis 1: Theory and Applications of the Emergy Methodology, Proceedings of the 1st Biennial Emergy Research Conference, Center for Environmental Policy, Gainesville, FL, USA, 2–4 September 1999; Brown, M.T., Ed.; University of Florida: Gainesville, FL, USA, 2000; Abstract Number 21; pp. 255–263. [Google Scholar]
  84. Odum, H.T.; Brown, M.T.; Brandt-Williams, S. Introduction and Global Budget; Handbook of Emergy Evaluation: A Compendium of Data for Emergy Computation Issued in a Series of Folios, Folio 1; The Center for Environmental Policy, University of Florida: Gainesville, FL, USA, 2000; p. 16. [Google Scholar]
  85. Campbell, D.E.; Brandt-Williams, S.L.; Cai, T. Current Technical Problems in Emergy Analysis. In Emergy Synthesis 3: Theory and Applications of the Emergy Methodology, Proceedings of the 3rd Biennial Emergy Research Conference, Center for Environmental Policy, Gainesville, FL, USA, 29–31 January 2004; Brown, M.T., Bardi, E., Campbell, D.E., Comar, V., Huang, S., Rydberg, T., Tilley, D., Ulgiati, S., Eds.; University of Florida: Gainesville, FL, USA, 2005; Abstract Number 10; pp. 143–157. [Google Scholar]
  86. Campbell, D.E.; Bastianoni, S.; Lu, H. The emergy baseline for the earth: Is it arbitrary? In Proceedings of the 6th Biennial Emergy Research Conference, Gainesville, FL, USA, 14–16 January 2010; Center for Environmental Policy, University of Florida: Gainesville, FL, USA. [Google Scholar]
  87. Brown, M.T.; Ulgiati, S. Updated evaluation of exergy and emergy driving the geobiosphere: A review and refinement of the emergy baseline. Ecol. Modell. 2010, 221, 2501–2508. [Google Scholar] [CrossRef]
Figure 2. Energy Systems Language [32,33,34] diagram of the family milpa system (FMS) in San Bernardino Tepenene Puebla, Mexico, showing the emergy flows (values rounded to one decimal place). R: Local renewable resources; N: Local non-renewable resources; F: Purchased resources; ET: Evapotranspiration; DAP: Diammonium phosphate; GA: Government assistance; GNP: Gross National Product; dashed lines are money flows, gray lines show the used available energy, blue lines show the emergy inflows carried over from the past year, and green lines indicate the products saved for next year’s production.
Sustainability 13 09425 g002
Table 1. Annual emergy per hectare used in the FMS in San Bernardino Tepenene Puebla, Mexico.
AmountBaseline 12.00 × 1024 (seJ y−1) Solar Emergy
(sej ha−1 y−1)
Item numberItemUnitMaizeBeanSquashUEV 1
(sej Unit−1)
Ref. for UEVMaizeBeanSquashTotal%
Local renewable resources (R)
1SunlightJ3.38 × 10139.15 × 10101.16 × 10111.00 × 100[12]3.38 × 10139.15 × 10101.16 × 10113.40 × 10130.18
2Kinetic energy of wind 2J3.31 × 10108.97 × 1071.13 × 1081.24 × 103[57]4.11 × 10131.11 × 10111.41 × 10114.13 × 10130.23
3Chemical potential energy in rain 2J2.20 × 10105.95 × 1077.52 × 1072.25 × 104[36]4.94 × 10141.34 × 10121.69 × 10124.97 × 10142.70
4Evapotranspiration energyJ1.42 × 10103.83 × 1074.83 × 1072.27 × 104[36]3.23 × 10148.68 × 10111.10 × 10123.25 × 10141.77
Reinforcing feedbacks:
5Squash plant residuesJ0.00 × 1000.00 × 1003.25 × 1092.15 × 105Ts0.00 × 1000.00 × 1006.98 × 10146.98 × 10143.80
6Maize forage for animal powerJ2.29 × 1070.00 × 1000.00 × 1002.21 × 105Ts5.06 × 10120.00 × 1000.00 × 1005.06 × 10120.03
7Bean plant residuesJ0.00 × 1003.74 × 1070.00 × 1003.49 × 105Ts0.00 × 1001.30 × 10130.00 × 1001.30 × 10130.07
8Maize seedJ9.04 × 1070.00 × 1000.00 × 1003.56 × 105Ts3.22 × 10130.00 × 1000.00 × 1003.22 × 10130.18
9Bean seedJ0.00 × 1002.79 × 1060.00 × 1008.12 × 105Ts0.00 × 1002.26 × 10120.00 × 1002.26 × 10120.01
10Squash seedJ0.00 × 1000.00 × 1003.62 × 1066.69 × 106Ts0.00 × 1000.00 × 1002.42 × 10132.42 × 10130.13
11Renewable field laborJ2.69 × 1083.61 × 1053.80 × 1052.26 × 107Ts6.06 × 10158.15 × 10128.59 × 10126.08 × 101533.07
12Renewable post-harvest laborJ2.59 × 1085.79 × 1055.79 × 1052.26 × 107Ts5.85 × 10151.31 × 10131.31 × 10135.88 × 101531.98
Total of R 1.25 × 10163.79 × 10137.45 × 10141.33 × 101672.16
Local non-renewable resources (N)
13Net loss of topsoilJ2.72 × 1098.83 × 1069.30 × 1069.41 × 104[12]2.56 × 10148.31 × 10118.75 × 10112.57 × 10141.40
Total of N 2.56 × 10148.31 × 10118.75 × 10112.57 × 10141.40
Purchased resources (F)
14Liquid motor fuelJ2.95 × 1077.37 × 1067.37 × 1068.39 × 104[12]2.47 × 10126.18 × 10116.18 × 10113.71 × 10120.02
15Nitrogen (urea)g7.46 × 104 30.00 × 1000.00 × 1004.80 × 109[58]3.58 × 10140.00 × 1000.00 × 1003.58 × 10141.95
16Phosphorus (DAP)g9.39 × 103 40.00 × 1000.00 × 1002.80 × 1010[59]2.62 × 10140.00 × 1000.00 × 1002.62 × 10141.43
17Nitrogen (DAP)g1.09 × 104 50.00 × 1000.00 × 1003.06 × 1010[59]3.35 × 10140.00 × 1000.00 × 1003.35 × 10141.82
18Non-renewable field laborJ7.14 × 1079.61 × 1041.01 × 1052.26 × 107Ts1.61 × 10152.17 × 10122.28 × 10121.62 × 10158.79
19Non-renewable post-harvest laborJ6.89 × 1071.54 × 1051.54 × 1052.26 × 107Ts1.56 × 10153.47 × 10123.47 × 10121.56 × 10158.50
20Tractor serviceUS$1.04 × 1020.00 × 1000.00 × 1006.94 × 1012[60]7.21 × 10140.00 × 1000.00 × 1007.21 × 10143.93
Total of F 4.85 × 10156.26 × 10126.37 × 10124.86 × 101526.44
Total emergy used (U) 1.76 × 10164.50 × 10137.53 × 10141.84 × 1016100.00
Note: DAP: Diammonium phosphate; Ts: This study; 1 Unit Emergy Value is the emergy required per output unit that is used to convert the flows or storages of a system into emergy units; 2 renewable inputs not added to avoid double counting; 3 7.46 × 101 kg; 4 9.39 × 100 kg; 5 1.09 × 101 kg.
Table 2. Annual production per hectare and UEVs of the co-products and splits produced in the FMS in San Bernardino Tepenene Puebla, Mexico.
Item CodeCo-products and SplitsAmount
(J ha−1 y−1)
Emergy
(sej ha−1 y−1)
Transformity
(sej J−1)
aSquash plant residues3.25 × 1096.98 × 10142.15 × 105
bMaize forage2.06 × 10104.55 × 10152.21 × 105
b1Maize forage for animal power2.29 × 1075.06 × 10122.21 × 105
b2Maize forage (animal feed)2.06 × 10104.55 × 10152.21 × 105
cBean plant residues3.74 × 1071.30 × 10133.49 × 105
dMaize grain1.84 × 10106.54 × 10153.56 × 105
d1Maize seed for planting9.04 × 1073.22 × 10133.56 × 105
d2Maize grain for family consumption1.83 × 10106.51 × 10153.56 × 105
eBean2.23 × 1071.81 × 10138.12 × 105
e1Bean seed for planting2.79 × 1062.26 × 10128.12 × 105
e2Bean for family consumption1.95 × 1071.58 × 10138.12 × 105
fSquash seed1.05 × 1087.03 × 10146.69 × 106
f1Squash seed for planting3.62 × 1062.42 × 10136.69 × 106
f2Squash seed for family consumption1.01 × 1086.79 × 10146.69 × 106
gSquash pulp3.99 × 1077.03 × 10141.76 × 107
Table 3. Comparison between the value of the performance indices corresponding to the FMS and other grain, legume, and cucurbit production systems.
IndicesFMSGrain, Legume, and Cucurbit Production Systems
AgroforestryBeanMaizeMaize-WheatWheatCucTagLupin/wheatOA
AfAf-MBEBH/M-IBM1M2FMM-W1M-W2M/WW1W2W3 L/WL/W-T
%Ren72.272–9772, 743.4–53.753.73.4, 4.80.2N/D16N/D1322.4–64.50.912–17N/D3060203035.2
ESR0.7N/DN/DN/DN/DN/DN/DN/DN/DN/DN/DN/DN/D0.1–0.2N/D0.1N/DN/DN/D0.5
EYR3.84.5–50.74.5, 4.61.2–1.31.31.2, 1.2N/D2.41.21–1.91.21.5–5.7N/DN/D1.21.1N/DN/DN/D3.3
ELR0.40.0–0.40.4, 0.416.8–39.716.839.7, 28.4374–5700.55.21.3–1.96.73.7–1078–115.210.7–68.610.618.40.75.52.31.8
EIR0.4N/DN/D3.6–63.66, 5.11–3.3N/DN/DN/DN/D0.2–21.4–3.64.2–7.2N/D8.60.60.50.8N/D
ESI9.811.9–174011.9, 12.60.0–0.10.10.0, 0.0N/D50.20.6–1.40.20.2–1.2N/D0.0–0.10.10.1N/DN/DN/D1.8
EP-D18.42.3–6.33.7, 6.36.5–15.46.515.4, 1142.31.60.035.5–62.721.59.4–22.334.63.1–6.8209.3–15.11.21.91.3N/D
Ref.Ts[13][13][16][16][16][14][61][15][38][61][62][14][63][61][64][65][65][65][18]
Note: All values were rounded to one decimal place. EP-D: Empower density (×1015 sej ha−1 y−1); Af: Agroforestry systems in Chiapas, Mexico; Af-M: Agroforestry systems in Chiapas, Mexico that had the majority of the land dedicated to milpa agriculture; B: Bean production systems in Markazi, Iran; EB: Ecological bean production system in Markazi, Iran; H/M-IB: High-input and medium-input bean production systems in Markazi, Iran; M1: Maize production systems in southwestern Iran; M2: Maize production system in Hebei, China; FM: Fodder maize system in Denmark; M-W1: Maize-wheat double cropping system in North China fertilized with chemical fertilizers, chemical fertilizers-crop straw, chemical fertilizers-biogas residues, and chemical fertilizers-mushroom residue, considering the emergy loss of recycled resources; M-W2: Maize-wheat double cropping system in Hebei, China; M/W: Rainfed maize/wheat rotation system at the Research Farm in Uttarakhand, India; W1: Wheat production systems in southwestern Iran; W2: Wheat production systems of several provinces in China; W3: Wheat production system in Hebei, China; Cuc: Field cucumber production system of 26 Chinese provinces; Tag: Tagasaste system in Australia: L/W: Lupin/wheat rotation system in Australia; L/W-T: Lupin/wheat rotation system grown between tagasaste trees in Australia; OA: Optimized agricultural system proposed for Shandong, China; N/D: No data; Ts: This study.
Publisher’s Note: MDPI stays neutral with regard to jurisdictional claims in published maps and institutional affiliations.

