Article

Characteristics of Soil C, N, and P Stoichiometry as Affected by Land Use and Slope Position in the Three Gorges Reservoir Area, Southwest China

College of Resources and Environment, Southwest University, Chongqing 400715, China
*
Author to whom correspondence should be addressed.
Sustainability 2021, 13(17), 9845; https://doi.org/10.3390/su13179845
Submission received: 31 July 2021 / Revised: 29 August 2021 / Accepted: 30 August 2021 / Published: 2 September 2021

Abstract

:
Land use change and slope position are commonly identified as the key factors affecting the soil organic carbon (C), total nitrogen (N), and total phosphorus (P) traits in distinct ecological scales. However, the directions of these effects are still unclear in some fragile terrestrial ecosystems. This study aimed to determine the characteristics of soil C, N, and P concentrations and stoichiometry as affected by different land uses and slope positions in a representative purple soil hillslope in Three Gorges Reservoir Area (TGRA), China, which is experiencing severe soil erosion and non-point source pollution. A total of 108 soil samples were collected from secondary forest, orchard plantation, and cropland on the upper, middle, and lower slopes, respectively. Soil C, N, and P concentrations and their stoichiometric ratios were determined. The results showed that soil C concentration was not affected by land use, while soil N and P concentrations were both the highest in orchard plantation rather than in secondary forest and cropland, resulting in the lowest C:N, C:P, and N:P ratios in the orchard plantation. Soil C and N concentrations synchronously decreased from upper slope to the lower slope, and soil P concentration was not markedly different among slope positions. This also caused the insignificant difference in soil C:N ratio and the remarkably lowest C:P and N:P ratios on the lower slope. There were significant interactive effects of land use and slope position on the study soil variables except soil P concentration. Our results highlight the effects of land use and slope position on soil C, N, and P traits and point to the decoupling of linkages between soil P and soil C as well as N due to the severe soil erosion and overuse of fertilization in the TGRA.

1. Introduction

Soil element concentrations and stoichiometric ratios greatly affect soil organisms, which, in turn, regulate these soil elements’ traits through metabolic activities [1]. Soil carbon (C), nitrogen (N) and phosphorus (P) are three essential elements in bionts, and their concentrations and stoichiometry are demonstrated to be important indicators for interpreting the element cycling of soil ecosystems in various ecological scales [2,3]. Since a variety of environmental factors, such as climate, topography, parent materials, vegetation types, and human disturbances can alter the soil C, N, and P concentrations [4,5,6] and simultaneously influence the stoichiometric ratios of these elements [7], the characteristics of soil C, N, and P concentrations and stoichiometry display significant differences in different terrestrial ecosystems. However, the magnitude of these factors affecting the soil C, N, and P traits are not specifically quantified at various ecological scales [8,9].
Terrestrial soils are susceptible to human-induced land use changes, and thus the status of soil C, N, and P can be significantly different in different land uses [10,11,12,13], due to various factors, such as different plant communities and management practices (e.g., fertilization and cultivation), which affect the quantity and quality of elements in the soils [14]. Most previous studies have shown that soil C, N, and P concentrations in forest are higher than those in shrub, grassland, and farmland [11,15], while Liu et al. [16] found that soil C concentration is higher in shrubland than in secondary forest. Although there have been many studies focusing on the differences in C, N, and P concentrations under different land uses [9,11,14], the characteristics of their stoichiometric ratios in response to different land uses remain unclear. Cleveland and Liptzin [17] found well-constrained C:N:P stoichiometric ratios (186:13:1) at the 0–10 cm soil depth in forests and grasslands. By contrast, Xu et al. [18] suggested that the C, N, and P stoichiometric ratios at the 0–30 cm soil profile varied significantly among different land uses. These conflicting results require further studies on quantifying the effects of different land uses on the dynamics of soil C, N, and P concentrations and stoichiometry.
Slope position, a representative topographic factor, plays an important role in affecting soil C, N, and P elements [19,20]. Wei et al. [21] reported that soil C and N concentrations increased from the upper slope to the lower slope in Korshinsk peashrub land. Yu et al. [19] suggested that slope position exerted significant effects on the spatial variability of soil C, showing the highest soil C concentration on the lower slope, followed by the middle slope, and the lowest on upper slope. Sigua et al. [22] also found a significant decrease in the soil P concentration from top slope to the middle slope. Although characterization of the slope position effects on soil C, N, and P concentrations have generated a deep understanding of the topographic impacts on soil element biogeochemical cycling, the effects of slope position on soil C, N, and P stoichiometry remain poorly understood.
Purple soil is weathered from the purplish Jurassic and Cretaceous rock system and is mainly distributed in the Three Gorges Reservoir Area (TGRA), approximately accounting for 78.7% of the total farmland of the TGRA [20,23]. Purple soil hillslope is a representative fragile ecosystem experiencing severe water erosion due to intensive land use change, steep topography, locally wet climate, and poor soil structure in the TGRA. This also leads to high risk of agricultural non-point source pollution and impedes the sustainable development of agricultural production in the TGRA [24,25]. Recently, the conversion from cropland to the orchard plantation has been expanding development to meet high economic benefits in the TGRA. However, to the best of our knowledge, the synchronous ecological services of this conversion in such a fragile ecosystem, like its effects on soil C, N, and P traits and other soil physicochemical properties, have not been well determined. Indeed, addressing these effects will help to deepen the understanding of the biogeochemical properties of C, N, and P, and quantify the ecological services considering the comprehensive benefits of soil quality improvement.
In this study, the characteristics of soil C, N, and P concentrations and stoichiometry were investigated in different slope positions from secondary forest, orchard plantation, and cropland in a representative purple soil hillslope in the TGRA. The specific objectives of this study were to: (1) quantify the independent and interactive effects of different land uses and slope positions on soil C, N, and P concentrations and stoichiometry as well as selected soil physicochemical properties, and (2) examine the interrelationships between selected soil physicochemical properties and C, N, and P concentrations and stoichiometry.

2. Materials and Methods
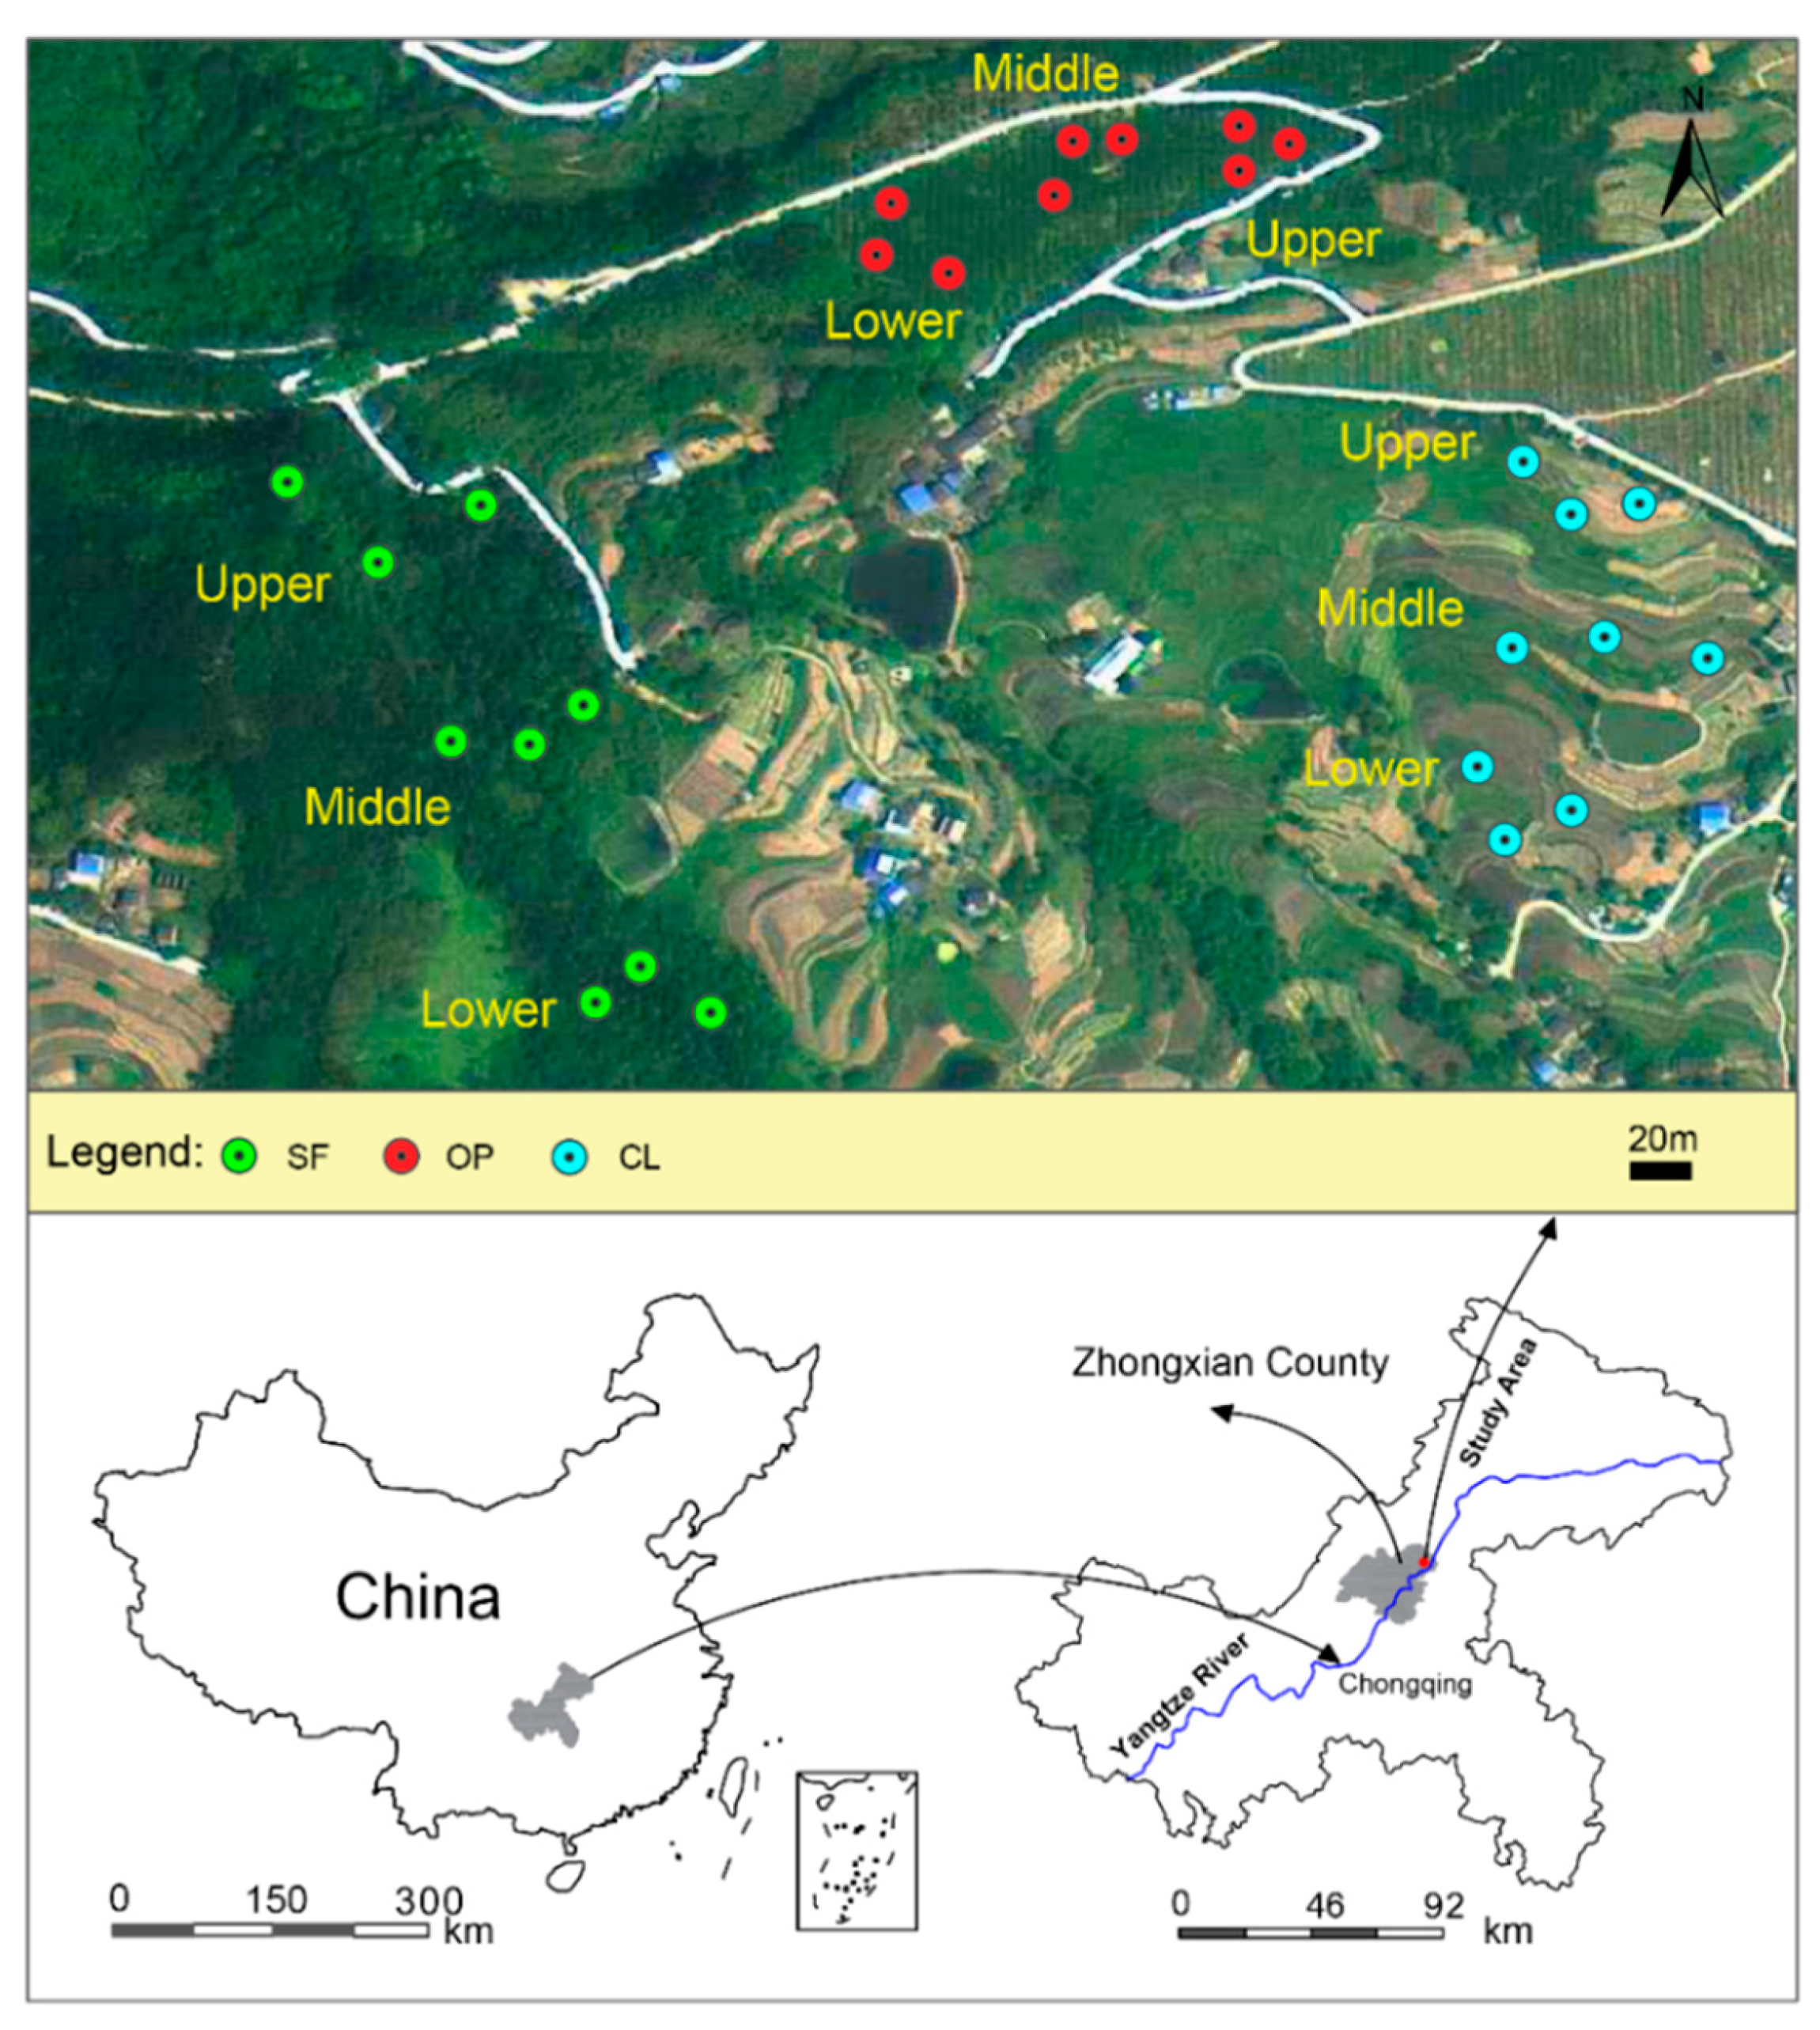
2.1. Study Area

The study site is situated in the Shipanqiu watershed (SPQ) (108°10′1″ E, 30°25′13″ N), Zhongxian County, Chongqing Municipality, Southwest China (Figure 1). The SPQ watershed drains directly to the Yangtze River, and is a representative agricultural demonstration base in the TGRA. The study area has an elevation of 119–780 m above sea level, and its prevailing regional climate is a subtropical monsoon humid climate with mean annual air temperature of 19.2 °C, and annual average precipitation of 1150 mm mainly occurring from May to October. Soils in the study area are classified as purple soil corresponding to Regosols in FAO Taxonomy or Entisols in USDA Taxonomy [26]. Land uses are secondary forest (SF), orchard plantation (OP), and cropland (CL), accounting for 18.7%, 8.1%, and 61.1% of the study area, respectively. Among them, SF comprises the major silvicultural tree species including masson pine (Pinus massoniana Lamb.), cypress (Cupressus funebris Endl.), white oak (Quercus fabric Hance.), and cedar (Cunninghamia lanceolata Lamb.), while OP is dominated by orange tree (Citurs reticulate Blanco.), and CL is commonly cultivated with corn (Zea mays L.) and rape (Brassica campestris L.) (Table 1). In total, 500–900 kg·ha−1 compound fertilizer (N:P2O5:K2O = 15:15:15) is applied annually to OP, and 250–350 kg·ha−1 urea and 300–600 kg·ha−1 compound fertilizer are annually applied to CL, according to the local farmers. There is no application of fertilizer to the SF.

2.2. Soil Sampling and Measurements

The soil sampling was performed in late May 2019, at a time in which there was no rain for a week before the sampling days and it was an almost clear day during the sampling period. The upper, middle, and lower slope position for the three land uses, i.e., SF, OP, and CL, were in situ identified (Figure 1), and three sampling sites (10 m × 10 m for each site) in each position of each land use were randomly chosen, respectively, in the study area. Seven points were set through drawing an “S” shape, and then five soil cores were collected at each interval at a 5 cm soil depth from 0 to 20 cm in each site. These soil cores, sampled from the five sampling points corresponding to each soil layer in each slope position of each land use, were mixed thoroughly, and then collected quartering to a composite sample using plastic bag with marks. A total of 108 composite soil samples (3 land uses × 3 slope position × 3 sampling sites × 4 soil layers) were obtained in the study area. These soil samples were air-dried and passed through a 2 mm sieve after roots, rocks, and other debris in the soil samples were carefully removed by hand. Furthermore, undisturbed soil cores at each interval 5 cm soil depth from 0 to 20 cm in each site were also collected to determine the soil bulk density (BD).
Soil organic carbon (C) concentration was analyzed using the Walkley–Black dichromate oxidation method [27]. Soil nitrogen (N) concentration was measured using the Kjeldahl digestion procedure [27]. Soil phosphorus (P) concentration was determined by molybdenum antimony colorimetry after fusion with sodium hydroxide [27]. Soil BD was determined by the weighing method [27]. Soil pH and EC were measured in a volume ratio (1:2.5 soil/water ratio) using a pH meter (PHSJ-5, REX company, Shanghai, China) and an EC meter (DDSJ-318, REX company, Shanghai, China), respectively. Soil cation exchange capacity (CEC) was measured using the NH4Ac exchange [27].
To compare the effects of land use and slope position on study soil variables, the average value calculated from 4 soil layers across the 0–20 cm soil profile was used to represent the change in the corresponding slope position, and the average value calculated from 3 soil positions was used to represent the change for the corresponding land use.

2.3. Statistical Analysis

A Shaprio–Wilk test was performed to examine the normality of variables and the log-transformation (base 10) was conducted when the data did not show normal distribution. One-way analysis of variance (ANOVA) was used to determine the effects of land use and slope position on C, N, and P concentrations, stoichiometry, and selected soil physicochemical properties. Two-way ANOVA was adopted to examine the interactive effects of land use and slope position on the abovementioned soil variables. Pearson correlation analysis was used to coordinate the relationships between the C, N, and P concentration, stoichiometry, and selected soil physicochemical properties. A significance level of p < 0.05 was used to test mean separation among the treatments. All statistical analyses were implemented using SPSS 22.0 (IBM, Armonk, NY, USA). Figures, except Figure 1, were produced using Sigmaplot 12.5.

3. Results

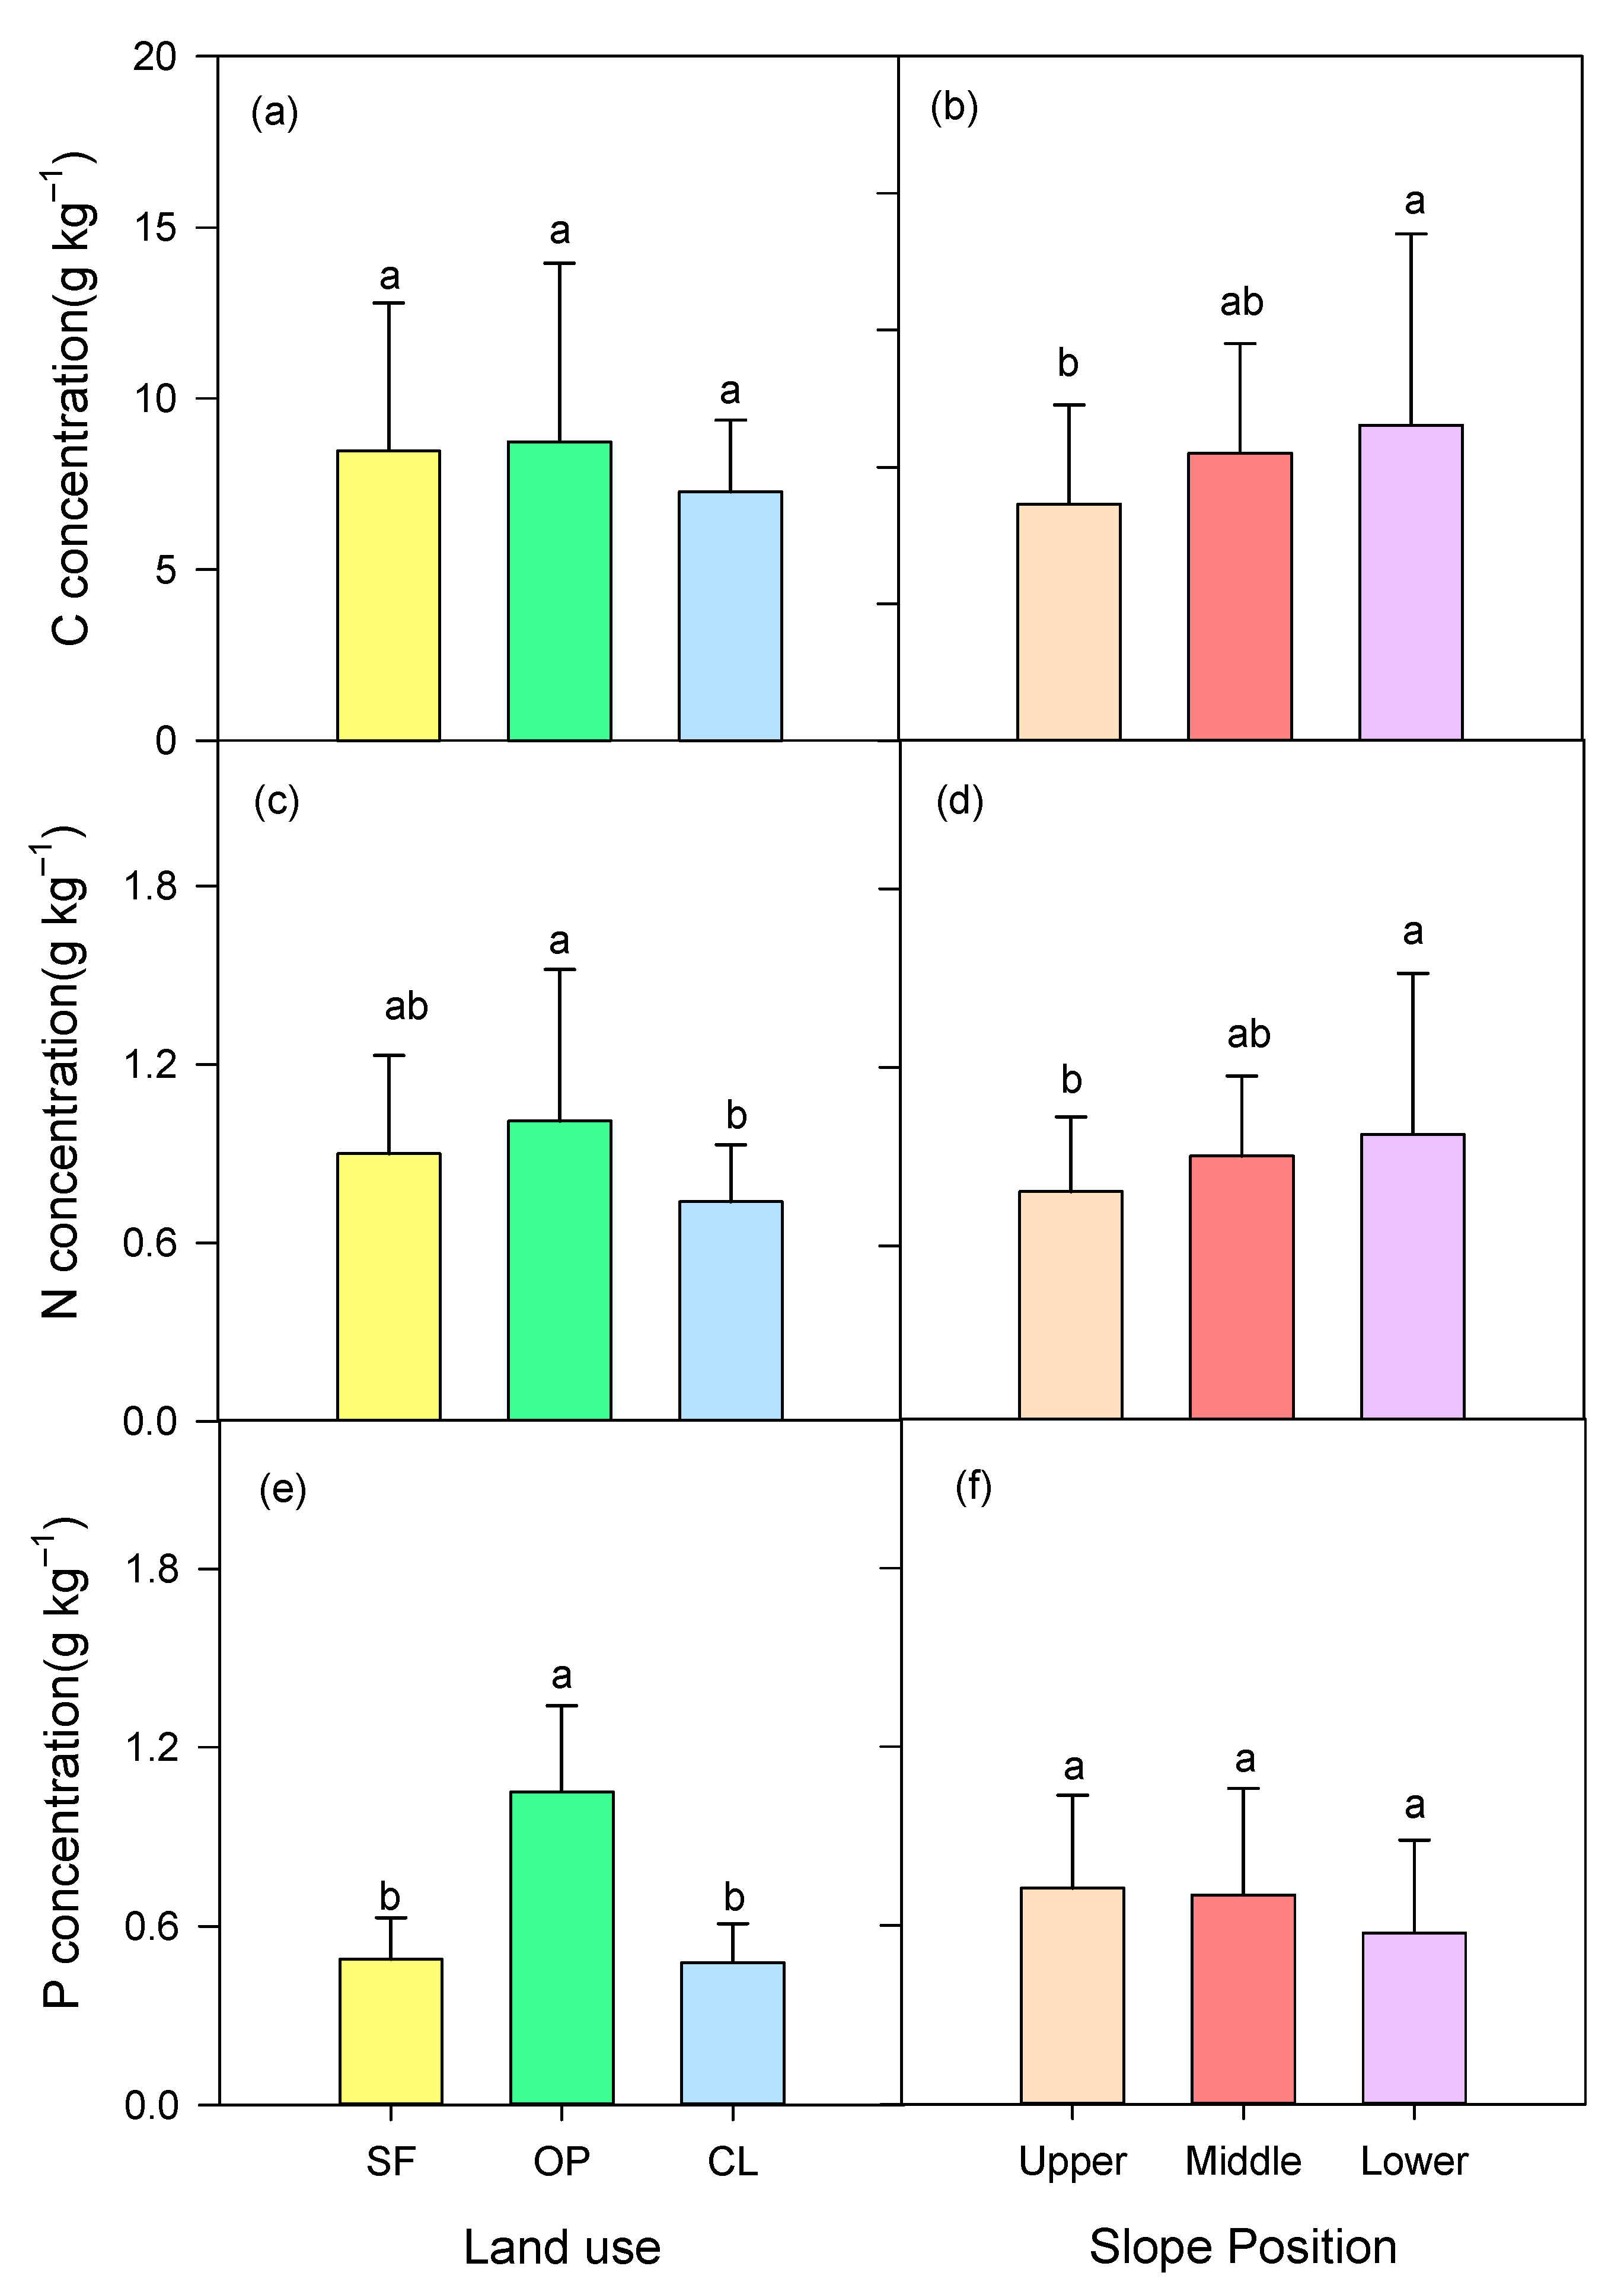
3.1. Soil C, N, and P Concentrations

Soil C concentrations were not significantly affected by land use (Figure 2a). Soil N concentration in OP was not significantly different from that in SF, but was significantly higher than that in CL (Figure 2c). Soil P concentration in SF was almost the same as that in CL, and they were both approximately 54% lower than that in OP (Figure 2e).
Soil C and N concentrations were both significantly higher on the lower slope than on the upper slope (Figure 2b,d), while soil P concentrations were not significantly affected by slope position (Figure 2f).
Soil C and N concentrations significantly diverged under the interaction of land use and slope position (Table 2). Soil P concentrations did not vary significantly under the interactions between land use and slope position (Table 2).

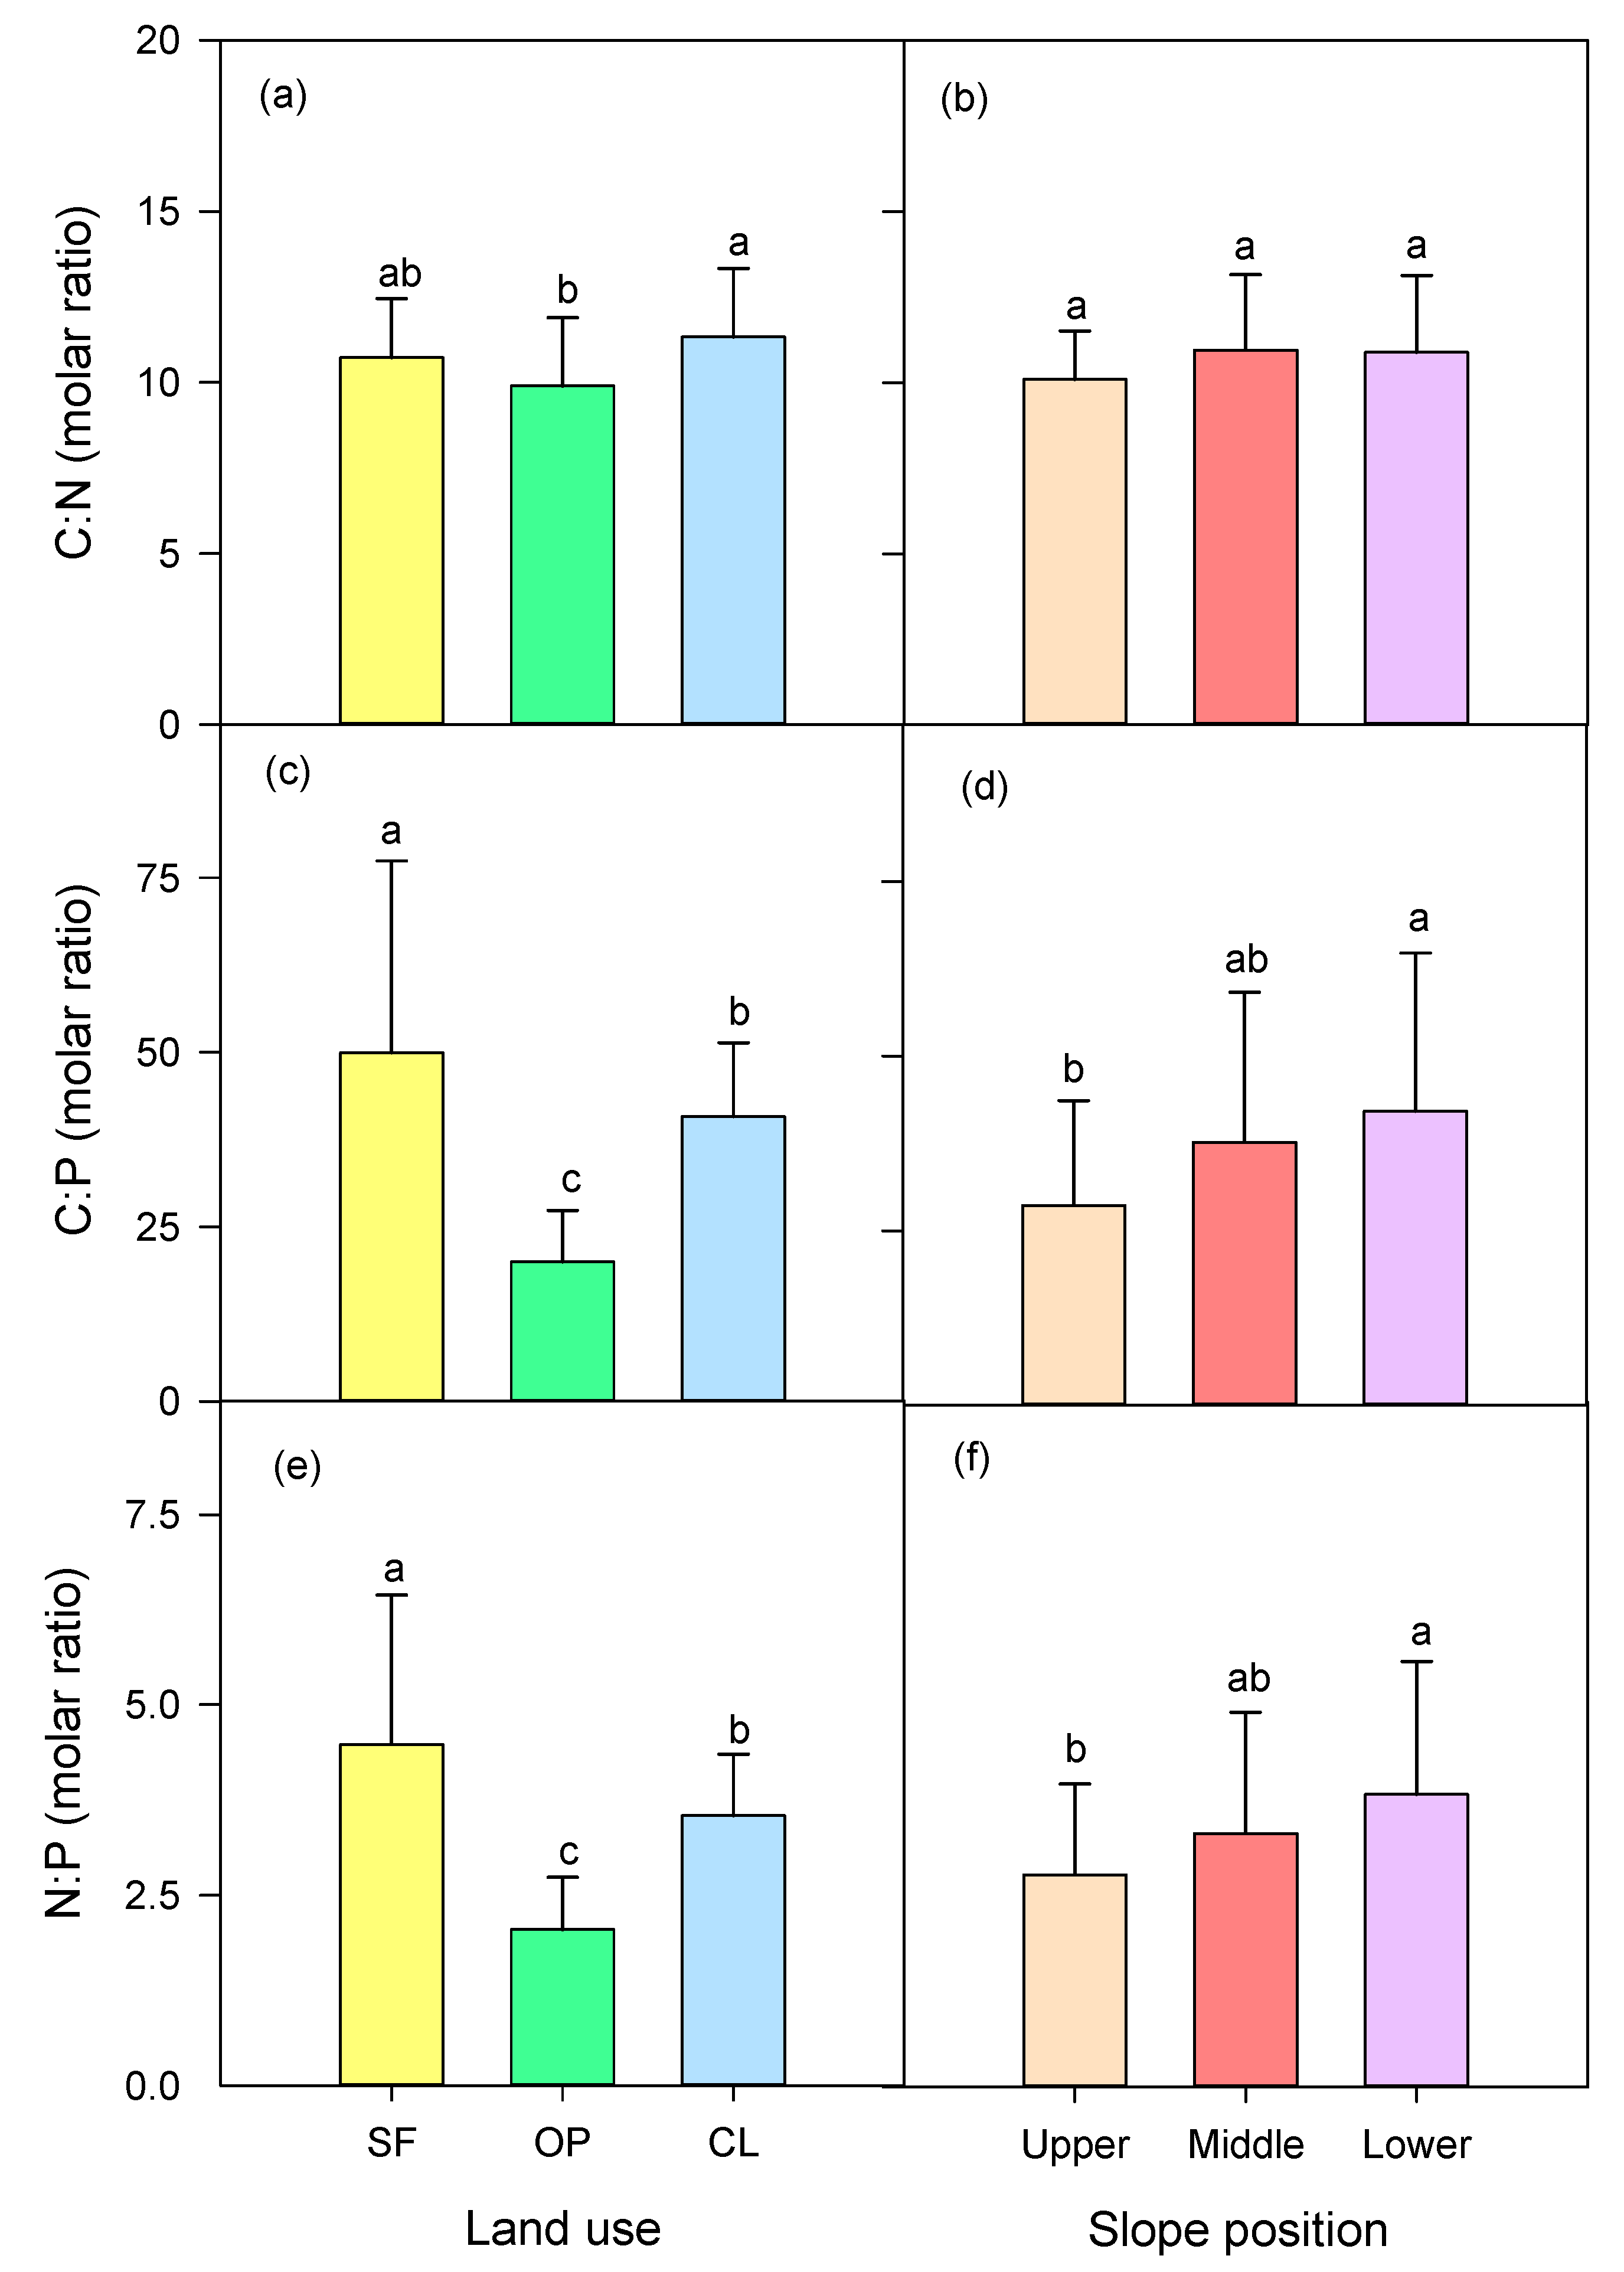
3.2. Soil C, N, and P Stoichiometry

Soil C:N ratio in CL was not significantly different from that in SF and was significantly higher than that in OP (Figure 3a). Soil C:P and N:P ratios were both significantly affected by land use, showing the same trends, which were the highest in SF, followed by CL, and the lowest in OP (Figure 3c,e).
Soil C:N ratio was not significantly affected by slope position (Figure 3b). In contrast, soil C:P and N:P ratios on lower slope did not differ from that on the middle slope, and were both markedly higher than on the upper slope (Figure 3d,f).
Soil C:N, C:P, and N:P ratios all differed by the interaction between land use and slope position (Table 2).

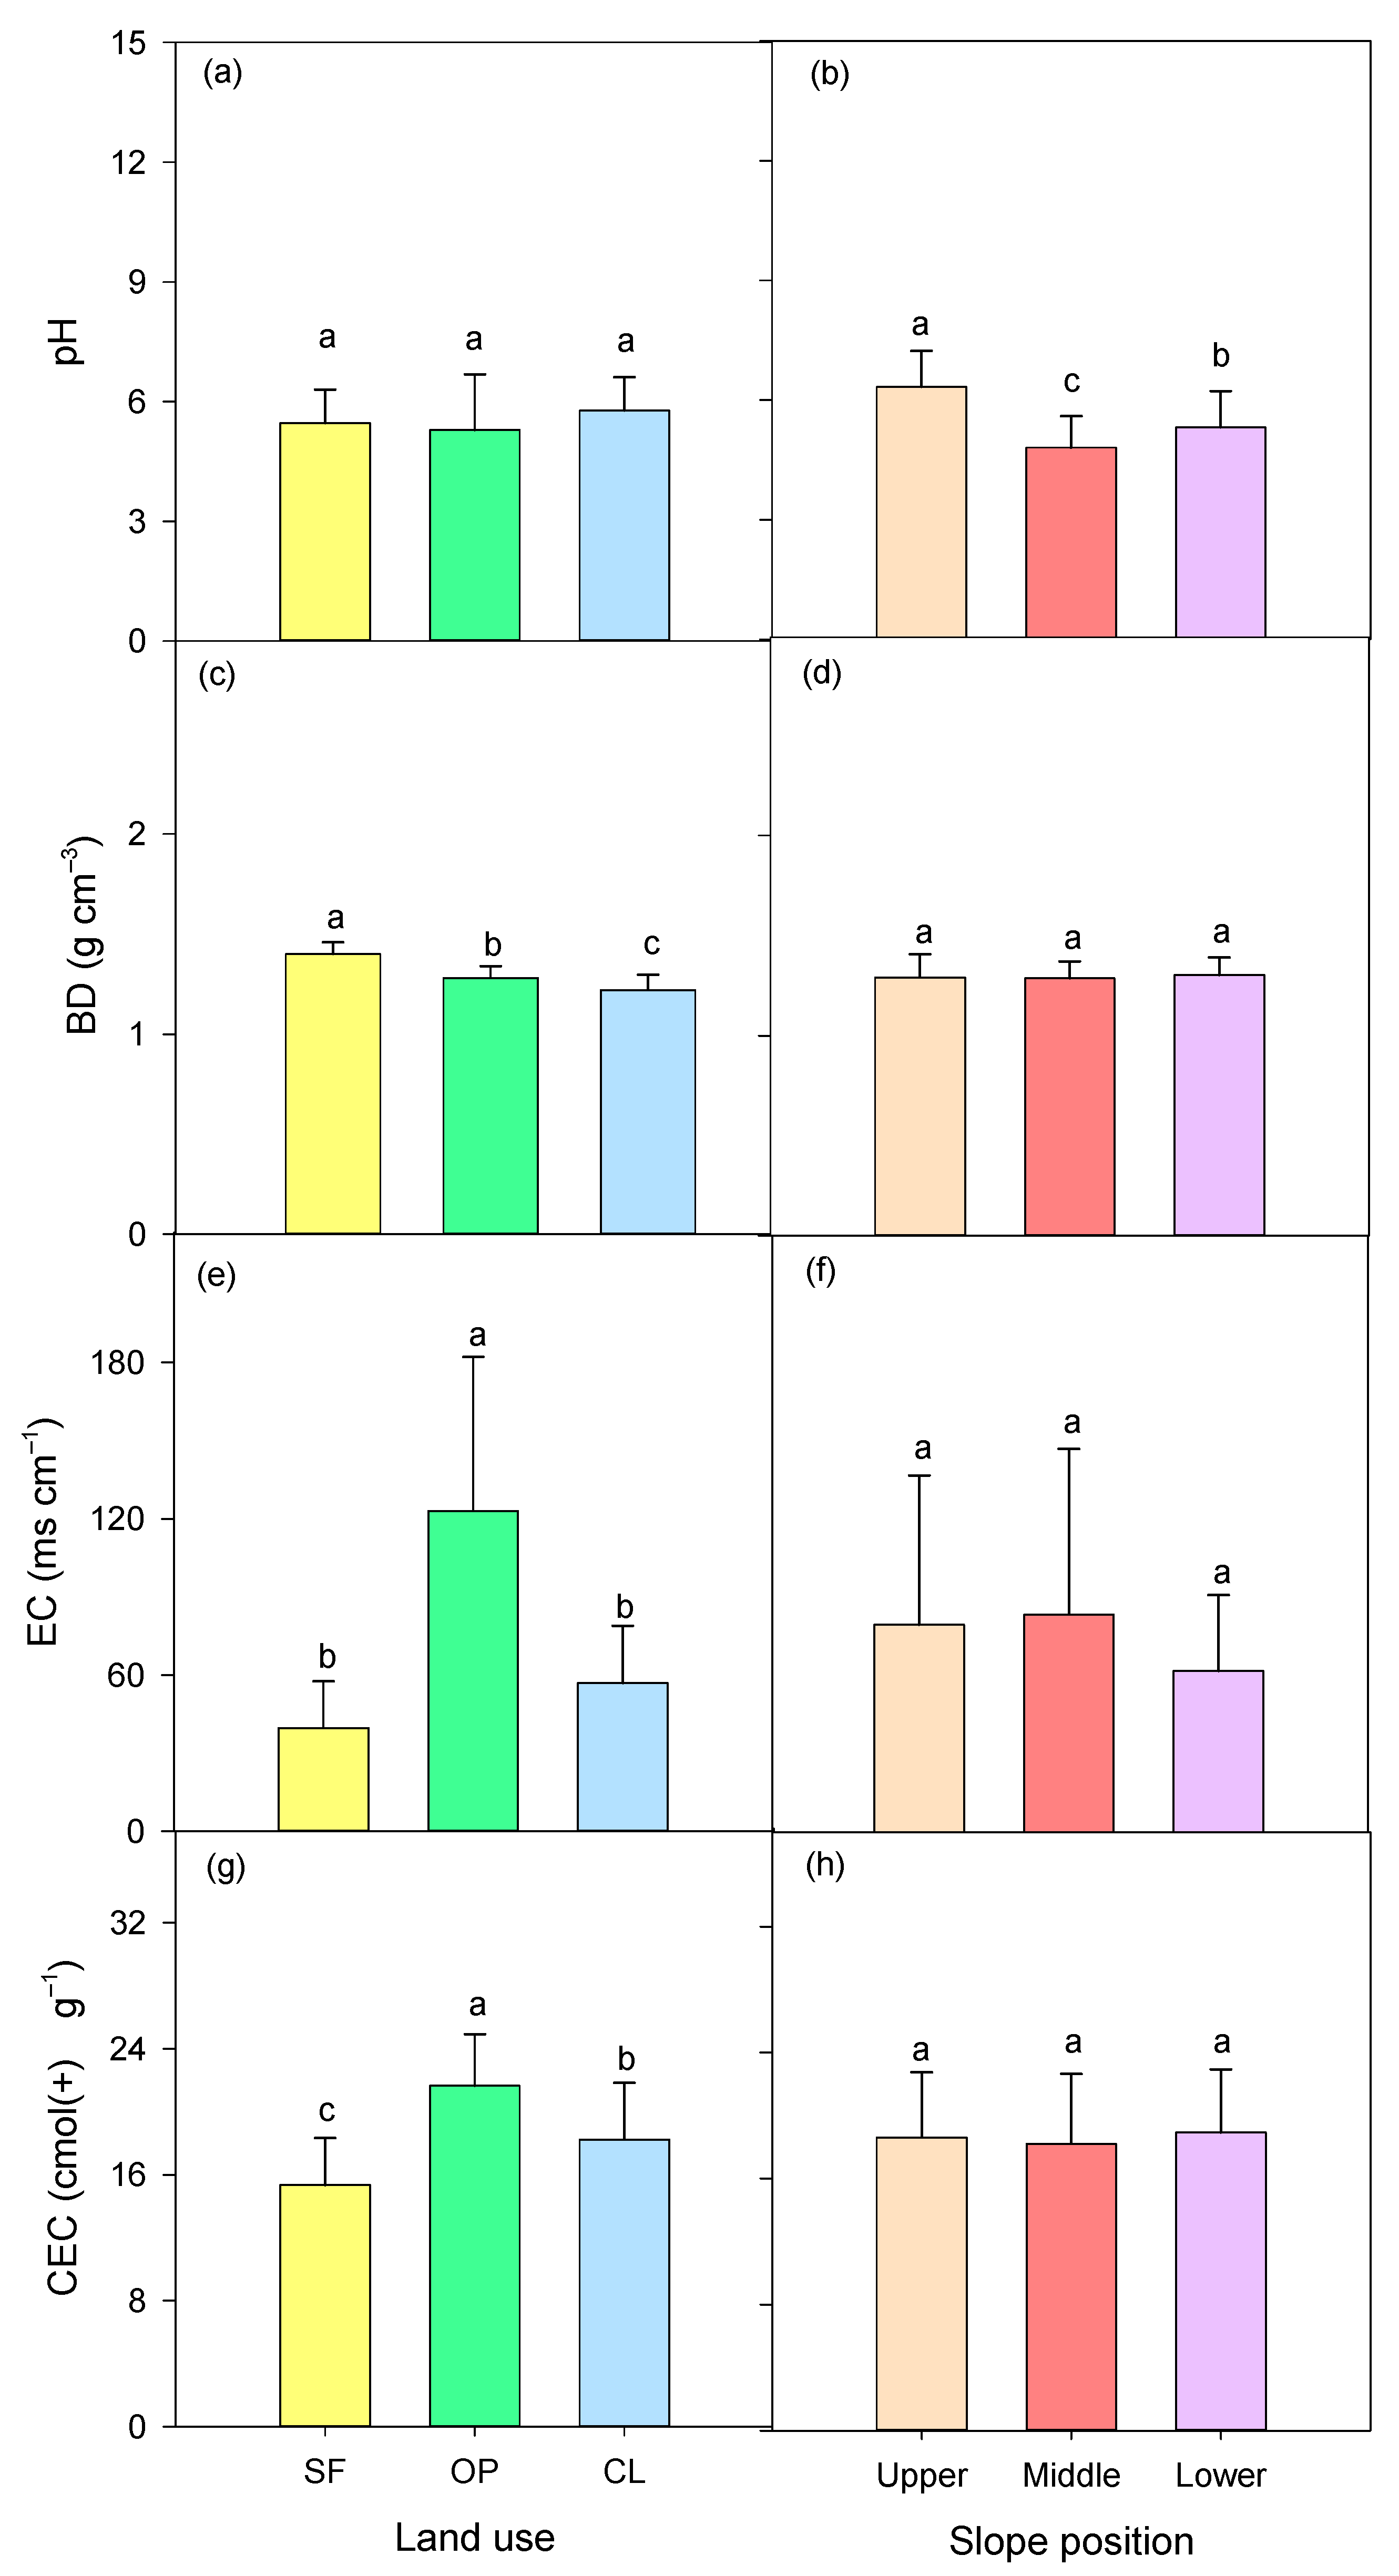
3.3. Selected Soil Physicochemical Properties

Soil pH was not significantly different among land uses (Figure 4a). Soil BD was the highest in SF, followed by that in OP, and was lowest in CL (Figure 4c). Soil EC was significantly higher in OP than in SF and CL (Figure 4e). Soil CEC was the highest in OP, followed by CL, and the lowest in SF (Figure 4f).
Slope position differed significantly in regard to soil pH (Figure 4b), and showed no significant impacts on soil BD, EC, and CEC (Figure 4d,f,h).

3.4. Relationships between Soil C, N, and P Traits and Selected Soil Physiochemical Properties

Soil C and N concentrations were both negatively correlated with pH and BD (Table 3). Soil N concentration was positively correlated with CEC. Soil P concentration was positively correlated with EC and CEC.
C:N ratio was negatively correlated with CEC, while C:P and N:P ratios were both significantly negatively correlated with EC and CEC (Table 3).
Soil C concentration had a significant positive relationship with N concentration, and C:P ratio showed significant positive relationships with C:N and N:P ratios (Table S1, Figure S1).

4. Discussion

4.1. Effects of Land Use and Slope Position on C, N, and P Concentrations

Our results showed that soil C concentrations were not significantly affected by land use, supporting previous findings [28,29,30]. This was probably attributed to the fact that fertilization likely enhanced the microbial activities and thus accelerated the decomposition of organic matters [31], resulting in the increase of C concentration in CL [32,33]. However, substantial litter, root exudates, and root litters could also enhance the accumulation of C materials in SF and OP [28,32,34]. Soil N concentration was significantly lowest in CL, and was not significantly different between SF and OP (Figure 2c). Although fertilization increased soil N in CL, severe soil erosion resulted from intensive rainfall and conventional tillage caused loss of soil N, which potentially weakened the fertilization effects in CL [35]. Soil P concentration was the highest in OP than in SF and CL (Figure 2e). This result was in good agreement with the findings given by Gao et al. [12], who found that soil P concentration was the highest in orchard than in forest and cropland in a subtropical region in southern China. The effects of litter, fertilization, soil erosion, and weathering of parent material collectively regulate the shifts in soil P [28,29,32,36]. The differences in soil P concentration as shown in this study implied that fertilization possibly played a dominant role in increasing soil P concentration in the OP rather than SF and CL in this study area.
Soil C and N concentrations both increased from the upper slope to the lower slope (Figure 2a,b). This was similar to previous studies [19]. Wei et al. [21] found that soil C and N concentrations were the highest in the upper slope, followed by the middle slope, and were lowest in the lower slope in Korshinsk peashrub land, which was due largely to soil erosion occurring in the different slope positions. Erosion redistributes the soil nutrient elements along the slope. Relatively more severe soil erosion occurring on the upper slope exposed the underlying soil layer with poor nutrient concentrations, and probably resulted in the gradual accumulations of nutrient elements along the slope direction, which meant that nutrient elements increased with the decreasing slope position [21,37,38]. In this study, similar mechanisms were related to the changes in soil C and N elements as a result of abundant rainfall and poor purple soil structure [39,40]. However, soil P concentration was not significantly different among the three slope positions, which was also reported in other previous findings [22]. This was attributable to the different cycling paths of P from soil C and N, which was also supported by the differences in soil C, N, and P concentrations in response to the interaction of land use and slope position. Essentially, phosphorous is the sedimentary mineral with relatively low mobility in the soil, and is not only affected by erosion, weathering of parent material, and plant uptake, but also by intensified human activities, such as tillage and fertilization [36]. The marginal changes in soil P concentration among different slope positions suggested that soil P concentrations in the hillslope had a low spatial variability [41], and that there was weak erosion potential in SF and a counteraction between erosion and fertilization in OP and CL in this study area [29].

4.2. Effects of Land Use and Slope Position on C, N, and P Stoichiometry

Soil C:N:P ratio differed among the three land uses, which was consistent with previous studies [12,42]. Soil C:N ratio in CL was not significantly different from that in SF, and was significantly higher than that in OP (Figure 3a). This was probably caused by the proportional shifts in C and N concentrations as a consequence of the synchronous nutrient decomposition by microorganisms [43]. Soil microbes destroy the carbon skeleton of the organic materials and then release the nitrogen to the external environment, resulting in the close linkages between C and N elements [44]. The proportional shifts in C and N may also be explained by the changes in soil C:P and N:P ratios, which were pronouncedly lower in the OP and CL than that in SF in this study (Figure 3c,e). Soil P originated from the organic P decomposition of litter and the weathering of parent material in SF [8,12,22], while fertilization remarkably increased the P concentration in OP and CL. This resulted in significant differences in C:P and N:P ratios in those three land uses [6].
Soil C:N was not affected significantly by slope position (Figure 3b). This result was supported by the findings given by Li et al. [41] who found that soil C:N ratio had no significant change with slope position. Soil C and N concentrations always showed close relationships between the upper slope to the lower slope [45,46], indicating the low spatial variability of soil C:N ratio in the study hillslope. Soil C:P and N:P ratios had the same trends, presenting significant increases from the upper slope to the lower slope. This was ascribed to the collective effects of the significant differences in C and N concentrations but slight differences in soil P concentration along the slope direction. The distinct responses of soil C:N, C:P, and N:P ratios to slope position supported the different cycling pathways of C, N, and P elements, and suggested the decoupling of linkages between soil P and C as well as N [36].
Soil N:P is commonly adopted to determine the nutrient saturation and/or limitation of nitrogen and phosphorus in the soil ecosystems [47,48]. In this study, our results showed that the N:P ratio averaged three slope positions in each land use (4.48 in SF, 2.05 in OP, 3.55 in CL) and was always lower than the Chinese average (9.30) [49] and the global average (13.1) [50]. This result was in good agreement with the findings from Li et al. [28] who reported that average N:P ratio was 2.81 in the 0–10 cm soil depth in the tree-cropping systems in the purple soil hillslope, China. This was likely due to fertilization unbalancing the N and P interaction, and remarkably increasing soil P in OP and CL. Although the N:P ratio was jointly affected by land use and slope position, the lower average N:P ratio, calculated from three land uses and three slope positions in comparison to the Chinese average, implied the potential occurrences of N limitation in the study area, which had been widely reported in other studies [11,18].

4.3. Selected Physicochemical Properties and Their Linkages with C, N, and P Traits in Response to Different Land Uses

Soil pH was significantly affected by slope position but not by land use (Figure 4a,b), and presented an acidic nature resulting from the high weather and leaching in the purple soil hillslope [51]. This may have significantly affected the soil C and N concentrations because of the close relationships between pH and C and N concentrations. The changed trends in pH were also supported by the previous studies [52,53]. Soil BD, EC, and CEC were significantly affected by land use, but not by the slope position (Figure 3c–h). Tellen and Yerima [54] found that cropland reduced CEC, but increased BD and EC relative to forest land in the North West Region of Cameroon. Seifu et al. [55] also found that the soil EC in plantation forest was higher than that in cultivated land. Similarly, in this study, soil BD in SF was significantly higher than in OP and CL, due largely to the relatively less soil disturbance in SF relative to the human activities (i.e., fertilization and cultivation) in OP and CL, resulting in highly compacted soil [56]. This result was also supported by the significant relationships between soil BD and C and N concentrations, which were found in other studies [52,57]. The highest EC was determined in OP, which was in line with the findings of Samani et al. [58], probably owing to the decomposition of litter and chemical fertilizer that produced amounts of soluble ions in soils and raised the EC level in the OP [58]. This also explained the significantly higher soil CEC in OP. Although soil CEC did not vary markedly with the slope position, the values of CEC in this study area fell well in the range of very high classifications shown by Adepetu et al. [59]. The acidic soil with low pH value suggested high activity of iron and aluminum, which can form insoluable iron-P and aluminum-P [60], which also led to the significant relationships between EC and P concentrations and its relevant ratios, and also between CEC and those P relevant variables.

4.4. Implications

Our results suggest that the changes of soil C, N, and P concentrations were not consistent among three land uses and three positions in this study. This indicated that there was a decoupling relationship between soil C, N, and P. The decomposition of organic materials simultaneously released soil C and N, and resulted in close relationships between C and N [43,45], while the biogeochemical cycle of soil P is primordially different from soil C and N as a result of the interaction of litter, fertilization, soil erosion, and weathering of parent material. Furthermore, P is a sedimentary mineral with low mobility in the soil, and the variation and migration were thus not synchronized with those of soil C and N [28,29]. This probably resulted in the decoupling of the links between soil C, N, and P. In this study, P was decoupled from C and N, which explained the distinct responses of soil C:N:P ratios to land use and slope position. The irrational fertilization with the aim of obtaining high economic benefits was likely responsible for the higher P concentrations in OP. This increases the concerns of the potential occurrences of non-point source pollution in the study area [61]. More attention should be paid to the balances of nutrient elements and the effects on the control of non-point source pollution in the TGRA.

5. Conclusions

The effects of different land uses and slope positions on soil C, N, and P concentrations and their stoichiometry were determined in a fragile purple soil hillslope ecosystem in the TGRA. Land use did not affect soil C concentration and pH, but significantly differed in soil N and P concentrations, C:N, C:P, and N:P ratios and soil BD, EC, and CEC. In contrast, slope position only significantly affected soil C and N concentrations, C:P and N:P ratios, and pH. There were significant interactive effects of land use and slope position on the study soil variables, except for soil P concentration and soil CEC. Soil C, N, and P concentrations and stoichiometry overall show specifically close relationships with soil pH, BD, EC, and CEC. The results also suggest that N limitation potentially occurred in the study area due to the lower average N:P ratio relative to the Chinese average. This study indicates that soil P decoupled with soil C and N cycling due largely to severe soil erosion and overuse of fertilization. Our results will provide valuable information for understanding the soil C, N, and P biogeochemical cycling and for controlling non-point source pollution in the TGRA and other fragile terrestrial ecosystems with similar conditions worldwide.

Supplementary Materials

The following are available online at https://www.mdpi.com/article/10.3390/su13179845/s1. Table S1: Pearson correlations between C, N, P concentrations and their stoichiometric ratios. Figure S1: Regression analysis showing the relationships between C, N, P concentrations and their stoichiometric ratios. (a) C versus N, (b) C versus P, (c) N versus P, (d) C:N versus C:P, (e) C:N versus N:P, (f) C:P versus N:P.

Author Contributions

Conceptualization, B.H.; methodology, M.F.; software, M.F.; validation, B.H. and T.L.; formal analysis, T.L. and M.F.; investigation, M.F., K.L., P.X. and Y.B.; resources, B.H.; data curation, M.F. and D.Z.; writing—original draft preparation, M.F.; writing—review and editing, T.L.; visualization, D.Z., D.L. and Y.H.; supervision, B.H.; project administration, B.H.; funding acquisition, B.H. All authors have read and agreed to the published version of the manuscript.

Funding

This study was funded by the Chongqing Science and Technology Commission (cstc2018jscx-mszdX0055), National Natural Science Foundation of China (U20A20326), and the State Cultivation Base of Eco-agriculture for Southwest Mountainous Land, Southwest University.

Institutional Review Board Statement

Not applicable.

Informed Consent Statement

Not applicable.

Data Availability Statement

This study did not report any data.

Acknowledgments

We thank Cheng Zeng, Xinmei, Zhao, and Rongchang Zeng for their help in field sampling and laboratory work.

Conflicts of Interest

The authors declare no conflict of interest.

References

  1. Thapa, M.; Li, T.Y.; He, B.H.; Zhang, L. Soil C, N, and P stoichiometry in response to different land uses in an agroforestry hillslope of Southwest China. Arch. Agron. Soil Sci. 2021, in press. [Google Scholar]
  2. Sterner, R.W.; Elser, J.J. Ecological Stoichiometry: The Biology of Elements from Molecules to the Biosphere; Princenton University Press: Princenton, NJ, USA, 2002; Volume 423, pp. 225–226. [Google Scholar]
  3. Falkengren-Gerup, U.; ten Brink, D.J.; Brunet, J. Land use effects on soil N, P, C and pH persist over 40–80 years of forest growth on agricultural soils. For. Ecol. Manag. 2006, 225, 74–81. [Google Scholar] [CrossRef]
  4. Hobley, E.; Wilson, B.; Wilkie, A.; Gray, J.; Koen, T. Drivers of soil organic carbon storage and vertical distribution in Eastern Australia. Plant Soil 2015, 390, 111–127. [Google Scholar] [CrossRef]
  5. Zhao, M.Y.; Zhao, W.W.; Zhong, L.N. The Scale effect of the influence of land use and environmental factors on surface soil carbon: A case study in the hilly and gully area of Northern Shaanxi Province. Acta Ecol. Sin. 2014, 35, 1105–1113, (In Chinese with Abstract in English). [Google Scholar]
  6. Zheng, S.M.; Xia, Y.H.; Hu, Y.J.; Chen, X.B.; Rui, Y.C.; Gunina, A.; He, X.Y.; Ge, T.D.; Wu, J.S.; Su, Y.R.; et al. Stoichiometry of carbon, nitrogen, and phosphorus in soil: Effects of agricultural land use and climate at a continental scale. Soil Tillage Res. 2020, 209, 104903. [Google Scholar] [CrossRef]
  7. Baddeley, J.A.; Edwards, A.C.; Watson, C.A. Changes in soil C and N stocks and C:N stoichiometry 21 years after land use change on an arable mineral topsoil. Geoderma 2017, 303, 19–26. [Google Scholar] [CrossRef]
  8. Agren, G.I. Stoichiometry and nutrition of plant growth in natural communities. Annu. Rev. Ecol. Evol. Syst. 2008, 39, 153–170. [Google Scholar] [CrossRef]
  9. Wang, W.; Sardans, J.; Zeng, C.; Zhong, C.; Li, Y.; Penuelas, J. Responses of soil nutrient concentrations and stoichiometry to different human land uses in a subtropical tidal wetland. Geoderma 2014, 232, 459–470. [Google Scholar] [CrossRef] [Green Version]
  10. Bing, H.J.; Wu, Y.H.; Zhou, J.; Sun, H.Y.; Luo, J.; Wang, J.P.; Yu, D. Stoichiometric variation of carbon, nitrogen, and phosphorus in soils and its implication for nutrient limitation in alpine ecosystem of Eastern Tibetan Plateau. J. Soils Sediments 2016, 16, 405–416. [Google Scholar] [CrossRef]
  11. Liu, X.; Ma, J.; Ma, Z.W.; Li, L.H. Soil nutrient contents and stoichiometry as affected by land use in an agro-pastoral region of northwest China. Catena 2017, 150, 146–153. [Google Scholar] [CrossRef]
  12. Gao, Y.; He, N.P.; Yu, G.R.; Chen, W.L.; Wang, Q.F. Long-term effects of different land use types on C, N, and P stoichiometry and storage in sub-tropical ecosystems: A case study in China. Ecol. Eng. 2014, 67, 171–181. [Google Scholar] [CrossRef]
  13. Liu, X.Y.; Peñuelas, J.; Sardans, J.; Fang, Y.Y.; Wiesmeier, M.; Wu, L.Q.; Chen, X.X.; Chen, Y.Y.; Jin, Q.; Wang, W.Q. Response of soil nutrient concentrations and stoichiometry, and greenhouse gas carbon emissions linked to change in land-use of paddy fields in China. Catena 2021, 203, 105326. [Google Scholar] [CrossRef]
  14. Li, S.Q.; Zheng, X.H.; Liu, C.Y.; Yao, Z.S.; Zhang, W.; Han, S.H. Influences of observation method, season, soil depth, land use and management practice on soil dissolvable organic carbon concentrations: A meta-analysis. Sci. Total Environ. 2018, 631–632, 105–114. [Google Scholar] [CrossRef] [PubMed]
  15. Meena, V.S.; Mondal, T.; Pandey, B.M.; Mukherjee, A.; Yadav, R.P.; Choudhary, M.; Singh, S.; Bisht, J.K.; Pattanayak, A. Land use changes: Strategies to improve soil carbon and nitrogen storage pattern in the mid-Himalaya ecosystem, India. Geoderma 2018, 321, 69–78. [Google Scholar] [CrossRef]
  16. Liu, S.J.; Zhang, W.; Wang, K.L.; Pan, F.J.; Yang, S.; Shu, S.Y. Factors controlling accumulation of soil organic carbon along vegetation succession in a typical karst region in Southwest China. Sci. Total Environ. 2015, 521, 52–58. [Google Scholar] [CrossRef]
  17. Elser, J.J.; Fagan, W.F.; Denno, R.F.; Dobberfuhl, D.R.; Folarin, A.; Huberty, A.; Interlandi, S.; Kilham, S.S.; McCauley, E.; Schulz, K.L.; et al. Nutritional constraints in terrestrial and freshwater food webs. Nature 2000, 408, 578–580. [Google Scholar] [CrossRef]
  18. Xu, X.F.; Thornton, P.E.; Post, W.M. A global analysis of soil microbial biomass carbon, nitrogen and phosphorus in terrestrial ecosystems. Glob. Ecol. Biogeogr. 2013, 22, 737–749. [Google Scholar] [CrossRef]
  19. Yu, H.Y.; Zha, T.G.; Zhang, X.X.; Nie, L.S.; Ma, L.M.; Pan, Y.W. Spatial distribution of soil organic carbon may be predominantly regulated by topography in a small revegetated watershed. Catena 2020, 188, 104459. [Google Scholar] [CrossRef]
  20. Wang, S.; Feng, X.J.; Wang, Y.D.; Zheng, Z.C.; Li, T.X.; He, S.Q.; Zhang, X.Z.; Yu, H.Y.; Huang, H.G.; Liu, T.; et al. Characteristics of nitrogen loss in sloping farmland with purple soil in southwestern China during maize (Zea mays L.) growth stages. Catena 2019, 182, 104169. [Google Scholar] [CrossRef]
  21. Wei, X.R.; Shao, M.G.; Fu, X.L.; Horton, R. Changes in soil organic carbon and total nitrogen after 28 years grassland afforestation: Effects of tree species, slope position, and soil order. Plant Soil 2010, 331, 165–179. [Google Scholar] [CrossRef]
  22. Sigua, G.C.; Coleman, S.W.; Albano, J.; Williams, M. Spatial distribution of soil phosphorus and herbage mass in beef cattle pastures: Effects of slope aspect and slope position. Nutr. Cycl. Agroecosystems 2011, 89, 59–70. [Google Scholar] [CrossRef]
  23. Jia, H.Y.; Lei, A.; Lei, J.S.; Ye, M.; Zhao, J.Z. Effects of hydrological processes on nitrogen loss in purple soil. Agric. Ecosyst. Environ. 2007, 89, 89–97. [Google Scholar] [CrossRef]
  24. Deng, C.C. Fractal characteristics and influencing factors of land use spatial pattern in the hilly region of central Sichuan. J. China West Norm. Univ. 2015, 36, 156–162+178, (In Chinese with Abstract in English). [Google Scholar]
  25. Hua, L.L.; Li, W.C.; Zhai, L.M.; Yen, H.; Lei, Q.L.; Liu, H.B.; Ren, T.Z.; Xia, Y.; Zhang, F.L.; Fan, X.P. An innovative approach to identifying agricultural pollution sources and loads by using nutrient export coefficients in watershed modeling. J. Hydrol. 2019, 571, 322–331. [Google Scholar] [CrossRef]
  26. Lin, D.Y. Soil Science; China Forestry Publishing House: Beijing, China, 2002. (In Chinese) [Google Scholar]
  27. Institute of Soil Sciences, Chinese Academy of Sciences (ISSCAS). Physical and Chemical Analysis Methods of Soils; Shanghai Science Technology Press: Shanghai, China, 1978. (In Chinese) [Google Scholar]
  28. Li, T.Y.; Wang, C.Y.; He, B.H.; Liang, C.; Zhang, Y.; Zhang, Y.Q. Soil nutrient concentrations and stoichiometry under different tree-cropping systems in a purple hillslope in southwestern China. Arch. Agron. Soil Sci. 2019, 65, 741–754. [Google Scholar] [CrossRef]
  29. Xu, H.W.; Qu, Q.; Li, P.; Guo, Z.Q.; Wulan, E.; Xue, S. Stocks and stoichiometry of soil organic carbon, total nitrogen, and total phosphorus after vegetation restoration in the Loess Hilly Region, China. Forests 2019, 10, 27. [Google Scholar] [CrossRef] [Green Version]
  30. Guo, J.; Wang, B.; Wang, G.B.; Wu, Y.Q.; Cao, F.L. Afforestation and agroforestry enhance soil nutrient status and carbon sequestration capacity in eastern China. Land Degrad. Dev. 2019, 31, 392–403. [Google Scholar] [CrossRef]
  31. Van der Heijden, M.G.A.; Klironomos, J.N.; Ursic, M.; Moutoglis, P.; Streitwolf-Engel, R.; Boller, T.; Wiemken, A.; Sanders, I.R. Mycorrhizal fungal diversity deter-mines plant biodiversity, ecosystem variability and productivity. Nature 1998, 396, 69–72. [Google Scholar] [CrossRef]
  32. Udawatta, R.P.; Kremer, R.J.; Nelson, K.A.; Jose, S.; Bardhan, S. Soil quality of a mature alley cropping agroforestry system in temperate North America. Commun. Soil Sci. Plant Anal. 2014, 45, 2539–2551. [Google Scholar] [CrossRef]
  33. Yang, Y.H.; Luo, Y.Q. Carbon:nitrogen stoichiometry in forest ecosystems during stand development. Glob. Ecol. Biogeogr. 2011, 20, 354–361. [Google Scholar] [CrossRef]
  34. Garcia-Pausas, J.; Casals, P.; Rovira, P.; Vallecillo, S.; Sebastia, M.T.; Romanya, J. Decomposition of labelled roots and root-C and -N allocation between soil fractions in mountain grasslands. Soil Biol. Biochem. 2012, 49, 61–69. [Google Scholar] [CrossRef]
  35. Martinez-Mena, M.; Carrillo-Lopez, E.; Boix-Fayos, C.; Almagro, M.; Garcia Franco, N.; Diaz-Pereira, E.; Montoya, I.; de Vente, J. Long-term effectiveness of sustainable land management practices to control runoff, soil erosion, and nutrient loss and the role of rainfall intensity in Mediterranean rainfed agroecosystems. Catena 2020, 187, 104352. [Google Scholar] [CrossRef]
  36. Cheng, Y.T.; Li, P.; Xu, G.C.; Li, Z.B.; Cheng, S.D.; Gao, H. Spatial distribution of soil total phosphorus in Yingwugou watershed of the Dan River, China. Catena 2016, 136, 175–181. [Google Scholar] [CrossRef]
  37. Zhang, J.H.; Quine, T.A.; Ni, S.J.; Ge, F.L. Stocks and dynamics of SOC in relation to soil redistribution by water and tillage erosion. Glob. Change Biol. 2006, 12, 1834–1841. [Google Scholar] [CrossRef]
  38. Nan, Y.F.; Guo, S.L.; Zhang, Y.J.; Li, J.C.; Zhou, X.G.; Li, Z.; Zhang, F.; Zou, J.L. Effects of slope aspect and position on soil organic carbon and nitrogen of terraces in small watershed. J. Plant Nutr. Fertil. 2012, 18, 595–601. (In Chinese) [Google Scholar]
  39. Jannes, S.; Shi, X.Z.; Ritsema, C.J. Introduction: Soil erosion and nutrient losses in the hilly purple soil area in china. Soil Tillage Res. 2009, 105, 283–284. [Google Scholar]
  40. Su, Z.; Zhang, J.; Nie, X.J. Response of spatial variability of soil physical properties to soil erosion in purple soil slope farmland. Trans. Case 2009, 25, 54–60, (In Chinese with Abstract in English). [Google Scholar]
  41. Li, L.; Wang, M.G.J.; Zhou, G.X.; Zhao, Y.; Zhang, Y. Temporal and spatial characteristics of soil C:N:P ecological stoichiometry under Phoebe zhennan plantation of Huitong. J. Cent. South Univ. Tech. 2016, 36, 96–109, (In Chinese with Abstract in English). [Google Scholar]
  42. Wang, Z.C.; He, G.X.; Hou, Z.H.; Luo, Z.; Chen, S.X.; Lu, J.; Zhao, J. Soil C:N:P stoichiometry of typical coniferous (Cunninghamia lanceolata) and/or evergreen broadleaved (Phoebe bournei) plantations in south China. For. Ecol. Manag. 2021, 486, 118974. [Google Scholar] [CrossRef]
  43. Li, D.J.; Wen, L.; Zhang, W.; Yang, L.Q.; Xiao, K.C.; Chen, H.; Wang, K.L. Afforestation effects on soil organic carbon and nitrogen pools modulated by lithology. For. Ecol. Manag. 2017, 400, 85–92. [Google Scholar] [CrossRef]
  44. Olander, L.P.; Vitousek, P.M. Regulation of soil phosphatase and chitinase activity by N and P availability. Biogeochemistry 2000, 49, 175–190. [Google Scholar] [CrossRef]
  45. Wang, D.; Yi, W.B.; Zhou, Y.L.; He, S.R.; Tang, L.; Yin, X.H.; Zhao, P.; Long, G.Q. Intercropping and N application enhance soil dissolved organic carbon concentration with complicated chemical composition. Soil Tillage Res. 2021, 210, 104979. [Google Scholar] [CrossRef]
  46. Shi, P.; Duan, J.X.; Zhang, Y.; Li, P.; Wang, X.K.; Li, Z.B.; Lie, X.; Xu, G.C.; Lu, K.X.; Cheng, S.D.; et al. The effects of ecological construction and topography on soil organic carbon and total nitrogen in the Loess Plateau of China. Environ. Earth Sci. 2019, 78, 5. [Google Scholar] [CrossRef]
  47. Jiang, L.; He, Z.S.; Liu, J.F.; Xing, C.; Gu, X.G.; Wei, C.S.; Zhu, J.; Wang, X.L. Elevation gradient altered soil C, N, and P stoichiometry of Pinus taiwanensis forest on Daiyun Mountain. Forests 2019, 10, 1089. [Google Scholar] [CrossRef] [Green Version]
  48. Hui, D.F.; Yang, X.T.; Deng, Q.; Liu, Q.; Xu, W.; Yang, H.; Ren, H. Soil C:N:P stoichiometry in tropical forests on Hainan island of China: Spatial and vertical variations. Catena 2021, 201, 105228. [Google Scholar] [CrossRef]
  49. Tian, H.Q.; Chen, G.S.; Zhang, C.; Melillo, J.M.; Hall, C.A.S. Pattern and variation of C:N:P ratios in China’s soils: A synthesis of observational data. Biogeochemistry 2010, 98, 139–151. [Google Scholar] [CrossRef]
  50. Cleveland, C.C.; Liptzin, D. C:N:P stoichiometry in soil: Is there a “Redfield ratio” for the microbial biomass? Biogeochemistry 2007, 85, 235–252. [Google Scholar] [CrossRef]
  51. Akinde, B.P.; Olakayode, A.O.; Oyedele, D.J.; Tijani, F.O. Selected physical and chemical properties of soil under different agricultural land-use types in Ile-Ife. Nigeria. Heliyon 2020, 6, e05090. [Google Scholar] [CrossRef]
  52. Wang, W.Q.; Wang, C.; Sardans, J.; Min, Q.W.; Zeng, C.S.; Tong, C.; Penuelas, J. Agricultural land use decouples soil nutrient cycles in a subtropical riparian wetland in China. Catena 2015, 133, 171–178. [Google Scholar] [CrossRef]
  53. Karak, T.; Paul, R.K.; Boruah, R.K.; Sonar, I.; Bordoloi, B.; Dutta, A.K.; Borkotoky, B. Major soil chemical properties of the major tea-growing areas in India. Pedosphere 2015, 25, 316–328. [Google Scholar] [CrossRef]
  54. Tellen, V.A.; Yerima, B.P.K. Effects of land use change on soil physicochemical properties in selected areas in the North West region of Cameroon. Environ. Syst. Res. 2018, 7, 1–29. [Google Scholar]
  55. Seifu, W.; Elias, E.; Gebresamuel, G. The Effects of Land Use and Landscape Position on Soil Physicochemical Properties in a Semiarid Watershed, Northern Ethiopia. Appl. Environ. Soil Sci. 2020, 2020, 8816248. [Google Scholar] [CrossRef]
  56. da Silva, J.V.C.D.; Hirschfeld, M.N.C.; Cares, J.E.; Esteves, A.M. Land use, soil properties and climate variables influence the nematode communities in the Caatinga dry forest. Appl. Soil Ecol. 2020, 150, 103474. [Google Scholar] [CrossRef]
  57. Li, T.Y.; Zeng, J.M.; He, B.H.; Chen, Z.P. Changes in soil C, N, and P concentrations and stoichiometry in Karst Trough Valley Area under ecological restoration: The role of slope aspect, land use, and soil depth. Forests 2021, 12, 144. [Google Scholar] [CrossRef]
  58. Samani, K.M.; Pordel, N.; Hosseini, V.; Shakeri, Z. Effect of land-use changes on chemical and physical properties of soil in western Iran (Zagros oak forests). J. For. Res. 2020, 31, 637–647. [Google Scholar] [CrossRef]
  59. Adepetu, J.A.; Adetunji, M.T.; Ige, D.V. Soil Fertility and Crop Nutrition; Jumak Nigeria Limited: Ibadan, Nigeria, 2014; pp. 108–439. [Google Scholar]
  60. Su, L.; Zhang, Y.S.; Lin, X.Y. Changes of iron form and phosphorus adsorption and desorption in paddy soil during alternation of wetting and drying. Plant Nutr. Fertil. Sci. 2001, 7, 410–415. [Google Scholar]
  61. Shen, Z.Y.; Hong, Q.; Yu, H.; Niu, J.F. Parameter uncertainty analysis of non-point source pollution from different land use types. Sci. Total Environ. 2010, 408, 1971–1978. [Google Scholar] [CrossRef]
Figure 1. Map showing the distributions of the sampling sites and different land uses. SF, secondary forest; OP, orchard plantation; CL, cropland.
Sustainability 13 09845 g001
Figure 2. Soil C (a,b), N (c,d), and P (e,f) concentrations affected by land use and slope position, respectively. Error bars represent the standard deviation of means. Different lowercase letters denote significant differences among land use and slope position, respectively. SF, secondary forest; OP, orchard plantation; CL, cropland.
Sustainability 13 09845 g002
Figure 3. Soil C:N (a,b), C:P (c,d), and N:P (e,f) ratios affected by land use and slope position, respectively. Error bars represent standard deviation of means. Different lowercase letters above the bars indicate significant differences among land uses and among slope positions. SF, secondary forest; OP, orchard plantation; CL, cropland.
Sustainability 13 09845 g003
Figure 4. Soil pH (a,b), BD (c,d), EC (e,f), and CEC (g,h) affected by land use and slope position, respectively. Error bars represent standard deviation of means. Different lowercase letters above the bars indicate significant differences among land uses, and among slope positions. BD, bulk density; EC, electrical conductivity; CEC, cation exchange capacity. SF, secondary forest; OP, orchard plantation; CL, cropland.
Sustainability 13 09845 g004
Table 1. Basic information of the sampling sites with different land uses.
Land UseSlope PositionElevation (m)Dominant Plants
SFUpper288masson pine (Pinus massoniana Lamb.), mixed with cypress (Cupressus funebris Endl.), white oak (Quercus fabric Hance.), cedar (Cunninghamia lanceolata Lamb.)
Middle245
Lower202
OPUpper271Orange tree (Citurs reticulate Blanco.)
Middle248
Lower223
CLUpper262Corn (Zea mays L.) and rape (Brassica campestris L.)
Middle232
Lower201
SF, secondary forest; OP, orchard plantation; CL, cropland.
Table 2. Two-way ANOVA showing the differences in C, N, and P concentrations, stoichiometry, and selected soil physicochemical properties affected by the interaction of land use and slope position.
VariableSourcedfFp
C concentrationLand use × Slope position45.460.001
N concentrationLand use × Slope position46.046<0.001
P concentrationLand use × Slope position42.40.056
C:N ratioLand use × Slope position43.270.015
C:P ratioLand use × Slope position49.18<0.001
N:P ratioLand use × Slope position414.294<0.001
pHLand use × Slope position47.382<0.001
BDLand use × Slope position47.652<0.001
ECLand use × Slope position43.3060.014
CECLand use × Slope position41.3610.254
Bold value indicates significant difference at the 0.05 level. BD, bulk density; EC, electrical conductivity; CEC, cation exchange capacity.
Table 3. Pearson correlations between selected soil physicochemical properties and C, N, and P concentrations as well as stoichiometry.
VariablepHBDECCEC
C concentration−0.239 *−0.291 **nsns
N concentration−0.299 **−0.301 **ns0.211 *
P concentrationnsns0.596 **0.387 **
C:N rationsnsns−0.226 *
C:P rationsns−0.351 **−0.445 **
N:P rationsns−0.383 **−0.381 **
BD, bulk density; EC, electrical conductivity; CEC, cation exchange capacity. ns, correlation is not significant; *, correlation is significant at the 0.05 level (2-tailed); **, correlation is significant at the 0.01 level (2-tailed).
Publisher’s Note: MDPI stays neutral with regard to jurisdictional claims in published maps and institutional affiliations.

