
The Relationship between Efficiency and Quality of Municipally Owned Corporations: Evidence from Local Public Transport and Waste Management in Poland


Abstract
1. Introduction
- Does the financial and operational efficiency of municipal enterprises translate into the quality of the services they provide in the eyes of citizens?
2. Literature Review—Providing Local Public Services and Municipally Owned Corporations
2.1. Local Collective Transport and Municipal Waste Management as Local Public Services
2.2. Municipally Owned Corporations as a Form of Provision of Local Public Services
- Provide certain services on their own (through the civil service);
- Privatize or outsource to private entities the provision of selected services;
- Provide services jointly with other entities, informally in the form of inter-municipal cooperation or public–private partnerships;
- Provide services through municipally owned corporations.
- Operating under private law and having independent corporate status (including the right to own property and right to sue or be sued);
- MOCs in carrying out public tasks have no right to impose taxes, and their financial management is based on revenues in the form of fees or transfers financed by local authorities;
- As a rule (but not in every country), MOCs can generate profits, but they can also suffer losses and face the risk of bankruptcy;
- In general, MOCs provide one type of service (usually transport, waste management, or water supply and wastewater disposal), although in some countries (including Poland), MOCs can provide many different public services at the same time.
- Providing a specific type of service to local communities;
- Operating on the basis of private law and having a separate legal personality;
- The majority of their shareholders are local authorities;
- Managed by a management board appointed by local authorities, which exercise ownership of those entities;
- Generating revenues from fees charged to the recipients of their services or framework contracts concluded with a local authority for the performance of specific tasks.
2.3. Efficiency of Municipally Owned Corporations
3. Materials and Methods
3.1. Operational Efficiency
3.2. Financial Efficiency
- Profitability (return on net sales (ROS); return on equity (ROE); return on total assets (ROA));
- Total assets turnover (TAT);
- Current ratio (CR);
- Debt ratio (DR).
3.3. Quality of Local Public Services
- Preparation of the initial version of the questionnaire based on the study of the subject literature and the research experience of the authors;
- Consultation of question content with academics specializing in research in the field of local government administration and the quality of services, as well as with the management staff at MOCs (see acknowledgments);
- Development of an electronic questionnaire;
- Pilot studies conducted on a non-random sample of people with a diverse demographic profile. The aim of the pilot was to test the research questionnaire. In particular, the comprehensibility of the questions and the accuracy of the suggested answers were checked. Additionally, in this stage, selected participants of the study were interviewed to provide insight into how they understood the questions and the process of answering;
- Development of the final version of the research questionnaire.
3.4. Research Procedure
- The stimulant in both types of analyzed companies included the following financial performance measures: return on net sales (ROS), return on equity (ROE), return on total assets (ROA), and rotation of assets (TAT). In addition, the stimulant was also a measure of operational efficiency. For local public transport, this was the intensity of the use of rolling stock and, in the case of municipal waste management, the level of recycling.
- Financial industry indicators were classified as destimulators. In local transport, it was the cost of making transport vehicles, and in the municipal economy, it was a synthetic cost indicator for obtaining a level of recycling.
- The nominators in both types of analyzed companies were financial indicators: current liquidity, CR (desired nominal values e in the range of 0.8–1.5), and debt ratio, DR (desired nominal values e in the range of 40–67%). The desired values forming the different ranges were determined according to the specificities of the industry concerned.
3.5. Data
4. Results
5. Conclusions and Discussion
Author Contributions
Funding
Institutional Review Board Statement
Informed Consent Statement
Data Availability Statement
Acknowledgments
Conflicts of Interest
Appendix A

| Full Name of Municipally Owned Corporation | City | ROS (%) | ROE (%) | ROA (%) | TAT | CR | DR (%) | CVK (PLN/vkm) | VUI (vkm/vh) |
|---|---|---|---|---|---|---|---|---|---|
| Municipal Public Transport Company Ltd. in Bialystok | Bialystok | −1.35 | −2.66 | −1.76 | 1.31 | 3.18 | 33.82 | 7.95 | 16.48 |
| Municipal Transport Company Ltd. in Bialystok | Bialystok | 2.27 | 12.32 | 5.24 | 2.31 | 1.45 | 57.50 | 9.50 | 15.89 |
| Municipal Communication Department Ltd. in Bialystok | Bialystok | −1.35 | −2.81 | −2.01 | 1.49 | 2.00 | 28.21 | 7.24 | 15.88 |
| Municipal Transport Facilities Ltd. in Bydgoszcz | Bydgoszcz | −8.37 | −14.83 | −9.70 | 1.16 | 1.38 | 34.60 | 8.04 | 16.32 |
| Gdansk Buses and Trams Ltd. | Gdansk | 0.81 | 2.39 | 0.49 | 0.61 | 1.32 | 79.37 | 11.79 | 16.63 |
| Public Transport Company Katowice Ltd. | Katowice | −2.15 | −4.95 | −2.01 | 0.94 | 1.72 | 59.41 | 8.28 | 15.99 |
| Silesian Trams PLC. | Katowice | 0.54 | 0.71 | 0.12 | 0.23 | 1.03 | 82.77 | 13.79 | 14.00 |
| Municipal Transport Company JSC in Krakow | Krakow | 1.30 | 1.70 | 0.56 | 0.43 | 1.92 | 67.26 | 11.70 | 14.95 |
| Municipal Transport Company Lublin Ltd. | Lublin | −0.13 | −0.39 | −0.12 | 0.96 | 0.86 | 68.47 | 11.53 | 13.86 |
| Municipal Transport Company—Lodz Ltd. | Lodz | 0.13 | 0.63 | 0.09 | 0.68 | 0.90 | 85.79 | 13.44 | 14.08 |
| Municipal Transport Company in Poznan Ltd. | Poznan | −2.35 | −2.13 | −0.73 | 0.31 | 0.49 | 65.61 | 13.36 | 14.80 |
| Municipal Transport Company—Rzeszow Ltd. | Rzeszow | 1.87 | 10.30 | 5.90 | 3.15 | 1.12 | 42.73 | 10.41 | 16.37 |
| Municipal Bus Companies Ltd. in Warsaw | Warsaw | 0.05 | 0.07 | 0.05 | 1.04 | 1.33 | 26.91 | 10.67 | 15.70 |
| Trams Warsaw Ltd. | Warsaw | 1.41 | 1.02 | 0.34 | 0.24 | 2.10 | 66.94 | 16.45 | 14.00 |
| Warsaw Metro Ltd. | Warsaw | 2.28 | 1.79 | 0.83 | 0.36 | 3.35 | 53.64 | 12.55 | 28.84 |
| Municipal Transport Company Ltd. in Wroclaw | Wroclaw | −2.17 | −5.34 | −0.92 | 0.42 | 1.69 | 82.79 | 9.98 | 14.33 |
| Full Name of Municipally Owned Corporation | City | ROS (%) | ROE (%) | ROA (%) | TAT | CR | DR (%) | RC (p.p.u./%) * | LR (%) |
|---|---|---|---|---|---|---|---|---|---|
| Service and Commercial and Production Company “LECH” Ltd. in Bialystok | Bialystok | 9.21 | 10.79 | 1.87 | 0.2 | 0.59 | 82.67 | 693.22 | 59 |
| ProNatura Ltd. | Bydgoszcz | 5.32 | 9.29 | 4.57 | 0.86 | 0.42 | 50.78 | 1502.76 | 44 |
| Disposal Plant Ltd. in Gdansk | Gdansk | −6.01 | −4.81 | −1.62 | 0.27 | 0.44 | 66.41 | 776.42 | 50 |
| City Municipal Economy Company Ltd. in Katowice | Katowice | 1.07 | 0.99 | 0.61 | 0.57 | 0.5 | 38.86 | 806.11 | 42 |
| Municipal Cleaning Company Ltd. | Krakow | 1.24 | 4.88 | 1.67 | 1.34 | 0.42 | 65.76 | 1786.33 | 39 |
| KOM-EKO PLC. | Lublin | 3.72 | 10.53 | 3.47 | 0.93 | 0.39 | 67 | 1381.48 | 30 |
| Municipal Cleaning Company Lodz Ltd. | Lodz | −0.68 | −5.38 | −0.98 | 1.45 | 0.3 | 81.78 | 1227.15 | 44 |
| ENERIS Ecological Disposal Center Ltd. | Poznan | 5.94 | 17.7 | 5.13 | 0.86 | 0.41 | 70.99 | 1323.17 | 41 |
| City Municipal Economy Company—Rzeszow Ltd. | Rzeszow | −7.32 | −64.65 | −18.35 | 2.51 | 0.59 | 71.61 | 1296.16 | 59 |
| Municipal Purification Company in Warsaw Ltd. | Warsaw | −40.16 | −53.07 | −17.65 | 0.44 | 0.42 | 66.75 | 1811.84 | 42 |
| REMONDIS Ltd. | Warsaw | 6.33 | 7.58 | 1.43 | 0.23 | 0.42 | 81.14 | 1187.22 | 42 |
| Wroclaw Cleaning Company ALBA PLC. | Wroclaw | −1.99 | −9.17 | −3.48 | 1.74 | 0.44 | 62.1 | 1631.16 | 42 |
Appendix B
| City/ Quality Standards | Availability of the Communication Network | Frequency of Running | Punctuality of the Transport | Travel Safety | The certainty of a Planned Trip | Immediacy and Speed of Travel | The Convenience of Travel | Information about the Transport Offer | Use of Innovative Technologies | Cost | Percentage of Users of Modern Technologies (%) | Overall Rating |
|---|---|---|---|---|---|---|---|---|---|---|---|---|
| Bialystok | 3.86 | 3.49 | 3.71 | 3.47 | 3.48 | 3.80 | 3.66 | 3.93 | 3.70 | 4.28 | 46.33 | 3.69 |
| Bydgoszcz | 3.77 | 3.5 | 3.56 | 3.61 | 3.46 | 3.84 | 3.50 | 4.06 | 3.80 | 4.14 | 45.67 | 3.58 |
| Gdansk | 3.96 | 3.59 | 3.59 | 3.59 | 3.40 | 3.55 | 3.55 | 4.05 | 3.86 | 4.03 | 55.00 | 3.63 |
| Katowice | 3.79 | 3.65 | 3.58 | 3.60 | 3.54 | 3.72 | 3.64 | 4.02 | 3.78 | 4.10 | 52.33 | 3.60 |
| Krakow | 3.96 | 3.58 | 3.70 | 3.55 | 3.50 | 3.56 | 3.60 | 4.03 | 3.82 | 3.94 | 54.33 | 3.61 |
| Lublin | 3.89 | 3.58 | 3.55 | 3.68 | 3.48 | 3.67 | 3.59 | 4.00 | 3.69 | 4.23 | 47.67 | 3.54 |
| Lodz | 3.72 | 3.57 | 3.62 | 3.57 | 3.41 | 3.69 | 3.48 | 3.97 | 3.67 | 4.21 | 50.00 | 3.56 |
| Poznan | 3.85 | 3.73 | 3.74 | 3.64 | 3.49 | 3.82 | 3.58 | 3.89 | 3.74 | 4.17 | 55.33 | 3.62 |
| Rzeszow | 3.77 | 3.70 | 3.52 | 3.69 | 3.53 | 3.67 | 3.68 | 3.87 | 3.74 | 4.00 | 45.00 | 3.53 |
| Warsaw | 3.99 | 3.60 | 3.75 | 3.56 | 3.47 | 3.85 | 3.47 | 3.92 | 3.79 | 3.86 | 57.33 | 3.59 |
| Wroclaw | 3.78 | 3.66 | 3.64 | 3.54 | 3.49 | 3.60 | 3.62 | 3.84 | 3.79 | 4.03 | 52.67 | 3.64 |
| City/ Quality Standards | Comprehensive Collection | Frequency of Collection | Timely Collection | Certainty of Waste Collection | Ease of Waste Segregation | Winter Infrastructure Maintenance | Ease of Segregation | Information about the Waste Collection Offer | Use of Modern Technologies | Cost | Percentage of Users of Modern Technologies (%) | Overall Rating |
|---|---|---|---|---|---|---|---|---|---|---|---|---|
| Bialystok | 3.4 | 3.04 | 3.82 | 3.9 | 3.79 | 3.53 | 3.25 | 3.21 | 3.17 | 4.13 | 39.43 | 3.37 |
| Bydgoszcz | 3.28 | 3.01 | 3.74 | 3.86 | 3.64 | 3.40 | 3.29 | 3.13 | 3.05 | 4.04 | 41.43 | 3.02 |
| Gdansk | 3.34 | 2.99 | 3.74 | 3.63 | 3.76 | 3.48 | 3.40 | 3.25 | 3.08 | 4.11 | 37.00 | 3.21 |
| Katowice | 3.28 | 3.03 | 3.69 | 3.62 | 3.66 | 3.36 | 3.33 | 3.16 | 3.06 | 4.09 | 38.29 | 3.07 |
| Krakow | 3.33 | 3.05 | 3.82 | 3.86 | 3.82 | 3.53 | 3.26 | 3.22 | 3.18 | 4.14 | 33.86 | 3.18 |
| Lublin | 3.30 | 3.00 | 3.67 | 3.72 | 3.75 | 3.41 | 3.30 | 3.08 | 3.04 | 4.04 | 37.43 | 3.21 |
| Lodz | 3.24 | 2.90 | 3.75 | 3.56 | 3.72 | 3.36 | 3.32 | 3.19 | 3.12 | 4.07 | 35.14 | 3.12 |
| Poznan | 3.29 | 2.97 | 3.64 | 3.70 | 3.70 | 3.47 | 3.36 | 3.15 | 3.04 | 4.11 | 35.71 | 3.05 |
| Rzeszow | 3.28 | 2.98 | 3.73 | 3.82 | 3.71 | 3.48 | 3.31 | 3.14 | 3.04 | 4.05 | 40.00 | 3.12 |
| Warsaw | 3.21 | 2.93 | 3.68 | 3.60 | 3.79 | 3.40 | 3.34 | 3.20 | 3.10 | 4.12 | 36.43 | 3.10 |
| Wroclaw | 3.36 | 3.02 | 3.77 | 3.65 | 3.75 | 3.50 | 3.42 | 3.26 | 3.11 | 4.07 | 39.43 | 3.33 |
References
- Weimer, D.L.; Vining, A.R. Policy Analysis: Concepts and Practice, 6th ed.; Routledge: Milton Park, UK, 2017; ISBN 978-1-138-21651-8. [Google Scholar]
- Nowotny, K. The Economics of public utility regulation: An overview. In Public Utility Regulation: The Economic and Social Control of Industry. Recent Economic Thought Series; Nowotny, K., Smith, D.B., Trebing, H.M., Eds.; Springer: Dordrecht, The Netherlands, 1989; pp. 9–27. ISBN 978-94-009-2508-3. [Google Scholar]
- Baek, S.; Kim, S. Participatory public service design by Gov.3.0 Design Group. Sustainability 2018, 10, 245. [Google Scholar] [CrossRef]
- Esposito, P.; Dicorato, S.L.; Doronzo, E. The effect of ownership on sustainable development and environmental policy in urban waste management: An explicatory empirical analysis of Italian municipal corporations. Bus. Strat. Environ. 2020, 30, 1067–1079. [Google Scholar] [CrossRef]
- Parker, D. Regulating public utilities: Lessons from the UK experience. Int. Rev. Adm. Sci. 1999, 65, 117–131. [Google Scholar] [CrossRef]
- Becker, S.; Beveridge, R.; Naumann, M. Remunicipalization in German cities: Contesting neo-liberalism and reimagining urban governance? Space Polity 2015, 19, 76–90. [Google Scholar] [CrossRef]
- Wagner, O.; Berlo, K. Remunicipalisation and foundation of municipal utilities in the german energy sector: Details about newly established enterprises. J. Sustain. Dev. Energy Water Environ. Syst. 2017, 5, 396–407. [Google Scholar] [CrossRef]
- Cumbers, A.; Becker, S. Making sense of remunicipalisation: Theoretical reflections on and political possibilities from Germany’sRekommumalisierungprocess. Camb. J. Reg. Econ. Soc. 2018, 11, 503–517. [Google Scholar] [CrossRef]
- Voorn, B.; Van Genugten, M.L.; Van Thiel, S. The efficiency and effectiveness of municipally owned corporations: A systematic review. Local Gov. Stud. 2017, 43, 820–841. [Google Scholar] [CrossRef]
- Tavares, A.F. Ten years after: Revisiting the determinants of the adoption of municipal corporations for local service delivery. Local Gov. Stud. 2017, 43, 697–706. [Google Scholar] [CrossRef]
- Narmania, D. Efficient management of municipal enterprises. Eur. J. Multidiscip. Stud. 2018, 7, 76–79. [Google Scholar] [CrossRef]
- Bergh, A.; Erlingsson, G.; Gustafsson, A.; Wittberg, E. Municipally owned enterprises as danger zones for corruption? How politicians having feet in two camps may undermine conditions for accountability. Public Integr. 2018, 21, 320–352. [Google Scholar] [CrossRef]
- Andrews, R.; Ferry, L.; Skelcher, C.; Wegorowski, P. Corporatization in the public sector: Explaining the growth of local government companies. Public Adm. Rev. 2019, 80, 482–493. [Google Scholar] [CrossRef]
- Voorn, B.; Van Genugten, M.; Van Thiel, S. Performance of municipally owned corporations: Determinants and mechanisms. Ann. Public Coop. Econ. 2020, 91, 191–212. [Google Scholar] [CrossRef]
- Voorn, B. Municipally owned corporations: An introduction. In When Politics Meets Professionalism: Features and Performance Predictors of Municipally Owned Corporations; Institute for Management Research: Nijmegen, The Netherlands, 2019; pp. 10–45. [Google Scholar]
- Krause, T.A.; Swiatczak, M.D. In control we trust!? Exploring formal control configurations for municipally owned corporations. J. Public Budg. Account. Financ. Manag. 2020, 33, 314–342. [Google Scholar] [CrossRef]
- Nuti, S.; Daraio, C.; Speroni, C.; Vainieri, M. Relationships between technical efficiency and the quality and costs of health care in Italy. Int. J. Qual. Health Care 2011, 23, 324–330. [Google Scholar] [CrossRef] [PubMed][Green Version]
- Al-Darrab, I.A. Relationships between productivity, efficiency, utilization, and quality. Work. Study 2000, 49, 97–104. [Google Scholar] [CrossRef]
- Kuo, C.-W.; Tang, M.-L. Relationships among service quality, corporate image, customer satisfaction, and behavioral intention for the elderly in high speed rail services. J. Adv. Transp. 2011, 47, 512–525. [Google Scholar] [CrossRef]
- Chang, M.; Jang, H.-B.; Li, Y.-M.; Kim, D. The relationship between the efficiency, service quality and customer satisfaction for state-owned commercial banks in China. Sustainability 2017, 9, 2163. [Google Scholar] [CrossRef]
- Kuo, Y.-F.; Wu, C.-M.; Deng, W.-J. The relationships among service quality, perceived value, customer satisfaction, and post-purchase intention in mobile value-added services. Comput. Hum. Behav. 2009, 25, 887–896. [Google Scholar] [CrossRef]
- Cuadrado-Ballesteros, B.; Garcia-Sanchez, I.-M.; Prado-Lorenzo, J.-M. Effects of different modes of local public services delivery on quality of life in Spain. J. Clean. Prod. 2012, 37, 68–81. [Google Scholar] [CrossRef]
- Gómez, J.L.Z.; Prior, D.; Díaz, A.M.P.; Hernandez, A.L. Reducing costs in times of crisis: Delivery forms in small and medium sized local governments’ waste management services. Public Adm. 2012, 91, 51–68. [Google Scholar] [CrossRef]
- Albalate, D.; Bel, G.; Calzada, J. Governance and regulation of urban bus transportation: Using partial privatization to achieve the better of two worlds. Regul. Gov. 2011, 6, 83–100. [Google Scholar] [CrossRef]
- Pérez-López, G.; Prior, D.; Zafra-Gómez, J.L. Rethinking new public management delivery forms and efficiency: Long-term effects in Spanish local government: Table 1. J. Public Adm. Res. Theory 2015, 25, 1157–1183. [Google Scholar] [CrossRef]
- Bourdeaux, C. Politics versus professionalism: The effect of institutional structure on democratic decision making in a contested policy arena. J. Public Adm. Res. Theory 2007, 18, 349–373. [Google Scholar] [CrossRef]
- Samuelson, P.A. The pure theory of public expenditure. Rev. Econ. Stat. 1954, 36, 387. [Google Scholar] [CrossRef]
- Tiebout, C.M. A pure theory of local expenditures. J. Politi. Econ. 1956, 64, 416–424. [Google Scholar] [CrossRef]
- Musgrave, R.A. The Theory of Public Finance: A Study in Public Economy; McGraw-Hill: New York, NY, USA, 1959. [Google Scholar]
- Buchanan, J.M. An economic theory of clubs. Economica 1965, 32. [Google Scholar] [CrossRef]
- Hardin, G. The tragedy of the commons. Science 1968, 162, 1243–1248. [Google Scholar] [CrossRef] [PubMed]
- Ostrom, E.; Gardner, R.; Walker, J. Rules, Games, and Common-Pool Resources; University of Michigan Press: Ann Harbour, MI, USA, 1994; ISBN 978-0-472-06546-2. [Google Scholar]
- Stiglitz, J.E. Economics of the Public Sector; W.W. Norton: New York, NY, USA, 2000. [Google Scholar]
- Samuelson, P.; Nordhaus, W. Economics, 19th ed.; McGraw-Hill/Irwin: New York, NY, USA, 2009. [Google Scholar]
- Hood, C. A public management for all seasons? Public Adm. 1991, 69, 3–19. [Google Scholar] [CrossRef]
- Kaboolian, L. The new public management: Challenging the boundaries of the management VS. administration debate. Public Adm. Rev. 1998, 58, 189. [Google Scholar] [CrossRef]
- Barzelay, M. The New Public Management: Improving Research and Policy Dialogue; Berkeley, University of California Press: New York, NY, USA; Russell Sage Foundation: New York, NY, USA, 2001; ISBN 978-0-520-22443-8. [Google Scholar]
- European Commission. A Quality Framework for Services of General Interest in Europe; European Commission: Brussels, Belgium, 2011. [Google Scholar]
- Van De Walle, S. What services are public? What aspects of performance are to be ranked? The case of “Services of general interest”. Int. Public Manag. J. 2008, 11, 256–274. [Google Scholar] [CrossRef]
- Clifton, J.; Comin, F.; Fuentes, D.D. Privatisation in the European Union: Public Enterprises and Integration; Springer Science & Business Media: Berlin/Heidelberg, Germany, 2003. [Google Scholar]
- Stawiarska, E.; Sobczak, P. The impact of intelligent transportation system implementations on the sustainable growth of passenger transport in EU regions. Sustainability 2018, 10, 1318. [Google Scholar] [CrossRef]
- Cobo, S.; Dominguez-Ramos, A.; Irabien, A. From linear to circular integrated waste management systems: A review of methodological approaches. Resour. Conserv. Recycl. 2018, 135, 279–295. [Google Scholar] [CrossRef]
- Smol, M.; Duda, J.; Czaplicka-Kotas, A.; Szołdrowska, D. Transformation towards circular economy (CE) In municipal waste management system: Model solutions for Poland. Sustainability 2020, 12, 4561. [Google Scholar] [CrossRef]
- Di Foggia, G.; Beccarello, M. Market structure of urban waste treatment and disposal: Empirical evidence from the Italian industry. Sustainability 2021, 13, 7412. [Google Scholar] [CrossRef]
- Brown, T.L.; Potoski, M.; Van Slyke, D.M. Changing modes of service delivery: How past choices structure future choices. Environ. Plan. C Gov. Policy 2008, 26, 127–143. [Google Scholar] [CrossRef]
- Brown, T.L.; Potoski, M.; Van Slyke, D.M. The impact of transaction costs on the use of mixed service delivery by local governments. J. Strat. Contract. Negot. 2015, 1, 239–267. [Google Scholar] [CrossRef]
- Bel, G.; Brown, T.; Warner, M. Editorial overview: Symposium on mixed and hybrid models of public service delivery. Int. Public Manag. J. 2014, 17, 297–307. [Google Scholar] [CrossRef]
- Karré, P. Hybridity as a result of the marketization of public services: Catalyst or obstruction for sustainable development? Deductions from a study of three hybrid waste management organizations in The Netherlands. Sustainability 2020, 13, 252. [Google Scholar] [CrossRef]
- Bel, G.; Hebdon, R.; Warner, M. Local government reform: Privatisation and its alternatives. Local Gov. Stud. 2007, 33, 507–515. [Google Scholar] [CrossRef]
- Hefetz, A.; Warner, M.; Vigoda-Gadot, E. Privatization and intermunicipal contracting: The US local government experience 1992–2007. Environ. Plan. C Gov. Policy 2012, 30, 675–692. [Google Scholar] [CrossRef]
- Witesman, E.M.; Fernandez, S. Government contracts with private organizations: Are there differences between nonprofits and for-profits? Nonprofit Volunt. Sect. Q. 2012, 42, 689–715. [Google Scholar] [CrossRef]
- Rodrigues, M.; Tavares, A.F.; Araujo, J.F.F.E. Municipal service delivery: The role of transaction costs in the choice between alternative governance mechanisms. Local Gov. Stud. 2012, 38, 615–638. [Google Scholar] [CrossRef]
- Brown, T.; Potoski, M. Transaction costs and contracting: The practitioner perspective. Public Perform. Manag. Rev. 2005, 28, 326–351. [Google Scholar] [CrossRef]
- Schoute, M.; Budding, T.; Gradus, R. Municipalities’ choices of service delivery modes: The influence of service, political, governance, and financial characteristics. Int. Public Manag. J. 2016, 21, 502–532. [Google Scholar] [CrossRef]
- Brown, T.L.; Potoski, M.L. Transaction costs and institutional explanations for government service production decisions. J. Public Adm. Res. Theory 2003, 13, 441–468. [Google Scholar] [CrossRef]
- Feiock, R.C.; Clinger, J.C.; Shrestha, M.; Dasse, C. Contracting and sector choice across municipal services. State Local Gov. Rev. 2007, 39, 72–83. [Google Scholar] [CrossRef]
- Wassenaar, M.; Groot, T.; Gradus, R. Municipalities’ contracting out decisions: An empirical study on motives. Local Gov. Stud. 2013, 39, 414–434. [Google Scholar] [CrossRef]
- Bel, G.; Fageda, X. Why do local governments privatise public services? A survey of empirical studies. Local Gov. Stud. 2007, 33, 517–534. [Google Scholar] [CrossRef]
- Bel, G.; Fageda, X. Factors explaining local privatization: A meta-regression analysis. Public Choice 2008, 139, 105–119. [Google Scholar] [CrossRef]
- Koppenjan, J.F. The formation of public-private partnerships: Lessons from nine transport infrastructure projects in The Netherlands. Public Adm. 2005, 83, 135–157. [Google Scholar] [CrossRef]
- Bognetti, G.; Robotti, L. The provision of local public services through mixed enterprises: The Italian case. Ann. Public Coop. Econ. 2007, 78, 415–437. [Google Scholar] [CrossRef]
- Girth, A.M. What drives the partnership decision? Examining structural factors influencing public-private partnerships for municipal wireless broadband. Int. Public Manag. J. 2014, 17, 344–364. [Google Scholar] [CrossRef]
- Feiock, R.C.; Jang, H.S. Nonprofits as local government service contractors. Public Adm. Rev. 2009, 69, 668–680. [Google Scholar] [CrossRef]
- Warner, M.E. Competition or cooperation in urban service delivery? Ann. Public Coop. Econ. 2011, 82, 421–435. [Google Scholar] [CrossRef]
- Bel, G.; Warner, M. Inter-municipal cooperation and costs: Expectations and evidence. Public Adm. 2014, 93, 52–67. [Google Scholar] [CrossRef]
- Allers, M.A.; De Greef, J. Intermunicipal cooperation, public spending and service levels. Local Gov. Stud. 2016, 44, 127–150. [Google Scholar] [CrossRef]
- Bergholz, C. Inter-municipal cooperation in the case of spillovers: Evidence from Western German municipalities. Local Gov. Stud. 2016, 44, 22–43. [Google Scholar] [CrossRef]
- Hefetz, A.; Warner, M. Contracting or public delivery? The importance of service, market, and management characteristics. J. Public Adm. Res. Theory 2011, 22, 289–317. [Google Scholar] [CrossRef]
- Joassart-Marcelli, P.; Musso, J. Municipal service provision choices within a metropolitan area. Urban Aff. Rev. 2005, 40, 492–519. [Google Scholar] [CrossRef]
- Bae, J. Institutional choices for local service contracting and collaboration. Int. Rev. Public Adm. 2009, 14, 27–42. [Google Scholar] [CrossRef]
- Bel, G.; Warner, M. Factors explaining inter-municipal cooperation in service delivery: A meta-regression analysis. J. Econ. Policy Reform 2015, 19, 91–115. [Google Scholar] [CrossRef]
- Silvestre, H.C.; Marques, R.C.; Gomes, R. Joined-up Government of utilities: A meta-review on a public–public partnership and inter-municipal cooperation in the water and wastewater industries. Public Manag. Rev. 2017, 20, 607–631. [Google Scholar] [CrossRef]
- Bel, G.; Gradus, R. Privatisation, contracting-out and inter-municipal cooperation: New developments in local public service delivery. Local Gov. Stud. 2016, 44, 11–21. [Google Scholar] [CrossRef]
- Ferry, L.; Andrews, R.; Skelcher, C.; Wegorowski, P. New development: Corporatization of local authorities in England in the wake of austerity 2010–2016. Public Money Manag. 2018, 38, 477–480. [Google Scholar] [CrossRef]
- Torsteinsen, H. Debate: Corporatization in local government—The need for a comparative and multi-disciplinary research approach. Public Money Manag. 2018, 39, 5–8. [Google Scholar] [CrossRef]
- Camões, P.J.; Rodrigues, M. From enthusiasm to disenchantment: An analysis of the termination of Portuguese municipal enterprises. Public Money Manag. 2020, 41, 387–394. [Google Scholar] [CrossRef]
- Nagasawa, S.; Nagasawa, M. Free riding, empire building, and cost management prior to and post municipal enterprise mergers in Japan. Asia-Pac. J. Account. Econ. 2020, 28, 94–116. [Google Scholar] [CrossRef]
- Tavares, A.F.; Camões, P.J. New forms of local governance. Public Manag. Rev. 2010, 12, 587–608. [Google Scholar] [CrossRef]
- da Cruz, N.; Marques, R.C. Viability of municipal companies in the provision of urban infrastructure services. Local Gov. Stud. 2011, 37, 93–110. [Google Scholar] [CrossRef]
- Olsen, T.H.; Solstad, E.; Torsteinsen, H. The meaning of institutional logics for performance assessment in boards of municipal companies. Public Money Manag. 2017, 37, 393–400. [Google Scholar] [CrossRef]
- Daiser, P.; Wirtz, B.W. Strategic corporate governance factors for municipally owned companies: An empirical analysis from a municipal perspective. Int. Rev. Adm. Sci. 2019, 87, 135–153. [Google Scholar] [CrossRef]
- Papenfuß, U.; Van Genugten, M.; De Kruijf, J.; Van Thiel, S. Implementation of EU initiatives on gender diversity and executive directors’ pay in municipally-owned enterprises in Germany and The Netherlands. Public Money Manag. 2018, 38, 87–96. [Google Scholar] [CrossRef]
- Primeaux, W.J. The effect of competition on capacity utilization in the electric utility industry. Econ. Inq. 1978, 16, 237–248. [Google Scholar] [CrossRef]
- Pendleton, A.; McDonald, J.; Robinson, A.; Wilson, N. Employee participation and corporate governance in employee-owned firms. Work. Employ. Soc. 1996, 10, 205–226. [Google Scholar] [CrossRef]
- Cai, J.; Tylecote, R.; Canales, I.; Kiso, T. State ownership and innovation: The relative merits of local and central state judged by innovation performance. Int. J. Innov. Manag. 2020, 25, 2150026. [Google Scholar] [CrossRef]
- Tavares, A.F.; Camões, P.J. Local service delivery choices in Portugal: A political transaction costs framework. Local Gov. Stud. 2007, 33, 535–553. [Google Scholar] [CrossRef]
- Krause, T.A.; Van Thiel, S. Perceived managerial autonomy in municipally owned corporations: Disentangling the impact of output control, process control, and policy-profession conflict. Public Manag. Rev. 2018, 21, 187–211. [Google Scholar] [CrossRef]
- Sfez, S.; Dewulf, J.; De Soete, W.; Schaubroeck, T.; Mathieux, F.; Kralisch, D.; De Meester, S. Toward a framework for resource efficiency evaluation in industry: Recommendations for research and innovation projects. Resources 2017, 6, 5. [Google Scholar] [CrossRef]
- Bull, R. Financial Ratios. How to Use Financial Ratios to Maximise Value and Success for Your Business; CIMA Publishing, Elsevier: Oxford, UK, 2008. [Google Scholar]
- Yang, Q. Fiscal transparency and public service quality association: Evidence from 12 coastal provinces and cities of China. J. Risk Financ. Manag. 2020, 14, 13. [Google Scholar] [CrossRef]
- Bai, C.; Lai, F.; Chen, Y.; Hutchinson, J. Conceptualising the perceived service quality of public utility services: A multi-level, multi-dimensional model. Total. Qual. Manag. Bus. Excel. 2008, 19, 1055–1070. [Google Scholar] [CrossRef]
- Badia, F.; Bracci, E.; Tallaki, M. Quality and diffusion of social and sustainability reporting in Italian public utility companies. Sustainability 2020, 12, 4525. [Google Scholar] [CrossRef]
- Friman, M.; Lättman, K.; Olsson, L.E. Public transport quality, safety, and perceived accessibility. Sustainability 2020, 12, 3563. [Google Scholar] [CrossRef]
- Wagner, O.; Berlo, K.; Herr, C.; Companie, M. Success factors for the foundation of municipal utilities in Germany. Energies 2021, 14, 981. [Google Scholar] [CrossRef]
- Cronbach, L.J. Coefficient alpha and the internal structure of tests. Psychometrika 1951, 16, 297–334. [Google Scholar] [CrossRef]
- Navarro-Espigares, J.L.; Torres, E.H. Efficiency and quality in health services: A crucial link. Serv. Ind. J. 2011, 31, 385–403. [Google Scholar] [CrossRef]
- Gok, M.S.; Sezen, B. Analyzing the ambiguous relationship between efficiency, quality and patient satisfaction in healthcare services: The case of public hospitals in Turkey. Health Policy 2013, 111, 290–300. [Google Scholar] [CrossRef]
- Kukuła, K. Metoda Unitaryzacji Zerowanej; Wydawnictwo PWN: Warsaw, Poland, 2000. [Google Scholar]
- Młodak, A. Analiza Taksonomiczna w Statystyce Regionalnej; Difin: Warsaw, Poland, 2006. [Google Scholar]
- Kacprzyk, D. Komunikacja Miejska w Liczbach; Izba Gospodarcza Komunikacji Miejskiej: Warsaw, Poland, 2019. [Google Scholar]
- Schoefller, S.; Buzzell, R.D.; Heany, D.F. Impact of Strategieplanning on Profit Performance; Harvard Business Review: Cambridge, MA, USA, 1974; pp. 137–145. [Google Scholar]
- George, S.A. Productive efficiency, service quality and profitability: A comparative analysis of foreign and private banks in India. Int. J. Prod. Qual. Manag. 2016, 18, 518. [Google Scholar] [CrossRef]
- Zervopoulos, P.; Palaskas, T. Applying quality-driven, efficiency-adjusted DEA (QE-DEA) in the pursuit of high-efficiency-high-quality service units: An input-oriented approach. IMA J. Manag. Math. 2011, 22, 401–417. [Google Scholar] [CrossRef]


| Contracting Model | Characteristics | The Role of the Public Party | The Role of a Private Party | Sample Place of Application | |
|---|---|---|---|---|---|
| Local Public Transport | |||||
| Ordering transport services from MOCs by way of direct entrusting | A closed market that excludes direct competition. The transport is carried out by a public carrier, i.e., MOC s (different rules of cooperation between it and the transport organizer are possible) | Setting tariffs, timetables, and routes, carrying out transport activities independently or through subordinate municipal enterprises (MOCs) | None | Paris, Madrid, Prague, Budapest, Athens | |
| Competition in the market “on the road” | Deregulation of the market, abolished possibility of granting exclusive rights for the provision of services in the public bus sector (example of an open market in which MOC does not exist or is one of several entities) | Commissioning and subsidizing unprofitable but socially needed services | Operating, creating timetables and routes, having own fares | United Kingdom (except London) | |
| Competition for the “off the road” market |
| The tendering procedure in the framework of the so-called regulated competition, where the right of exclusivity is granted for a limited period after the necessary tender, in which the MOC competes, alongside private enterprises | Determination of the basic shape of the tariff and transport offers, selection of MOC and/or private carrier, contracting services | Carrying out transport activities, management activities | Cities in France (except the Paris region), smaller cities in Finland, Sweden |
| Regulation of fares, timetables, stimulating competition between carriers | Carrying out transport activities | London, Helsinki, Copenhagen, Stockholm, Porto | ||
| Municipal Waste Management | |||||
| Commissioning municipal waste management services by directly entrusting own MOCs and organizing a competitive market for the collection and transport of waste | The entity responsible for waste management and sometimes for the waste management system is a MOC or MOCs. In addition, a tender procedure for the collection and transport of waste is organized in the framework of the so-called regulated competition, where the exclusivity right is granted for a limited period after the necessary tender has been conducted throughout the city or in the separate zones. | Setting of fees, method of collection, conducting self-management of waste through subordinate municipal enterprises (MOCs), selection and contracting (sometimes with and through the MOCs acting as operators) of companies responsible for the reception of waste (it can also be the MOCs). | Carrying out municipal waste collection and transport activities | Paris, Vienna, Prague, Frankfurt (Oder), Vienna, Amsterdam, Vilnius, Krakow | |
| Competition for the municipal waste management and collection market | A tender procedure is organized for the management of collection, transport of waste within the framework of the so-called regulated competition, where the right of exclusivity is granted for a limited period after the necessary tender has been carried out. Sometimes a MOC or a private entity is selected, operating on publicly owned equipment. | Setting of fees, method of collection, management, selection, and contracting of companies (including MOCs) responsible for the implementation of municipal waste management | Carrying out municipal waste management, collection, and transport activities | London, Valencia, Marseille, Eindhoven, Frankfurt am Main | |
| Partial competition in the municipal waste management market | Municipalities organize waste management on the basis of a competitive market model, but large waste producers, such as housing associations, can exit the municipal system and contract directly with private operators or MOCs | Setting of fees, method of collection, management, selection, and contracting of enterprises (including MOCs) responsible for the implementation of municipal waste management in a system without larger entities | Conducting municipal waste management activities in the organizational, financial, and operational areas | Sofia, Turku, Lahti, Cork | |
| Perspective | Supplier (Efficiency) | Consumer (Quality) | ||||
|---|---|---|---|---|---|---|
| Performance Dimension | Operational Efficiency Measures | Financial Performance Measures | Quality Meters | |||
| MOC industry | Local public transport | Municipal waste management | Local public transport | Municipal waste management | Local public transport | Municipal waste management |
| Measurements |
|
|
|
|
| |
|
| |||||
| Qualitative Dimension of the Provision of Municipal Service | Local Public Transport | Municipal Waste Management |
|---|---|---|
| Accessibility/comprehensiveness | Availability of the transportation network | Comprehensive collection |
| Frequency | Frequency of running | Frequency of collection |
| Punctuality/timeliness | Punctuality of running | Timely collection |
| Safety | Travel safety | Winter infrastructure maintenance |
| Certainty | The certainty of completing a planned trip | Certainty of waste collection |
| Speed/effectiveness | Immediacy and speed of travel | Maintaining cleanliness in the city |
| Cost | The level of transport fees | The level of the collection fee |
| Convenience | The convenience of travel | Ease of waste segregation |
| Information | Information about the transport offer | Information about the waste collection offer |
| Modern technologies | Use of modern technologies | Use of modern technologies |
| Characteristics | Number of Responses | Share (%) |
|---|---|---|
| Total | 1247 | 100 |
| Gender | ||
| woman | 641 | 51.40 |
| man | 606 | 48.60 |
| Age | ||
| 18–24 | 88 | 7.06 |
| 25–34 | 215 | 17.24 |
| 35–44 | 299 | 23.98 |
| 45–54 | 297 | 23.82 |
| 55–64 | 235 | 18.85 |
| >65 | 113 | 9.05 |
| Occupational status | ||
| working | 874 | 70.09 |
| entrepreneurs | 123 | 9.86 |
| out of work | 102 | 8.18 |
| pensioner | 148 | 11.87 |
| Education | ||
| basic or professional | 11 | 0.88 |
| professional | 74 | 5.93 |
| averages | 483 | 38.74 |
| higher | 679 | 54.45 |
| Domicile | ||
| single-family house | 199 | 15.96 |
| terraced house | 129 | 10.34 |
| multi-family construction | 919 | 73.70 |
| City of residence | ||
| Warsaw | 144 | 11.55 |
| Krakow | 140 | 11.23 |
| Poznan | 133 | 10.67 |
| Lodz | 107 | 8.58 |
| Gdansk | 103 | 8.26 |
| Wroclaw | 104 | 8.34 |
| Katowice | 101 | 8.10 |
| Lublin | 105 | 8.42 |
| Bydgoszcz | 100 | 8.02 |
| Bialystok | 108 | 8.66 |
| Rzeszow | 102 | 8.17 |
| Ranking | Local Public Transport | Municipal Waste Management | ||
|---|---|---|---|---|
| Company Name (City) | Company Name (City) a | |||
| 1 | Municipal Transport Company—Rzeszow Ltd. (Rzeszow) | 0.8389 | Service and Commercial and Production Company “LECH” Ltd. in Bialystok (Bialystok) | 0.7221 |
| 2 | Municipal Public Transport Company Ltd. in Bialystok (Bialystok) | 0.8202 | REMONDIS Ltd. (Warsaw) | 0.7193 |
| 3 | Warsaw Metro Ltd. (Warsaw) | 0.5946 | KOM-EKO PLC. (Lublin) | 0.7157 |
| 4 | Municipal Transport Company Lublin Ltd. (Lublin) | 0.5785 | ENERIS Ecological Disposal Centre Ltd. (Poznan) | 0.6731 |
| 5 | Public Transport Company Katowice Ltd. (Katowice) | 0.5745 | Wroclaw Purification Company ALBA PLC (Wroclaw) | 0.6712 |
| 6 | Municipal Transport Company JSC in Krakow (Krakow) | 0.5737 | City Municipal Economy Company Ltd. in Katowice (Katowice) | 0.6431 |
| 7 | Gdansk Buses and Trams Ltd. (Gdansk) | 0.5391 | Municipal Cleaning Company Ltd. (Krakow) | 0.5806 |
| 8 | Municipal Bus Company Ltd. in Warsaw (Warsaw) | 0.4993 | Recycling Plant Ltd. in Gdansk (Gdansk) | 0.5661 |
| 9 | Municipal Transport Department Ltd. in Bialystok (Bialystok) | 0.4989 | City Municipal Economy Company—Rzeszów Ltd. (Rzeszow) | 0.5648 |
| 10 | Trams Warsaw Ltd. (Warsaw) | 0.4792 | ProNatura Ltd. (Bydgoszcz) | 0.56177 |
| 11 | Municipal Transport Company Ltd. in Bialystok (Bialystok) | 0.4627 | Municipal Cleaning Company Łódź Ltd. (Lodz) | 0.5451 |
| 12 | Silesian Trams PLC (Katowice) | 0.4372 | Municipal Purification Company in Warsaw Ltd. (Warsaw) | 0.2101 |
| 13 | Municipal Transport Company—Łódź Ltd. (Lodz) | 0.4364 | - | - |
| 14 | Municipal Transport Company Ltd. in Wroclaw (Wroclaw) | 0.4193 | - | - |
| 15 | Municipal Transport Company in Poznan Ltd. (Poznan) | 0.3795 | - | - |
| 16 | Municipal Transport Facilities Ltd. in Bydgoszcz (Bydgoszcz) | 0.3730 | - | - |
| Ranking | Local Public Transport | Municipal Waste Management | ||
|---|---|---|---|---|
| City | City | |||
| 1 | Warsaw | 0.6971 | Bialystok | 0.8174 |
| 2 | Krakow | 0.6786 | Wroclaw | 0.7948 |
| 3 | Poznan | 0.6450 | Krakow | 0.7161 |
| 4 | Katowice | 0.6108 | Gdansk | 0.7156 |
| 5 | Gdansk | 0.6076 | Rzeszow | 0.6256 |
| 6 | Rzeszow | 0.6040 | Poznan | 0.5825 |
| 7 | Wroclaw | 0.5420 | Lodz | 0.5670 |
| 8 | Lublin | 0.5306 | Warsaw | 0.5486 |
| 9 | Bydgoszcz | 0.5125 | Bydgoszcz | 0.5474 |
| 10 | Bialystok | 0.5078 | Lublin | 0.5457 |
| 11 | Lodz | 0.3708 | Katowice | 0.4607 |
| Parameter | Coefficient | Standard Error | 95% Confidence Interval | t Statistic | p-Value |
|---|---|---|---|---|---|
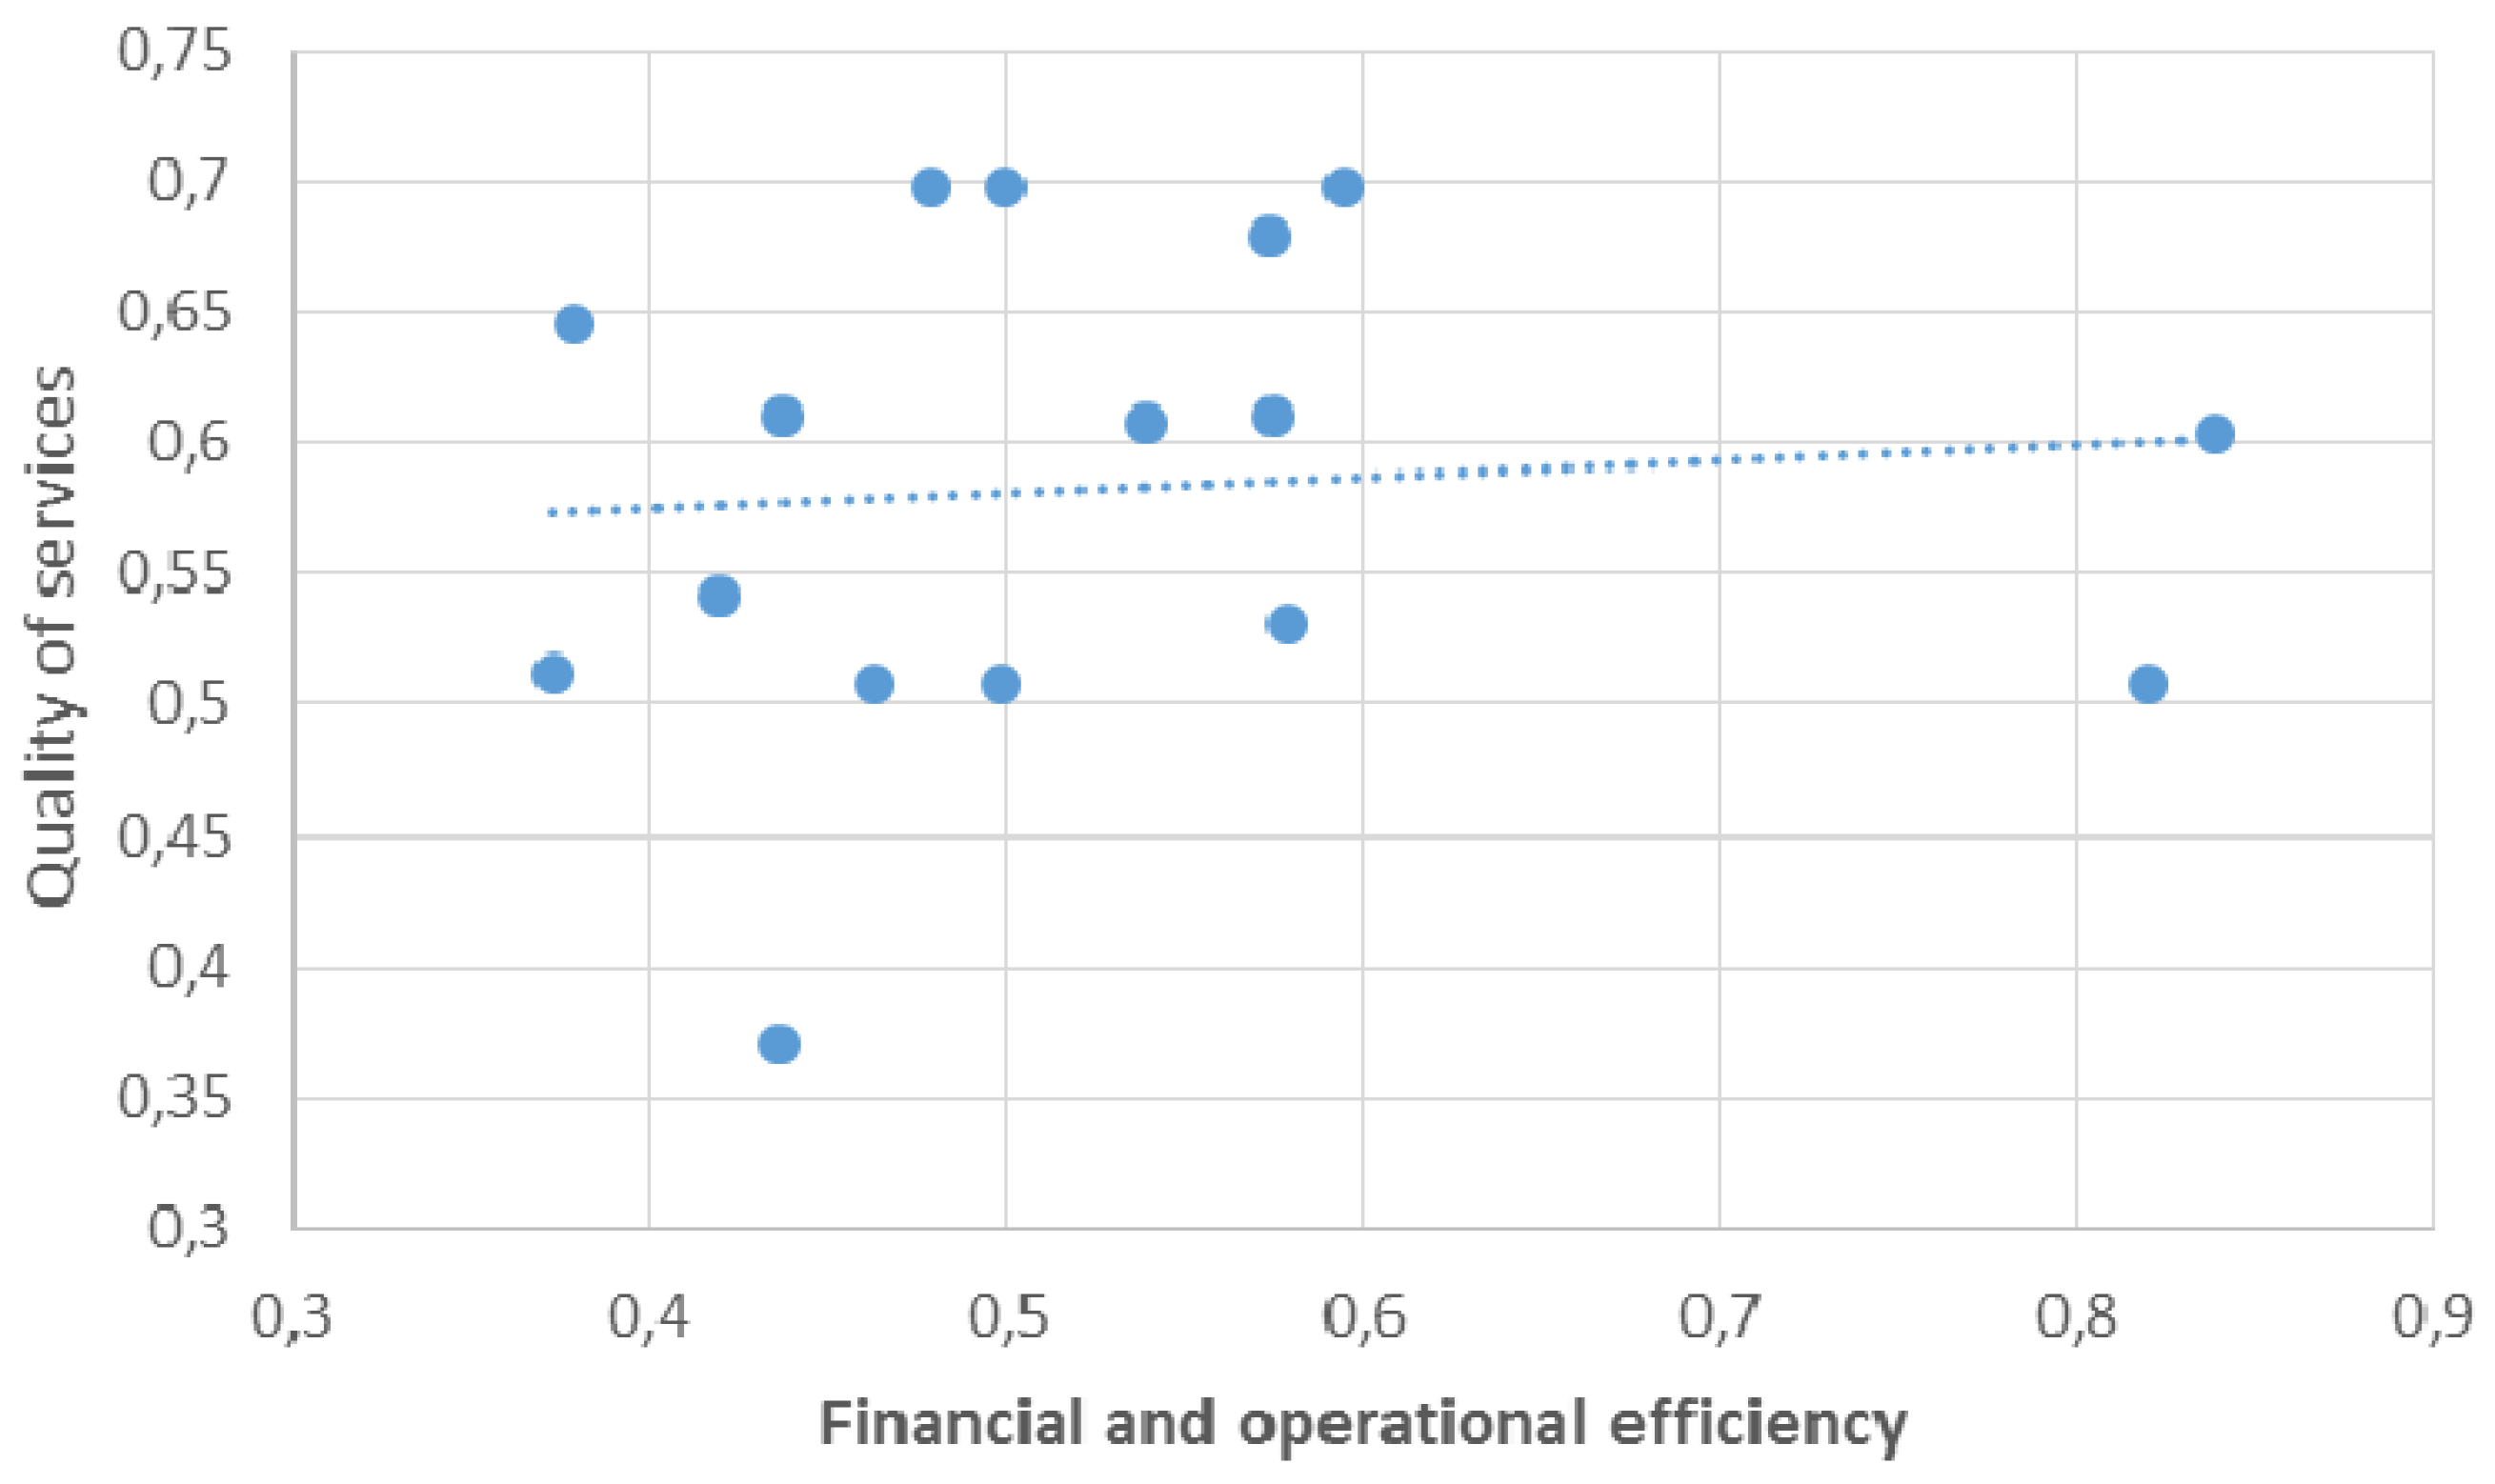
| MOCs providing local public transport services | |||||
| (Constant) | 0.5506 | 0.0985 | [0.3394; 0.7619] | 5.5904 | 0.0001 |
| Financial and operational efficiency (FOE) | 0.0608 | 0.1799 | [−0.3250; 0.4466] | 0.3379 | 0.7404 |
| R-squared | 0.0081 | - | - | - | - |
| Adjusted R-squared | −0.0628 | - | - | - | - |
| Overall model significance (F- p-value test) | 0.7404 | - | - | - | - |
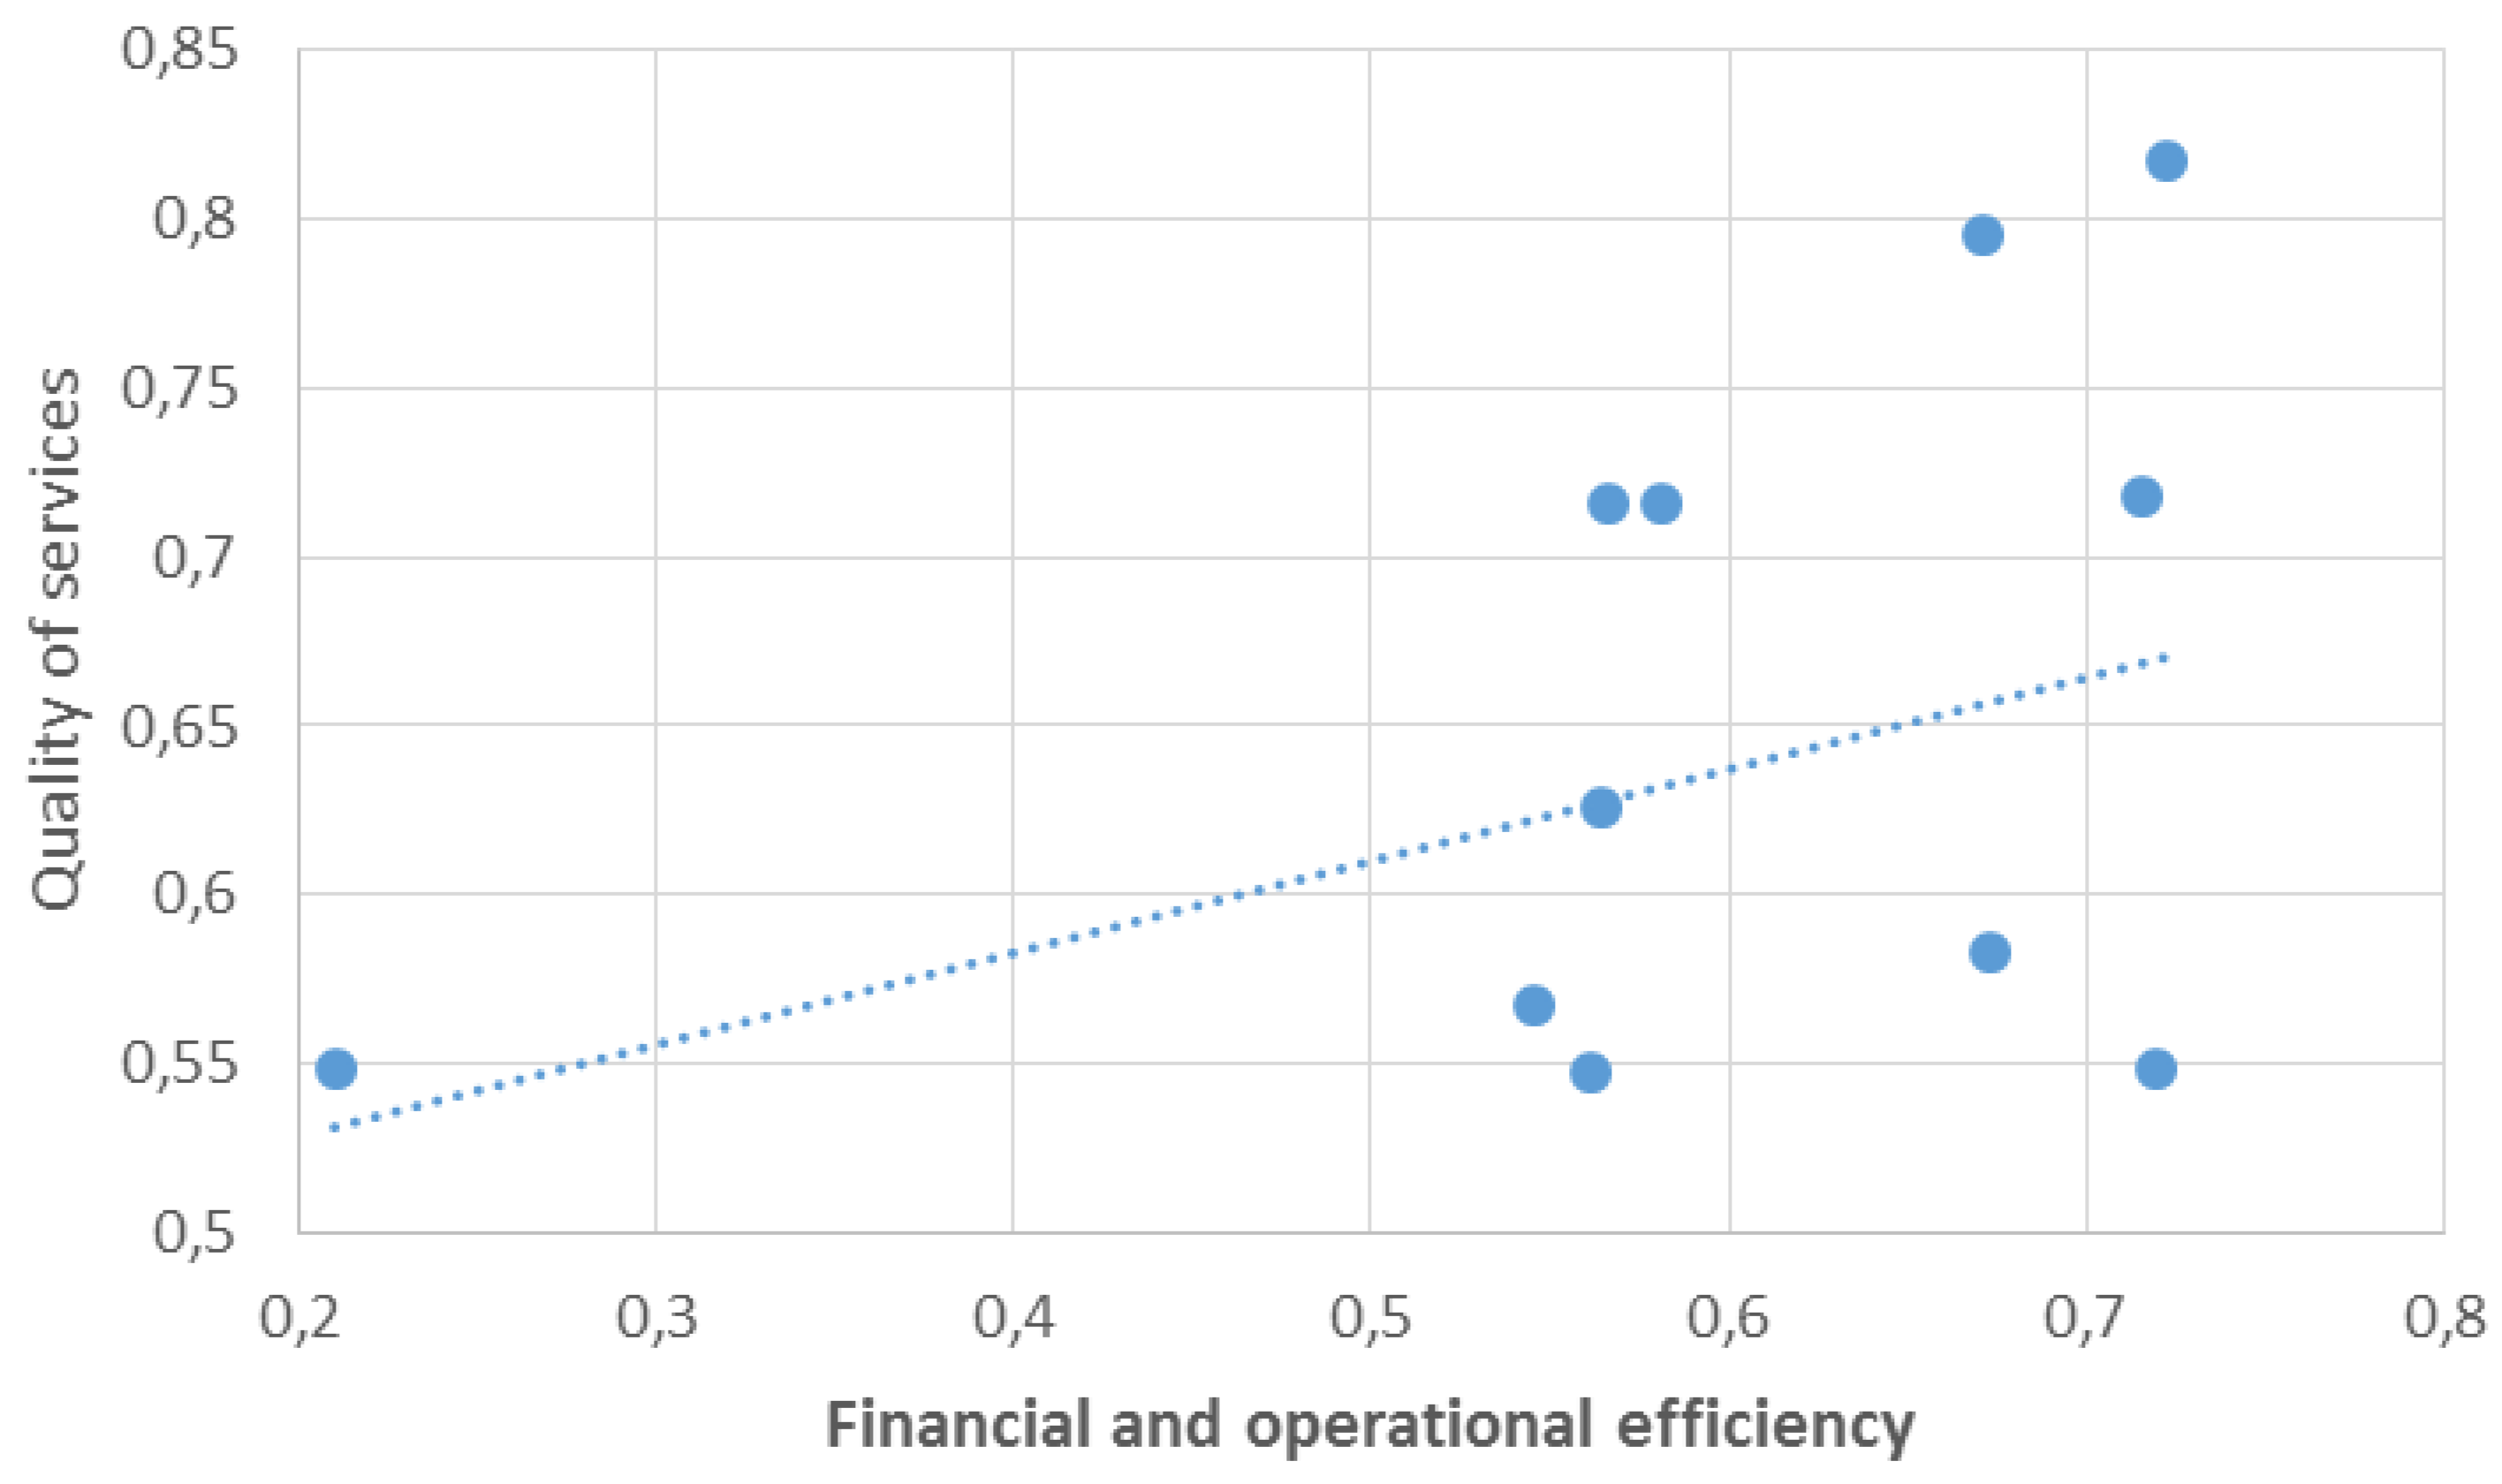
| MOCs providing municipal waste management | |||||
| (Constant) | 0.4737 | 0.1469 | [0.1463; 0.8011] | 3.2234 | 0.0091 |
| Financial and operational efficiency (FOE) | 0.2729 | 0.2399 | [−0.2616; 0.8075] | 1.1376 | 0.2818 |
| R-squared | 0.1146 | - | - | - | - |
| Adjusted R-squared | 0.0260 | - | - | - | - |
| Overall model significance (F- p-value test) | 0.2818 | - | - | - | - |
Publisher’s Note: MDPI stays neutral with regard to jurisdictional claims in published maps and institutional affiliations. |
© 2021 by the authors. Licensee MDPI, Basel, Switzerland. This article is an open access article distributed under the terms and conditions of the Creative Commons Attribution (CC BY) license (https://creativecommons.org/licenses/by/4.0/).
Share and Cite
Jedynak, T.; Wąsowicz, K. The Relationship between Efficiency and Quality of Municipally Owned Corporations: Evidence from Local Public Transport and Waste Management in Poland. Sustainability 2021, 13, 9804. https://doi.org/10.3390/su13179804
Jedynak T, Wąsowicz K. The Relationship between Efficiency and Quality of Municipally Owned Corporations: Evidence from Local Public Transport and Waste Management in Poland. Sustainability. 2021; 13(17):9804. https://doi.org/10.3390/su13179804
Chicago/Turabian StyleJedynak, Tomasz, and Krzysztof Wąsowicz. 2021. "The Relationship between Efficiency and Quality of Municipally Owned Corporations: Evidence from Local Public Transport and Waste Management in Poland" Sustainability 13, no. 17: 9804. https://doi.org/10.3390/su13179804
APA StyleJedynak, T., & Wąsowicz, K. (2021). The Relationship between Efficiency and Quality of Municipally Owned Corporations: Evidence from Local Public Transport and Waste Management in Poland. Sustainability, 13(17), 9804. https://doi.org/10.3390/su13179804