Role of Farmers’ Risk and Ambiguity Preferences on Fertilization Decisions: An Experiment
Abstract
1. Introduction
2. Materials and Methods
2.1. Part 1 of the Questionnaire: Elicitation of Preferences
2.2. Order Effect and Incentives
2.3. Parts 2 and 3 of the Questionnaire: Fertilization and Socio-Demographic Characteristics
3. Results
3.1. Elicitation of Risk and Ambiguity Preferences
3.2. Descriptive Statistics
3.2.1. Crops and Yields
3.2.2. Synthetic Nitrogen Fertilization
3.2.3. Other Practices and Characteristics
3.2.4. Socio-Demographic Statistics
3.3. Pairwise Correlations and Marginal Impact Estimations
3.3.1. Correlations
3.3.2. Taking Sampling Design in Regressions into Account
3.3.3. Regressions Results
4. Discussion
5. Conclusions
Author Contributions
Funding
Institutional Review Board Statement
Informed Consent Statement
Data Availability Statement
Acknowledgments
Conflicts of Interest
Appendix A. Survey on the Use of Synthetic Nitrogen Fertilizers
- -
- Option A: obtain €7 with 10% chance or €5 with 90% chance.
- -
- Option B: obtain €13 with 10% chance or €0 with 90% chance.
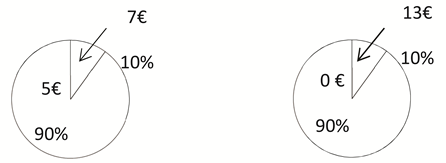
| Decisions | Option A | Option B | ||||||
| Proba. | Payoff | Proba. | Payoff | Proba. | Payoff | Proba. | Payoff | |
| 1 | 10% | €7 | 90% | €5 | 10% | €13 | 90% | €0 |
| 2 | 20% | €7 | 80% | €5 | 20% | €13 | 80% | €0 |
| 3 | 30% | €7 | 70% | €5 | 30% | €13 | 70% | €0 |
| 4 | 40% | €7 | 60% | €5 | 40% | €13 | 60% | €0 |
| 5 | 50% | €7 | 50% | €5 | 50% | €13 | 50% | €0 |
| 6 | 60% | €7 | 40% | €5 | 60% | €13 | 40% | €0 |
| 7 | 70% | €7 | 30% | €5 | 70% | €13 | 30% | €0 |
| 8 | 80% | €7 | 20% | €5 | 80% | €13 | 20% | €0 |
| 9 | 90% | €7 | 10% | €5 | 90% | €13 | 10% | €0 |
| 10 | 100% | €7 | 0% | €5 | 100% | €13 | 0% | €0 |
- -
- I choose option A for decisions 1 to □.
- -
- I choose option B for decisions □ at 10.
- -
- Option A: obtain €13 with 1 chance out of 2 (50%) or €0 with 1 chance out of 2 (50%).
- -
- Option B: obtain €9 or €0, but you do not know the associated chances of winning.
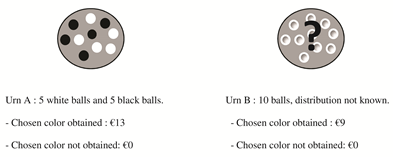
| Decisions | Option A: urn A | Option B: urn B | ||
| In urn A, the Distribution of | In urn B, the Distribution | |||
| BALLS Is 5 Black and 5 White | of Balls Is Not Known | |||
| Chosen Color | Chosen Color | Chosen Color | Chosen Color | |
| Obtained | Not Obtained | Obtained | NotObtained | |
| 1 | €13 | €0 | €9 | €0 |
| 2 | €12 | €0 | €9 | €0 |
| 3 | €11 | €0 | €9 | €0 |
| 4 | €10 | €0 | €9 | €0 |
| 5 | €9 | €0 | €9 | €0 |
| 6 | €8 | €0 | €9 | €0 |
| 7 | €7 | €0 | €9 | €0 |
| 8 | €6 | €0 | €9 | €0 |
| 9 | €4 | €0 | €9 | €0 |
| 10 | €2 | €0 | €9 | €0 |
- -
- I choose option A for decisions 1 to □.
- -
- I choose option B for decisions □ at 10.
- Location:
- →
- Which department?
- →
- On which commune is your parcel located?
- What is your status vis-à-vis the parcel in question? □ Owner □ Tenant
- What is the main crop?
- Is it a contract crop? □ No □ Yes
- →
- If yes, what kind of contract?
- What is the smallest area on the plot (in hectares)?
- What is the type of previous crop on the plot?
- What is the type of soil on the plot?
- What was your target for early returns (in qt/ha)?
- What were your real yields after harvest (in qt/ha)?
- →
- If objective and real returns were different, please explain why:
- Have you applied one (or more) organic nitrogen fertilizers on this plot? □ No □ Yes
- →
- If yes, how much (in kg/ha)?
- →
- How was the amount of nitrogen contained in this (these) input (s) taken into account? □ Analysis □ Reference table □ It was not taken into account
- →
- Do mineral nitrogen fertilizer recommendations take this quantity into account? □ No □ Yes
- Did you bury the fertilizer? □ No □ Yes
- Please indicate the amount of mineral nitrogen recommended by your nitrogen advisory agency on this plot (in kgN/ha)?
- Were there any recommendations on the first nitrogen input? □ No □ Yes
- →
- If yes, how much (in kg/ha)?
- Have you been advised to split contributions? □ No □ Yes
- →
- If yes, how much?
- Did you split the contributions? □ No □ Yes
- →
- If yes, how much?
- Is there a maximum that you should not exceed on this parcel? □ No □ Yes.
- →
- If yes, how much (in kg/ha)?
- Is there a type of spreading method that you must follow? □ No □ Yes
- →
- If yes, which one?
- →
- If yes, what is this regulatory constraint related to? □ Vulnerable area □ MAE □ Other
- How much did you actually apply to this parcel in total (in kgN/ha)?
- And at the first intake (in kgN/ha)?
- →
- Explain the reasons for your choice:
- What is the share of synthetic nitrogen fertilizer costs in your total expenses for this parcel (in %)?
- How much PAC assistance do you receive in total (in €/year)?
- →
- Of this total amount, how much corresponds to specific environmental aids and reduction of the chemical spreading (MAE or other) (in €/year)?
- Have you taken out a voluntary agricultural yield insurance contract this year?
- →
- □ No □ Yes
- What is the total area of your farm (in hectares)?
- Are you part of an operator’s union? □ No □ Yes
- →
- If yes, which one?
- What is your age in years ?
- Sex: □ Man □ Woman
- Marital status: □ Single □ Married □ Civil Solidarity Pact
- Level of studies:
- →
- □ Without diploma □ Brevet □ Bac
- →
- □ Baccalaureate + (specify the number of years of study after the Baccalaureate: …)
- Number of people in the household: □ 1 □ 2 □ 3 □ 4 and more Among them, how much children ?
- In what interval are the total monthly incomes of your household (net of taxes)?
- →
- □<€1000/net/month □ from 1000 to €1500/net/month
- →
- □ from 1500 to €2000/net/month □ from 2000 to €2500/net/month
- →
- □ from 2500 to €3000/net/month □> €3000/net/month
- Please express your opinion of synthetic nitrogen fertilizers and policies to regulate their use:
- Please give us your opinion of the survey (strengths, possible difficulties encountered, etc.):
Appendix B. The Ten-Paired Lottery Choice
| Decisions | Option A | Option B | ||||||
|---|---|---|---|---|---|---|---|---|
| Proba. | Payoff | Proba. | Payoff | Proba. | Payoff | Proba. | Payoff | |
| 1 | 10% | €7 | 90% | €5 | 10% | €13 | 90% | €0 |
| 2 | 20% | €7 | 80% | €5 | 20% | €13 | 80% | €0 |
| 3 | 30% | €7 | 70% | €5 | 30% | €13 | 70% | €0 |
| 4 | 40% | €7 | 60% | €5 | 40% | €13 | 60% | €0 |
| 5 | 50% | €7 | 50% | €5 | 50% | €13 | 50% | €0 |
| 6 | 60% | €7 | 40% | €5 | 60% | €13 | 40% | €0 |
| 7 | 70% | €7 | 30% | €5 | 70% | €13 | 30% | €0 |
| 8 | 80% | €7 | 20% | €5 | 80% | €13 | 20% | €0 |
| 9 | 90% | €7 | 10% | €5 | 90% | €13 | 10% | €0 |
| 10 | 100% | €7 | 0% | €5 | 100% | €13 | 0% | €0 |
| Decisions | Option A: urn A | Option B: urn B | ||
|---|---|---|---|---|
| In urn A, the Distribution of | In urn B, the Distribution | |||
| Balls Is 5 Black and 5 White | of Balls Is Not Known | |||
| Chosen Color | Chosen Color | Chosen Color | Chosen Color | |
| Obtained | Not Obtained | Obtained | Not Obtained | |
| 1 | €13 | €0 | €9 | €0 |
| 2 | €12 | €0 | €9 | €0 |
| 3 | €11 | €0 | €9 | €0 |
| 4 | €10 | €0 | €9 | €0 |
| 5 | €9 | €0 | €9 | €0 |
| 6 | €8 | €0 | €9 | €0 |
| 7 | €7 | €0 | €9 | €0 |
| 8 | €6 | €0 | €9 | €0 |
| 9 | €4 | €0 | €9 | €0 |
| 10 | €2 | €0 | €9 | €0 |
Appendix C. Pairwise Pearson Correlations Estimations
| Categ. | Categ. | Midpoint | Midpoint | NSC | NRC | |
|---|---|---|---|---|---|---|
| (Risk) | (amb.) | (Risk) | (amb.) | |||
| Categ. (risk) | 1.000 | |||||
| Categ. (amb) | 0.236 | 1.000 | ||||
| Midpoint (risk) | 0.679 * | 0.047 | 1.000 | |||
| Midpoint (amb.) | −0.753 * | −0.033 | −0.989 * | 1.000 | ||
| NSC | 0.711 * | 0.048 | 0.977 * | −0.989 * | 1.000 | |
| NRC | 0.100 | 0.851 * | 0.089 | −0.085 | 0.134 | 1.000 |
Appendix D. Additional Results for Crops and Yields
Appendix E. Additional Results for Synthetic Nitrogen Fertilization

Appendix F. Socio-Demographic Characteristics
| Variables | % of Respondents |
|---|---|
| Gender | |
| Male | 97.6% |
| Marital status | |
| Divorced | 2.5% |
| Married | 45% |
| PACS | 10% |
| Single | 42.5% |
| Education level | |
| Middle school certificate | 17.95% |
| Agricultural school certificate | 2.56% |
| Agricultural technic diploma | 2.56% |
| Bac | 23.08% |
| Bac +2 | 41.03% |
| Bac +3 | 7.69% |
| Bac +4 | 2.56% |
| Bac +5 | 2.56% |
| Revenue ranges (/month) | |
| <1000 | 8.11% |
| [1000, 1500[ | 24.32% |
| [1500, 2000[ | 10.81% |
| [2000, 2500[ | 21.62% |
| [2500, 3000[ | 10.81% |
| >3000 | 24.32% |
| Average age (year) | |
| 45.3 | |
| Average number of people in the household | |
| 1.652 | |
| Average number of children | |
| 1.88 | |
Appendix G. Additional Results for the Regressions
| VARIABLES | ||||||||
|---|---|---|---|---|---|---|---|---|
| Risk-loving | −28.25 | |||||||
| (54.07) | (41.58) | |||||||
| Risk-averse | −58.16 | −48.84 ** | ||||||
| (41.43) | (19.57) | |||||||
| Ambiguity-loving | −12.25 | 18.80 | ||||||
| (32.17) | (28.91) | |||||||
| Ambiguity-averse | −30.70 | −14.52 | ||||||
| (37.48) | (40.08) | |||||||
| NSC | 3.754 | 6.827 | ||||||
| (6.278) | (4.775) | |||||||
| NRC | −3.424 | −6.235 | ||||||
| (6.794) | (6.461) | |||||||
| Constant | 191.2 *** | 186.9 *** | 157.4 *** | 142.4 *** | 122.7 *** | 103.5 *** | 162.6 *** | 177.0 *** |
| (38.24) | (8.863) | (22.75) | (25.72) | (39.03) | (34.51) | (36.34) | (33.83) | |
| Weighting (crop) | No | Yes | No | Yes | No | Yes | No | Yes |
| Clustering (cooperative) | No | No | No | No | No | No | No | No |
| Observations | 31 | 31 | 31 | 31 | 31 | 31 | 31 | 31 |
| R-squared | 0.074 | 0.047 | 0.023 | 0.031 | 0.012 | 0.042 | 0.009 | 0.030 |
| F | 1.121 | 3.595 | 0.336 | 0.610 | 0.357 | 2.045 | 0.254 | 0.931 |
| p-Fisher | 0.340 | 0.0408 | 0.717 | 0.550 | 0.555 | 0.163 | 0.618 | 0.342 |
| VARIABLES | ||||||||
|---|---|---|---|---|---|---|---|---|
| Risk-loving | 1.750 | 1.825 | ||||||
| (19.35) | (6.614) | |||||||
| Risk-averse | −4.310 | |||||||
| (14.82) | (6.873) | |||||||
| Ambiguity-loving | 6.471 | |||||||
| (8.682) | (8.172) | |||||||
| Ambiguity-averse | 3.762 | 4.886 | ||||||
| (10.11) | (12.61) | |||||||
| NSC | 0.732 | 1.529 | ||||||
| (2.171) | (1.567) | |||||||
| NRC | 2.094 | 1.422 | ||||||
| (1.796) | (2.005) | |||||||
| Constant | 51.2 5 *** | 53.14 *** | 48.67 *** | 45.44 *** | 47.07 *** | 41.02 *** | 37.76 *** | 41.08 *** |
| (13.68) | (3.747) | (6.139) | (6.655) | (13.50) | (10.77) | (9.606) | (10.03) | |
| Weighting (crop) | No | Yes | No | Yes | No | Yes | No | Yes |
| Clustering (cooperative) | No | No | No | No | No | No | No | No |
| Observations | 31 | 31 | 31 | 31 | 31 | 31 | 31 | 31 |
| R-squared | 0.001 | 0.009 | 0.019 | 0.019 | 0.004 | 0.020 | 0.045 | 0.018 |
| F | 0.00873 | 0.318 | 0.277 | 0.315 | 0.114 | 0.953 | 1.360 | 0.503 |
| p-Fisher | 0.991 | 0.730 | 0.760 | 0.732 | 0.738 | 0.337 | 0.253 | 0.484 |
References
- CITEPA. Inventaire SECTEN; CITEPA: Paris, France, 2019. [Google Scholar]
- Pellerin, S.; Bamière, L.; Angers, D.; Béline, F.; Benoit, M.; Butault, J.; Chenu, C.; Colnenne-David, C.; de Cara, S.; Delame, N.; et al. Quelle Contribution de L’agriculture Française à la Réduction des émissions de gaz à Effet de Serre? Potentiel d’atténuation et coût de dix Actions Techniques; Technical Report hal-01186943; INRA: Paris, France, 2013. [Google Scholar]
- Pope, R.; Kramer, R. Production uncertainty and factor demands for the competitive firm. South. Econ. J. 1979, 46, 489–502. [Google Scholar] [CrossRef][Green Version]
- Moschini, G.; Hennessy, D. Uncertainty, risk aversion, and risk management for agricultural producers. In Handbook of Agricultural Economics, 1st ed.; Gardner, B.L., Rausser, G.C., Eds.; Elsevier: Amsterdam, The Netherlands, 2001; Volume 1, pp. 88–153. [Google Scholar]
- Roosen, J.; Hennessy, D. Tests for the role of risk aversion on input use. Am. J. Agric. Econ. 2003, 85, 30–43. [Google Scholar] [CrossRef]
- Leathers, H.; Quiggin, J. Interactions between agricultural and resource policy: The Importance of attitudes toward risk. Am. J. Agric. Econ. 1991, 73, 757–764. [Google Scholar] [CrossRef]
- Stuart, D.; Schewe, R.; McDermott, M. Reducing nitrogen fertilizer application as a climate change mitigation strategy: Understanding farmer decision-making and potential barriers to change in the US. Land Use Policy 2014, 36, 210–218. [Google Scholar] [CrossRef]
- Sheriff, G. Efficient waste? Why farmers over-apply nutrients and the implications for policy design. Appl. Econ. Perspect. Policy 2005, 27, 542–557. [Google Scholar] [CrossRef]
- Bontems, P.; Thomas, A. Information value and risk premium in agricultural production: The case of split nitrogen application for corn. Am. J. Agric. Econ. 2000, 82, 59–70. [Google Scholar] [CrossRef]
- Dequiedt, B.; Servonnat, E. Risk as a Limit or an Opportunity to Mitigate GHG Emissions? The Case of Fertilisation in Agriculture; Working Papers 1606; Chaire Economie du Climat: Paris, France, 2016; pp. 1–48. [Google Scholar]
- Gandorfer, M.; Pannell, D.; Meyer-Aurich, A. Analyzing the effects of risk and uncertainty on optimal tillage and nitrogen fertilizer intensity for field crops in Germany. Agric. Syst. 2011, 104, 615–622. [Google Scholar] [CrossRef]
- Monjardino, M.; McBeath, T.; Ouzman, J.; Llewellyn, R.; Jones, B. Farmer risk-aversion limits closure of yield and profit gaps: A study of nitrogen management in the southern Australian wheatbelt. Agric. Syst. 2015, 137, 108–118. [Google Scholar] [CrossRef]
- Meyer-Aurich, A.; Karatay, Y.N. Effects of uncertainty and farmer’s risk aversion on optimal N fertilizer supply in wheat production in Germany. Agric. Syst. 2019, 173, 130–139. [Google Scholar] [CrossRef]
- Meyer-Aurich, A.; Karatay, Y.N.; Nausediene, A.; Kirschke, D. Effectivity and cost-efficiency of a tax on nitrogen fertilizer to reduce GHG emissions from agriculture. Atmosphere 2020, 11, 607. [Google Scholar] [CrossRef]
- Wu, H.; Hao, H.; Lei, H.; Ge, Y.; Shi, H.; Song, Y. Farm size, risk aversion and overuse of fertilizer: The heterogeneity of large-scale and small-scale wheat farmers in Northern China. Land 2021, 10, 111. [Google Scholar] [CrossRef]
- Qiao, F.; Huang, J. Farmer’s risk preference and fertilizer use. J. Integr. Agric. 2021, 20, 1987–1995. [Google Scholar] [CrossRef]
- Binswanger, H. Attitudes toward risk: Experimental measurement in rural India. Am. J. Agric. Econ. 1980, 62, 395–407. [Google Scholar] [CrossRef]
- Eckel, C.; Grossman, P. Forecasting risk attitudes: An experimental study using actual and forecast gamble choices. J. Econ. Behav. Organ. 2008, 68, 1–7. [Google Scholar] [CrossRef]
- Holt, C.; Laury, S. Risk aversion and incentive effects. Am. Econ. Rev. 2002, 92, 1644–1655. [Google Scholar] [CrossRef]
- Reynaud, A.; Couture, S. Stability of risk preference measures: Results from a field experiment on French farmers. Theory Decis. 2012, 73, 203–221. [Google Scholar] [CrossRef]
- Bocquého, G.; Jacquet, F.; Reynaud, A. Expected utility or prospect theory maximisers? Assessing farmers’ risk behaviour from field-experiment data. Eur. Rev. Agric. Econ. 2014, 41, 135–172. [Google Scholar] [CrossRef]
- Chakravarty, S.; Roy, J. Recursive expected utility and the separation of attitudes towards risk and ambiguity: An experimental study. Theory Decis. 2009, 66, 199–228. [Google Scholar] [CrossRef]
- Bougherara, D.; Gassmann, X.; Piet, L.; Reynaud, A. Structural estimation of farmers’ risk and ambiguity preferences: A field experiment. Eur. Rev. Agric. Econ. 2017, 44, 782–808. [Google Scholar] [CrossRef]
- Akay, A.; Martinsson, P.; Medhin, H.; Trautmann, S. Attitudes toward uncertainty among the poor: An experiment in rural Ethiopia. Theory Decis. 2012, 73, 453–464. [Google Scholar] [CrossRef]
- Ghadim, A.; Pannell, D.; Burton, M. Risk, uncertainty, and learning in adoption of a crop innovation. Agric. Econ. 2005, 33, 1–9. [Google Scholar] [CrossRef]
- Cotty, T.L.; d’Hôtel, E.M.; Soubeyran, R.; Subervie, J. Linking risk aversion, time preference and fertiliser use in Burkina Faso. J. Dev. Stud. 2018, 54, 1991–2006. [Google Scholar] [CrossRef]
- Hellerstein, D.; Higgins, N.; Horowitz, J. The predictive power of risk preference measures for farming decisions. Eur. Rev. Agric. Econ. 2013, 40, 807–833. [Google Scholar] [CrossRef]
- Liu, E. Time to change what to sow: Risk preferences and technology adoption decisions of cotton farmers in China. Rev. Econ. Stat. 2013, 95, 1386–1403. [Google Scholar] [CrossRef]
- Engle-Warnick, J.; Escobal, J.; Laszlo, S. Ambiguity Aversion as a Predictor of Technology Choice: Experimental Evidence from Peru; Scientific Publications 2007s-01; CIRANO: Montreal, QC, Canada, 2007; pp. 1–41. [Google Scholar]
- Barham, B.; Chavas, J.; Fitz, D.; Salas, V.; Schechter, L. The roles of risk and ambiguity in technology adoption. J. Econ. Behav. Organ. 2014, 97, 204–218. [Google Scholar] [CrossRef]
- Brunette, M.; Cabantous, L.; Couture, S.; Stenger, A. The impact of governmental assistance on insurance demand under ambiguity: A theoretical model and an experimental test. Theory Decis. 2013, 75, 153–174. [Google Scholar] [CrossRef]
- Klibanoff, P.; Marinaci, M.; Mukerji, S. A smooth model of decision making under ambiguity. Econometrica 2005, 73, 1849–1892. [Google Scholar] [CrossRef]
- Beattie, J.; Loomes, G. The impact of incentives upon risky choice experiments. J. Risk Uncertain. 1997, 14, 155–168. [Google Scholar] [CrossRef]
- Camerer, C.; Hogarth, R. The effects of financial incentives in experiments: A review and capital-labor-production framework. J. Risk Uncertain. 1999, 1, 7–42. [Google Scholar] [CrossRef]
- Battalio, R.; Kagel, J.; Jiranyakul, K. Testing between alternative models of choice under uncertainty: Some initial results. J. Risk Uncertain. 1990, 3, 25–50. [Google Scholar] [CrossRef]
- Wik, M.; Kebede, T.; Bergland, O.; Holden, S. On the measurement of risk aversion from experimental data. Appl. Econ. 2004, 36, 2443–2451. [Google Scholar] [CrossRef]
- Dohmen, T.; Falk, A.; Huffman, D.; Sunde, U.; Schupp, J.; Wagner, G. Individual risk attitudes: Measurement, determinants, and behavioral consequences. J. Eur. Econ. Assoc. 2011, 9, 522–550. [Google Scholar] [CrossRef]
- Ministère de l’Agriculture et de l’Alimentation (MAA). Agreste, La Statistique, l’Evaluation et la Prospective Agricole; MAA: Paris, France, 2019.
- Feinerman, E.; Choi, E.; Johnson, S. Uncertainty and split nitrogen application in corn production. Am. J. Agric. Econ. 1990, 72, 975–985. [Google Scholar] [CrossRef]
- INSEE. Tableaux de l’economie Francaise; INSEE: Paris, France, 2018. [Google Scholar]
- White, H. A heteroskedasticity-consistent covariance matrix estimator and a direct test for heteroskedasticity. Econometrica 1980, 48, 817–838. [Google Scholar] [CrossRef]
- Horowitz, J.; Lichtenberg, E. Risk-reducing and risk-increasing effects of pesticides. J. Agric. Econ. 1994, 45, 82–89. [Google Scholar] [CrossRef]
- Drichoutis, A.; Lusk, J. What can multiple price lists really tell us about risk preferences? J. Risk Uncertain. 2016, 53, 89–106. [Google Scholar] [CrossRef]
- Tanaka, T.; Camerer, C.; Nguyen, Q. Risk and time preferences: Linking experimental and household survey data from Vietnam. Am. Econ. Rev. 2010, 100, 557–571. [Google Scholar] [CrossRef]
- Kahneman, D.; Tversky, A. Prospect theory: An analysis of decision under risk. Econometrica 1979, 47, 263–291. [Google Scholar] [CrossRef]
- Lauriola, M.; Levin, I. Relating individual differences in attitude toward ambiguity and risky choices. J. Behav. Decis. Mak. 2001, 14, 107–122. [Google Scholar] [CrossRef]
- Brunette, M.; Cabantous, L.; Couture, S. Are individuals more risk and ambiguity averse in a group environment or alone? Results from an experimental study. Theory Decis. 2015, 78, 357–376. [Google Scholar] [CrossRef]
| Number of Safe Choices | Bounds for Relative Risk Aversion | Classification |
|---|---|---|
| 0 and 1 | Highly risk-loving | |
| 2 | Very risk-loving | |
| 3 | Risk-loving | |
| 4 | Risk-neutral | |
| 5 | Slightly risk-averse | |
| 6 | Risk-averse | |
| 7 | Very risk-averse | |
| 8 | Highly risk-averse | |
| 9 and 10 | Stay in bed |
| Number of Risky Choices | Bounds for Relative Ambiguity Aversion | Classification |
|---|---|---|
| 0 | Extremely ambiguity-loving | |
| 1 | Highly ambiguity-loving | |
| 2 | Very ambiguity-loving | |
| 3 | Ambiguity-loving | |
| 4 | Slightly ambiguity-loving | |
| 5 | Ambiguity-neutral | |
| 6 | Slightly ambiguity-averse | |
| 7 | Ambiguity-averse | |
| 8 | Very ambiguity-averse | |
| 9 | Highly ambiguity-averse | |
| 10 | Extremely ambiguity-averse |
| Ambiguity | ||||
|---|---|---|---|---|
| Risk | Inclination | Neutrality | Aversion | Total |
| Inclination | 2 | 1 | 1 | 4 |
| % row | 50 | 25 | 25 | 100 |
| % column | 15.38 | 7.69 | 12.50 | 11.76 |
| Neutrality | 2 | 2 | 0 | 4 |
| % row | 50 | 50 | 0 | 100 |
| % column | 15.38 | 15.38 | 0 | 11.76 |
| Aversion | 9 | 10 | 7 | 26 |
| % row | 34.62 | 38.46 | 26.92 | 100 |
| % column | 69.23 | 76.92 | 87.50 | 76.47 |
| Total | 13 | 13 | 8 | 34 |
| % row | 38.24 | 38.24 | 23.53 | 100 |
| % column | 100 | 100 | 100 | 100 |
| VARIABLES | ||||
|---|---|---|---|---|
| Risk-loving | −50.60 | |||
| (49.03) | ||||
| Risk-averse | −48.84 *** | |||
| (5.471) | ||||
| Ambiguity-loving | 18.80 | |||
| (14.96) | ||||
| Ambiguity-averse | −14.52 | |||
| (21.10) | ||||
| NSC | 6.827 | |||
| (5.393) | ||||
| NRC | −6.235 | |||
| (4.430) | ||||
| Constant | 186.9 *** | 142.4 *** | 103.5 * | 177.0 *** |
| (4.501) | (8.803) | (35.30) | (22.89) | |
| Weighting (crop) | Yes | Yes | Yes | Yes |
| Clustering (cooperative) | Yes | Yes | Yes | Yes |
| Observations | 31 | 31 | 31 | 31 |
| R-squared | 0.047 | 0.031 | 0.042 | 0.030 |
| F | 117.5 | 1.590 | 1.603 | 1.982 |
| p-Fisher | 0.00142 | 0.338 | 0.295 | 0.254 |
| VARIABLES | ||||
|---|---|---|---|---|
| Risk-loving | 1.825 | |||
| (7.242) | ||||
| Risk-averse | −4.310 | |||
| (5.037) | ||||
| Ambiguity-loving | 6.471 | |||
| (6.882) | ||||
| Ambiguity-averse | 4.886 | |||
| (2.738) | ||||
| NSC | 1.529 | |||
| (1.198) | ||||
| NRC | 1.422 * | |||
| (0.527) | ||||
| Constant | 53.14 *** | 45.44 *** | 41.02 *** | 41.08 *** |
| (4.580) | (2.332) | (6.668) | (4.301) | |
| Weighting (crop) | Yes | Yes | Yes | Yes |
| Clustering (cooperative) | Yes | Yes | Yes | Yes |
| Observations | 31 | 31 | 31 | 31 |
| R-squared | 0.009 | 0.019 | 0.020 | 0.018 |
| F | 0.537 | 8.685 | 1.628 | 7.282 |
| p-Fisher | 0.632 | 0.0565 | 0.292 | 0.0739 |
Publisher’s Note: MDPI stays neutral with regard to jurisdictional claims in published maps and institutional affiliations. |
© 2021 by the authors. Licensee MDPI, Basel, Switzerland. This article is an open access article distributed under the terms and conditions of the Creative Commons Attribution (CC BY) license (https://creativecommons.org/licenses/by/4.0/).
Share and Cite
Tevenart, C.; Brunette, M. Role of Farmers’ Risk and Ambiguity Preferences on Fertilization Decisions: An Experiment. Sustainability 2021, 13, 9802. https://doi.org/10.3390/su13179802
Tevenart C, Brunette M. Role of Farmers’ Risk and Ambiguity Preferences on Fertilization Decisions: An Experiment. Sustainability. 2021; 13(17):9802. https://doi.org/10.3390/su13179802
Chicago/Turabian StyleTevenart, Camille, and Marielle Brunette. 2021. "Role of Farmers’ Risk and Ambiguity Preferences on Fertilization Decisions: An Experiment" Sustainability 13, no. 17: 9802. https://doi.org/10.3390/su13179802
APA StyleTevenart, C., & Brunette, M. (2021). Role of Farmers’ Risk and Ambiguity Preferences on Fertilization Decisions: An Experiment. Sustainability, 13(17), 9802. https://doi.org/10.3390/su13179802


