Abstract
Groundwater availability, utilization, sustainability, and climate change implications were assessed at regional and provincial scales of Canada. It remains an unexplored resource, estimated to be renewing between 380 and 625 km3/year. However, the provinces have initiated developing their quantitative and qualitative databases for their accurate inventory. Sustainable groundwater availability at the national scale was estimated as 19,832 m3/person/year (750 km3/year), with high regional variations ranging from 3949 in the densely populated Prince Edward Island (PEI) province to 87,899 in the thinly populated Newfoundland and Labrador (NFL). It fulfills 82%, 43%, and 14% of water requirements of the rural population, irrigation, and industry, respectively. It is the potable water source for more than 9 million people countrywide (24% of the population), and provinces of Quebec, and Ontario (1.3 million people), and PEI (0.15 million people) particularly depend on it. It is mostly a free or nominally charged commodity, but its utilization was found to be well under sustainable limits (40% of recharge) at the provincial scales, i.e., under 4% for all the provinces except New Brunswick (NB), which also had just 8% extraction of sustainable availability. Nevertheless, localized issues of quantitative depletion and qualitative degradation were found at scattered places, particularly in Ontario and Quebec. Climate change impacts of warming and changing precipitations on groundwater underscored its stability with some temporal shifts in recharge patterns. In general, increased recharge in late winters and springs was observed due to reduced frost and more infiltration, and was somewhat decreasing in summers due to more intense rainfall events.
1. Introduction
Canada has one of the world’s largest renewable water resource availability estimated at 3478 km3/year during 1971–2013, i.e., almost 7% of the global renewable water [1]. With a sparse population of just 38 million people (Figure 1) in 2021 [2], Canada has freshwater availability of 91,526 m3/person/year, one of the highest in the world. On a broader scale, Canada can be divided into four regions excluding territories, namely, West Coast (British Columbia), Prairies (Alberta, Saskatchewan, and Manitoba), Central Canada (Ontario and Quebec), and Atlantic Canada (Newfoundland and Labrador, New Brunswick, Nova Scotia, and Prince Edward Island), as depicted in Figure 1a [3].
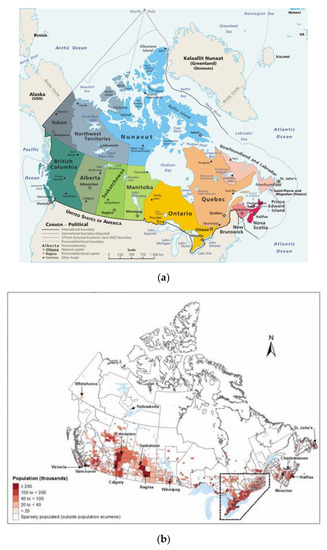
Figure 1.
Geography of Canada (a) and population distribution (b) [3,4].
Renewable water originates from precipitation, which bears a lot of spatial variabilities, as shown in Figure 2 [5], and precipitation types are somewhat different in different regions. The Prairies and Central regions receive convective precipitation; it is frontal in the Atlantic region and orographic in the West Coast region. Average precipitation during 1961–1990 was 535 mm/year, which generated 0.35 m3 of freshwater per m2 of geographical area, on average. Precipitation and population variabilities (Figure 1 and Figure 2), however, make some parts more water-rich than others. Precipitation is the highest in the West Coast region (British Columbia), i.e., up to 3000 mm/year, but it sharply decreases as we move away from the coast inland, presumably because of the rain shadow effects of the West Coast Mountains. In northeastern British Columbia (BC), major precipitation occurs during summer as rainfall, whereas in the lower mainland of southwestern BC, it is in winter as rainfall. The Prairies (Alberta, Saskatchewan, and Manitoba) are drier and this region receives the least precipitation, around 454 mm/year, due to its location under the shadow of the Rocky Mountains and being away from moisture sources. Its southern parts are the driest. The rainfall and snowfall contributions here are 70% and 30%, respectively. About a quarter of precipitation is in drizzle form, whereas 19% is in events of more than 25 mm. The central region (Ontario and Quebec) receives 800 to 1000 mm; however, its spatial variation is very high, i.e., 400–600 mm in the northern parts and 800–1200 mm in the southern parts. Atlantic Canada (Newfoundland and Labrador, New Brunswick, Nova Scotia, and Prince Edward Island) receives 883 to 1199 mm. East coastal regions are the wettest with a westward reduction of 40 mm/100 km. Southern parts receive about 70% precipitation as rainfall, whereas in northern parts, snowfall and rainfall contributions are equal. Precipitation here is evenly distributed throughout the year [1].
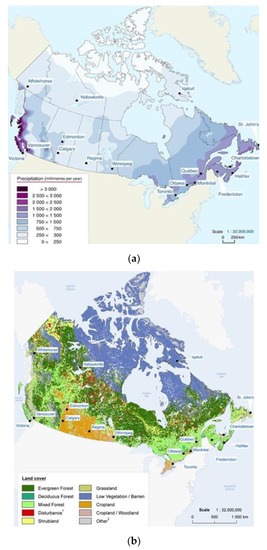
Figure 2.
Spatial distribution of precipitation (a) and land use (b) in Canada [5].
Climate change is impacting precipitation, as a nine-year moving average analysis of the past 65 years reveals that precipitation has been gradually increasing in Canada. Several studies testified to the increasing precipitation trend and its spatial variability in the 20th century. However, climate change impacts on precipitation are not evenly distributed as most parts are becoming wetter, but some parts are becoming drier, as well. Average precipitation increased since the 1950s from under 500 to around 600 mm/year, with up to 10% reduction in the Prairies and up to 35% increase in the northern and southern parts. As global atmospheric concentrations of GHG are and will continue to increase in the 21st century, it is anticipated that total precipitation as well as intensity and frequency of extreme events will increase. Numerous studies project intense and frequent daily and multi-day precipitation events for most Canadian regions; intensity would particularly increase in Northern Canada. In addition, more heatwaves, declined cold extremes and frost days, elongated growing season, and increased snowpack along the Arctic Rim are expected [1].
Forests occupy most of Canadian land (38%), i.e., around 374 million hectares (Mha), which becomes 9% of the world’s forests. It is evident from Figure 2b that some of the forested areas have been disturbed due to forest fires, cutting, etc.; even then, forests exhibit stability over time. Croplands are mostly concentrated in the Prairies, somewhat in southern parts of the central regions, and the PEI province of Atlantic region. Minimum scaled croplands can be found throughout Canada. It is, however, interesting to note that the driest part (Prairies) is the home of the maximum croplands. As explained before, the Prairies receive the least precipitation and are becoming drier under climate change. Rainfed agriculture there is likely to be affected badly if supplemental irrigation arrangements are not provided. It would put more pressure on the groundwater resources. Northern regions around the Arctic remain occupied under snow, and therefore, have the least population or activity [5,6].
Groundwater is a major and reliable source of fresh water for many regions around the world [7], including Canada. It is a potable water source for 2 billion people across the globe, fulfills 40% of irrigation requirements, and maintains a healthy ecosystem [8,9,10]. The amount of annual recharge determines the renewable groundwater of any region, and the rest are just exhaustible resources. The hydrogeology of Canada is predominantly glacially derived as it was entirely covered with glaciers in the Pleistocene age. The surficial deposits are mostly unconsolidated material, some of which were directly deposited by ice, others, by running water and standing meltwater. Therefore, it also has extensive alluvial deposits (water-driven) and lesser eolian deposits (wind-driven). Glacial deposits compose tills (clay, silt, and sand) and clays, extending up to 25 m deep, as well as eskers, kames, and outwash deposits. Alluvial deposit aquifers are fewer, but have better yields than glacial ones. Overall, all those highly variable and irregular glacial materials form many best near-surface aquifers, which can meet water supply requirements of local municipalities and industries [11].
According to Gleick, renewable groundwater in Canada is 380 km3/year, thereby contributing almost 10,000 m3/person/year to the freshwater supply [12]. The estimate seems quite conservative, as another global-scale groundwater recharge modeling study evaluates it at around 625 km3/year [13]. It strengthens the notion that actual renewable groundwater might be more as it mostly remains an unexplored resource, and groundwater data are scarce [14], and the nature and extent of groundwater are not accurately known thereof. Provinces have initiated gathering information about abstractions, water quality, and quantity. Nevertheless, there is minimal evidence of groundwater mining and qualitative depletion of groundwater, except near a few concentrated population regions to date [15].
Proper management of groundwater resources is vitally important to ensure the sustainability of their dependent communities. Limiting groundwater abstraction within certain limits, much below recharge, ensures sustainable groundwater [7]. Regional and global depletion of groundwater has been reported for many large aquifers due to unsustainable abstraction. It has been estimated that about 1.7 billion people worldwide are under the threat of unsustainable groundwater. However, the groundwater depletion is mostly concentrated for some large aquifer systems of Asia and North America and thus poses a serious threat to the sustainability of agriculture there [16]. Groundwater regulations are in place at the provincial levels in Canada but vary from province to province. The regulatory acts and bodies regulate licenses specifying rate, quantity, duration, and time of use, and often include the purpose of extraction. In British Columbia, there was no groundwater regulation until 2016, when the Water Sustainability Act came into force; it is the last province to implement regulation and is still in promulgation state. In Alberta, licensing of wells was initiated in 1962 under the Water Act of Alberta Environment. The consumer must report the location, source, and purpose of extraction to obtain a license. In Saskatchewan, wells licensing has been in place since 1959, whereas Saskatchewan Environment, Saskatchewan Water Corporation, and the Saskatchewan Watershed Authority are the regulators. Reporting has been mandatory since 2004. In Manitoba, the Department of Water Stewardship is the groundwater regulator, which initiated licensing in 1972 under the Water Rights Act: a well with a daily discharge capacity of 25 m3 or more requires a permit, and reporting is mandatory. In Ontario, the Ministry of Environment (MoE) is the regulator, which has been issuing licenses since 1961 under the Water Resources Act. The annual water use report is submitted by MoE. Quebec has been issuing licenses since 2004 under the Environmental Quality Act. The Ministry of Development and Environment is the regulator, and standard reporting is required. In New Brunswick, the Ministry of Environment and Local Government regulates licenses to wells over certain limits under the Clean Water Act and the Clean Environment Act with proper reporting. In Newfoundland and Labrador, the Department of Environment and Conservation regulates wells under the Water Resources Act since 2002. In Nova Scotia, the Department of Environment and Labour is the regulator, issuing licenses under the Environment Act since 1973. In Prince Edward Island, the Department of Environment, Energy and Climate Action issues wells licenses under Water Extraction Permitting Policy and Water Wells Regulations. Reporting of well is mandatory to obtain a license [17].
Canada is impacted by climate change in terms of warming, changing precipitation patterns, seasonal shifts, thawing permafrost, sea-level rise, accelerated snow and ice melt leading to extra exposure to solar radiation, etc. [18,19]. All this is affecting the hydrologic cycle, i.e., the amount of water that reaches the surface, evaporates, or transpires back to the atmosphere, becomes stored as snow or ice, infiltrates into the groundwater system, runs off the land, and ultimately runs to streams and rivers [20]. The temperature rise and extra exposure to solar radiation have increased evaporative stress, giving rise to high evapotranspiration (ET) and diminishing renewable water resources (Precipitation–ET), including groundwater. Similarly, changes in precipitation have affected groundwater availability, e.g., a decrease in precipitation in some places (Prairies) has decreased groundwater recharge, but increased precipitation (Northern and Southern Canada) has not essentially increased recharge. It is so because increased precipitation mostly affected overland flows and streamflows, particularly under the observed trends of high intensity, low duration. Seasonal shifts have also affected recharge distribution; more recharge was observed during early winters and springs due to reduced frost and more infiltration, and somewhat lesser in summers due to more intense rainfall events. Accelerated snow and ice melt have increased streamflows and groundwater recharge in the short term in some places but would cause a significant decline in the long term. Sea level rise has contaminated a few coastal aquifers and thus reduced groundwater availability. Thawing permafrost increased soil infiltration and groundwater recharge thereof but a net positive effect in recharge was found at places where a proportionate increase in precipitation was more than ET [18,19,20]. Moreover, the rising population and its regional concentration further increased freshwater demands. Region-wise details are given in the results and discussion section.
Sustainable groundwater management can be achieved if regional groundwater databases are developed having information such as annual recharge, etc., and if its proper regulation is ensured. This paper explores the regional and provincial distribution of groundwater, its withdrawal, and sustainability aspects under the changing climate. The novelty of the article is that it integrates information scattered in government reports and scientific publications to better understand groundwater and climate change impacts on it. Specific research questions explored under the study are: what are the provincial government’s interventions and regulations on groundwater management? What is the estimated renewable groundwater in different provinces? Is its utilization under sustainable limits? How would climate change impact groundwater recharge and availability?
2. Materials and Methods
The paper is a comprehensive review of groundwater situations in different provinces of Canada. Information was gathered and integrated from different reports of the governments and research papers. The provincial government’s websites mostly contained the requisite information. Scientific publications were explored via Google Scholar. Around 80 reports and publications were initially short-listed and reviewed; however, some of those that had redundant information were excluded from the study. The presented data have been verified from more than one source.
Regional analysis of groundwater was spatially segregated at a larger scale as follows. West Coast: British Columbia (BC); Prairies: Alberta (AB), Saskatchewan (SK), and Manitoba (MB); Central Canada: Ontario (ON) and Quebec (QC); and Atlantic Canada: Nova Scotia (NS), New Brunswick (NB), Prince Edward Island (PEI), Newfoundland, and Labrador (NL). Nevertheless, individualistic provincial situations are presented. The information is graphically presented to better grasp regional variations and discussed in comparison to the sustainable limits.
The basis of groundwater estimations is weighted average precipitation in each province for the period 1971–2000 as a benchmark [3]. Specifically, contoured precipitations within provincial boundaries were multiplied with their respective areas and added together to estimate freshwater availabilities, wherein groundwater recharge is taken as 20% of precipitation, of which 40% is regarded as sustainable availability.
Global-scale modeling of groundwater recharge for the climate normal 1961–1990 indicates it for Canada as 625 km3/year. Moreover, the same study estimates a worldwide groundwater recharge as 32% of renewable water, but the North American average is around 25%, and permafrost regions, which mostly include Canada, are even lower. Therefore, groundwater recharge has been taken as 20% of precipitation, while the rest are considered ET losses [13]. The recharge phenomena would be somewhat different in different parts of Canada; however, the paper overviews spatial distribution to understand sustainability implications in a broader context.
Sustainable groundwater availability is the amount of water that can be pumped for an infinite time without causing unacceptable environmental, economic, or social consequences [21]. How much groundwater is sustainably available varies from place to place and cannot be simply calculated as a single value using the water balance. It depends on how pumping would affect the surrounding environment such as streamflows, ET, etc. Nevertheless, a fraction of natural recharge in a groundwater basin can be sustainably extracted [7,21]. Groundwater regulations in different provinces of Canada are different but the least is for PEI, which allows extraction of merely 20% of recharge due to the high dependency of streamflows on groundwater [22]. Therefore, sustainable groundwater availability is taken as 40% of recharge, considering existent regulations, and worldwide norms [1,7].
Groundwater utilization data were ascertained from Statistics Canada and provincial groundwater dependencies reported by Nowlan [15]. Utilization is compared with sustainable groundwater availability to determine its sustainability implications. Groundwater quality issues emerging and reported in different parts of Canada have also been included, as water quality is inextricably linked with availability. Results are discussed in light of governmental findings and concerns for rational situational analysis. Climate change impacts on groundwater in the recent past and prospective predictions are also reviewed.
3. Results and Discussion
Groundwater is a major source of fresh water in Canada and about 9 million people (30% population) depend on it for potable water. It is fulfilling 82%, 43%, and 14% of the water requirements of the rural population, irrigation, and industry, respectively, at the national scale [15,18]. Regional use of groundwater varies considerably across Canada as it fulfills municipal purposes in Ontario, Prince Edward Island, New Brunswick, and the Yukon; livestock watering in Alberta, Saskatchewan, and Manitoba; serves industrial purposes in British Columbia, Québec, and the Northwest Territories; and feeds domestic wells in Newfoundland and Nova Scotia. Non-uniform distribution of water resources considerably increases dependence on groundwater. Most of the groundwater is extracted from shallow aquifer depths of 20–100 m, up to a maximum depth of 200 m. This is because shallow groundwater is easy to extract and is of good quality [15]. Provincial distribution of sustainable groundwater availability (40% of recharge) and its respective populations is shown in Figure 3.
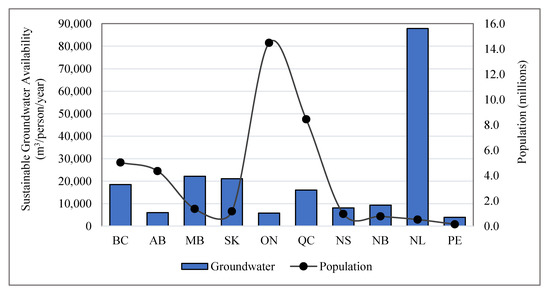
Figure 3.
Provincial distribution of sustainable groundwater availability and population [1].
Groundwater availability becomes 19,892 m3/person/year at the national scale as per the methodology explained in Section 2. This result seems justified, as that determined by Doll and Fiedler [13] in a global-scale groundwater recharge estimation for Canada was 20,366 m3/person/year, based on the population in 2000 [13]. The groundwater estimates (Figure 3) are almost double that of Gleick [12], which strengthens the notion that groundwater mostly remains an unexplored resource in Canada, and detailed investigations are needed for more rational estimates. It is evident from Figure 3 that populous provinces have relatively less per capita availability than thinly populated ones. Prince Edward Island, the most densely populated province, showed a sustainable groundwater availability of 3949 m3/person/year; in contrast, the least populated province NFL has 87,899 m3/person/year (Table 1). It provides good evidence that population concentrations significantly affect water availabilities. Thus, groundwater may be treated as a regional resource and its planning and management be performed at the local levels.

Table 1.
Regional and provincial situations of groundwater sustainability.
Groundwater mostly remains a free commodity in Canada as only six provinces and territories charge its extraction, including Manitoba, Saskatchewan, Nova Scotia, Yukon, Northwest Territories, and Nunavut, at a nominal cost of CAD 0.01–143.77/million liters. The provinces of Quebec, Ontario (1.3 million people), and PEI (0.15 million people) particularly depend on groundwater for potable supplies, PEI entirely depends on groundwater [15]. Figure 4 and Table 1 show the provincial groundwater availabilities and their utilization percentages.
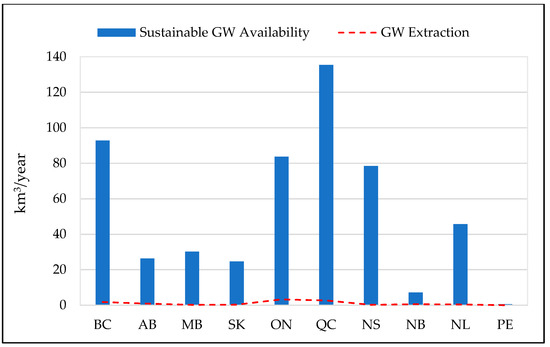
Figure 4.
Province-wise sustainable groundwater availability and utilization (km3) [1,15].
It is evident from the figure and the table that groundwater withdrawals are well under sustainable limits (40% of recharge) at the provincial levels. The highest groundwater use was found in the province of New Brunswick, and that too is an extraction around 8% of the sustainable availability. This presents an optimistic scenario that groundwater development and use in Canada is quite sustainable. The scenario may be misleading as it presents an overall picture of the provinces, nevertheless, localized groundwater issues of quantitative depletion and qualitative degradation are evident at different places, particularly in the provinces of Ontario, and Quebec, etc. Population concentrations, rising intersectoral demands, and climate change have posed risks to groundwater sustainability at several scattered places, as detailed in the subsequent section.
Climate change impacts all the hydrological regimes. Rising temperature directly affects key drivers of the hydrologic cycle, i.e., evaporation, and precipitation. According to Bhatti et al. [1], the average warming during the 20th century in Canada was 1.6 °C, which is higher than the global average. Spatially, southern, and western parts became warmer, and temporally winters were warmer than summers. Precipitation averagely increased from under 500 to around 600 mm/year but it reduced in drier Prairies up to 10% and increased up to 35% in northern and southern parts [1]. The climate change impacts on water resources systems can be grave, but relatively little is known about its impacts on groundwater. Internationally, a few studies have been undertaken on sensitivity analysis of the aquifers under the changing precipitation and runoff [23,24]. Groundwater recharge variations in aquifers have also been studied under the larger climatic patterns such as El Nino at a few places of the world [20], but not in Canada except a few places [25]. Such investigations are needed to demarcate the impacts of climate change on groundwater recharge, and behavior at local scales in Canada. An overview of groundwater situation and scenarios for different regions of Canada is presented in the subsequent sections.
3.1. West Coast
British Columbia is the third largest province in Canada. It is rich in natural resources, where water quality is somewhere the best in the world. There are four climatic regions here namely Pacific Coast, South BC Mountains, Yukon/North BC Mountains, and Northwest Forest [20]. There are over 900 developed aquifers in this province and about 22% of its people rely on groundwater [26], which makes up 10% of the total water supplies. There were no licensing requirements for groundwater abstraction up until 2014 for tubewells up to 75 L/s. There are more than 100,000 tubewells in the region and none had a license. The water allocation principle of “first in time, first in right” was followed, which resulted in water over-allocation [15,27].
The Water Sustainability Act of BC came into force on 29 February 2016 for the protection and efficient management of water resources in the province. Under the act, all non-domestic groundwater users including agricultural, industrial, commercial, and institutional ones must apply for the license up until March 2022, without any fee. There were around 20,000 groundwater users in 2016, but a few applied for water licenses. However, the government is providing all kinds of facilitation towards the attainment of licenses to secure the water rights of groundwater users. This would ensure fresh and clean water for the present and future generations [28].
Many of the BC aquifers are highly productive and expose to rivers with a strong surface–groundwater interaction due to high permeability. Therefore, changes to the timing and amplitude of stream/river discharge due to climate change can considerably change groundwater levels [20]. However, groundwater recharge in most of the aquifers in BC takes place during late spring and early summer and is a function of winter precipitation, spring snowmelt, and the duration of the recharge season. An increase in precipitation can increase the recharge [29], but this cannot be straightforwardly concluded. This is because groundwater storage is limited by the amount of available pore space, and therefore, any excess water will move as surface runoff, particularly under heavy rainfall events. In BC, the historic trends indicate that a larger proportion of the increased precipitation, if not all, was and is likely to fall in the form of heavy events [30]. Therefore, most of the prospective snowmelt water would escape to the rivers and oceans, with a minimalistic impact on groundwater levels [29].
Grand Forks aquifer situated in southern BC was investigated by Allen [20]. They found a minimal impact of variations in recharge patterns on the groundwater systems, under different climate change scenarios. The results show small variations in the water table and groundwater flow directions; specifically, the high-recharge scenario projected a rise of 0.05 m, and low recharge projected a decline of 0.025 m in the water table elevations. Studies of the climate change impact on water resources of Fraser Valley, BC reveals that the impact of El Niño Southern Oscillation (ENSO) precipitation is limited to winter and spring. It indicated higher rainfalls under a cold phase and vice versa. It showed impacts on groundwater levels, as well [31]. Groundwater quality issues are emerging due to cattle farming, mining, oil, and gas, as well as forestry and logging [15] and are amplified by improper disposal of agricultural waste, failed septic systems, pesticides, and saltwater intrusion due to both natural conditions and over-pumping [32]. Therefore, it can be said that groundwaters are more susceptible to anthropogenic activities than climate change.
3.2. Prairies
The Prairies region (Alberta, Saskatchewan, and Manitoba) is a large hydrological unit of Canada that receives the least precipitation, and therefore, groundwater is a vital water source. There is no significant trend of groundwater mining observed here, except in a few places in Alberta and Southern Saskatchewan regions. Respective provincial governments have initiated several programs for sustainable development and management of groundwater.
In Alberta, more than 0.6 million people (13% population) depend on groundwater for drinking water supplies; moreover, it meets the demands of agriculture and industry and helps maintain lake and stream levels. Groundwater contributes 53% of industrial demands and 25% and 18% of the agricultural and domestic demands [33]. There are more than 0.5 million water wells in the province, whereas the annual increase rate is 5000. Irrigation water consumption is too high, i.e., 4.1 km3/year including surface and groundwater and irrigates an area of 0.6 Mha (million hectares). Inter-sectoral competition for water is high in different parts of Alberta, due to the availability of irrigable land and unavailability of water resources. The government took up the task to develop inventories and maps of groundwater resources under the program, “Provincial Groundwater Inventory Program”. Initially, the Edmonton-Calgary Corridor was investigated due to significant growth and development in this area [34].
Groundwater in different parts of Alberta is under stress, which has forced the government to launch inter-basin transfer of surface water projects, e.g., to provide water to Lacombe/Ponoka area as groundwater is unable to meet demands of the growing population [35]. The government has legislated these kinds of projects for groundwater-short areas and is promoting integrated land use and water planning. Similarly, improving knowledge of groundwater resources has been prioritized for better understanding sustainable management [34]. Climate change impacts on groundwater were studied in southern and central Alberta by Perez et al. [36]. They, however, recommended aquifer-based studies to better understand the impacts.
In Saskatchewan, individualistic groundwater mining has been observed in some places. For example, the Estevan Valley aquifer of southern Saskatchewan has shown a decline of 45 m. However, that was a local phenomenon, which may take 20 years to recover [15]. Permits are required for well drilling and the Water Security Agency monitors groundwater levels across the southern half of Saskatchewan. Almost 70 monitoring wells exist in the region with depths ranging from 6 to 555 m. Data analysis reveals that 45 wells reached the highest level in 2011; seven showed substantial declines, while the others remained stable. Recharge to shallow aquifers takes place in spring to early summer due to snowmelt and some rainfall. Shallow aquifers indicate a response to consecutive drought years. However, deep aquifers show a delayed response to the spring recharge in winter but do not respond well to dry or wet years. Groundwater is a major source of water for the streams, sloughs, dugouts due to the complex interaction of soils, vegetation, snow, and evaporation. In summer, evaporation losses are equal to seasonal rainfall and therefore, most recharge takes place in spring as snowmelt water infiltrates through coarse-textured soils or from depressions with no outflow. During this period, infiltrated water manages to percolate below the root zone to join aquifers [37].
Groundwater quality in Saskatchewan is mostly good (TDS < 1000 mg/L) but has high Fe concentrations, which causes taste problems. Some aquifers have high Ca, Mg, and SO4 concentrations ranging from 1500 to 2500 mg/L. The deeper aquifers contain high Na contents (1000 to 2500 mg/L) and are least susceptible to surface water contamination unlike shallow aquifers [38].
Groundwater in Manitoba exists locally in shallow sand/gravel aquifers and at some isolated locations in the form of deep bedrock aquifers. It is the primary source of water for municipal, residential, industrial, and agricultural use in Manitoba, particularly outside the city of Winnipeg. Groundwater made up 90% of the non-urban water supplies [39] and fulfilled 20% of the potable needs of the population in Manitoba. There are almost 87,000 wells in the province and most of those have been drilled in sand/gravel aquifers and mostly supply potable waters. However, deep and large aquifers such as the Assiniboine Delta aquifer are used for irrigation. A well with a daily discharge capacity of 25 m3 or more requires a permit, and there are 948 such wells. Most of the aquifers are under safe yields; however, a few aquifers such as Elie and Winkler showed water quality deterioration due to over-pumping [40,41]. The provincial government has monitored the groundwater levels since 1961 as the observation wells network was developed [42], and there exist 556 such observation wells [41]. Groundwater in the province, however, normally exceeds the aesthetic limit of 500 mg/L TDS. High TDS contains hardness as well (more than 200 mg/L) and some high concentrations of sulfur and chloride [40]. Fluoride and uranium contamination has also been reported in some places.
Climate change may further affect water quantity and quality parameters in Manitoba. A shift to drier conditions would increase reliance on groundwater and thus increased pumping thereof. Increased precipitation would affect the groundwater balance depending on the season of increase. Since most of the recharge takes place in spring and summer because of snowmelt, increased winter precipitation would increase groundwater storage, particularly in shallow aquifers. However, it would also lead to a reduced arable area as well, and thus, minimal net gain. Increased precipitation in summers would benefit agriculture but would not substantially increase recharge. Overall, the least correlation was found between precipitation and groundwater levels for Manitoba, due to the more chaotic nature of precipitation events and the less permeable nature of the overlying sediment cover [41]. This was also verified by Tremblay et al. [25]. They also could not develop a correlation between precipitation and groundwater level, analyzing the historic records for Manitoba. However, a 4-month delayed response of the water table was observed with a temperature change.
3.3. Central Canada
Central Canada includes the provinces of Ontario and Quebec, wherein Ontario is the most populous province with an estimated 14.3 million inhabitants. Groundwater is mostly extracted to meet potable demands here and is a drinking water source for about 3 million people. The Ontario government established the Provincial Groundwater Monitoring Network (PGMN) comprising 450 monitoring wells and maintains an online database of the information for the public [43,44]. Most of the wells’ record does not indicate water table decline of groundwater mining. On the other hand, at some places such as Nottawasaga Valley, most of the wells indicated increasing water levels (rising elevation above mean sea level) over 13 years (2003–2015), except for a few. For instance, the well located at Base Borden indicated a water level rise of approximately 1.4 m [44]. This is generally consistent with the findings from Mueller and Post [45]. Thus, it can be concluded that groundwater extraction from the aquifers in the valley is mostly under the safe yield. However, a few places around Toronto do indicate water table decline.
Groundwater in Ontario, however, suffers from quality deterioration. It has been reported that 30–35% of wells are bacterially contaminated. In the year 2000, pathogenic E. coli affected water killed seven people and affected 2300 others with severe gastrointestinal illness [43]. Goss et al. reported that 14%, 34%, and 6% wells of the total 1292 surveyed wells exceeded permissible limits of nitrate, coliform, and pesticides, respectively [46]. Thereafter, groundwater management activities were carried out across Canada including Ontario’s municipalities to maintain high-quality groundwater supplies and thus avoid costly decontamination. The need for continuous water quality monitoring and remediation was emphasized by Kozuskanich et al. [47]. Increased use of nitrogenous fertilizers and pesticides in agriculture for growing corn is deteriorating the groundwater quality, particularly in Southern Ontario [48]. The shallow groundwater aquifers are most likely to be affected.
Climate change can impact the groundwater in Ontario but in turn will increase the surface flows of the rivers. The rise in the intensity and frequency of precipitation, as found, will mostly affect the surface water, and the rising temperature will mainly increase evapotranspiration. However, warmer winters will increase recharge by reducing the amount of ground frost and enhanced infiltration thereof. Climate change is likely to affect the recharge patterns both temporally and spatially and needs further investigation [49].
Quebec is the second largest user of groundwater after Ontario, in terms of quantum of extraction used for public supplies, and 20% of the population sources their drinking water supplies from it. Here, it is an economically viable source of water, due to its generally good quality and proximity to the place of consumption. Groundwater withdrawal is regulated in the province under the Water Withdrawal and Protection Regulation of 2014 [50]. The permit is issued by the government after the applicant conducts hydrogeological studies and quantification of the impacts on ecosystems and other local users [44]. However, the Ministry of Environment of Quebec began groundwater monitoring at selected locations in the 1960s. In 1984, the number of observation wells was 200; all the data are shared online. Similarly, to protect water quality in public wells, Groundwater Catchment Regulation (GWCR) was promulgated in 2002 [51].
Groundwater budgeting in the thickly populated Montreal region of the province revealed that the total recharge to the aquifer is around 98 Mm3/year in which the largest contribution is from precipitation (87%). However, the annual extraction through wells is just 18% of the recharge, which outrightly underscores the sustainability of the aquifer [14]. Similar is the case for other aquifers, as well.
Quebec’s groundwater, however, has quality issues. Impermissible concentrations of arsenic in western Quebec, nitrate contamination around potato cultivated fields, and bacterial and viral contamination were detected at some places. However, provincial regulations ensure proper treatment and mostly the provision of safe drinking water to users. The abundance of groundwater resources and significantly low use of groundwater, almost 18% of the annual recharge, is less likely to produce any undesirable quantitative impacts on most of the aquifers of the Quebec region. However, some climate change and water quality issues may emerge [52,53].
3.4. Atlantic Canada
The region is situated along the east coast along the Atlantic where groundwater is a major source of fresh water for as much as 100% of the province of Prince Edward Island (PEI). The groundwater dependability ratio for other provinces is 46% in Nova Scotia (NS), 66% in New Brunswick (NB), and 34% in Newfoundland and Labrador (NL). There are approximately 97,000, 17,000, and 21,000 wells in NS, NL, and PEI, respectively [15].
Nova Scotia is a relatively larger province of Atlantic Canada encompassing a 55,284 km2 geographical area. It consists of several sub-watersheds, which drain into the Atlantic Ocean. Groundwater is a major source of water, fulfilling 46% of needs. However, water quality deterioration and deforestation are major environmental challenges [54]. Groundwater has a low pH due to acid rock drainage and contains impermissible nitrate, mercury, and arsenic concentrations in some places [55]. There are around a hundred thousand wells, and groundwater regulations do exist to ensure sustainable development and provision of safe drinking water. The department of Environment and Labor approves the installation of wells [56]. Pressure on groundwater is, however, increasing due to urbanization and more coastal development [57]. Climate change will further change the recharge and discharge patterns of groundwater. A study of a watershed in Nova Scotia projects an increased recharge over the 2041–2070 periods, despite higher evapotranspiration due to rising temperature. Nevertheless, the temporal distribution of recharge showed a shift with a reduction in summer and an increase in winter. Water budgets of watersheds of Nova Scotia can significantly change under different climate change scenarios as reported by Rivard et al. and verified by two regional-scale studies [58].
New Brunswick is a pre-dominantly groundwater-dependent province of Atlantic Canada, wherein groundwater dependability is as high as 66% and is used for domestic, agricultural, municipal, commercial, institutional, and industrial purposes. It makes up 75% of drinking water supplies. Groundwater legislation exists to protect both surface and groundwater in terms of the Clean Environment Act and Clean Water Act, respectively. The Clean Water Act on groundwater protection further includes Wellfield Protected Areas Designation Order, Water Well Regulation, and Potable Water Regulation. The first defines areas around production wells and restricts undertakable activities therein, thus reducing contamination risks. The Water Well Regulation defines the construction of water wells to ensure appropriate water quality from local runoff or land use activities. Potable Water Regulation imposes water quality testing for all new water wells to be used for potable water [59]. Groundwater sustainability is likely to be affected by climate change, rising population, and agricultural and industrial activities. Green and MacQuarrie researched the likely impacts of environmental changes on groundwater here. Multiple scenarios of the year 2100 were projected, such as a further sea-level rise of 0.93–1.86 m, up to 2.3 times more groundwater extraction, and varying recharge rates from 40–85 mm/year. No overall significant impact was found, including least intrusion due to sea-level rise in shallow and intermediate aquifers. Increased extraction indicated impact close to the wells only. However, reduced recharge indicated a significant impact [60].
Newfoundland and Labrador encompass a 405,212 km2 area with an estimated population of 0.5 million. It has the highest per capita freshwater and groundwater availability in all of Canada. Groundwater mostly remains unexplored; therefore, groundwater dependability is relatively low (34%). Groundwater is extracted by 17,000 wells, which provides water to 22% of water supply schemes serving 30,000 inhabitants, which is merely 6% of the entire population. Newfoundland and Labrador’s Environment and Conservation Department is responsible for the sustainable development of natural resources including groundwater. Despite low dependability on groundwater, installation of a non-domestic water well in the province requires a license, which is issued for 10 years. The license is issued by the government subject to approval, which considers hydrogeological information and adverse effects of withdrawal. The groundwater regulations also extend to bottled water companies, who are bound to furnish all required information including the availability, water quality, details of affected beneficiaries, and an NoC from the municipal authority [15,61]. Due to high groundwater availability, low utilization percentage, and regulation, groundwater is most likely sustainable and is least likely to be negatively impacted by environmental changes.
Prince Edward Island is the smallest province just occupying a 5620 km2 area, the most populous accommodating 27 persons/km2, and is the only province entirely dependent on groundwater for all kinds of needs. Having a high groundwater recharge rate and productive aquifers, the entire PEI is recharged with about 2.4 billion m3/year or 16,000 m3/person/year, but only about 472 million m3/year or 3147 m3/person/year can be permitted for human uses under the Water Extraction Permitting Policy [22]. The average water table depth is 8.3 m below the surface, but at some places, it is quite shallow. Aquifers exhibit steady-state conditions as the long-term groundwater table is flat with seasonal fluctuation indicating sustainable water resource usage. Groundwater contribution/baseflow to streamflow is as high as 73% due to the high recharge rate and shallow groundwater [62,63]. Groundwater aquifers are prone to contamination due to fractured bedrocks. Nitrate contamination is prevalent due to the high fertilization of potato crops, and therefore, average nitrate concentrations in groundwater exceeded 3 mg/L during the period 1984–2007 in many places [57]. The province is impacted by climate change as temperatures significantly rose by +0.70 to +1.14 °C during the past 30 years compared to the 1970s. During the same period, precipitation increased by 6% in the east and decreased by 5% and 8% in central and western PEI, respectively. It was concluded that hydrological balance including groundwater would disturb due to the climatic changes [64].
Impacts of climate change on the water levels of the PEI aquifer were studied. It was reported that groundwater levels of PEI respond to climatic changes. Particularly, the aquifers were quite responsive to the changes in precipitation and temperature. Any scenario of increased precipitation indicated a rise in groundwater levels, whereas an increase in temperature indicated lowering of groundwater levels because of increased evapotranspiration on the shallow aquifer, particularly during the summer months [25]. The response time to precipitation change was 1 month and 2 months for temperature change. The underlying reasons are high permeability and shallow water tables. Overall, groundwater shows sustainability due to high recharge and low utilization percentage, though extensive pumping in certain watersheds is and can significantly reduce streamflows and thus would affect ecological balance. Nevertheless, future projections of the 2050s exhibit increased recharge by 7%, 9%, and 14% under RCP2.6, RCP4.5, and RCP8.5 scenarios of climate change, respectively, whereas the benchmark average recharge is 488 mm/year during the 1970s [63].
4. Conclusions
Groundwater is a major, almost free, and mostly unexplored resource in Canada. On the national scale, 9 million people (24% of the population) source potable water from it, whereas in rural areas, it serves 82% of the population. Moreover, it fulfills 43% of industrial and 14% of irrigation water demands. At the provincial scale, groundwater dependability is above 30%, however PEI entirely depends on it. Provinces have initiated programs to properly regulate groundwater, which was free except in MB, SK, NS, and territories, where it is nominally charged at CAD 0.01–143.77/million liters. The prior estimate of renewable groundwater is 380–625 km3/year, which underscores it as an unexplored resource as provinces are developing databases. Sustainable groundwater availability under the study was found as 19,832 m3/person/year countrywide (750 km3/year), with high provincial variation ranging from 3949 in the densely populated PEI to 87,899 in the thinly populated NFL. An inverse relation between groundwater availability and population density was found. Groundwater use was found sustainable, as provinces were mostly extracting less than 4% of sustainable availability except for NB, where it was also merely 8%. However, groundwater depletions were observed at places where the classical safe yield concept was used for aquifers management, and pumping was more than local sustainable limits. Groundwater quality issues were found restricted to specific areas, mostly near highly fertilized croplands, cattle farms, etc. Despite overall sustainability at the provincial scale, depletion and quality deterioration were evident in scattered places, particularly in the heavily populated provinces of ON and QC. Groundwater was found resilient against climate change. Nevertheless, warming has increased and will continue to increase water requirements and pumping. The Prairies region is particularly affected due to rising temperatures, increasing sectoral demands, and decreasing precipitation. Recharge distribution is also affected due to changing precipitation patterns in different places. Generally, increasing recharge in late winters and springs was observed due to reduced frost and more infiltration, and somewhat decreasing in summers due to more intense rainfall events. Population concentrations, warming, rising sectoral demands, changing precipitation and recharge patterns, and effluents may soon pose risks to groundwater sustainability. Therefore, additional groundwater monitoring and regulations are needed at local and regional scales in Canada.
Author Contributions
Conceptualization, A.Z.B. and A.A.F.; investigation, A.Z.B., F.A. and Q.L.; validation, B.A. and A.A.F.; formal analysis, A.Z.B., A.A.F. and F.A.; resources, B.A. and A.A.F.; data curation, A.Z.B., F.A. and Q.L.; writing—original draft preparation, A.Z.B. and A.A.F.; writing—review and editing; Q.L., F.A. and B.A.; supervision, A.A.F.; project administration, A.A.F. and F.A.; funding acquisition, A.A.F. All authors have read and agreed to the published version of the manuscript.
Funding
The National Science and Engineering Research Council of Canada (NSERC), PEI Department of Environment, Energy, and Climate Action provided funding for this study.
Institutional Review Board Statement
Not applicable.
Informed Consent Statement
Not applicable.
Data Availability Statement
The data presented in this study are available on request from the corresponding author. The data are not yet publicly available.
Acknowledgments
The support extended by Faculty of Sustainable Design Engineering at the University of Prince Edward Island is acknowledged.
Conflicts of Interest
The authors declare no conflict of interest.
References
- Bhatti, A.Z.; Farooque, A.A.; Krouglicof, N.; Li, Q.; Peters, W.; Abbas, F.; Acharya, B. An Overview of Climate Change Induced Hydrological Variations in Canada for Irrigation Strategies. Sustainability 2021, 13, 4833. [Google Scholar] [CrossRef]
- Statistics Canada. Table 17-10-0009-01 Population Estimates, Quarterly. Available online: https://www150.statcan.gc.ca/t1/tbl1/en/tv.action?pid=1710000901 (accessed on 15 July 2021).
- Natural Resources Canada. The Atlas of Canada—Topo Rama. Available online: http://atlas.gc.ca/toporama/en/index.html (accessed on 23 August 2021).
- Statistics Canada. Population Distribution as of July 1, 2014, by Census Division (CD), Canada. Available online: https://www150.statcan.gc.ca/n1/pub/91-214-x/2015000/section04-eng.htm (accessed on 15 July 2021).
- Statistics Canada. Canada’s Physical Environment. Available online: https://www150.statcan.gc.ca/n1/pub/16-201-x/2007000/5212638-eng.htm (accessed on 15 July 2021).
- Natural Resources Canada. How Much Forest Does Canada Have. Available online: https://www.nrcan.gc.ca/our-natural-resources/forests-forestry/state-canadas-forests-report/how-much-forest-does-canada-have/17601 (accessed on 23 August 2021).
- Morsy, K.; Morsy, A.; Hassan, A. Groundwater sustainability: Opportunity out of threat. Groundw. Sustain. Dev. 2018, 7, 277–285. [Google Scholar] [CrossRef]
- Giordano, M. Global Groundwater? Issues and Solutions. Annu. Rev. Environ. Resour. 2009, 34, 153–178. [Google Scholar] [CrossRef]
- Kundzewicz, Z.; Döll, P. Will groundwater ease freshwater stress under climate change? Hydrol. Sci. J. 2009, 54, 665–675. [Google Scholar] [CrossRef]
- Rodell, M.; Famiglietti, J.; Wiese, D.; Reager, J.; Beaudoing, H.; Landerer, F.; Lo, M. Emerging trends in global freshwater availability. Nature 2018, 557, 651–659. [Google Scholar] [CrossRef]
- Government of Canada. Surficial Hydrogeology. Available online: https://open.canada.ca/data/en/dataset/42bb6def-af94-5a54-9497-85df7ce55a19 (accessed on 23 August 2021).
- Gleick, P.H.; Cain, N.L. The World’s Water 2004–2005: The Biennial Report on Freshwater Resources; Island Press: Washington, DC, USA, 2004. [Google Scholar]
- Döll, P.; Fiedler, K. Global-scale modeling of groundwater recharge. Hydrol. Earth Syst. Sci. 2008, 12, 863–885. [Google Scholar] [CrossRef]
- Nastev, M.; Rivera, A.; Lefebvre, R.; Martel, R.; Savard, M. Numerical simulation of groundwater flow in regional rock aquifers, southwestern Quebec, Canada. Hydrogeol. J. 2005, 13, 835–848. [Google Scholar] [CrossRef]
- Nowlan, L. Buried Treasure: Groundwater Permitting and Pricing in Canada; Walter and Duncan Gordon Foundation Toronto: Toronto, ON, Canada, 2005. [Google Scholar]
- Gleeson, T.; Wada, Y.; Bierkens, M.; van Beek, L. Water balance of global aquifers revealed by groundwater footprint. Nature 2012, 488, 197–200. [Google Scholar] [CrossRef]
- University of British Columbia. Fact Sheet—Groundwater Use Regulation. Available online: http://watergovernance.sites.olt.ubc.ca/files/2010/04/FS_Groundwater_Regs.pdf (accessed on 23 August 2021).
- Government of Canada. Environment and Climate Change Canada. Available online: https://www.canada.ca/en/environment-climate-change.html (accessed on 17 July 2021).
- Woo, M. Cold Ocean, seas and northern hydrology: An exploratory overview. Hydrol. Res. 2010, 41, 439–453. [Google Scholar] [CrossRef]
- Allen, D.; Mackie, D.; Wei, M. Groundwater and climate change: A sensitivity analysis for the Grand Forks aquifer, southern British Columbia, Canada. Hydrogeol. J. 2003, 12, 270–290. [Google Scholar] [CrossRef]
- Alley, W.M.; Reilly, T.E.; Franke, O.L. Sustainability of Ground-Water Resources; US Department of the Interior, US Geological Survey: Reston, VA, USA, 1999; Volume 1186. [Google Scholar]
- Government of Prince Edward Island, Department of Environment, Labour and Justice. Water Extraction Permitting Policy. Available online: https://www.princeedwardisland.ca/sites/default/files/publications/water_extraction_permitting_policy_2013.pdf (accessed on 23 July 2021).
- Vaccaro, J. Sensitivity of groundwater recharge estimates to climate variability and change, Columbia Plateau, Washington. J. Geophys. Res. 1992, 97, 2821. [Google Scholar] [CrossRef]
- Loáiciga, H.; Maidment, D.; Valdes, J. Climate-change impacts in a regional karst aquifer, Texas, USA. J. Hydrol. 2000, 227, 173–194. [Google Scholar] [CrossRef]
- Tremblay, L.; Larocque, M.; Anctil, F.; Rivard, C. Teleconnections and interannual variability in Canadian groundwater levels. J. Hydrol. 2011, 410, 178–188. [Google Scholar] [CrossRef]
- British Columbia Ministry of Environment. Doing Business Differently: Protecting Our Groundwater. Living Water Smart. Available online: www.livingwatersmart.ca/business/groundwater.html (accessed on 17 July 2021).
- Dore, M.H. Water Policy in British Columbia. In Water Policy in Canada; Springer: Cham, Switzerland, 2015; pp. 235–285. [Google Scholar]
- Government of British Columbia. Groundwater Licensing Update. Water Sustainability Act. Available online: https://engage.gov.bc.ca/watersustainabilityact/2019/02/19/blog-post-27-groundwater-licensing-update/ (accessed on 17 July 2021).
- Arnell, N. Global Warming, River Flows and Water Resources; John Wiley & Sons: Chichester, UK, 1996; ISBN 0-471-965995. [Google Scholar]
- Mekis, E.; Hogg, W. Rehabilitation, and analysis of Canadian daily precipitation time series. Atmosphere-Ocean 1999, 37, 53–85. [Google Scholar] [CrossRef]
- Fleming, S.; Quilty, E. Aquifer Responses to El Niño-Southern Oscillation, Southwest British Columbia. Ground Water 2006, 44, 595–599. [Google Scholar] [CrossRef]
- Denny, S.; Allen, D.; Journeay, J. DRASTIC-Fm: A modified vulnerability mapping method for structurally controlled aquifers in the southern Gulf Islands, British Columbia, Canada. Hydrogeol. J. 2006, 15, 483–493. [Google Scholar] [CrossRef]
- Alberta Environment. Focus on Groundwater; Alberta Environment: Edmonton, AB, Canada, 2005; ISBN 0-7785r-r4264-5. [Google Scholar]
- Quinn, F.; Day, J.C.; Healey, M.; Kellow, R.; Rosenberg, D.; Saunders, J.O. Water allocation, diversion, and export. Threat. Water Availab. Can. 2004, 1, 16–20. [Google Scholar]
- Maloney, K.; Feminella, J.; Mitchell, R.; Miller, S.; Mulholland, P.; Houser, J. Landuse legacies and small streams: Identifying relationships between historical land use and contemporary stream conditions. J. N. Am. Benthol. Soc. 2008, 27, 280–294. [Google Scholar] [CrossRef]
- Perez-Valdivia, C.; Sauchyn, D.; Vanstone, J. Groundwater levels and teleconnection patterns in the Canadian Prairies. Water Resour. Res. 2012, 48. [Google Scholar] [CrossRef]
- Berthold, S.; Bentley, L.; Hayashi, M. Integrated hydrogeological and geophysical study of depression-focused groundwater recharge in the Canadian prairies. Water Resour. Res. 2004, 40. [Google Scholar] [CrossRef]
- Pomeroy, J.; de Boer, D.; Martz, L. Hydrology and Water Resources of Saskatchewan; Citeseer: Princeton, NJ, USA, 2005. [Google Scholar]
- Hess, P.J. Groundwater Use in Canada, 1981; Inland Waters Directorate, Technical Bulletin 140; Environment Canada: Ottawa, ON, Canada, 1986. [Google Scholar]
- Ferguson, G.; Betcher, R.; Grasby, S. Hydrogeology of the Winnipeg Formation in Manitoba, Canada. Hydrogeol. J. 2006, 15, 573–587. [Google Scholar] [CrossRef]
- Maathuis, H.; Thorleifson, L.H. Potential Impact of Climate Change on Prairie Groundwater Supplies: Review of Current Knowledge; Saskatchewan Research Council: Saskatoon, SK, Canada, 2000. [Google Scholar]
- Rutulis, M. Groundwater Drought Sensitivity of Southern Manitoba. Can. Water Resour. J. 1989, 14, 18–33. [Google Scholar] [CrossRef][Green Version]
- O’Connor, D.R. Report of the Walkerton Inquiry. Part 2. A Strategy for Safe Water; Ontario Ministry of the Attorney General: Toronto, ON, Canada, 2002.
- Nottawasaga Valley Conservation Authority. Annual Groundwater Monitoring Report-2015. Available online: https://www.nvca.on.ca/Shared%20Documents/NVCA_Annual_Groundwater_Monitoring_Report_2015_web.pdf (accessed on 17 July 2021).
- Mueller, R.; Post, R. NVCA Groundwater Trend Analysis Using the Provincial Groundwater Monitoring Network (2002–2013). Nottawasaga Val. Conserv. Auth. 2013. Available online: https://www.nvca.on.ca/Shared%20Documents/NVCA%20Provincial%20Groundwater%20Monitoring%20Network%20Groundwater%20Quality%20Overview%202002%20to%202013.pdf (accessed on 17 July 2021).
- Goss, M.; Barry, D.; Rudolph, D. Contamination in Ontario farmstead domestic wells and its association with agriculture. J. Contam. Hydrol. 1998, 32, 267–293. [Google Scholar] [CrossRef]
- Kozuskanich, J.; Novakowski, K.; Anderson, B. Fecal Indicator Bacteria Variability in Samples Pumped from Monitoring Wells. Ground Water 2010, 49, 43–52. [Google Scholar] [CrossRef] [PubMed]
- National Research Council. Water Implications of Biofuels Production; National Academies Press: Washington, DC, USA, 2008. [Google Scholar]
- Jyrkama, M.; Sykes, J. The impact of climate change on spatially varying groundwater recharge in the grand river watershed (Ontario). J. Hydrol. 2007, 338, 237–250. [Google Scholar] [CrossRef]
- Government of Quebec. Water Withdrawal and Protection Act. Available online: https://www.environnement.gouv.qc.ca/eau/prelevements/reglement-prelevement-protection/index-en.htm (accessed on 17 July 2021).
- Government of Quebec. Groundwater Catchment Regulation and Environment Quality Act. Available online: http://legisquebec.gouv.qc.ca/en/ShowDoc/cr/q-2,%20r.%206 (accessed on 17 July 2021).
- Bondu, R.; Cloutier, V.; Rosa, E.; Benzaazoua, M. Mobility and speciation of geogenic arsenic in bedrock groundwater from the Canadian Shield in western Quebec, Canada. Sci. Total Environ. 2017, 574, 509–519. [Google Scholar] [CrossRef] [PubMed]
- Locas, A.; Barthe, C.; Barbeau, B.; Carrière, A.; Payment, P. Virus occurrence in municipal groundwater sources in Quebec, Canada. Can. J. Microbiol. 2007, 53, 688–694. [Google Scholar] [CrossRef] [PubMed]
- Sterling, S.; Garroway, K.; Guan, Y.; Ambrose, S.; Horne, P.; Kennedy, G. A new watershed assessment framework for Nova Scotia: A high-level, integrated approach for regions without a dense network of monitoring stations. J. Hydrol. 2014, 519, 2596–2612. [Google Scholar] [CrossRef]
- Depew, D.; Burgess, N.; Campbell, L. Spatial Patterns of Methylmercury Risks to Common Loons and Piscivorous Fish in Canada. Environ. Sci. Technol. 2013, 47, 13093–13103. [Google Scholar] [CrossRef]
- Government of Nova Scotia. Before You Construct a Water Well—Facts a Homeowner Should Know. Available online: http://www.gov.ns.ca/enla/water (accessed on 17 July 2021).
- Worldwide Fund for Nature (WWF). Freshwater. Available online: http://www.wwf.ca/conservation/freshwater (accessed on 17 July 2021).
- Rivard, C.; Paniconi, C.; Vigneault, H.; Chaumont, D. A watershed-scale study of climate change impacts on groundwater recharge (Annapolis Valley, Nova Scotia, Canada). Hydrol. Sci. J. 2014, 59, 1437–1456. [Google Scholar] [CrossRef]
- Stantac. Mactaquac Project: Final Comparative Environmental Review (CER) Report. Groundwater. Available online: https://www.energienb.com/media/689731/cer_chapter_07_groundwater_aug2016.pdf (accessed on 16 July 2021).
- Green, N.; MacQuarrie, K. An evaluation of the relative importance of the effects of climate change and groundwater extraction on seawater intrusion in coastal aquifers in Atlantic Canada. Hydrogeol. J. 2013, 22, 609–623. [Google Scholar] [CrossRef]
- Government of Newfoundland and Labrador. Environment and Climate Change. Available online: https://www.gov.nl.ca/ecc/ (accessed on 17 July 2021).
- Francis, R.M. Hydrogeology of the Winter River Basin-Prince Edward Island; Water Resources Branch, Department of the Environment: Charlottetown, PE, Canada, 1989.
- Li, Q. Draft Report of Groundwater Impacts by Climate Change in Watershed Scale in Prince Edward Island; Department of Environment, Water and Climate Change: Charlottetown, PE, Canada, 2019.
- Bhatti, A.; Farooque, A.; Krouglicof, N.; Peters, W.; Acharya, B.; Li, Q.; Ahsan, M. Climate change impacts on precipitation and temperature in Prince Edward Island, Canada. World Water Policy 2021, 7, 9–29. [Google Scholar] [CrossRef]


Publisher’s Note: MDPI stays neutral with regard to jurisdictional claims in published maps and institutional affiliations. |
© 2021 by the authors. Licensee MDPI, Basel, Switzerland. This article is an open access article distributed under the terms and conditions of the Creative Commons Attribution (CC BY) license (https://creativecommons.org/licenses/by/4.0/).