1. Introduction
At present, LED fittings have become a major part of common lighting systems. The increasing effectiveness of LED sources is followed by a demand for the regulation of lighting installations. Since LED fittings are equipped with more electronic parts: led circuit, supply drivers, surge protection eventually communication circuit, it is required to consider its nonlinear Volt-Ampere characteristic. Many articles and discussions can be found in scientific and commercial magazines. Usually, they are comparing high-quality and low-quality level products. It was found that there is a lack of information about the behavior of LED installations used in so-called smart public installations, office buildings and industrial halls. A common characteristic of these installations is that LED fittings in most of their working plans are operated on various dimming levels depending usually on incoming commands from smart controlling systems.
For example, we would like to point out the article “Uncovering PQ (power quality) Problems with Industrial LED Lighting” [
1] which highlighted a lesser known issue that mostly occurred in industrial lighting systems. Long-term measurement showed the effect of high transient events with high dV/dt. “High dV/dt values indicate the line voltage changed quickly with respect to time. The change in volts can only be 50 to a few hundred volts, but the change in time can be in the one microsecond range. Values of dV/dt may be high enough to damage driver electronics because MOV (metal-oxide varistor), external or internal to a driver, is unable to clamp these processes [
1]. Despite electrical engineers’ projections, the facilities are trying to limit the above-mentioned processes, they are not capable of limiting such negative influences since they are not even mentioned in any standards.
Another research: “The impact of LED lighting systems to the power quality and recommendations for the installation methods to achieve the expected energy efficiency” [
2] supports our theoretical presumptions: “High frequency emissions of LED lights in the 2–150 kHz range may also cause problems for PLC (power line communication) used e.g., in smart meters. The harmonics of the diode rectifier can be limited by using PFC circuit. Therefore, the produced harmonics highly depend on the type and quality of the electronic connection device used with the LED light [
2]. Authors confirm the importance of the quality of the incorporated (in the package, not necessarily in device) LED drivers. In their tests, lower quality LED drivers caused the THD
I to be 5–18% higher than those fitting with better drivers. Also current in neutral conductor raised significantly if impropriate driver is used.
Article “Static energy meter errors caused by conducted electromagnetic interference” [
3] confirms that LED fittings could have a significant impact on sensitive devices—in this case, energy meters. Authors say and prove by laboratory test: “Large variations (of measured energy) could be observed when non-linear, fast switching, loads were connected. A deviation of +276% was measured with one static energy meter, +265% with a second and −46% with a third static energy meter.”
Another article [
4] operates and compares the information in and conclusions of work by R.B. Timens—Electromagnetic Interference of Equipment in Power Supply Networks [
5]. This work is based on a comparison of negative impacts of CLF (fluorescents light bulbs) and LED bulbs on the “Power Distribution User Network (PDUN)”. This work supported our meaning that “The voltage quality requirements and the equipment Electromagnetic Interference (EMI) requirements are weakly connected” [
6]. In our article, we have pointed out small differences at maximal levels of harmonics set in EN 50160 and EN 61000-3-2. We have also discussed the problem of standards when none of them sets the maximum THD
I of electrical equipment at rated power and at dimmed states.
Our research is aimed at high-quality EU products, where good power quality parameters are expected. All fittings were declared by producers as “dimmable”. As we will see from simple test measurements, parameters granted by producers of LED fittings were confirmed at nominal output power. However, problems occurred, and quality parameters were outcoming from the standard’s limit as we reached a certain level of dimming for the fitting. Our research proves that it is important to declare or recommend a maximal dimming level for LED fittings if quality standards limits are to be respected. Generally, we can say that reducing power consumption leads to issues in the supply grid and unfortunately, formerly well-known problems from classic light fittings installations occur also in new installations with LED fittings [
7,
8,
9,
10,
11].
It is clear, that the situation is provoked by the increasing demand of the market for cheaper solutions for public, office, and industrial lighting. Even serious producers are pushed to follow this request, so they have developed cheaper electronics but with very limited possibilities of following the actual recommendations of safety, quality, and electrical standards. Even bigger issues are lower quality LED fittings more oriented to price. Some research has been conducted on domestic LED fittings where poor power quality parameters were proved. Research on these products was presented also in an article: “Analiza wyższych harmonicznych generowanych przez lampy LED (Analysis of higher harmonics generated by LED lamps)” [
12]. Authors have examined other LED fittings and SMD chips and found that THD
I is very dependent on the type of driver. Without the harmonic filters, the lamp SMD3030 reached THD
I 116.1%, while EU producers usually declare maximums at 20–30%.
Generally, the situation over the market is presently better from a power quality point of view. Looking at an article: “Analysis of electrical and photometric quantities of CFL (compact fluorescent lamp) and LED bulb lamps” [
9]. In 2017, when fluorescent bulbs (CFL) were compared with LED bulbs, we could assume that we have moved from typical THD
I 100–120% of CFLs and 30–80% of LEDs to a maximum at 20–30% at rated power. Obviously, here we refer to better LED filings where producers have physical space to place LED drivers on lagers PCBs with much better parameters than those in actual LED bulbs constrained to place LED drivers within a few cm
3 and moreover significantly pushed by the market to limit the market price. In that case, it is obvious that producers are implementing simple converters with limited filter capabilities. Discussed issues became more significant for dimmable products if we push them to their limits [
12,
13,
14,
15,
16].
The main difference in the presented scientific approach as opposed to other research projects is that here, the influence of LED installations on self-operation and other components connected to common coupling points is being investigated. The obtained results are compared to national standards.
The focus of the article is to point out the problem of the negative influence of systems with LED lights on smart installations and to design a procedure for designers so that it is possible to design such a system in simple steps, which will have the least possible negative influence on the power grid. The proposed method of designing smart systems with LED luminaires is in line with European standards, but also takes into account aspects, that are stated in some standards in a relatively general way, or will only be reflected in installations with a higher number of luminaires.
The paper is divided into the following parts:
Section 2 describes the design of the measurement procedure, the method of measuring variables, and their impact on the network in accordance with standards,
Section 3 presents the results and evaluation of measurements,
Section 4 deals with discussion and design solutions in accordance with achieved results and requirements of standards. In the final fifth part, the authors’ recommendations for the design process of dimmed LED systems are discussed.
2. Materials and Methods
The methodology proposed in this paper uses a multiple step approach to select a suitable system for smart installations. The approach can be divided into the following steps:
Step 1: Determination of the luminaire parameters in the datasheet. If the required parameters are not in the datasheet, it is necessary to go to step 2:
Step 2: Measurement of PF a THDi
The methodology primarily uses the quantities PF and THDi, but also the value Inrush current, which gives information on the quality of the LED luminaire (from the point of view of input circuits).
It is not necessary to make measurements at the level of laboratory accuracy—the methodology ensures that even non-accurate measurements give very accurate information about large installations.
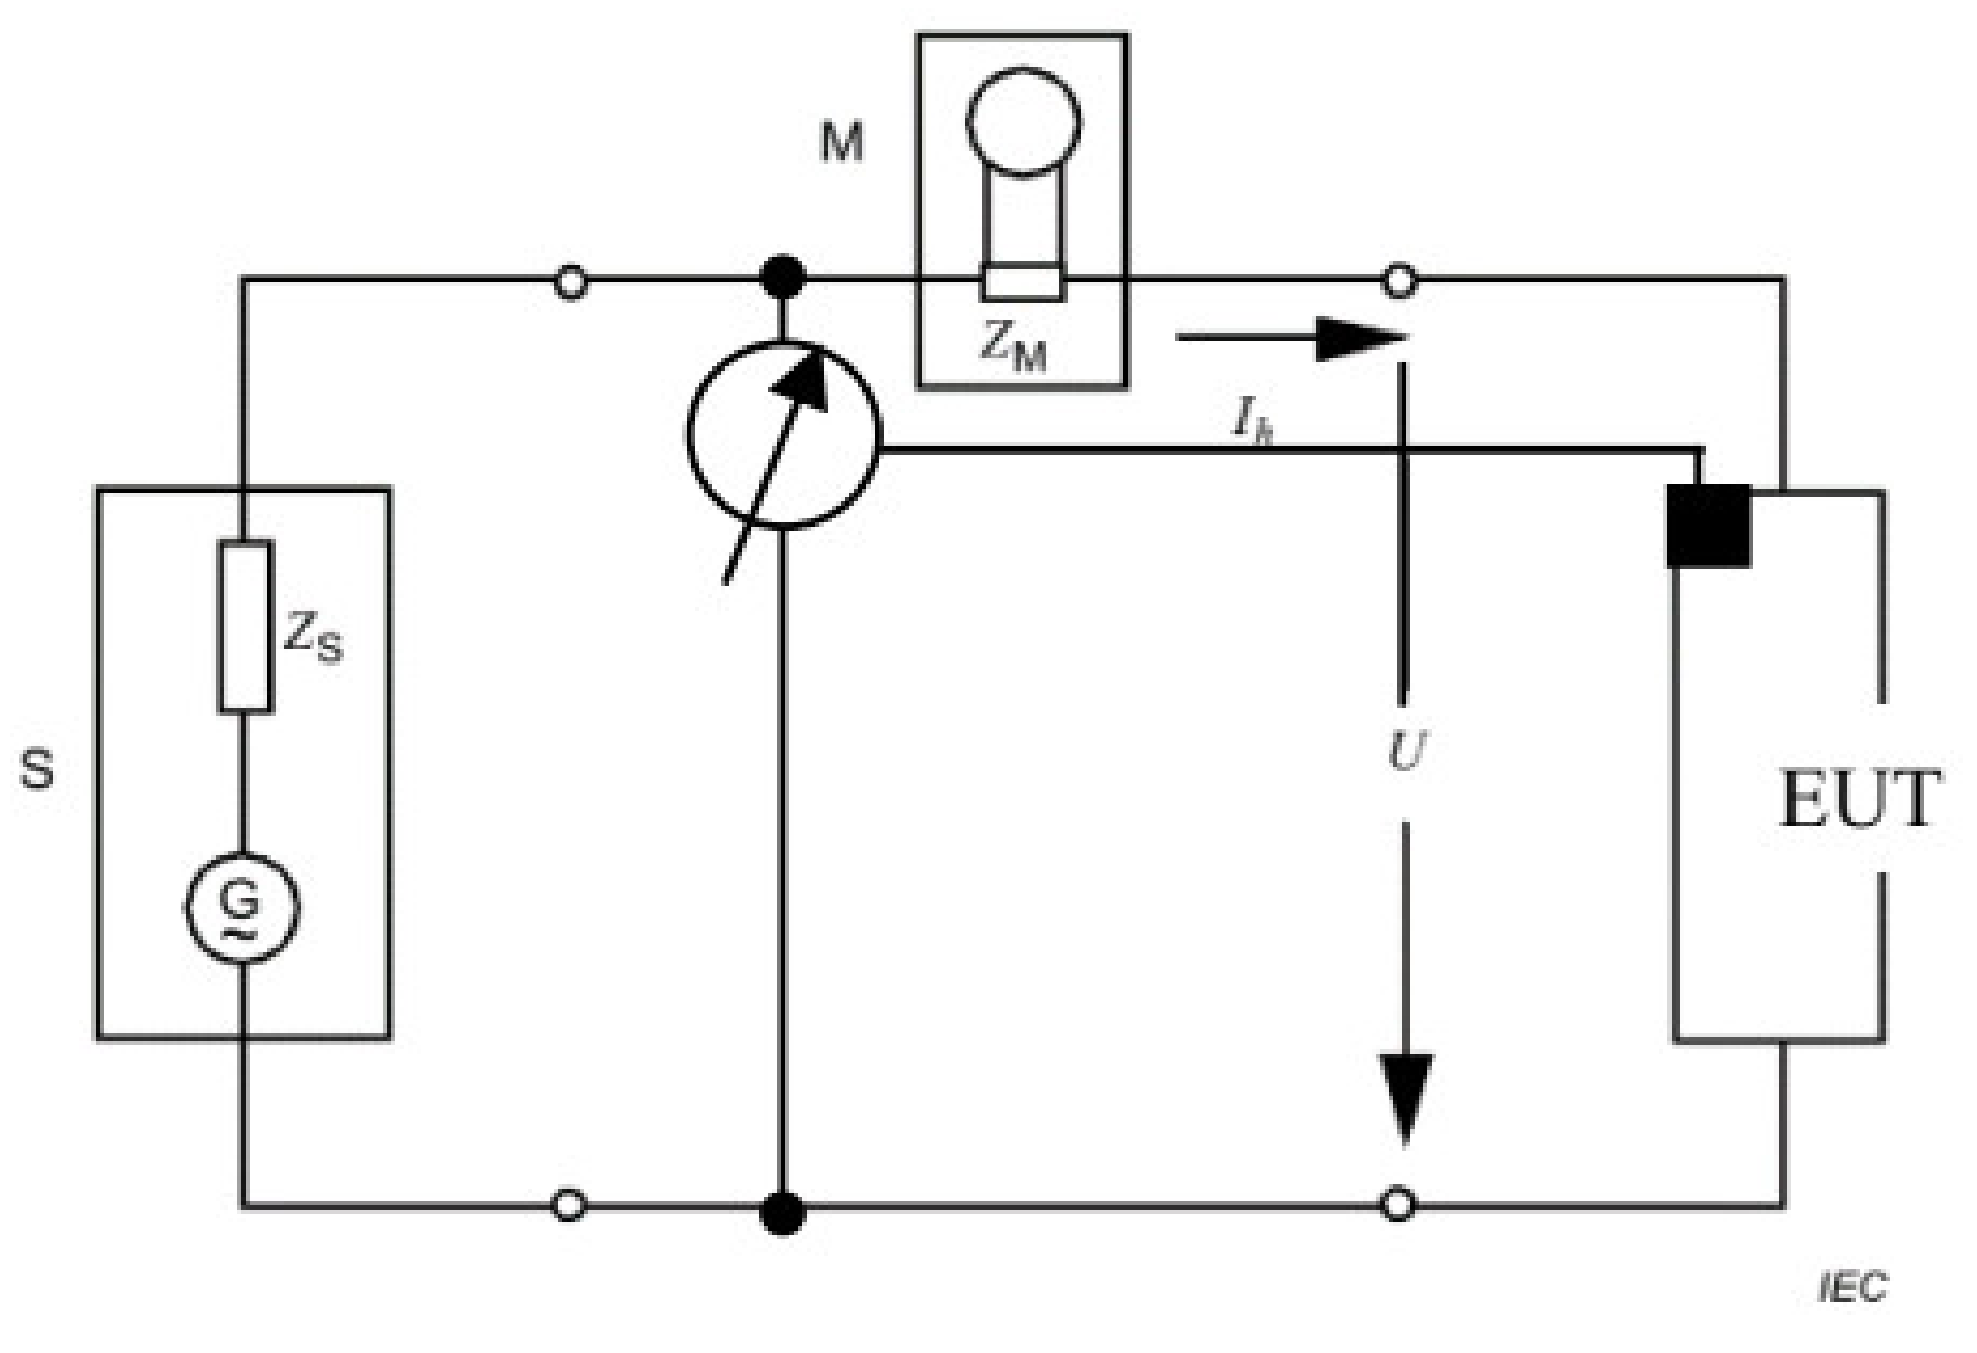
2.1. Measuring Set up and Evaluated Devices
The set-up for the measurement of the electrical energy quality consists of a power analyzer HT PQA 824 with a voltage and current probe calibrated and allowed for measurements of harmonics, inrush current, and quality analysis by standards EN 50160 and EN 61000-4-7 (
Figure 1). LED fittings were controlled and dimmed by the means defined by producers. One group of fittings was dimmed with Skydance 1–10 V controller, and a second group was dimmed with Osram DALI ECO BT controller. DALI (digital addressable lighting interface) function presents a communication protocol for building lighting applications. The current probe was set in a circuit to measure only the current flown into the fitting, thus avoiding monitoring of current distortion caused by dimmers.
Following the conditions given by EN 6100-3-2, the LED fitting was measured as manufactured at an ambient temperature of 24 °C after 20 min of operating at full load. LED fittings were powered from supply grid 230 V @ 50 Hz to meet the main aim of the presented research approach, that is, to prove that LED fittings dimmed under certain levels have a negative influence on the supply grid.
Testing was provided on a wide sample range. It contained 11 pcs of high-quality EU production LED fittings with different LED drivers. We analyzed the LED fittings using following producers:
2.2. Definitions of Investigated Variables
2.2.1. Power Factor
Power factor as a physical parameter is the ratio of transmitted effective and apparent power. The best condition is if the value of cos φ is as close as possible to 1 when the minimum reactive power is withdrawn or supplied in the supply grid.
Negative influences of low power factor:
Increased price of the electricity supply system,
Increased heat losses,
Increased voltage drop in the supply system,
Decreased utilization of generator and grid,
Degradation of short-circuiting conditions in the supply system. [
5,
7,
8].
In our case, lighting fittings would have a typically inductive load character, which requires capacitive correction of the power factor. However, drivers in LED fittings are usually equipped with capacitors used in power factor correction circuits.
Basic problems with the power factor then depend on the quality of this circuit. A passive filter circuit, as a cheaper solution, is utilized in most LED fittings. Active filter circuit, as the optimal solution, unfortunately, due to cost-cutting, is hard to find in the market. Serious producers are using them exclusively for special dimmable applications with higher market prices. ENERGY STAR program requires that the power factor of LED fittings with rated power higher than 5 W must be at least 0.70. For LED fittings with rated power lower than 5 W, no limits of the power factor are required [
17,
18,
19]. This requirement is parallel with the classification in the Commission Regulation (EU) 2019/2020 of 1 October 2019 [
13] where displacement factor cos
φ is required as follows: no limit
at Pon ≤ 5 W,
cos φ ≥ 0.5 at 5 W < Pon ≤ 10 W
cos φ ≥ 0.7 at 10 W < Pon ≤ 25 W
cos φ ≥ 0.9 at 25 W < Pon
where Pon means the electric power consumption of a light source in full-load with all lighting control parts and non-lighting parts disconnected.
For purposes of this paper, we must divide loads into two groups:
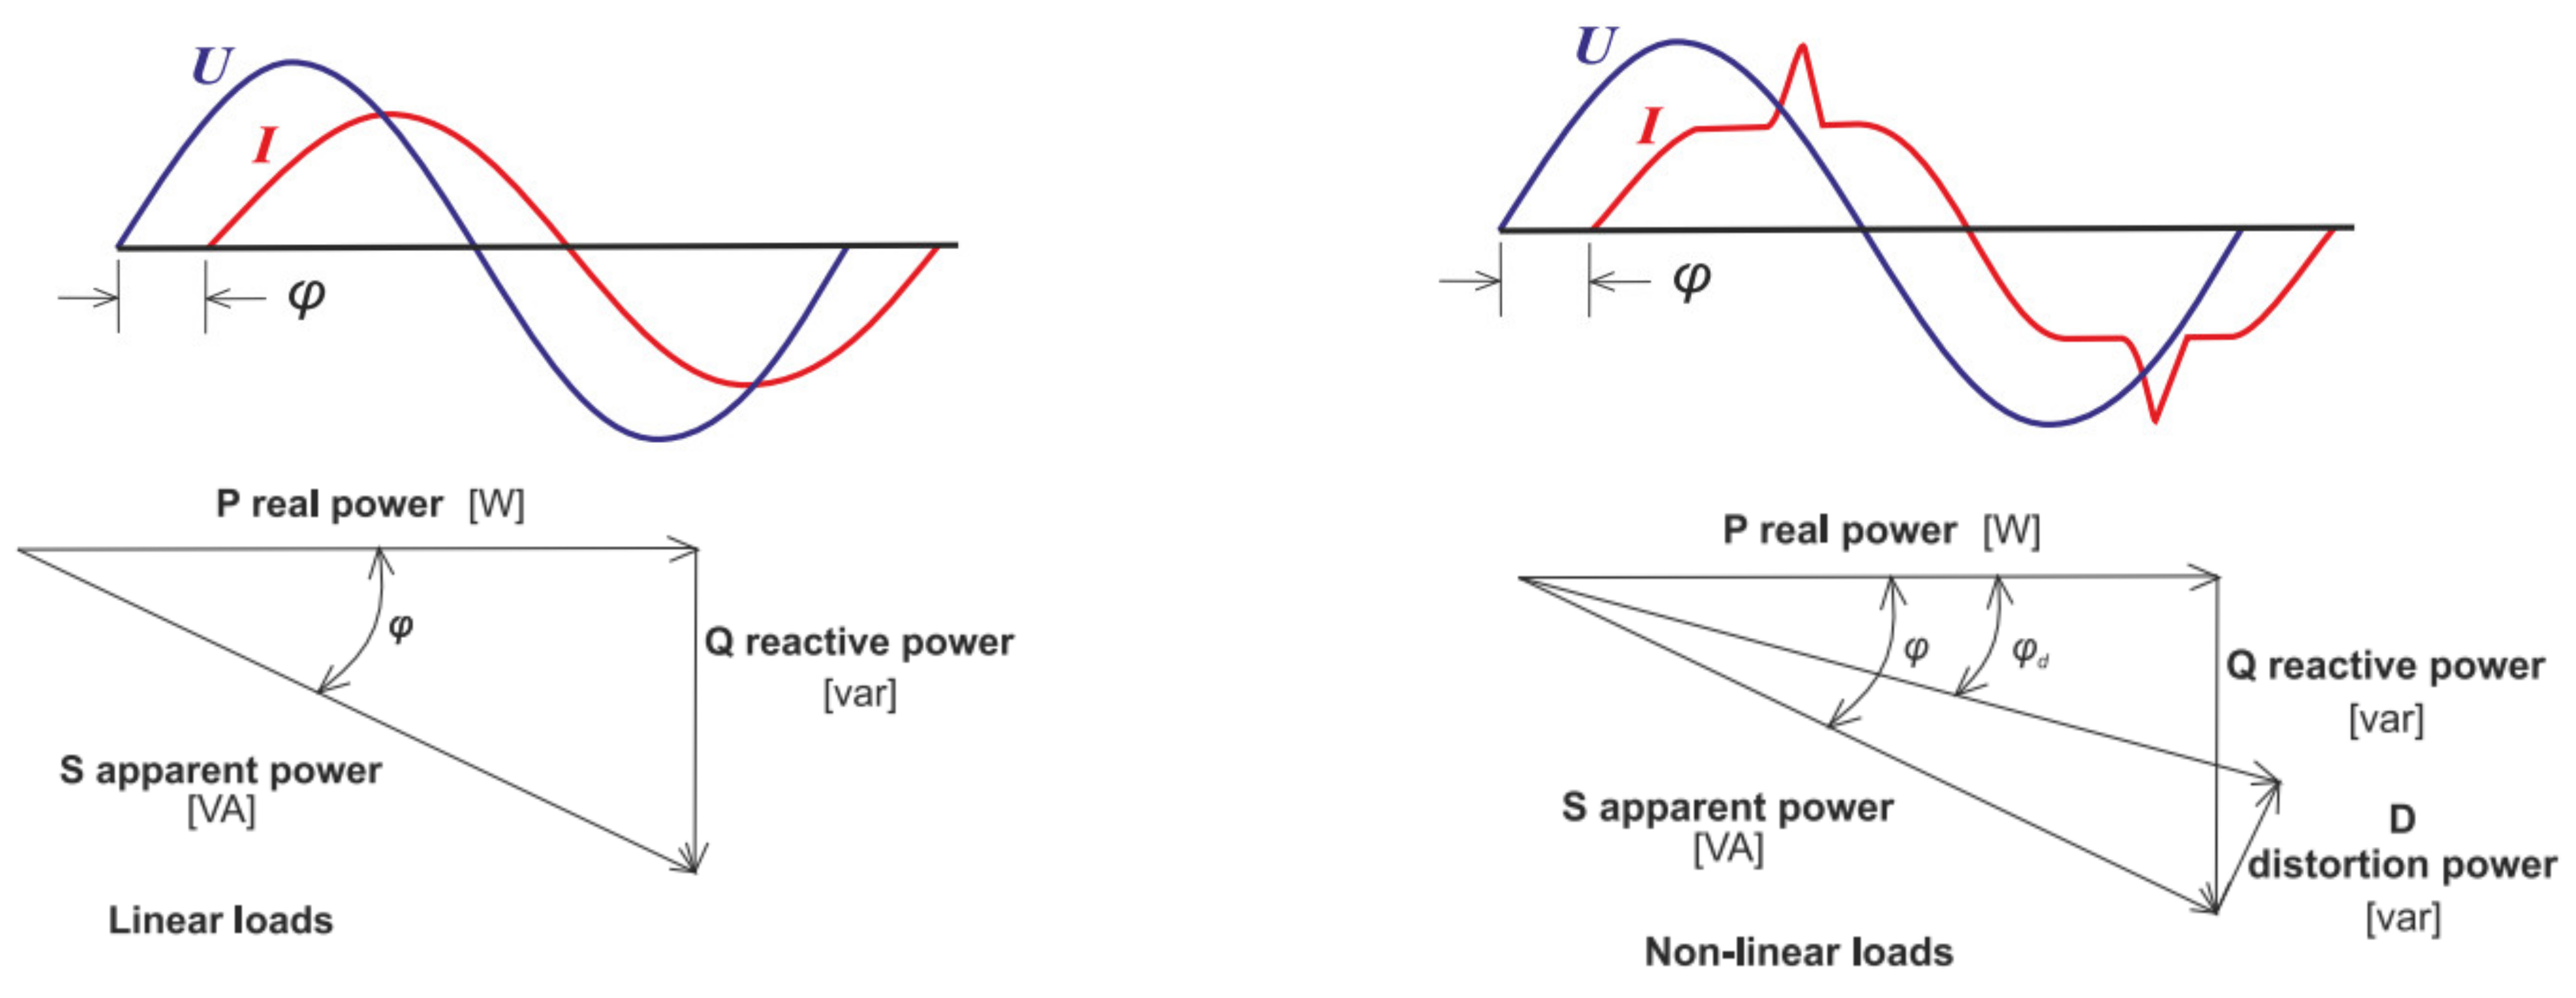
Linear loads—lagging power factor means that current lags (is behind) the voltage, and a leading power factor means that the current leads (is ahead) the voltage (
Figure 2). For inductive loads (e.g., induction motors, coils, HID (high intensity discharge) lamps), the current lags the voltage, thus having a lagging power factor. For capacitive loads (capacitor banks), the current leads the voltage, thus having a leading power factor.
The equations below express the relationship between real power
P and reactive power
Q and how is calculated displacement factor cos
φ.
Nonlinear loads—adding the distortion power
D of nonlinear loads in the mathematical expression of apparent power
S is taking into consideration the impact of harmonics distortion of current and voltage
In real applications distortion of current has an influence on harmonic voltage or in case of the small influence of distorted current, voltage waveform usually contains a certain percentage of distortion caused by external factors and we should also consider this distortion. Both distortions of current and voltage are expressed in the following equation by THD (total harmonic distortion).
Considering the distortion power in equations of apparent power, we transform displacement factor cos
φ into a real power factor
PF. Comparing the equations of apparent power for linear and nonlinear loads, we see that real power factor PF is always higher than power factor which considers only 1st harmonics of voltage and current.
Both factors would be equal only in case of zero distortions on higher harmonics of voltage and current waveforms.
2.2.2. Total Harmonic Distortion
Harmonic distortion represents the most concerning power quality problem. Both variables—harmonic spectrum and magnitude depend on the topology of the driver in LED fittings. LED fittings are single phase loads. In bigger installations, they are usually distributed equally in a three phase supply system.
Negative influences of harmonic distortion:
Overloading of neutral conductor;
Additional thermal—Joule losses in the conductors;
Derating and overheating of transformers, particularly due to saturation effects in the iron core;
Premature ageing of network equipment and consumer appliances;
Malfunction of sensitive devices (data, communication, controlling…) [
20];
Misreading of static energy meters [
13];
Damage on sensitive devices;
Damage on external power factor correctors due to
The amplification of the normal operating current, by resonance;
Influence on LED fittings in the circuit (flicker) [
5,
7,
8].
Producers are limiting their efforts and resources to limit the harmonic distortion in steady state of driver powered and loaded at nominal values only. Then, dimming the LED fitting under certain levels means a significant increase in the harmonic spectrum and its magnitude. Also, for a high density of LED fittings in small installations (low diversity factor, small distances between fittings, switches), where only small natural harmonic attenuation occurs, harmonics will rise significantly.
According to EN 50160, EN 61000-2-2 and EN 6100-3-2, total harmonic distortion is defined as the ratio of the RMS (Root mean square) value of the sum of its harmonic components to the RMS value of the fundamental component [
21,
22].
In context of 61000-2-2- harmonic voltage components Uh of orders 2 to 50,
In context of 61000-3-2 harmonic current components Ih of orders 2 to 40.
Standard EN 61000-2-2 sets harmonic voltage limitations in PCC (point of common coupling) for purposes of construction planning of electrical devices (in our case, LED fittings) that shall be constructed in a way that they may be able to operate in this environment and shall be constructed in a way that will not emit distortion waves exceeding these limits. The compatible level of harmonic distortion shall not exceed 11%.
According to EN 61000-3-2 for the purpose of harmonic current limitation, our tested LED fittings belong to Class C. Then in Class C, LED fittings are divided into three power groups basing on power rate with ranges:
Within the presented results of this paper, standard EN 6100-3-2 was utilized (
Table 1), while it is considered that for office, industrial and public illumination, LED fitting with rated power >25 W are used. The percentage of the third harmonic is expressed as 30
λ, where
λ represents the power factor of the electrical device. For example, if we set the value
λ = 0.96, percentual limit is then 28.8%. We would like to mention that all tested LED fittings fulfill the condition of ENERGY STAR requirements [
17] setting
λ on value ≥0.7. This minimum level, in real applications, is considered very low and used in cheap products for domestic use. The power factor marked on tested LED fittings exceeds the value of 0.94 as they are using quality drivers.
It is important to note, that for those types of LED fittings that include control ability (e.g., dimming, color), the harmonics of the input current should not exceed the harmonic current values derived from the percentage limits given in
Table 2. Standard 61000-3-2 defines the following testing conditions:
With the means for control set to obtain Pmax
With the means for control set to the position expected to produce the maximum total harmonic current (THC) within the active input power range [Pmin, Pmax], where:
- ○
Pmin = 5 W, if Pmax ≤ 50 W;
- ○
Pmin = 10% of Pmax, if 50 W < Pmax ≤ 250 W;
- ○
Pmin = 25 W, if Pmax > 250 W [
2].
During measurement, it is required to investigate two states of fitting: the first set on Pmax and the second set on P where maximal THC occurred, but not less than 5W, because a group of our office and streetlight LED fittings have rated output power Pmax ≤ 50 W. For a group of two industrial high-bays, we shall investigate two states of fitting: the first set on Pmax and the second set on P where maximal THC occurred, but not less than 10% of Pmax, which in our case means Pmin = 10 W, since this fittings have rated power 100 W.
Mentioned standards are reporting maximum values or ratios (depending on the type of electronic device). For the purposes of this paper, those values were converted into one table with limits up to the 25th of the harmonic order (See
Appendix A), thus it will be easier to compare measured values with the standard requirements.
Table 2 reports maximum allowed percentual values of input currents of EUT (equipment under test) and voltages of test source at harmonic frequencies. Test source and
Table 2 from standard EN 6100-3-2 [
21] are reporting maximum allowed percentual values of voltages at harmonic frequencies presented in
Table 1 from standard EN 6100-2-2 [
3], maximum allowed percentual values of voltages at harmonic frequencies presented in
Table 1 from standard EN 50160 [
22] and all limits up to 15th harmonic order.
Table 2.
THD limits given by EN standards.
Table 2.
THD limits given by EN standards.
| Harmonic | Order | 2 | 3 | 4 | 5 | 6 | 7 | 8 | 9 | 10 | 11 | 12 | 13 | 14 | 15 |
|---|
| 61000-3-2 | THDI [%] | 2.0 | * | | 10 | | 7.0 | | 5.0 | | 3.0 | | 3.0 | | 3.0 |
| 61000-2-2 | THDU [%] | 2.0 | 5.0 | 1.0 | 6.0 | 0.5 | 5.0 | 0.5 | 1.5 | 0.5 | 3.5 | 0.5 | 3.0 | 0.4 | 0.4 |
| 50160 | THDU [%] | 2.0 | 5.0 | 1.0 | 6.0 | 0.5 | 5.0 | 0.5 | 1.5 | 0.5 | 3.5 | 0.5 | 3.0 | 0.5 | 1.0 |
| 61000-3-3 ** | THDU [%] | 0.2 | 0.9 | 0.2 | 0.4 | 0.2 | 0.3 | 0.2 | 0.2 | 0.2 | 0.1 | 0.1 | 0.1 | 0.1 | 0.1 |
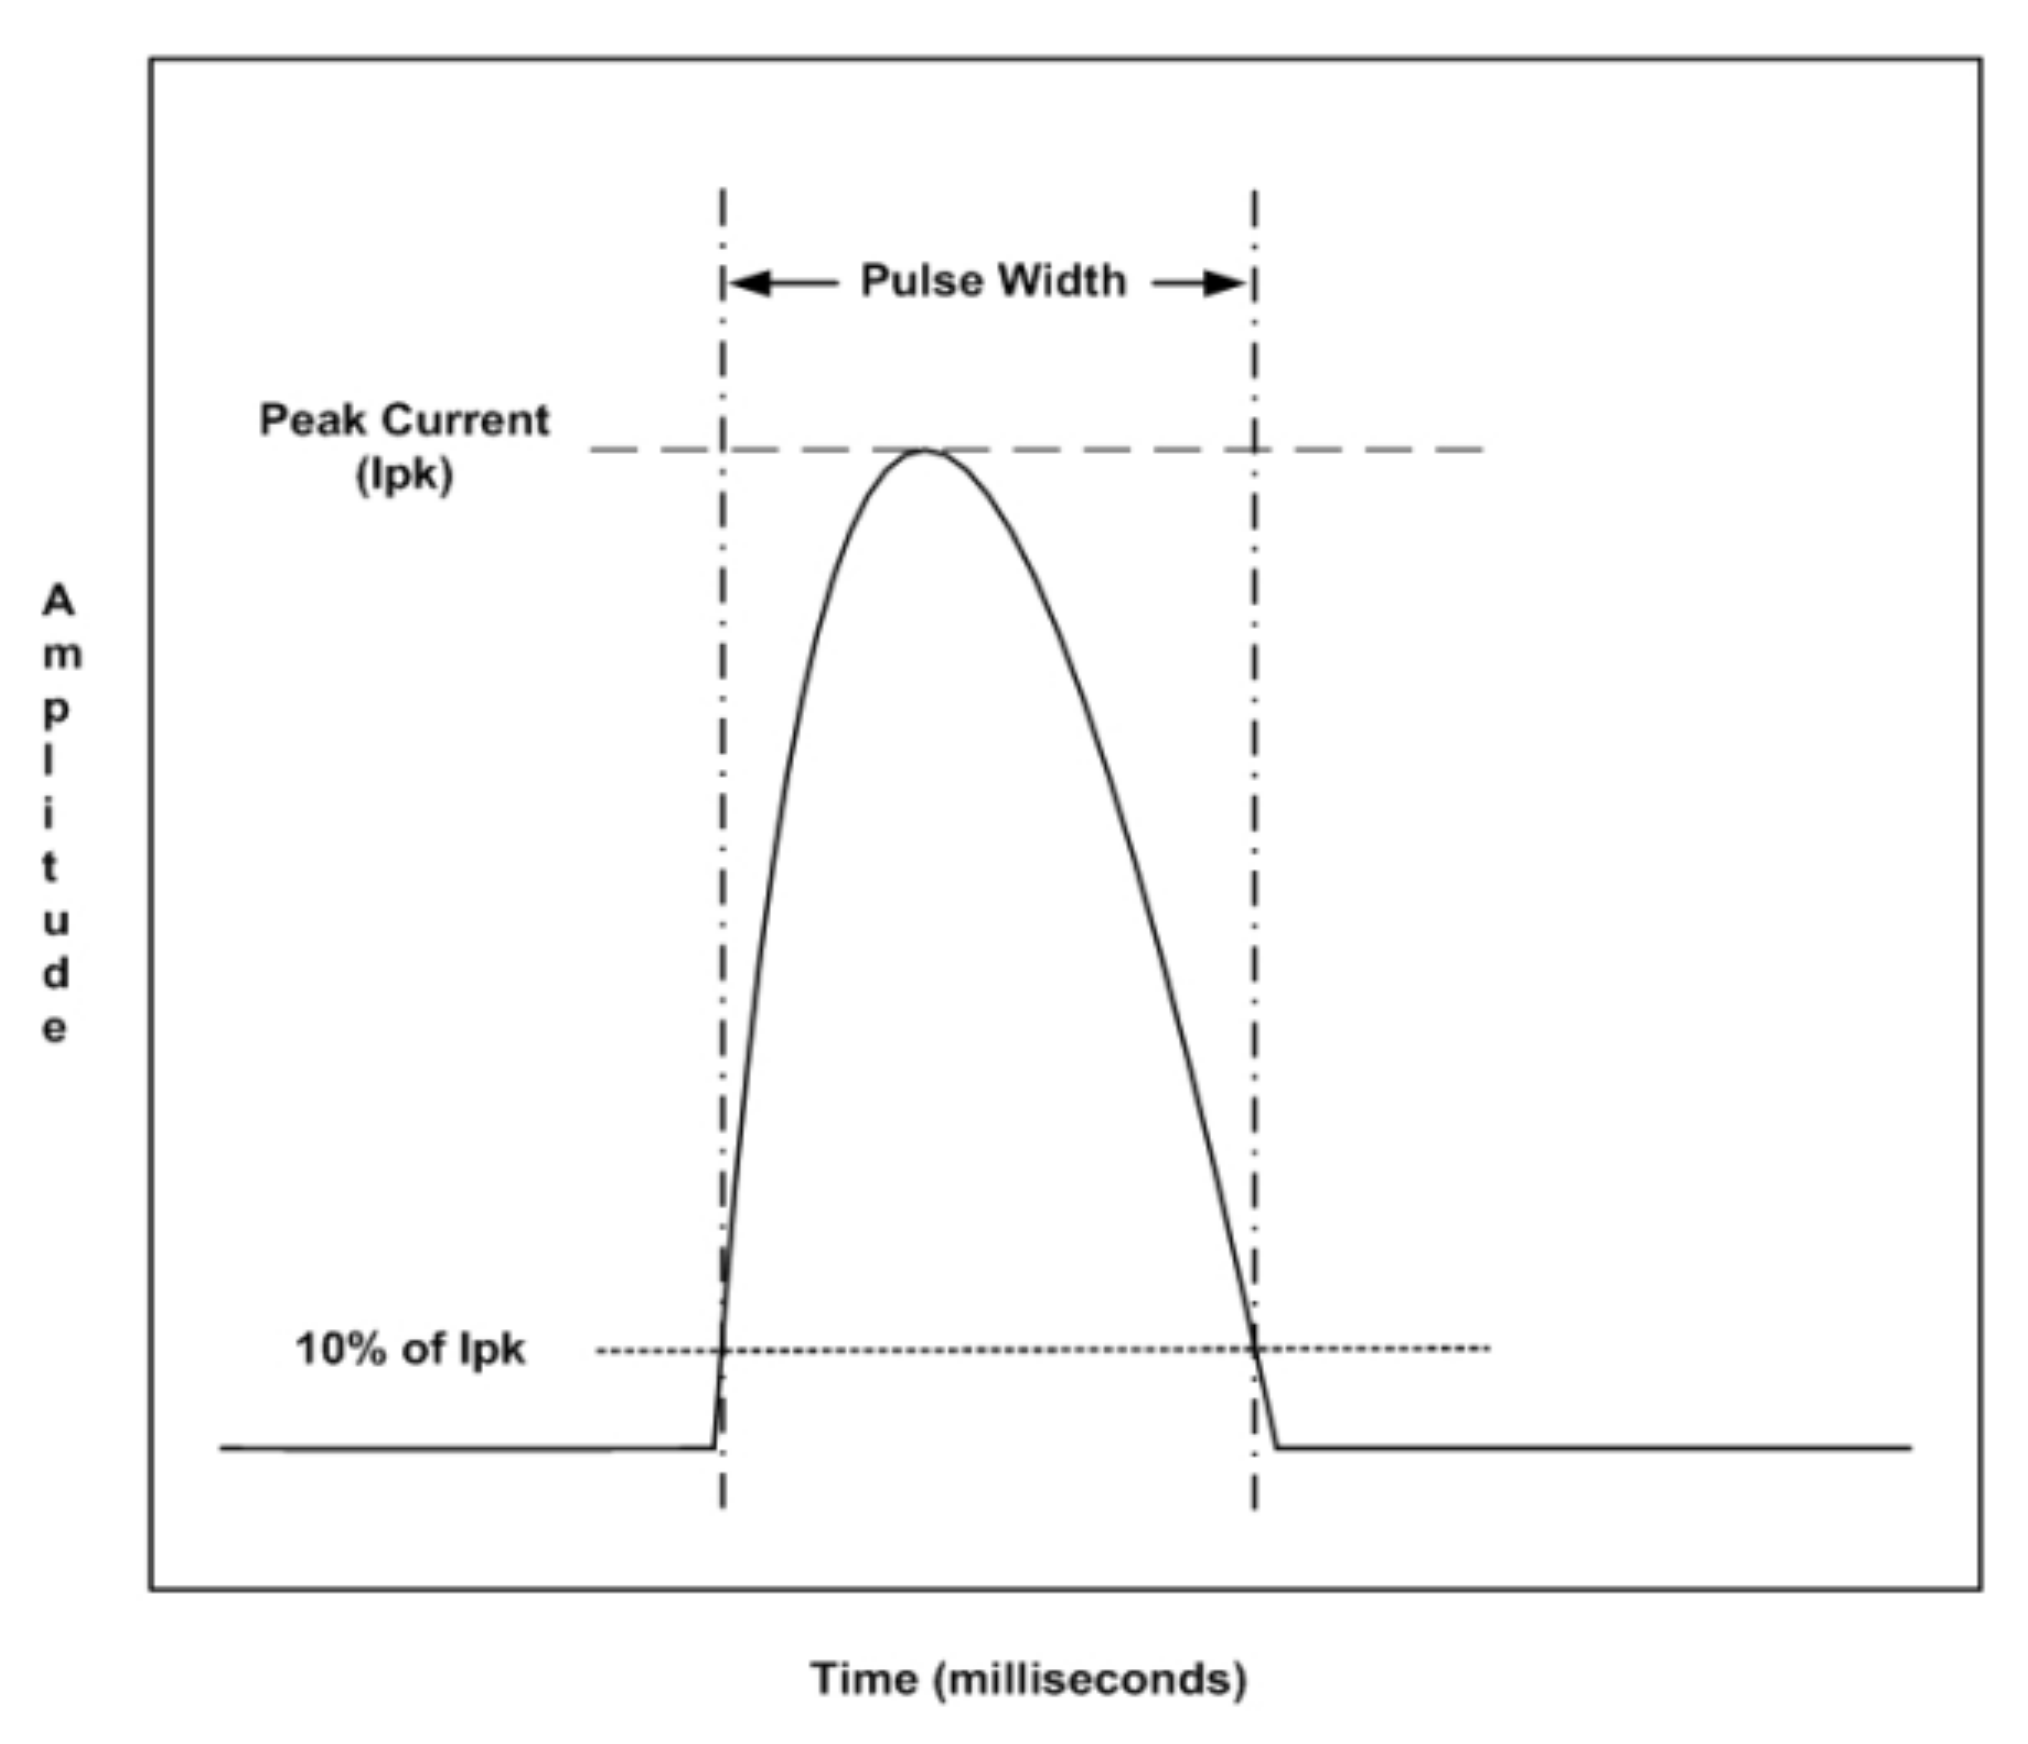
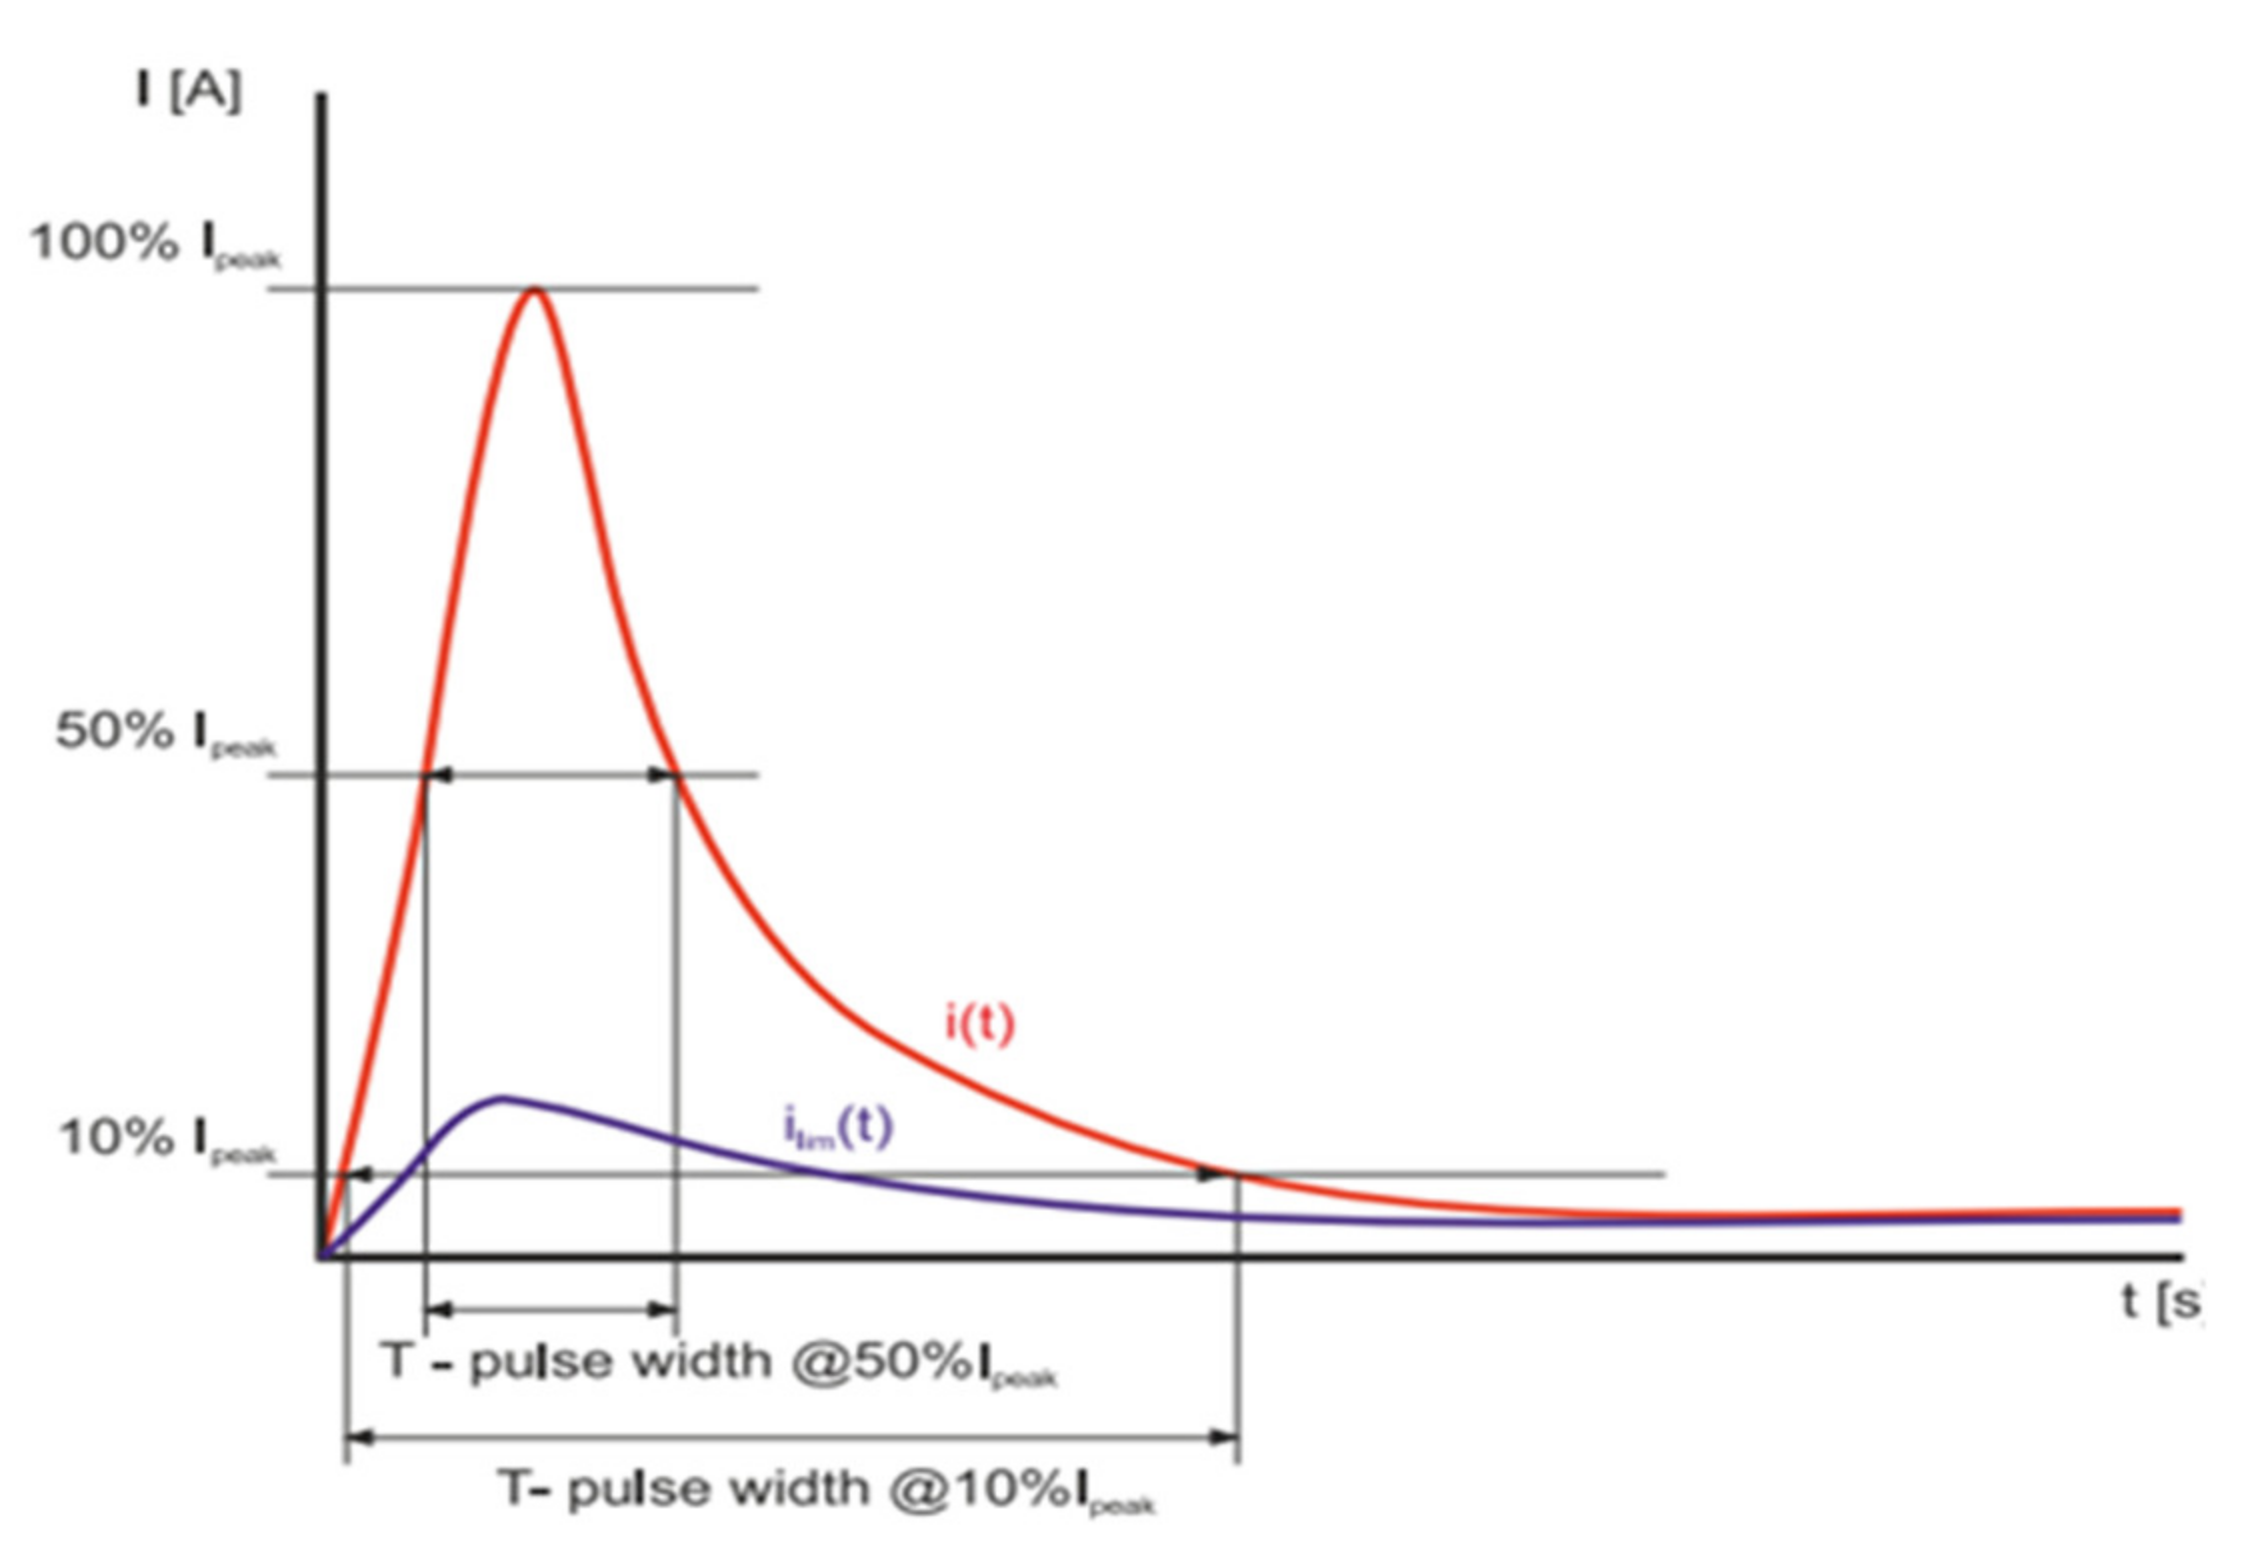
2.2.3. Inrush Current
Inrush current is transient current caused by charging capacitors needed for energy accumulation, which is required by the power factor correction converter. Typically, it lasts 1–2 ms and could be more than 100 times higher than the rated current (
Figure 3). Inrush current became the most popular and discussed parameter of LED fitting installation between final users, as the only visible parameter that occurs immediately after switching on the installation.
Negative influences of high inrush current:
According to NEMA standards, inrush current is defined as input current of short duration during initial start-up, that is, much greater than the operating or steady-state current. Pulse width, as defined in the context of this standard, is the time interval between the leading edge and lagging edge of a pulse at a point where the amplitude is 10% of the peak value.
The inrush pulse is shaped by two main parameters: the bulk capacitance of the electronic ballast or LED driver and the system source impedance. As the source impedance increases, the peak current decreases. LED drivers connected at a longer distance from the point of connection of the building will produce a lower inrush current because the impedance to the point of interconnection will be higher. The electronic devices—in our case LED drivers, must limit the inrush current by having a maximum allowable input capacitance as specified in
Table 3 or by incorporating a means of simultaneously limiting both the peak current and the I
2t (
Figure 4) to values not greater than those specified in
Table 4 [
23].
The I
2t values in
Table 4 are based on a pulse width of approximately 2ms and the I
peak—peak currents shown in this
Table 4. The values in
Table 3 and
Table 4 are additionally defined in ANSI C82.11 and ANSI C82.14 [
4].
Application of means to limit the inrush current, should decrease I
peak to lower values and eventually shorten pulse width as shown on
Figure 5.
3. Results
3.1. Evaluation of the Values of Power Factor for Selected Lamps
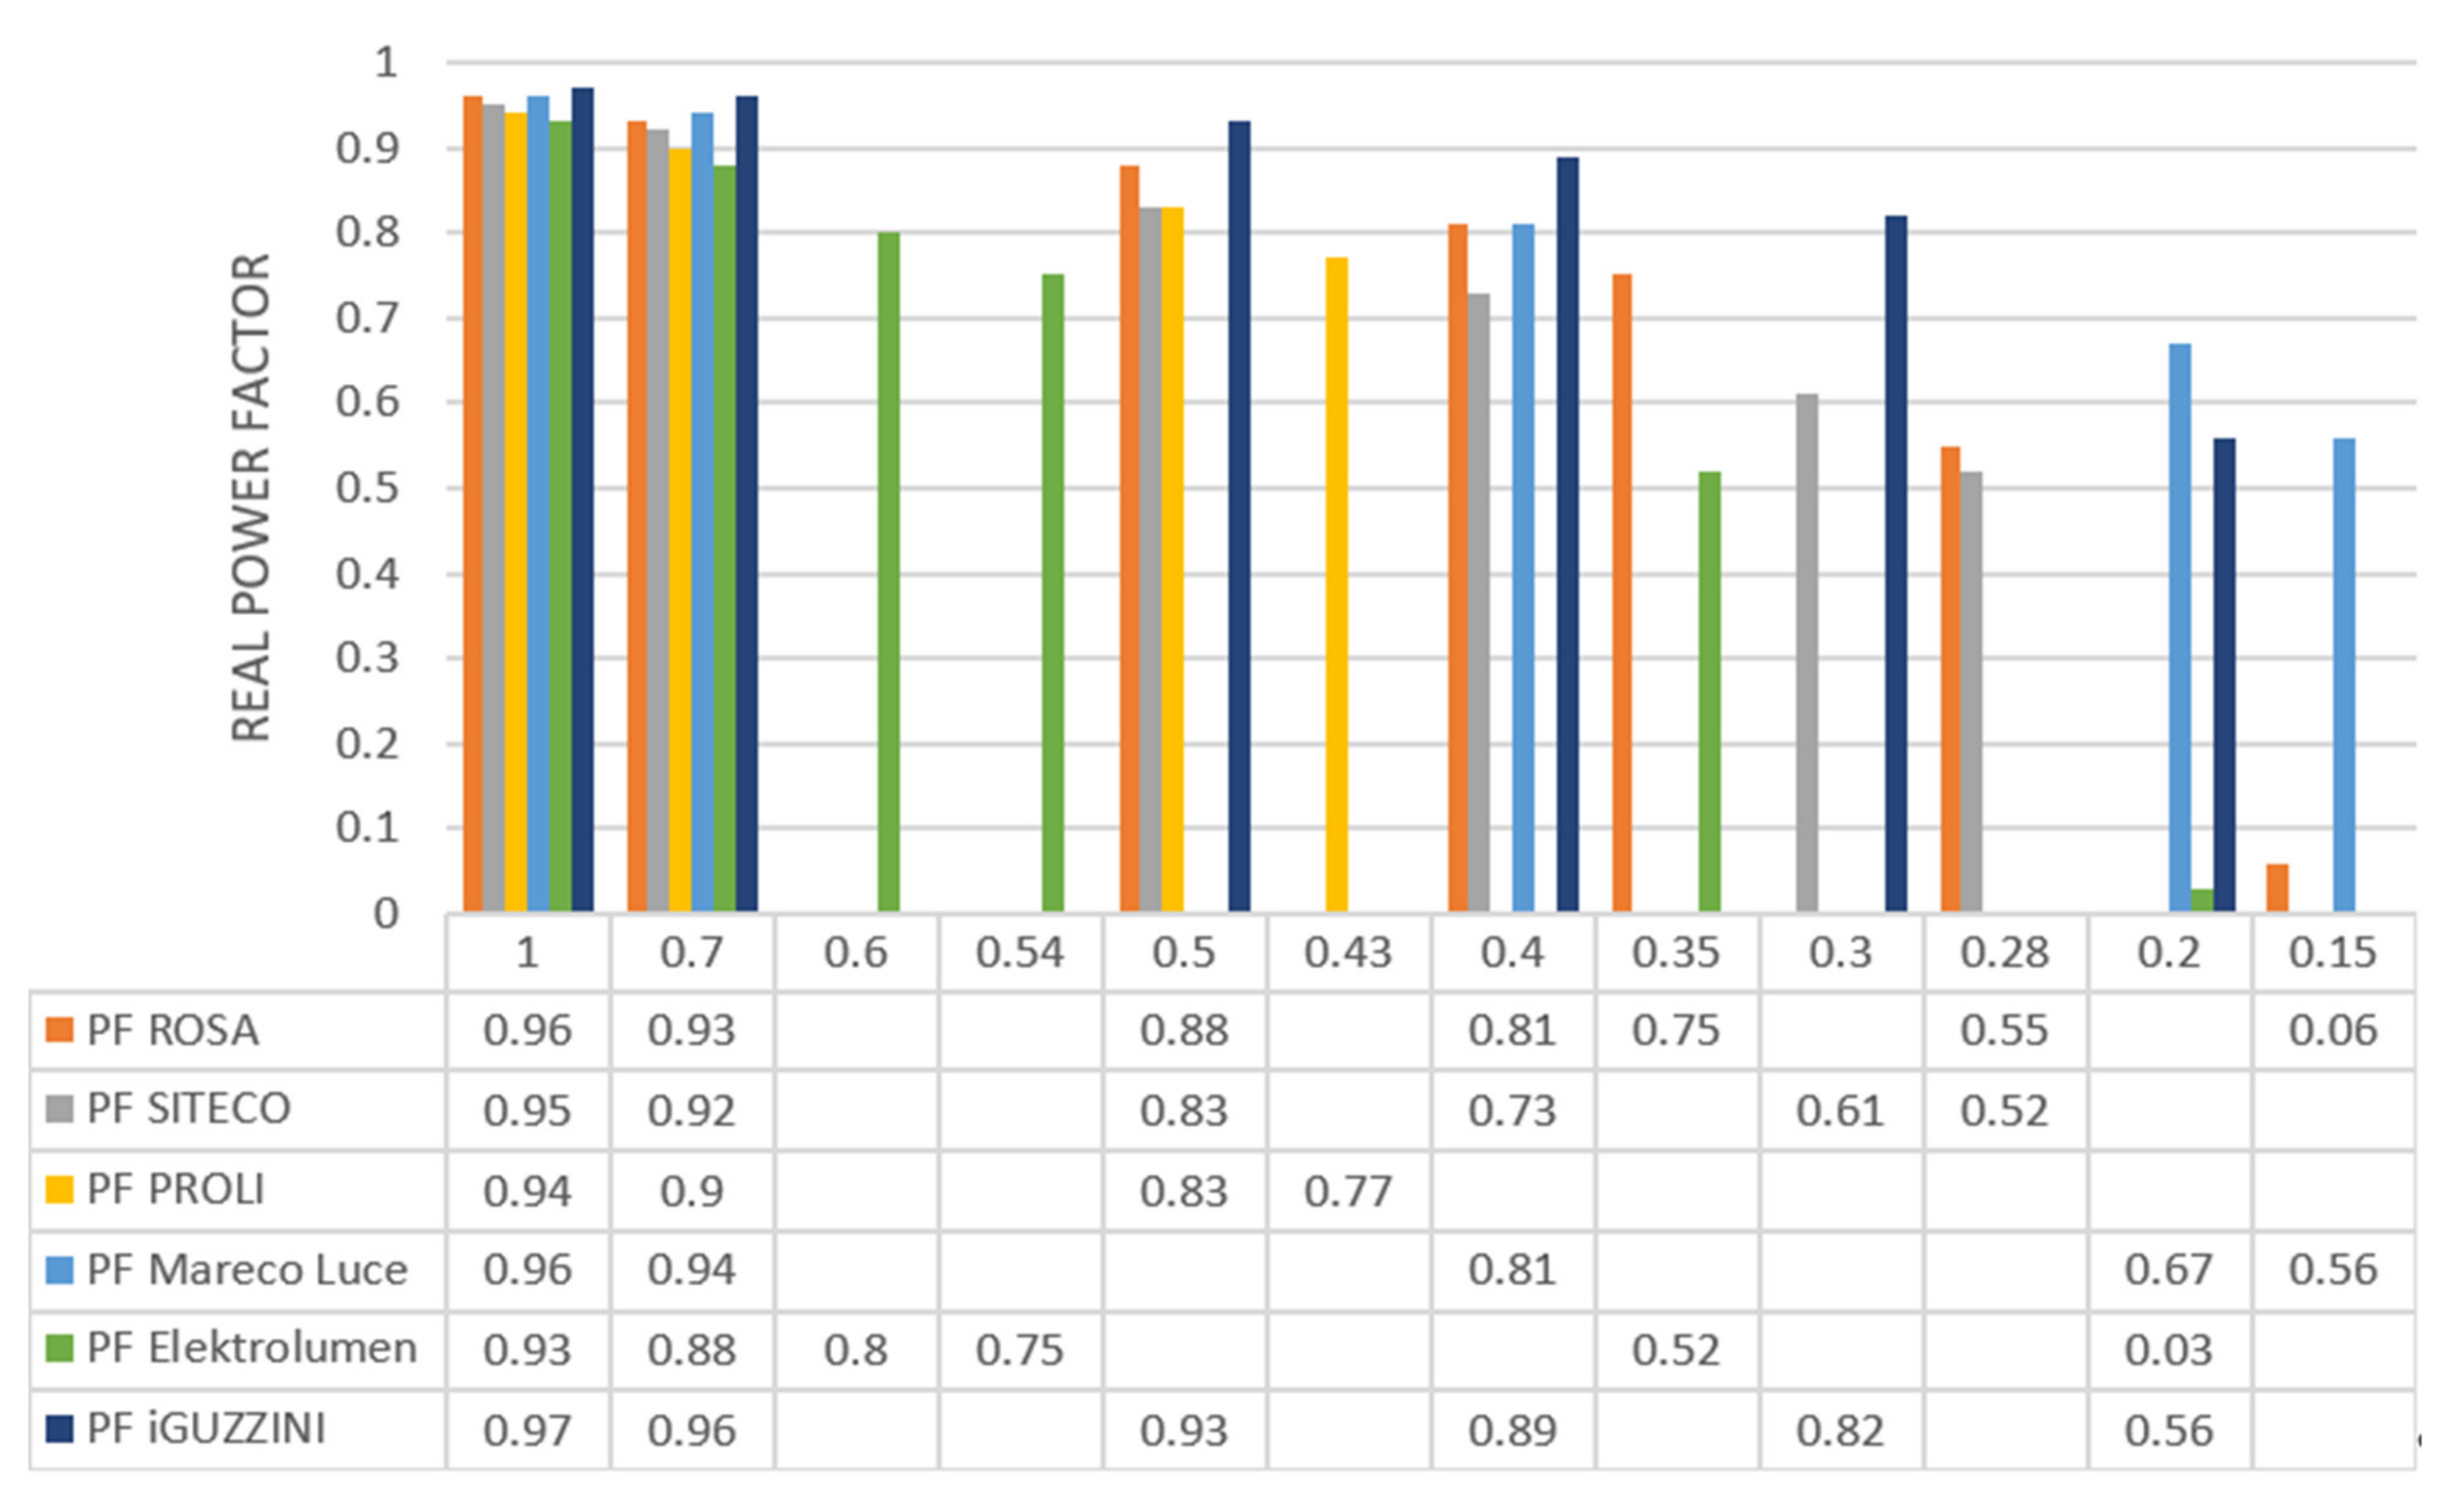
During the measurement of total harmonic distortion, the power factor was determined with the use of the PQA 824. The evaluation was realized within a wide dimming range of LED fittings. The lower the light was dimmed the lower the power factor was achieved until the driver was forced into the condition that it stops power delivery and consumes only energy for its own circuitry. Discreet values of real PF are presented in the following combined tables with graphs (
Figure 5,
Figure 6 and
Figure 7), so it is possible to easily compare measured values between tested LED fittings.
Figure 5 shows results for the selected group of streetlights, while the dependency of PF on active power is being plotted. Here the range of active power is within 100–15% of the nominal power of LED fittings. From the obtained results, it is seen that individual types of LED drivers have been operated variably according to dimming capabilities. It means that not all of the lights were able to be operated at a predefined dimming level. Results for the LED fitting designed by Mareco Luce show, that the value of PF is achieving high levels compared to other fittings if the lowest value of active power is considered. Similar behavior is evident for LED fitting iGUZZINI [
25].
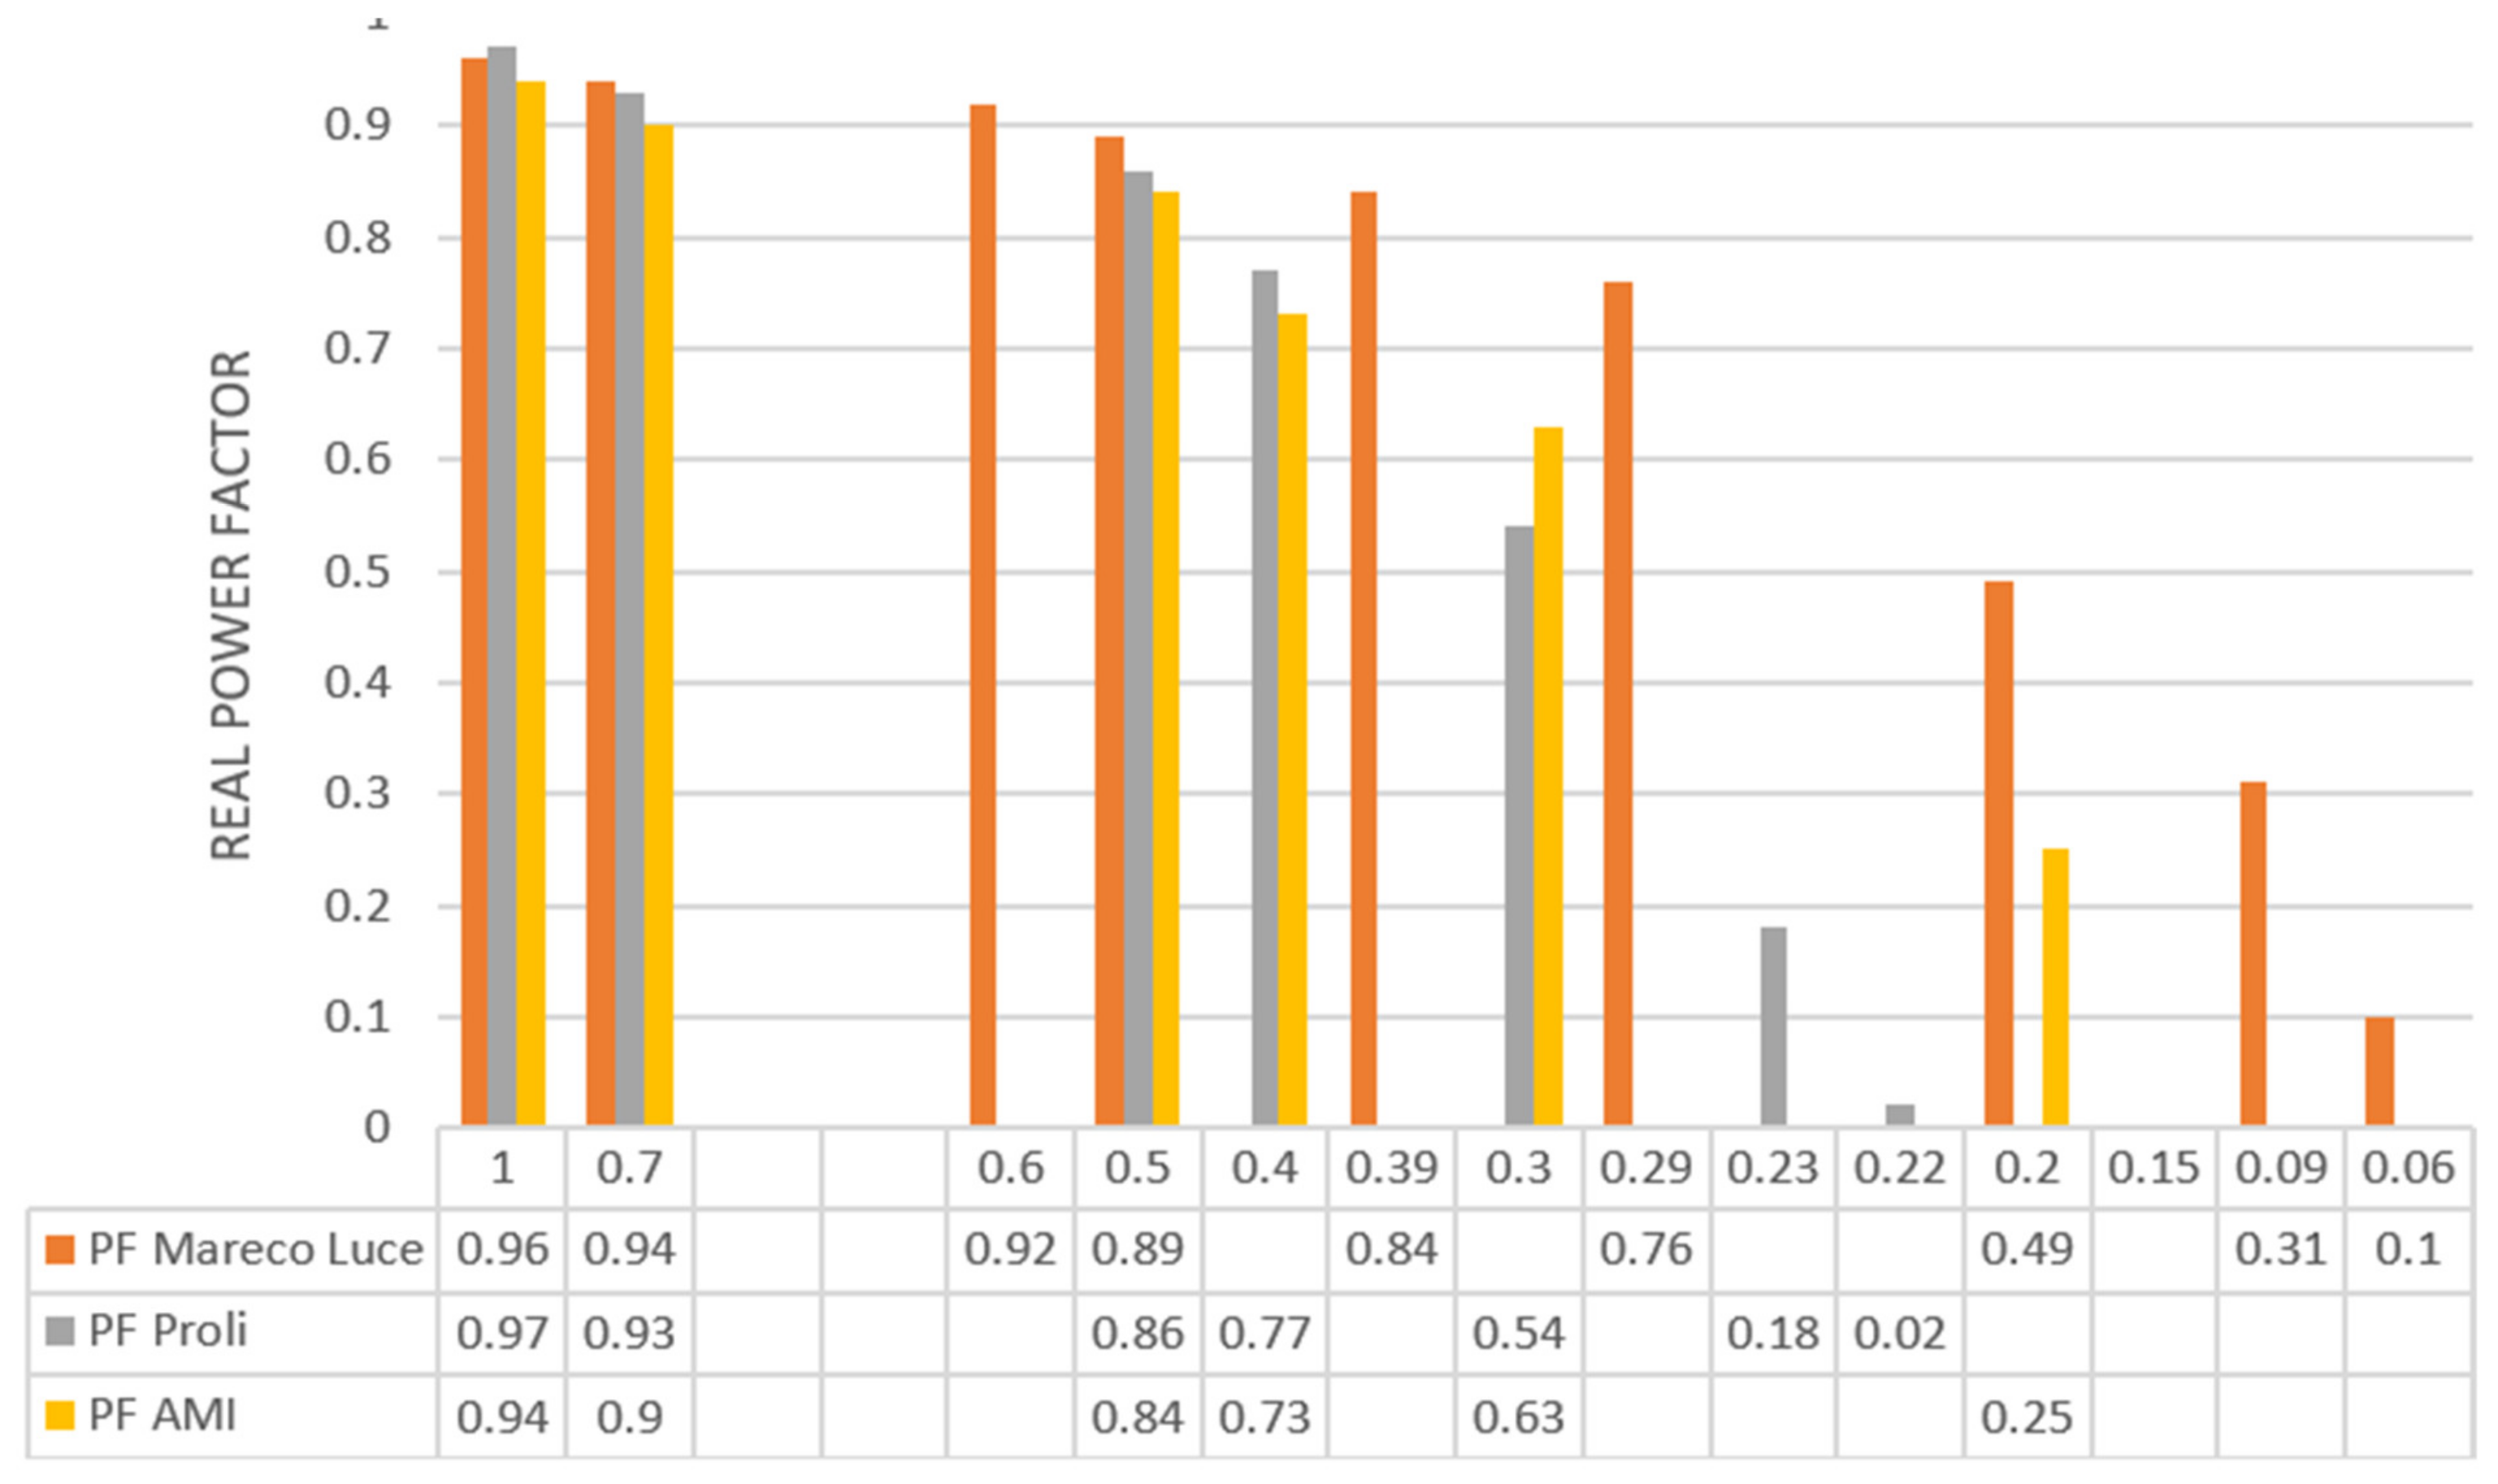
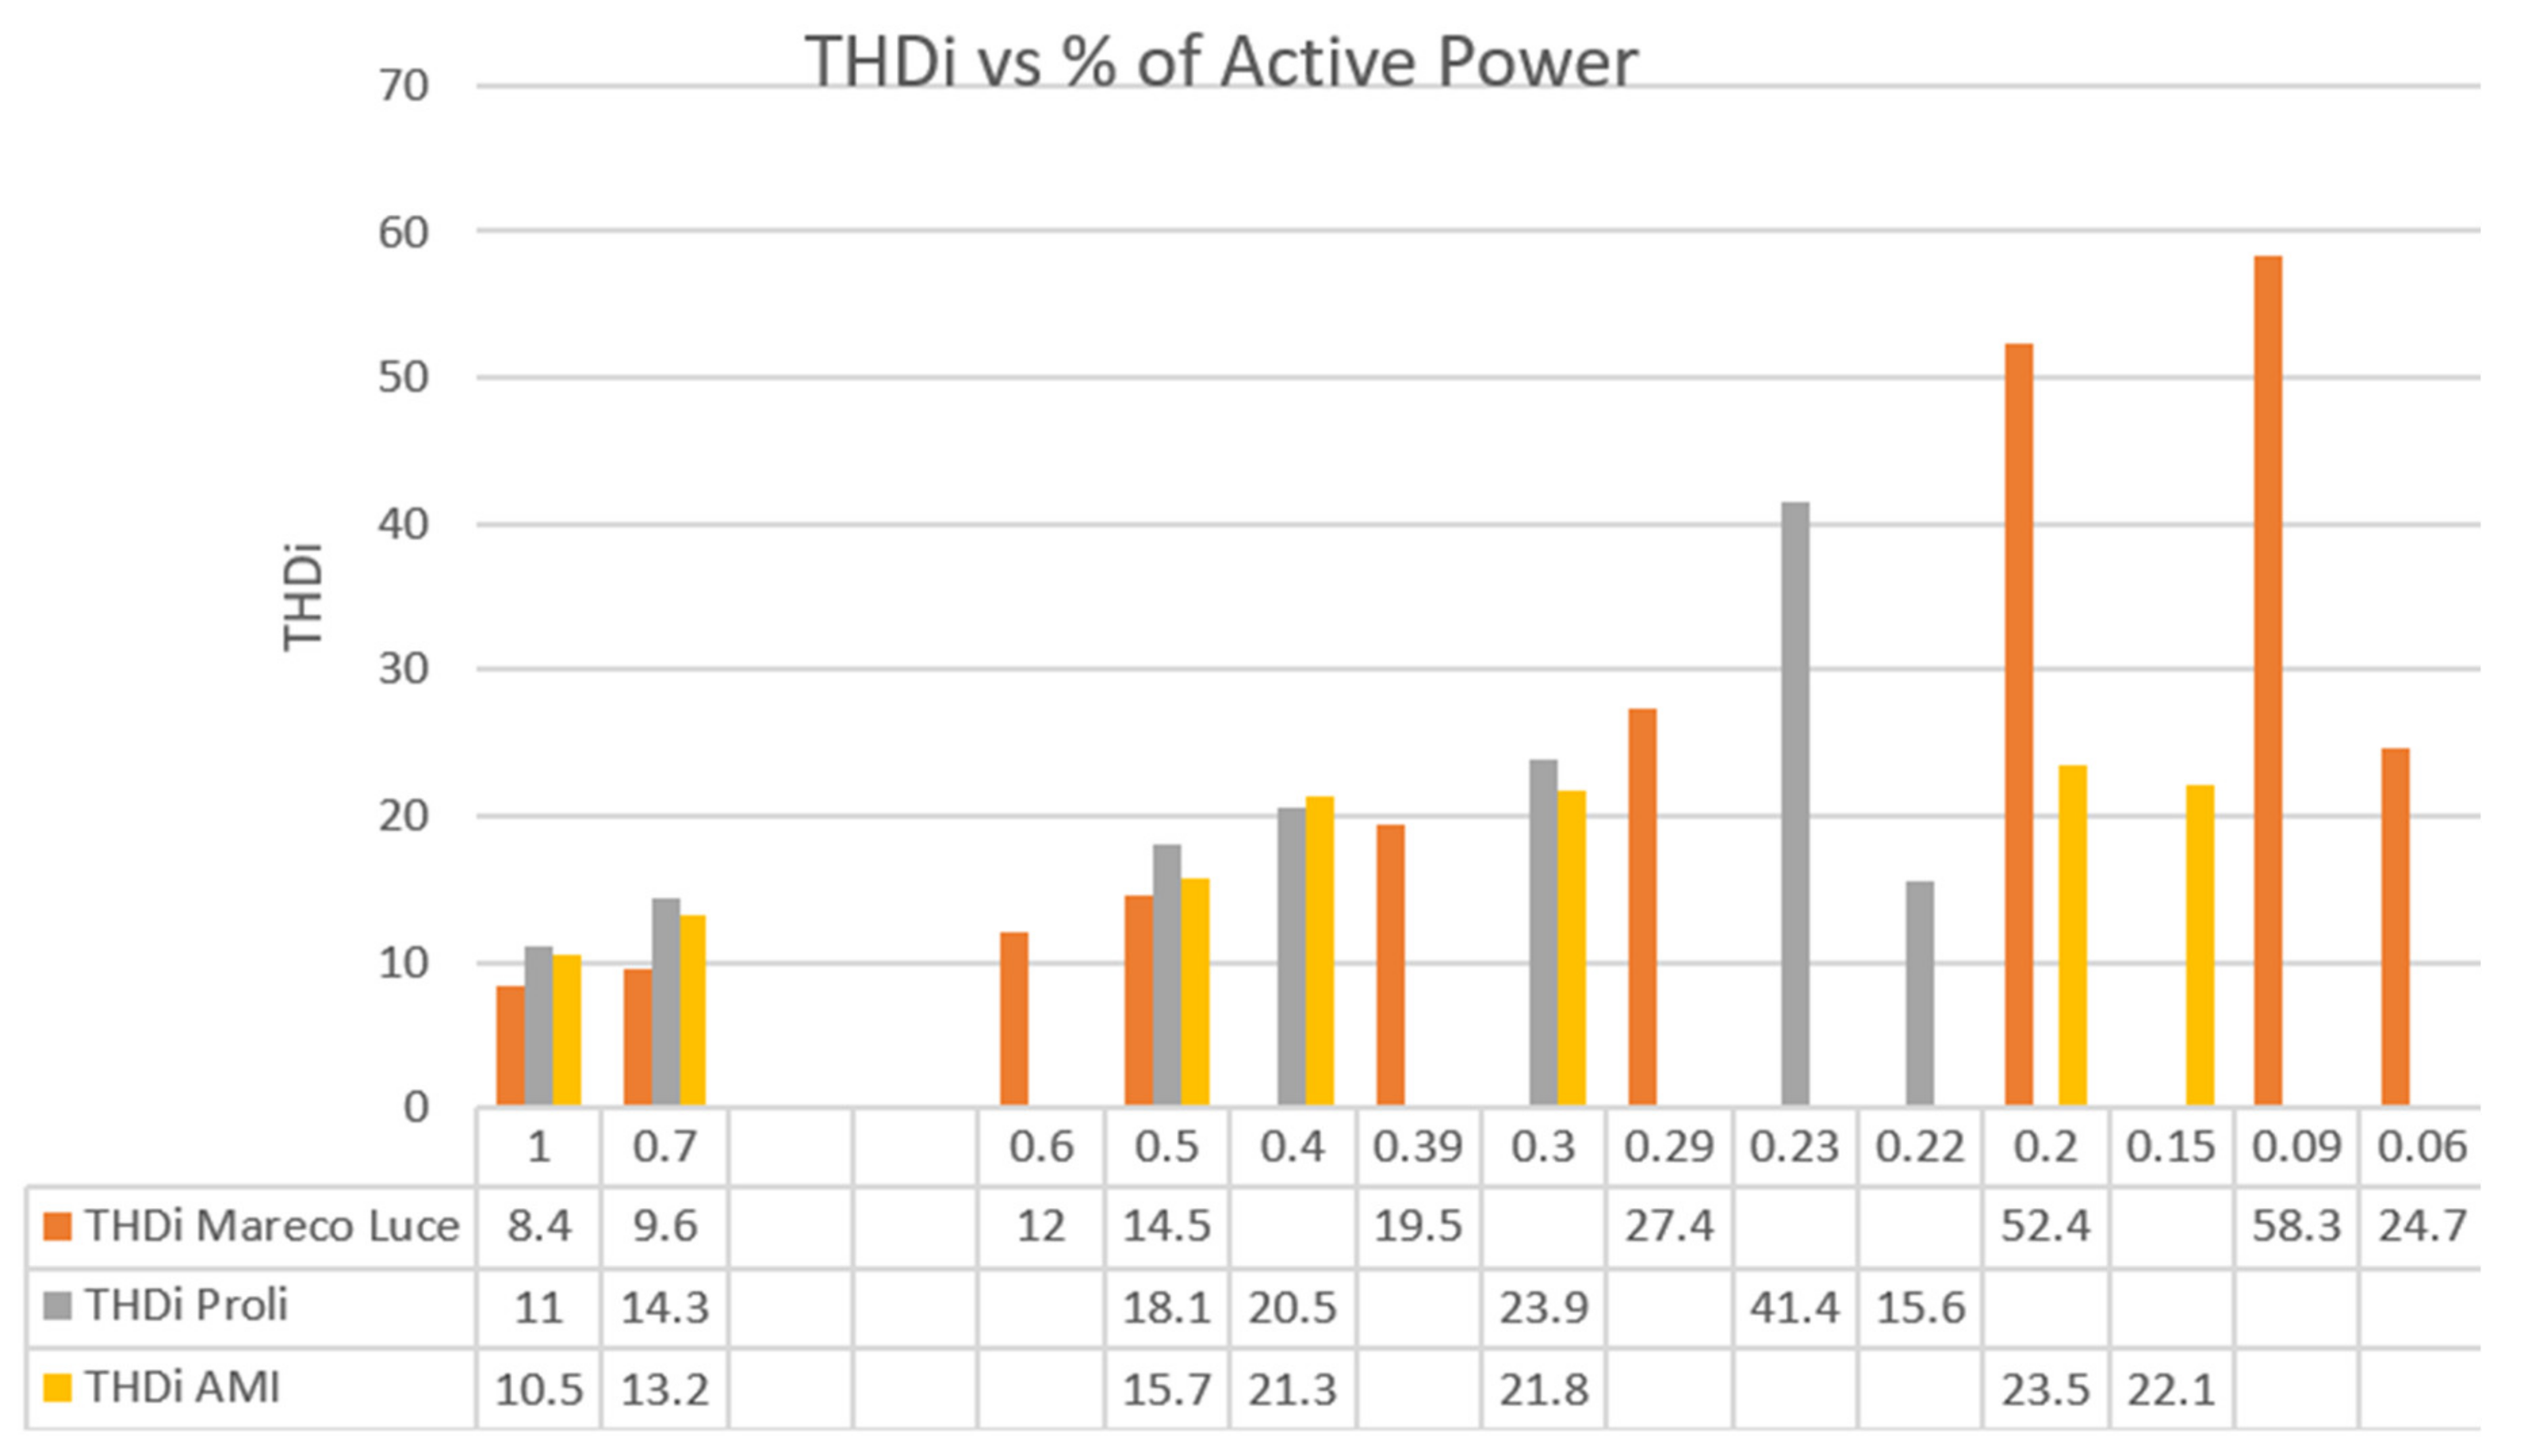
A similar experiment was conducted with the selected groups of LED fittings suited for office lighting. The results of the PF in dependency on active power of LED driver are shown in
Figure 6. The procedure of the measurement was similar to the previous category, that is, street lights, while the range of active power is within 100–6% of the nominal power of LED fittings. From the results, it can be seen that for the case of office lights, the ability to operate at each defined dimming condition was not achieved for any of the selected devices. A high value of PF for 50% of dimming/active power was measured for each of the selected components, but only Mareco Luce was able to operate at the lowest tested condition (6%).
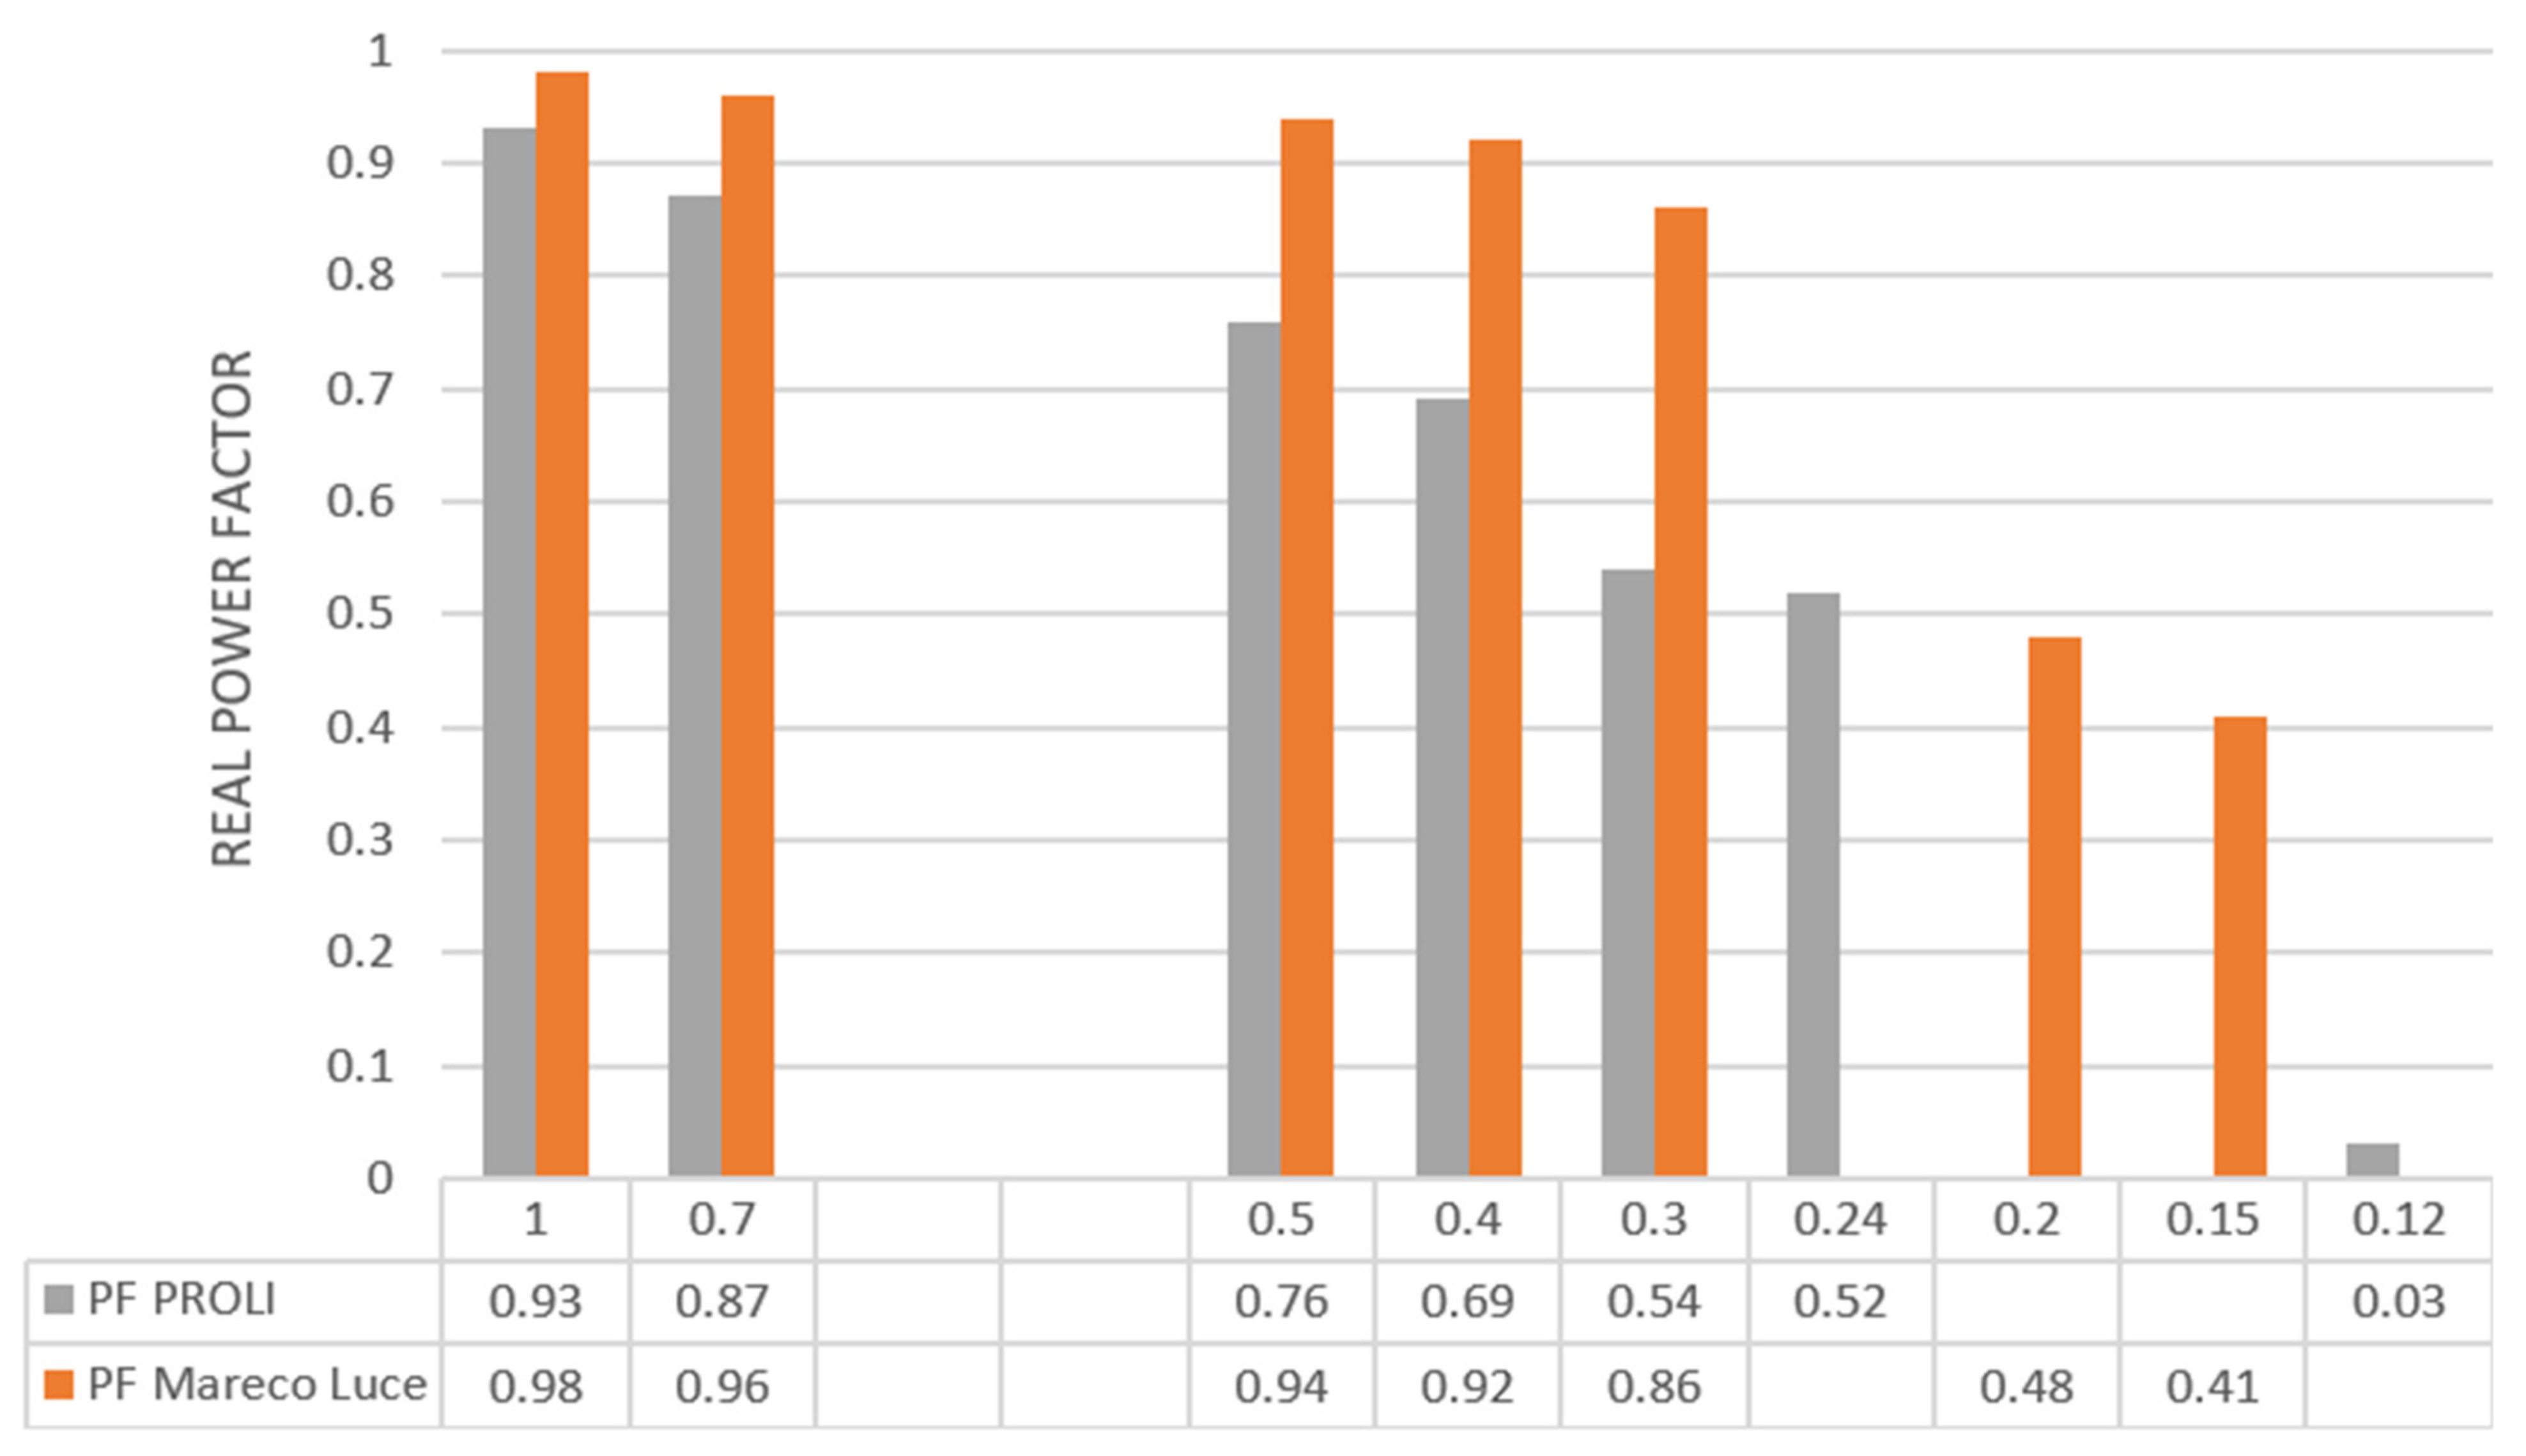
Figure 7 shows results for high-bay (industrial) lights. Analyzing the achieved results, it can be concluded that Mareco Luce-Aries holds higher PF values at a wider dimming range. This result is similar to previous experiments with street and office lights, thus, based on the evaluated facts, the performance of LED drivers (Meanwell vs. Sosen) used within selected LED fittings shows various performance, and is not validated in datasheets as presented here. Better performance was achieved with the drivers from Meanwell.
Based on results from
Figure 5,
Figure 6 and
Figure 7, it could be concluded that the LED driver holds a very high value of power factor in the examined range of dimming the LED fittings. Especially in the most used range from 100% to 50%. However, if these products would be used in smart installations that try to set dim levels under 40% to a minimum, the power factor will fall to unacceptable levels and installation will require compensation of reactive power. From the measurement data, we can understand that the power factor with capacitive character is presented in all LED fittings, thus it is lowering in dependency on dimming the fitting.
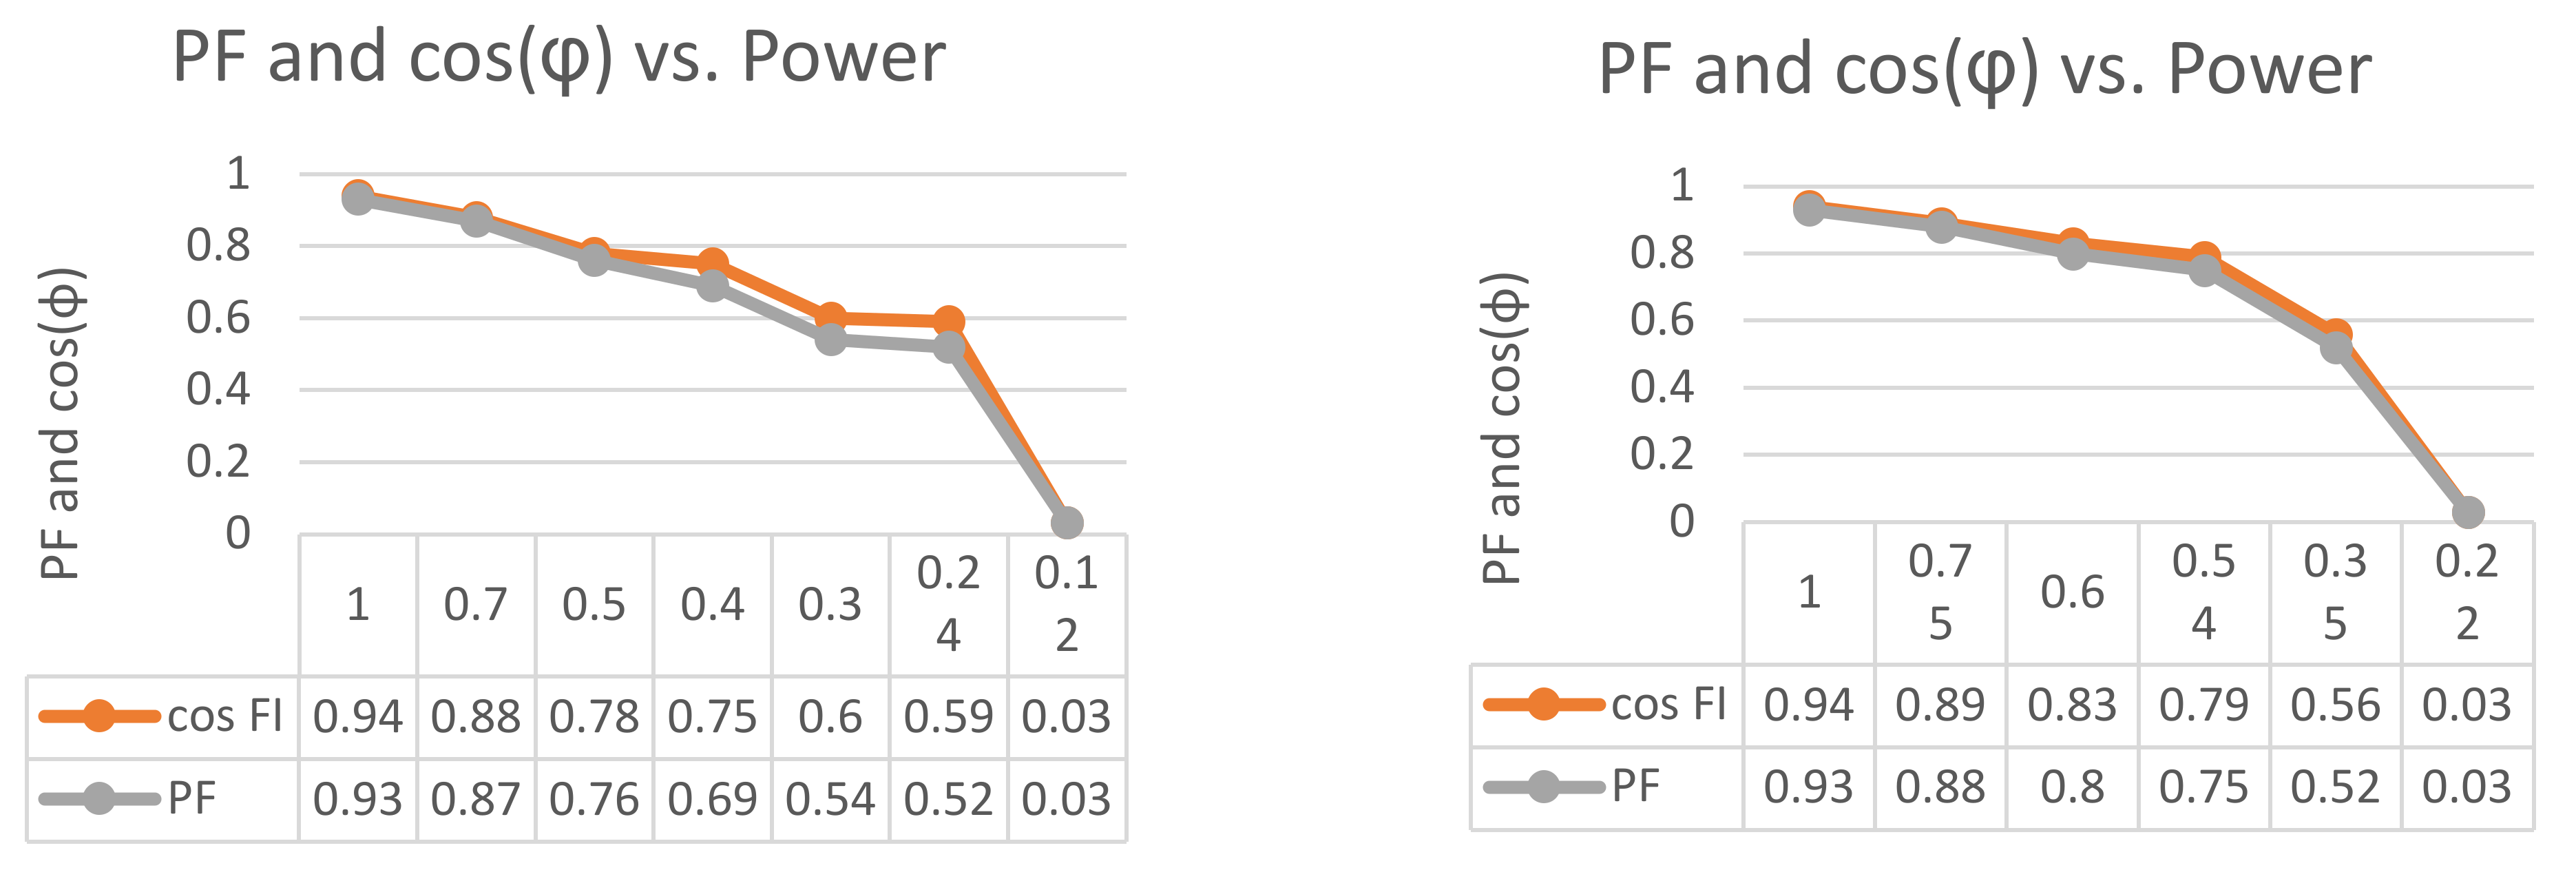
3.2. Evaluation of the Relation between Real Power Factor and Power Factor of Fundamental Harmonics
Data presented in
Figure 8 confirm basic theorems about the relationship between real power factor PF and power factor of fundamental harmonics of current and voltage
PF ≤ cos
φ.
Two LED fittings as an example were compared (one high bay and one streetlight). Our test confirms, that the lower the light is being dimmed, the lower the power factor and real power factor are. By this experiment, it is confirmed that at lower dimming levels more influential phase shift of higher harmonics is observed, even fundamental harmonic is always prevailing. We see that the last values in
Figure 8 of the real power factor PF and cos
φ are practically the same. LED fittings Proli and Elektrolumen at this point turned off the LED circuit and both fittings continued absorbing only energy for driver circuits. Here the effect of reactive capacitive power (bulk capacitance of LED driver) with a small effect of higher harmonics is observed.
It was noticed that in cases of fittings that did not turn off completely when receiving control signal (DALI or 1–10 V only reactive power is detected. Obviously, also active power should be detected, but the value was too small due to the low consumption of only one idling LED fitting. Partially it is caused by the recognition level and display properties of PQA824. An important fact determined from this experiment is that LED fittings consumed power (mostly reactive—so in our case of capacitive power factor inject reactive power in the grid) also after receiving a signal in order to lower output power to a minimum.
During the measurements, it was found out that even when using a fully digital DALI dimming controller, it is difficult to set the exact level of dimming. That is why different dimming levels close to the desired value for each LED fitting have been defined. Level of dimming was set by controlling the ratio between the first harmonic of current and its lowered value. It was not always possible to set the exact current due to the following reasons:
Imperfection of dimmer construction—especially 1–10 V type—on lower levels it has mechanical/electrical issues.
Response of drivers—each LED driver has its own minimum of output power set by circuit preferences or set by producer.
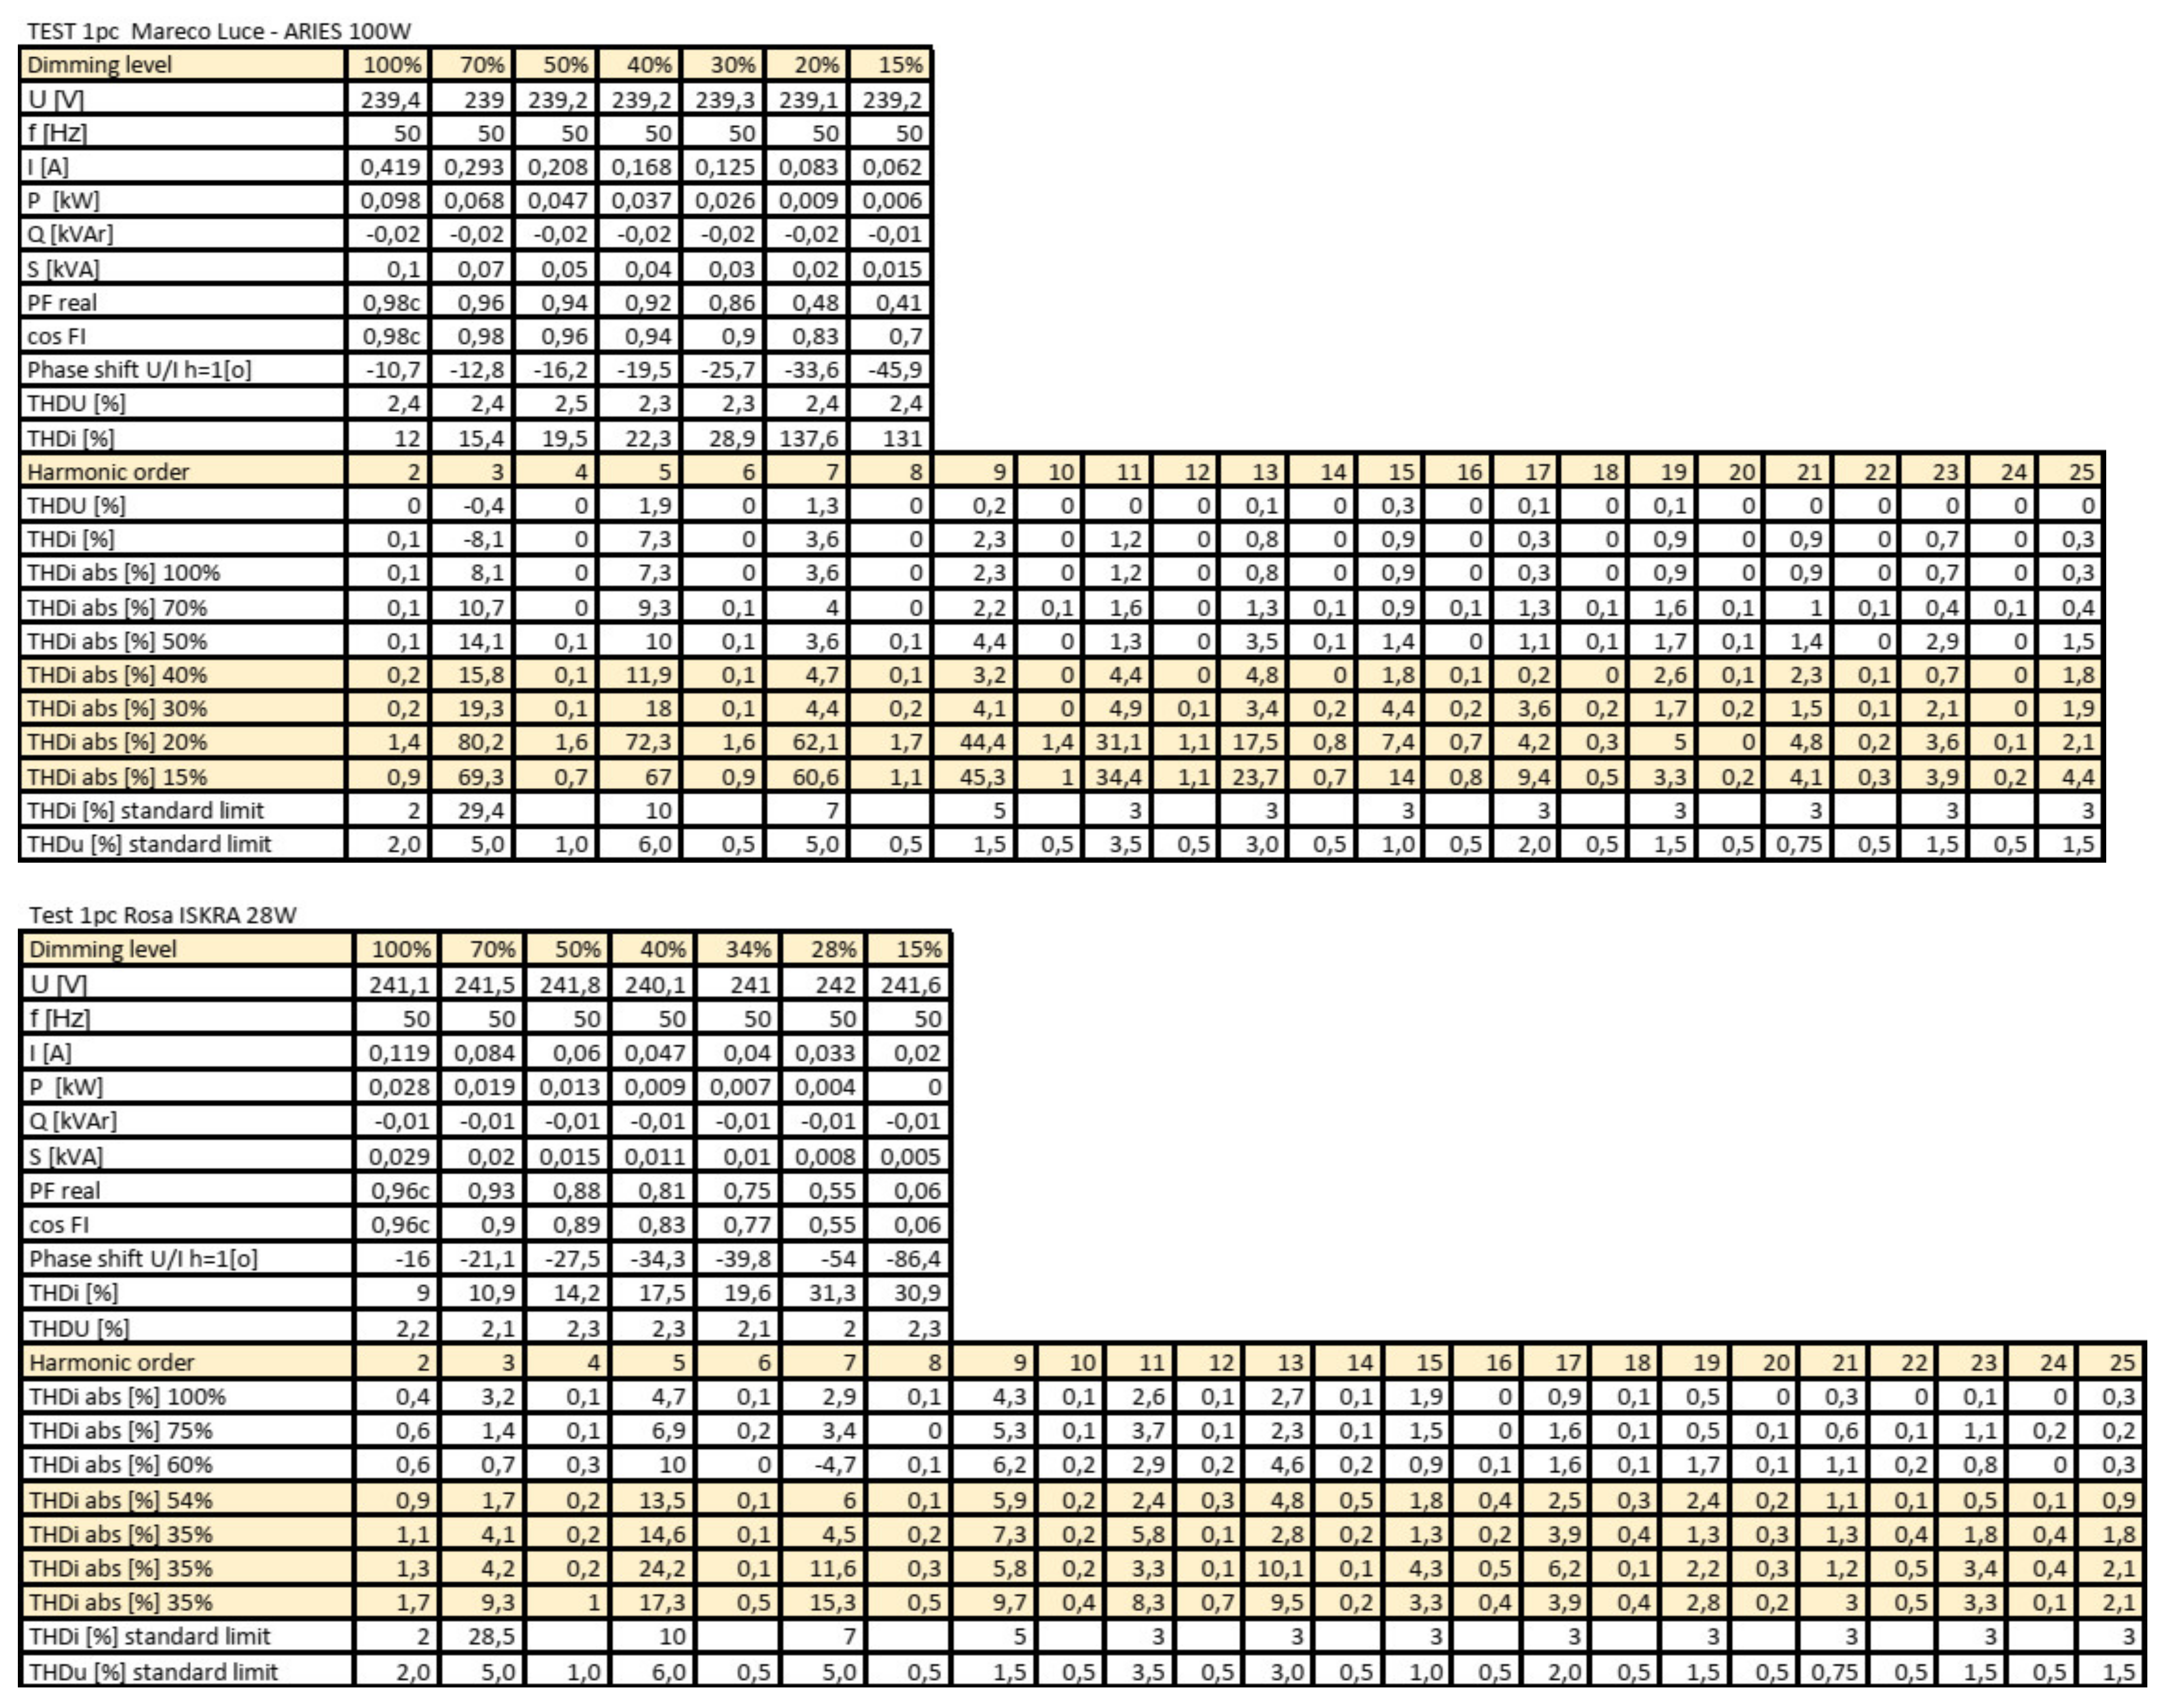
As an example, we present all measured data from LED fittings Mareco Luce-Aries 100 W industrial high-bay and Rosa-Iskra 28 W streetlight. in
Figure A1 at
Appendix A.
Generally, approaching the lowest possible level drivers in some cases could cause turning off the fitting. In some cases, from a certain level, the fitting remained at the same minimal level of lighting even if the controller commanded to lower the consumption. It was markable in cases with the DALI controller which give us feedback information about the state of the DALI driver, for example, the requested reduction to 10% in some cases evoked only 20–25% reduced input current. In
Appendix A Figure A1, the state of dimming of the fitting is highlighted when standard limits were exceeded. It could be seen that at a power output from 100–50%, LED fittings usually stay at the limits.
3.3. Total Harmonic Distortion
Within the first experiment, the declared parameters by manufacturers were verified during operation in steady state mode at 100% of output power (30 min after fitting was turned on). After it, the power was reduced to approximately 70%, 50%, 40%, and until the lowest minimum when fittings remained lighted up or stopped working, but still absorbing power. The level of dimmed public/road light installations at 50% usually means that further dimming leads to the situation that the road or pedestrian path comes out of the limits projected in EN 12464-2. Another situation is in office or industrial lighting installations. Many installations are combined with means of controlling the level of luminosity, for example, dimming controllers coupled with lighting sensors. Depending on settings, fittings are operated within the full operational range including very low dimming levels.
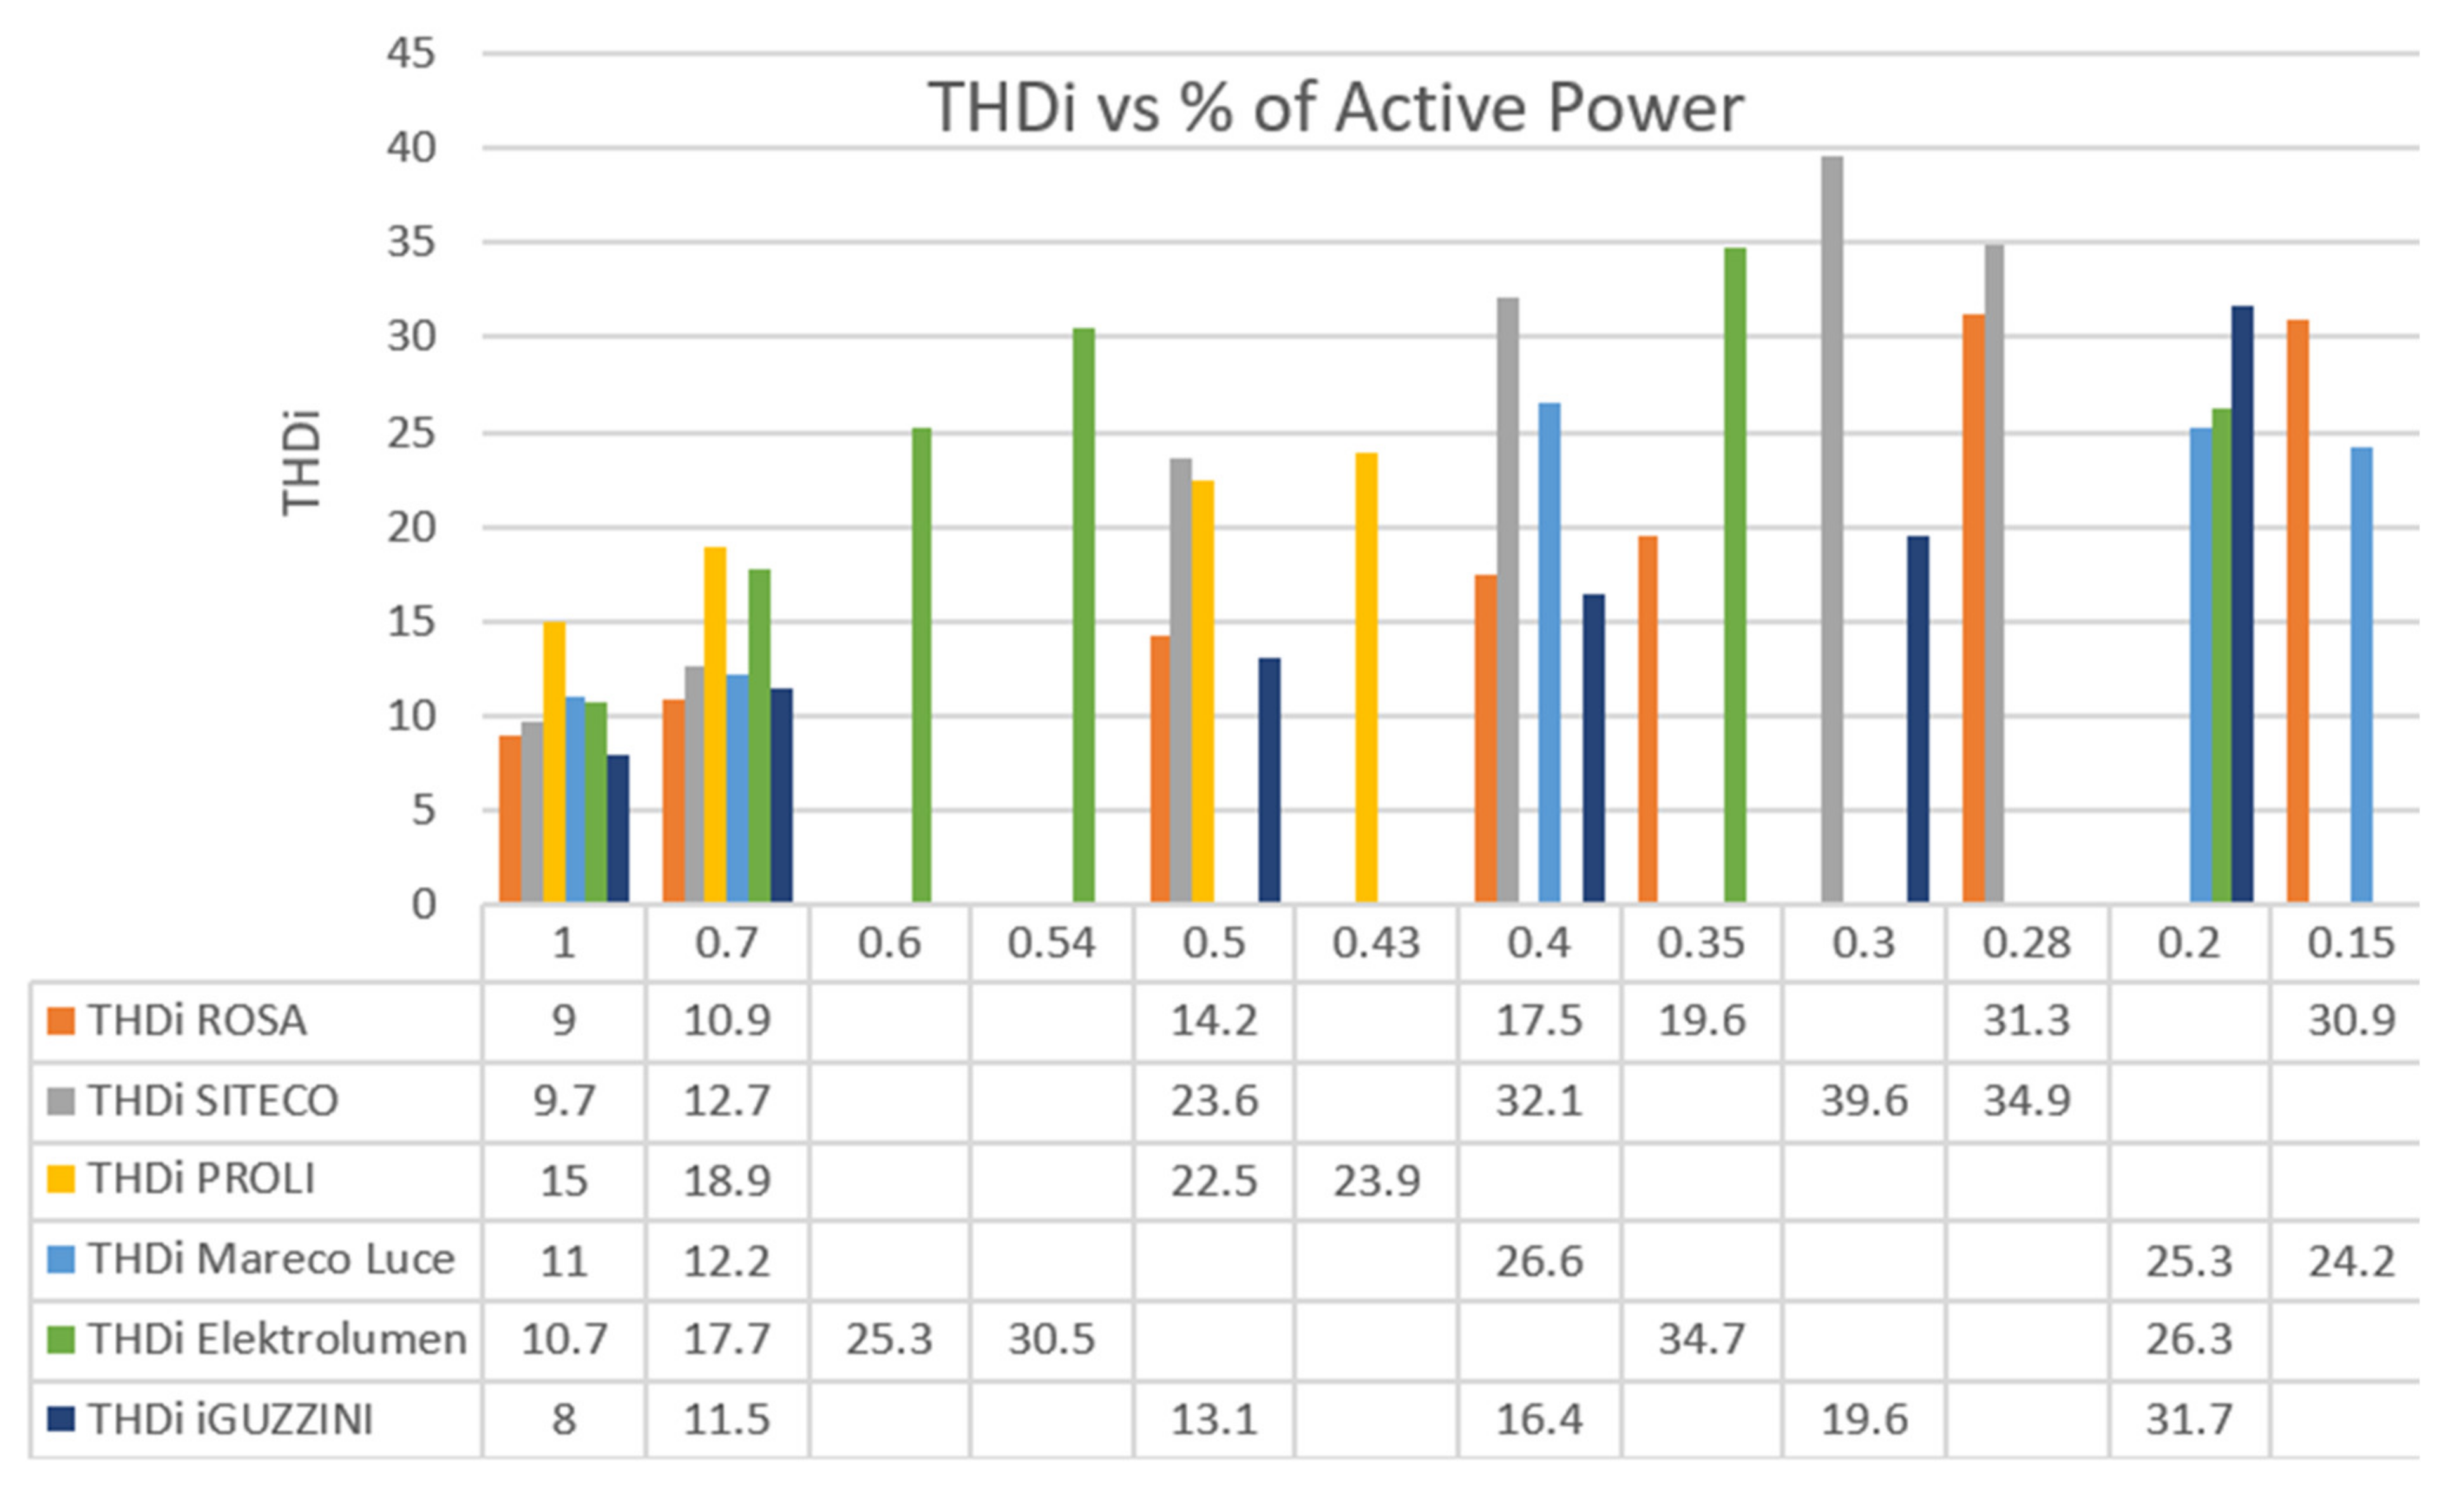
Discreet values of the harmonic are presented in the following combined table with graph, so it is possible to easily compare measured values between tested LED fittings (
Figure 9).
It could be seen that at nominal power, the streetlights start with very low THDI maintained also at the most used level of dimming up to 70% of nominal power. All fittings draw distorted current with THDI up to 20%. This causes only a small negative impact on the supply grid. The best tuned fittings seem to be the streetlights by iGuzzini and ROSA. The situation is more complicated at lower levels of dimming (below 60% of nominal power).
A similar situation is seen in
Figure 10, where results for office lights are evaluated. Office lights started with very low THDI maintained up to a level of dimming 70% of nominal power. All fittings are drawn distorted current with THDI up to 20%. This would create only a small impact on the grid once again. An important fact here is the quantity of LED fittings at the common coupling points as will be discussed later.
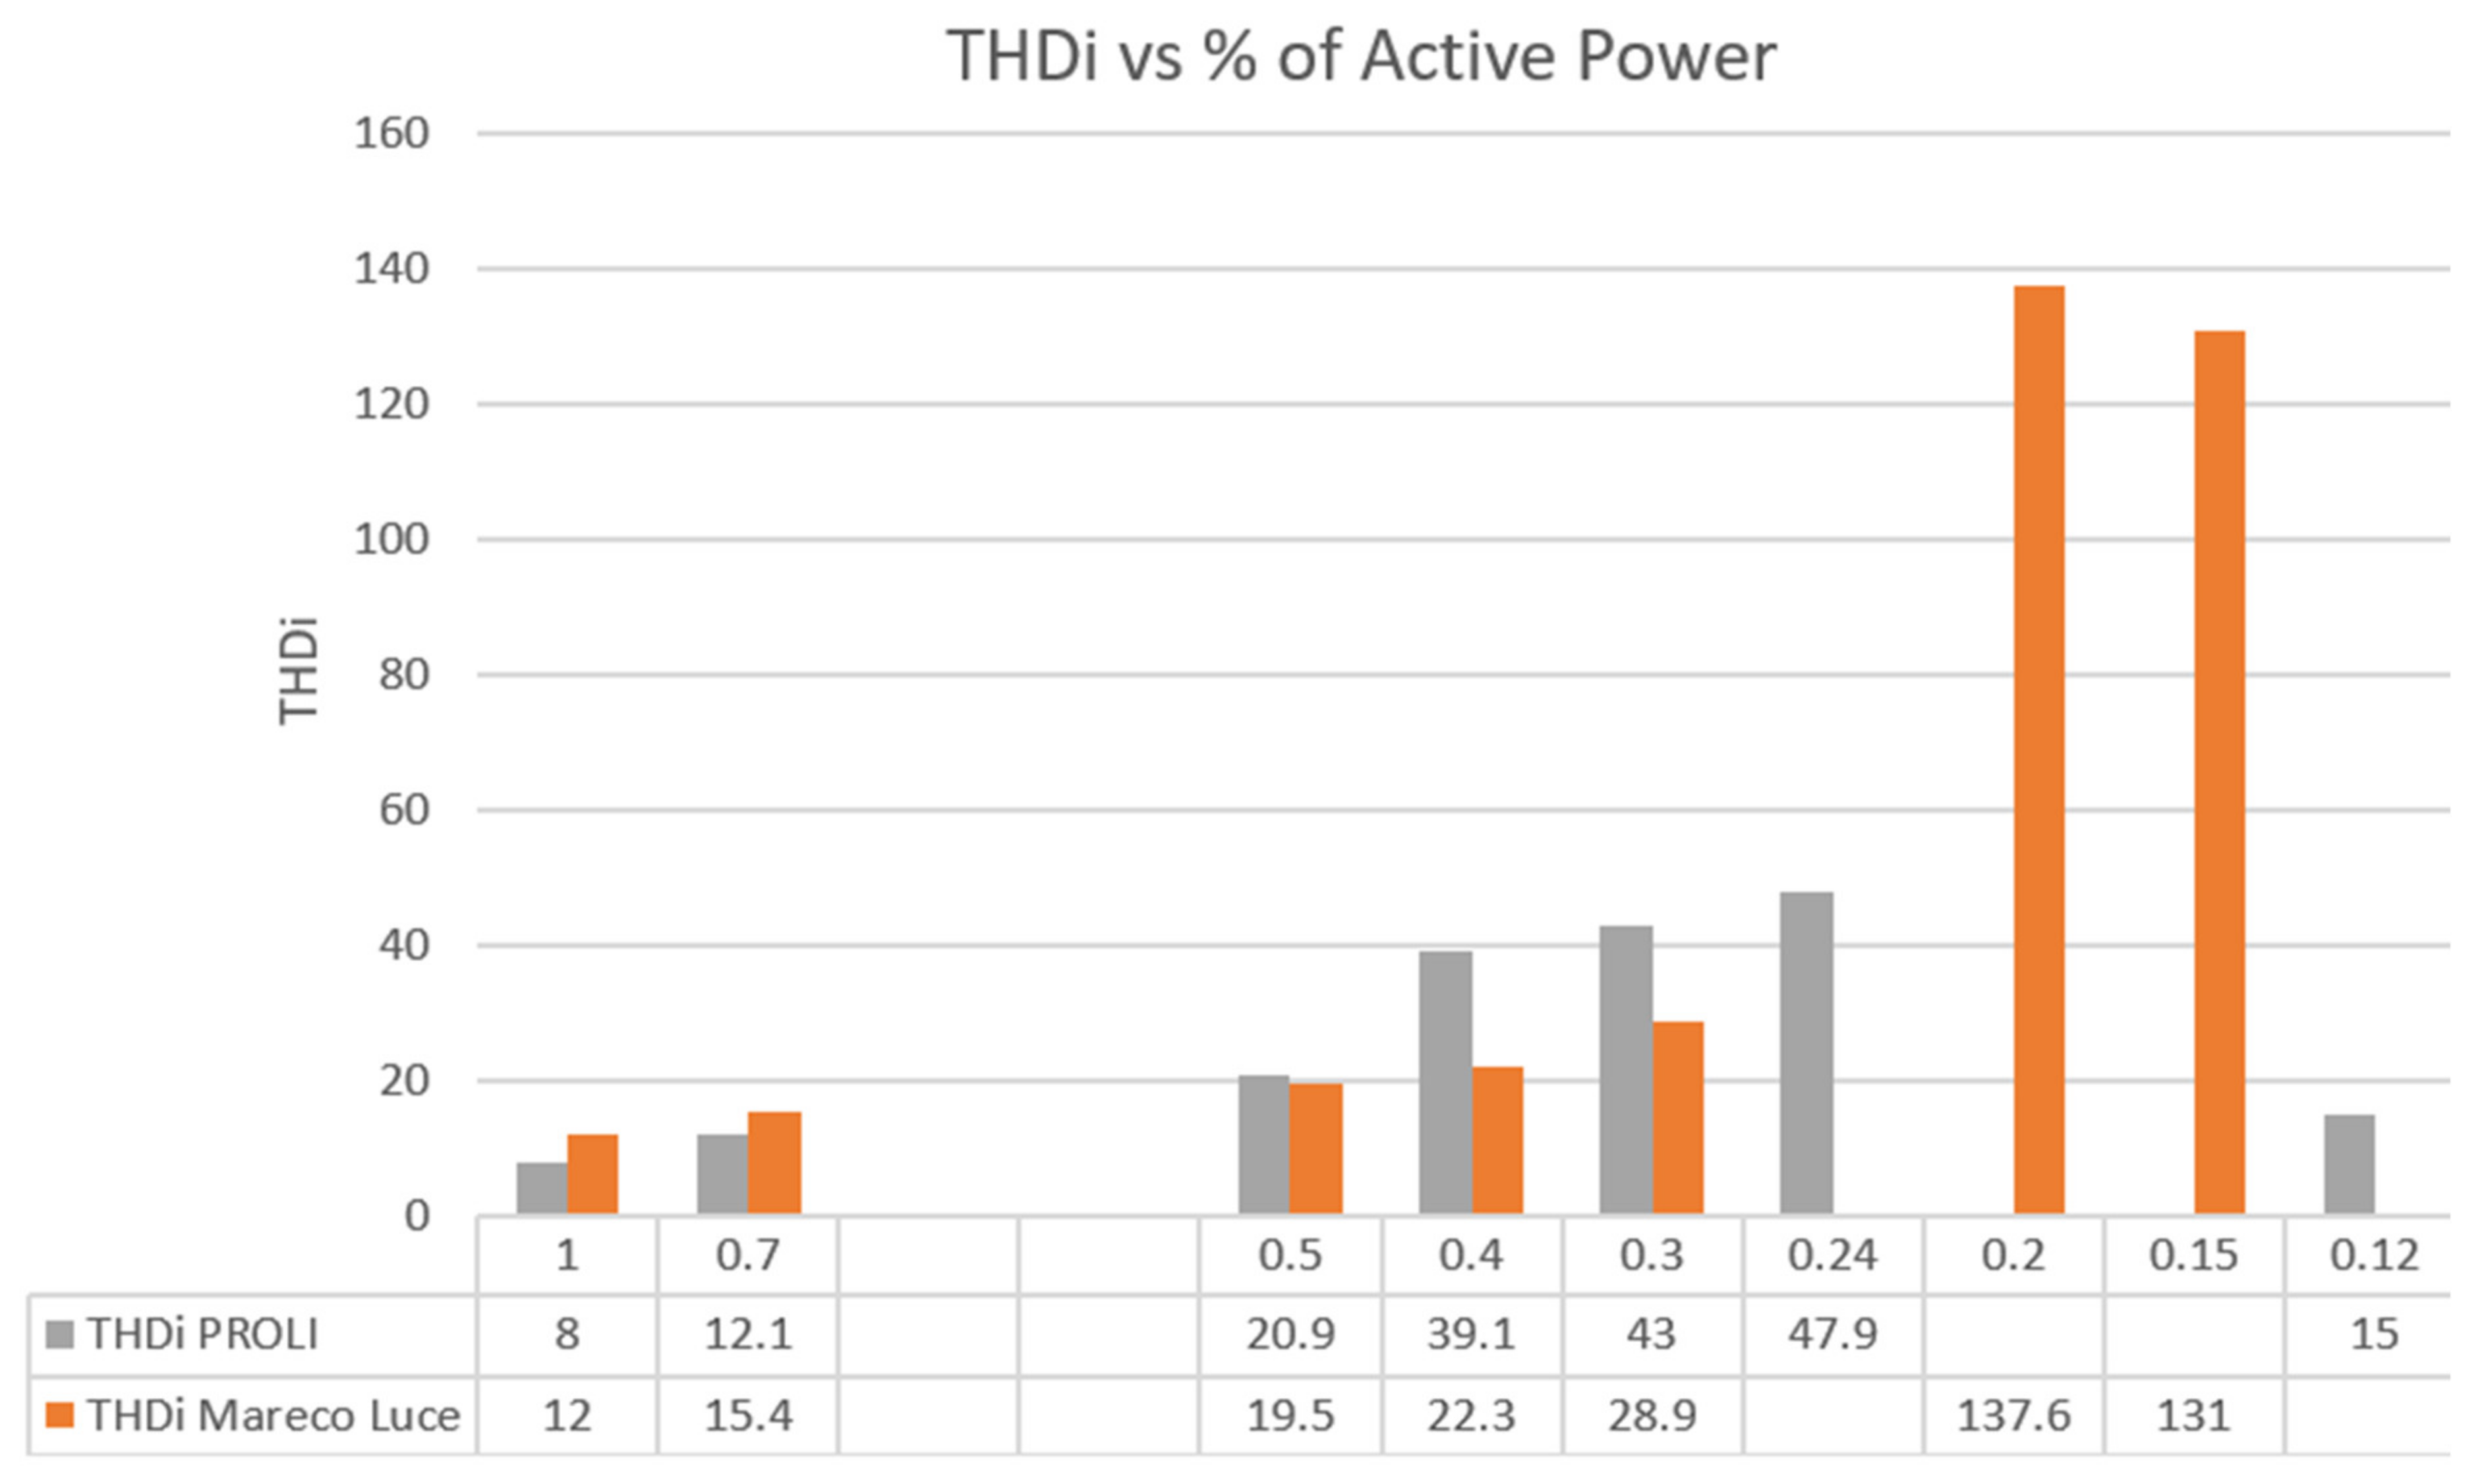
Seeing the obtained results (
Figure 11), we can confirm the information from datasheets of LED driver producers presenting the fact that lowering the output power means raising the THD
I (in this research THD
U is neglected). The problem occurs when LED fitting is dimmed under certain levels. The lower the light is dimmed, the THD
I is rising until we push the driver into the condition that it stops the power supply and consumes only energy for its own circuits.
Within the presented experiment, only two LED fittings with the same driver, Osram Optotronic OT40/120 277/1A0 4DIMM LT2 E (Siteco SL20 micro, Elektrolumen Marut S), were compared while set on different nominal outputs (38 W vs. 31 W). For this reason, it is difficult to precisely compare THDI. The optimal power value of this driver is 40 W, Siteco fitting starts closer to its optimal condition, and therefore, it is understandable that it presents better performance THDI during dimming than Elektrolumen.
We also noticed that producers have limited maximum dimming levels on different output power values. Siteco turned off at approx. 28% and Elektrolumen at 20% of dimming (input current Siteco 0.047 A vs. Elektrolumen 0.028 A).
Then, dimming the LED fitting under certain levels, means a significant increase in the harmonic spectrum and its magnitude. Also, the high density of LED fittings in small installations (low diversity factor), where only small natural harmonic attenuation occurs will cause a significant rise in higher harmonics.
Table 5 represents measured THD
I for all tested LED fittings at P
max, P
50% and P
min possible. We consider P
min possible value, as a value of power when LED fitting was still ON (shining), thus it is a state of fitting still usable for a user requesting lumen output from fitting. P
50% is chosen as commercially attractive dim values on which LED fittings usually operate during a major part of the working plan.
It is important to remember that we used high-quality LED fittings of EU production, so it is not expected that THD would be higher than is listed in
Table 5. Currently, none of the actual European standard limits THD
I calculates as given by Equation (9). Standard EN 6100-3-2 [
21] limits only separated values of current harmonics.
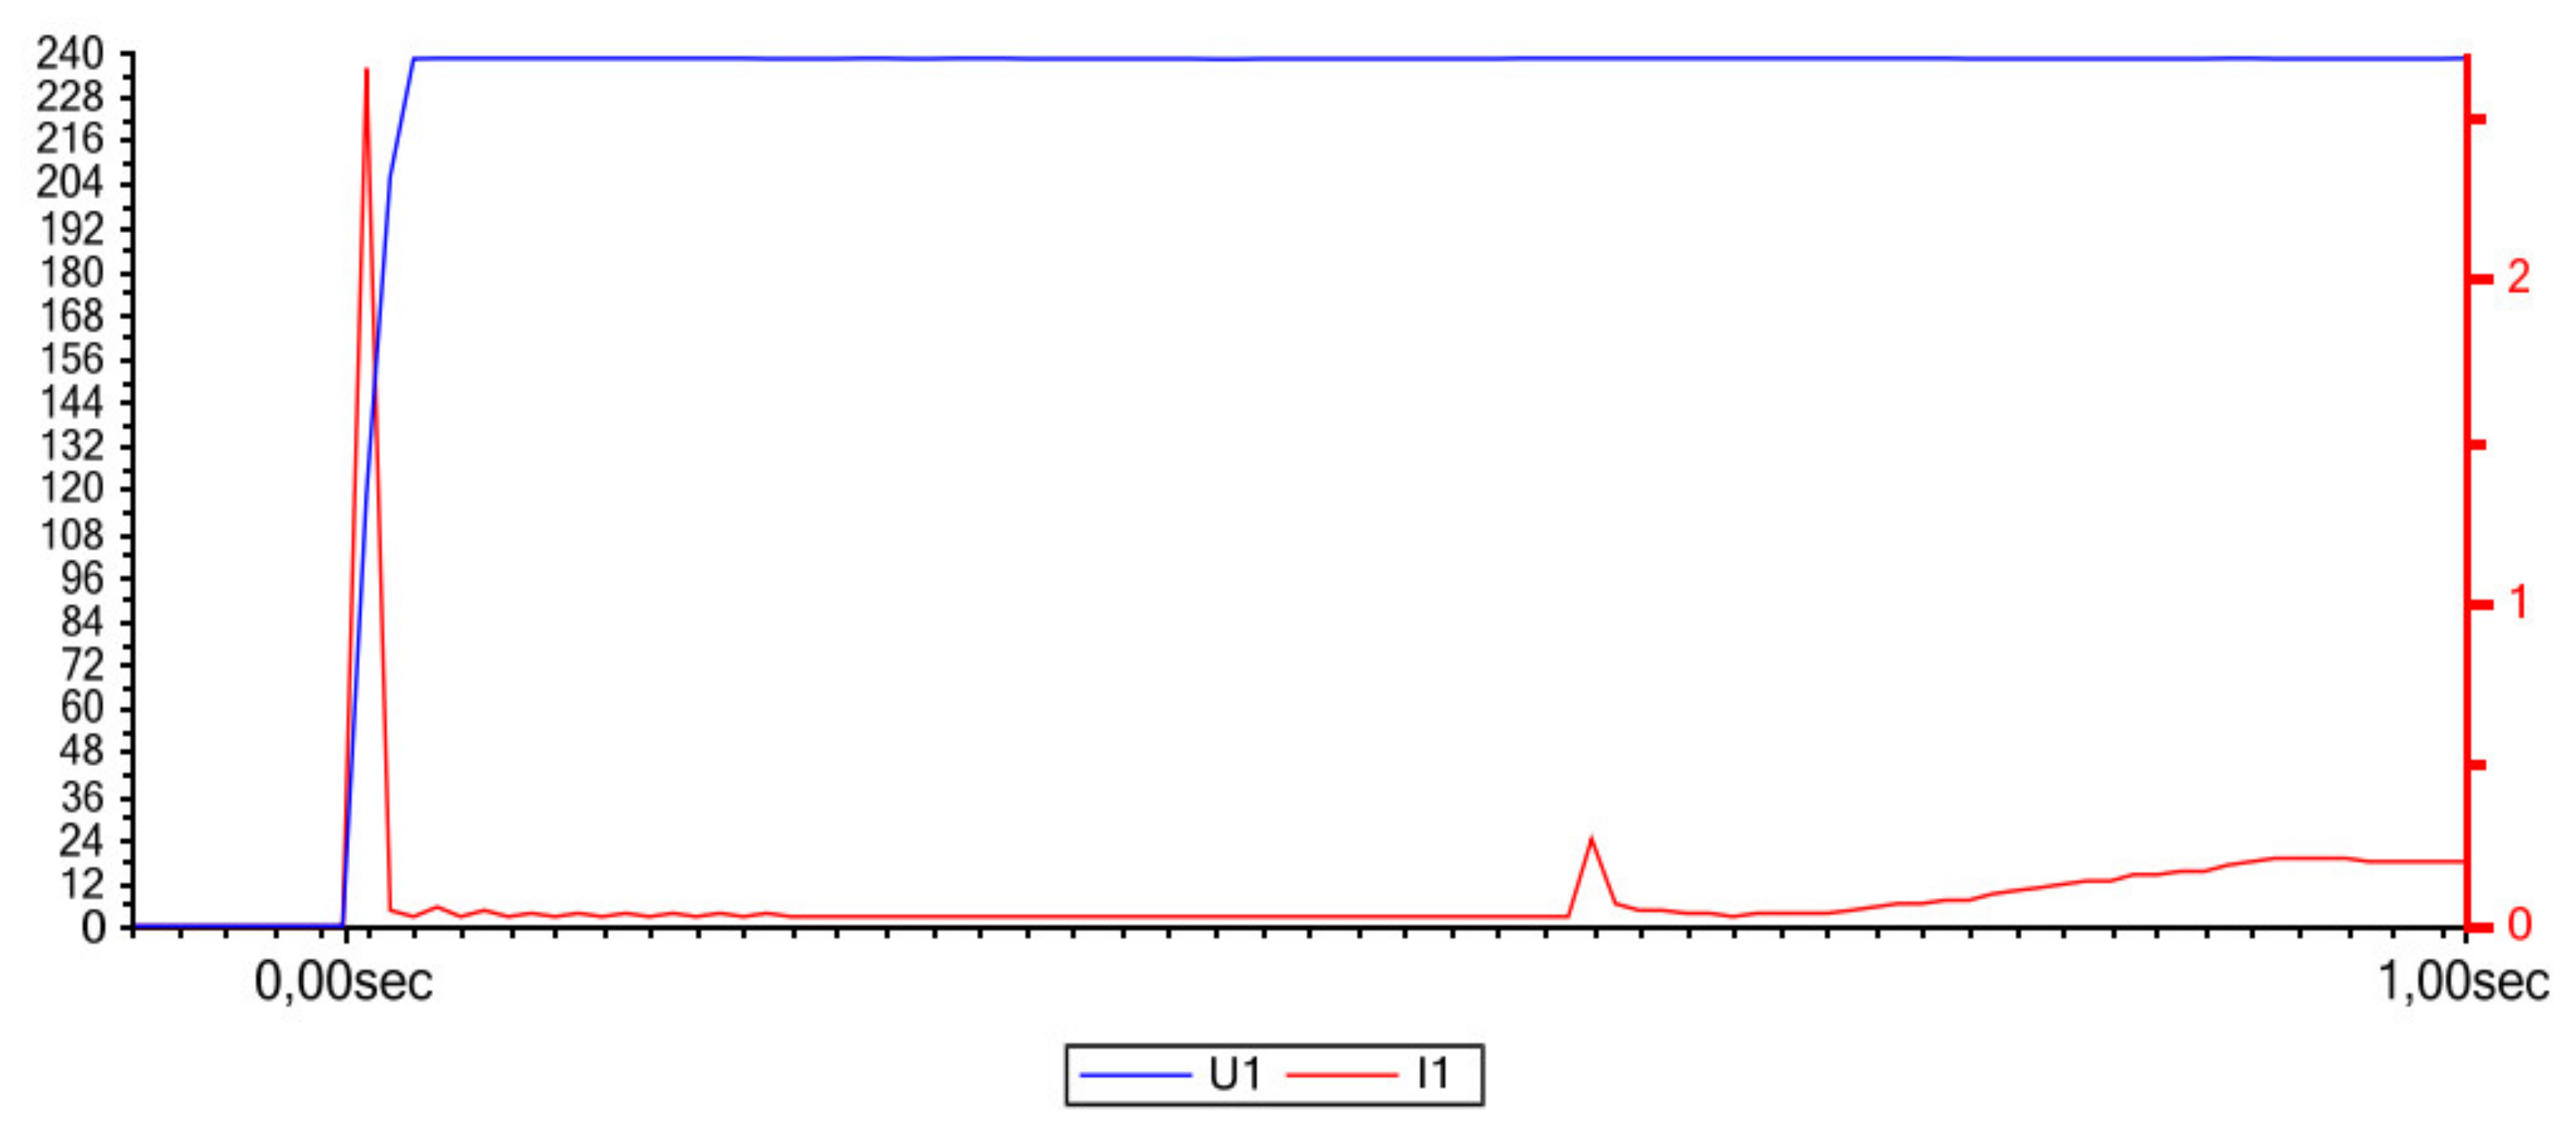
3.4. Inrush Current
The experiment was performed several times for each LED fitting to obtain the worst possible I
peak for each LED fitting current input (
Figure 12). As we have seen in the theoretical part of this paper, the value of I
peak and pulse width depends on circuit parameters including the construction of the LED driver and impedance of the voltage source. Taking into consideration that the test was performed on a real supply grid, values from datasheets of LED drivers could not be achieved.
In
Table 6, the measured values of RMS inrush current are presented. It is hard to compare these measured data with those listed in datasheets. Our test equipment can present only converted effective (RMS) value of current, unfortunately, calculated on a wider pulse width than would be comparable with data provided by producers of LED drivers. However, these values are useful to determine the evident problem of high I
peak of LED fittings. A bigger risk is presented at installations with numerous fittings grouped in circuits with low impedance (smaller distances/shorter cables/lower resistance) that could cut down the high I
peak of fitting groups [
26,
27,
28].
Industrial high-bays such as Mareco Luce Aries 100 W or Proli AL18 LED 100 W are often used in bigger quantities and in real installations may cause problems if smart relays are not used or fittings are not divided into smaller groups secured by one circuit breaker. According to information from users, these fittings are mostly installed with “C” circuit breakers, as from experiences was determined that the “C” characteristic covers the inrush current of a bigger group of fittings.
Comparing only two streetlight fittings with the same LED driver could not be a scientifically confirmed result, but from numerous tests on these two fittings, we can confirm that the inrush current measured using PQA824 gave us consistent data. Using these data, we also compared fittings with other LED drivers. We can say that under these conditions from streetlights were fittings by iGuzzini—STREET 35.8W and ROSA—Iskra 28W with drivers by Philips that were able to handle and inrush current in the best way.
4. Discussion
Improving the situation around the bad influence of LED installations on power grids or the nearest feeding network is not only in the hands of the producers. However, producers must start to communicate the preferences of their products in full operation range if they declare them as “dimmable”. The actual state of datasheets is very irritating even taking into consideration only high-quality EU production. To be able to compare standard limits and expected parameters with measured data, we needed to study datasheets of LED drivers because the datasheets of LED fittings were missing. Producers of LED fittings usually set LED drivers according to the needs of their particular LED circuits. Then, it is easy to achieve results that do not correspond to expectations based on information from the driver datasheet.
We see the commercial problem of the costs of testing all variants of one’s own LED fittings in all possible/expectable situations. Also, we see the problem of unfair competition when some producers would declare complete data, and others will not do it until it is obligatory.
The situation is then very complicated, and it is very difficult to estimate the behavior of installations with means of regulation. Electrical engineers but also investors, end-users must have tools to recognize better quality products or to select the right product for his installation considering the complexity of his installation. This is very sad in the context of the demand for smart installations with many sensitive appliances.
For all this, however, we should respect the requests of national or European standards but as far as we know, for illumination fittings, there are only some data on obligatory and THD, inrush current is still not present in COMMISSION REGULATION (EU) 2019/2020 of 1 October 2019 [
29], not even at rated power. Power factor is obligatory for rated power but not in dimmable range. Therefore, we cannot expect producers to present to us all these data related to the dimming level of lighting fittings.
It is not popular to bring on new restrictions and obligations from EU committees, but as we have seen in the past in this area, it is the only effective tool to start better competition in illumination. Having studied a number of LED driver datasheets, we see that better drivers and better sets of led circuits are available, for example, for inrush current better LED drivers are equipped with circuits that can effectively lower the peak of inrush current. However, most of the producers rely on the final customer’s solutions who needs to split his installation into smaller circuit blocks covered with more circuit breakers. Limiting current distortion coupled with adjusting the real power factor is resolved in circuits of better LED drivers with active filters. The prices of these drivers are surely higher and unless there is no or weak limitation of these parameters, we cannot expect suicidal moves from EU producers against the cheap production, which is respecting only mandatory parameters.
We would like to point especially standard 61000-3-2, where we see weakness in limiting the THDI through the limitation of separated harmonics of current but not by setting maximal values of THDI divided into groups based on rated power. Also, setting Pmin in article 7.4.2 for luminaires with rated power >25 W is hard to fulfill in modern LED light fittings, as the producers often limit the minimum output power of LED drivers due to the cost of complicated circuits. In our test, we were not able to do this with any fitting set Pmin on the requested level.
Until the situation is regulated by the authorities (which unfortunately leads to higher prices of products), end-users will be always one step behind their installation. Producers are limiting their efforts and resources to limit the harmonic distortion in the steady state of driver powered and loaded at nominal values only. End-users then can only react to issues that significantly occur via economic impact due to the explained influences of cheaper solutions [
30].
Here is an open area for further and deeper analysis with more accurate means based on this wide theoretical research supported by our informative measurements. Due to competition, we always find installations with cheaper solutions badly affecting their own circuits. Problems are occurring mostly in partly renewed lighting installations, where customers have not considered the risks of changing LED fittings without a general understanding of the complexity of harmonic distortion. Unfortunately, under-dimmed LED fitting installation is not saving costs on lower energy consumption, but due to the presented issues, it is generating financial losses due to higher maintenance costs.
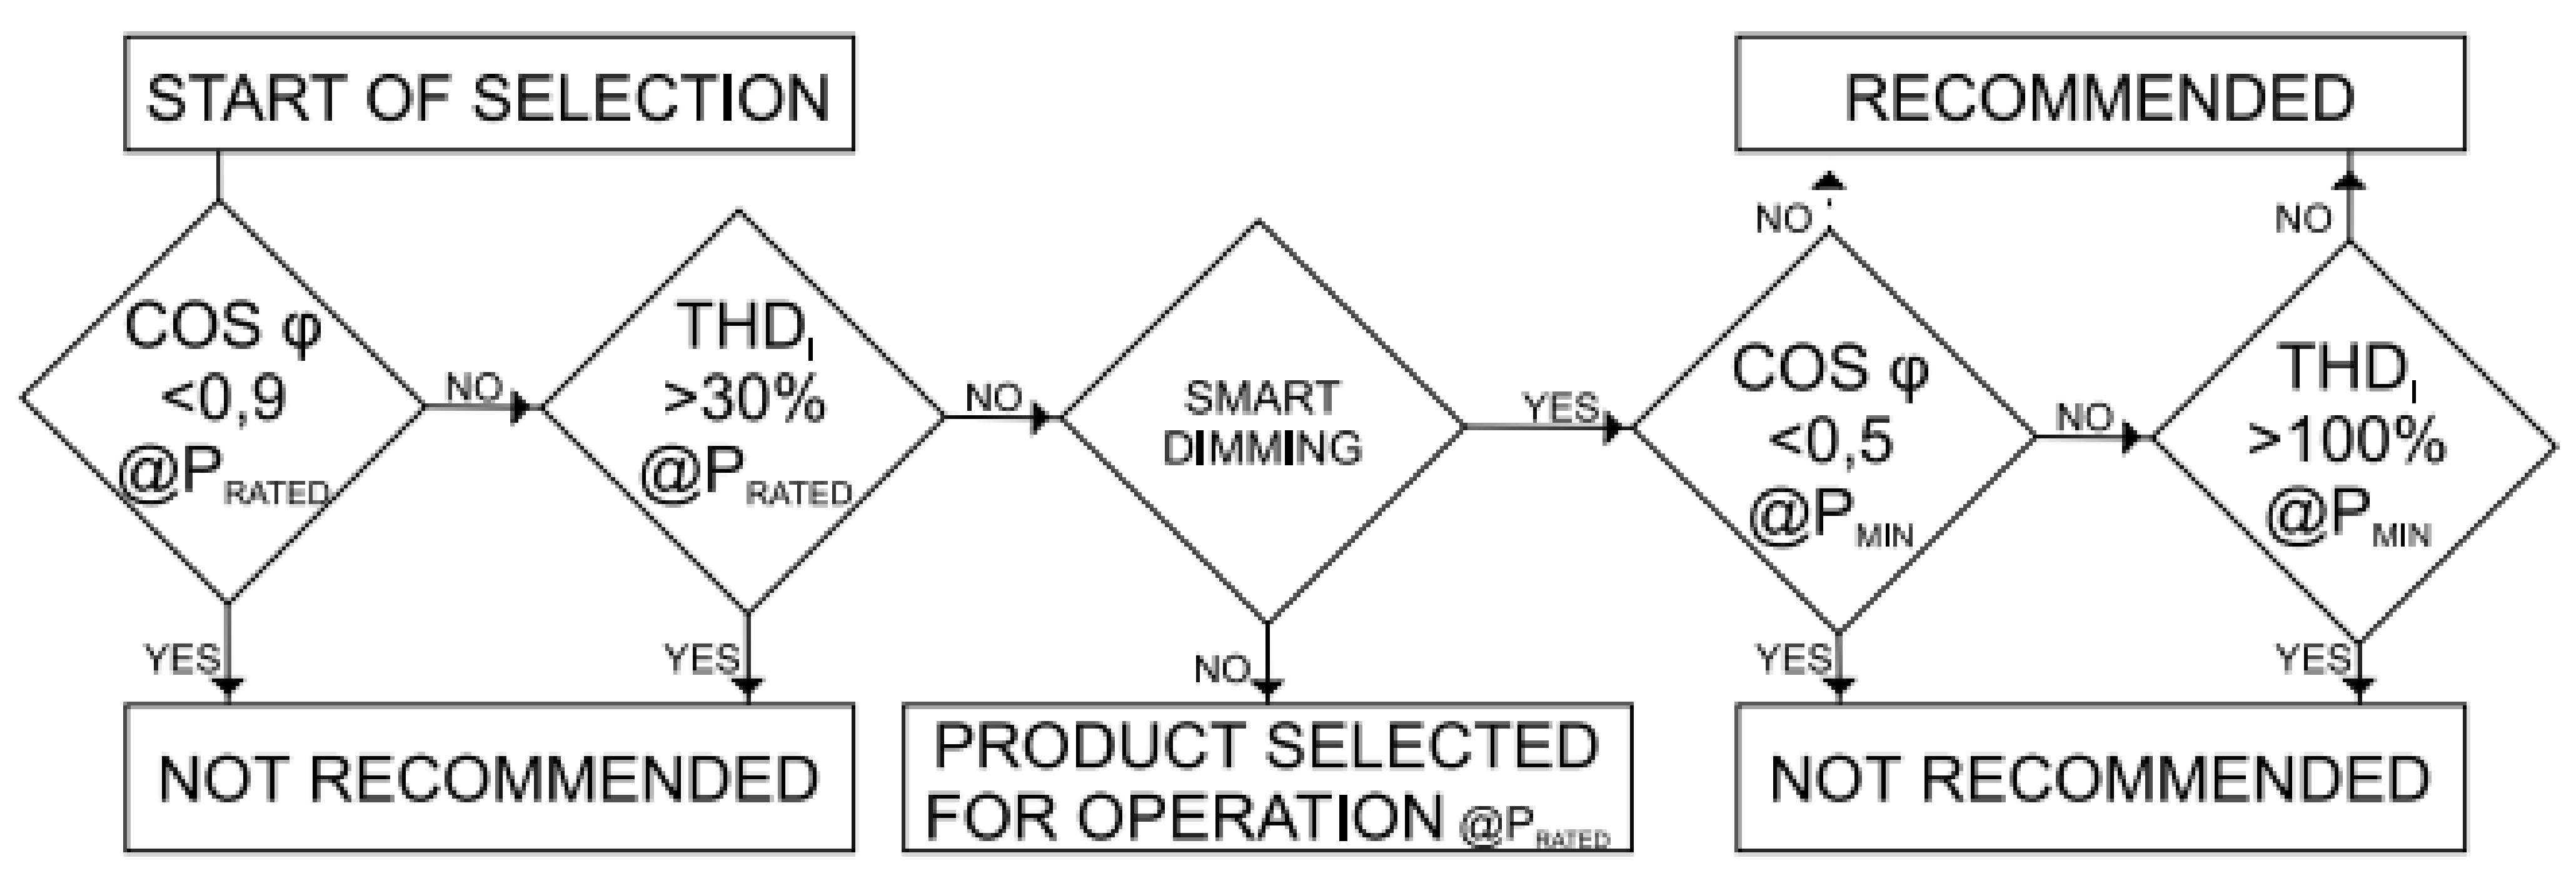
To prevent the worsening of
THD and
PF at the engineering stage of a project, the following algorithm (
Figure 13) could be used.
For all LED illumination installations, it is recommended to at least make selections based on gathered information from datasheets on LED fittings or LED drivers. Obviously, it is recommended to use this pre-evaluating method in the early beginnings of projecting the lighting installation. Physical tests and measurements with a PQ analyzer are optional for standard EU quality products, where usually producers maintain a high power factor with good filtration of harmonics at rated power.
For SMART LED illumination installations with dimming actuators (e.g., daylight sensor), it is recommended to also pre-evaluate the measuring of each type sample at rated power Pmax and usual dimming levels down to Pmin. Obtained values of THDI and PF serve for the precise selection of suitable products for lighting installation. Setting the acceptable low pass limits (now set on cos φ or PF 0.5 and THDI on 100%) then surely depends on the target price of the project compared to further investments of users in means that will identify negative influences and compensate them.
We suggest continuing with the research on means to limit the discussed parameters. According to our experiences, we suggest designing small smart active filters with a rated capability of around 2–3 kVA to serve in junction boxes distributed on layers of office buildings, central control rooms in industrial buildings, or in junction boxes for part of the public/road illumination. In our opinion, it can be projected based on information acquired during long-term tests at indicated installations as corrective action. As shown in the research in the introduction of this article, it is important to consider also issues caused by external sources of quality parameter distortions to protect our correction means and if possible, to correct incoming distortions from outer sources. Also, our opinion is that electrical engineers should also consider separating lighting installations from heavy power installations in industrial buildings as a solution to the issues shown in other researches [
14,
15].
5. Conclusions
We can notice higher THDI when the luminaire is dimmed at a critical level. The problem could partially be resolved for the producer if he recommends dimming the fitting to a certain level. In special cases, where LED fittings need to be operated at a low level of output power, the producer of LED fitting should offer his product equipped with an LED driver adapted to these conditions. Installations with more LED fittings dimmed under a certain level would probably take very distorted current.
Total harmonic distortion is often not presented in any paper from the producers of LED fittings. Customers rely on the fact that led fittings shall pass the exams according to EN standards, which is declared by putting the CE mark on the product. As we have seen from our current distortion test, THDI is not a negligible parameter and producers should clearly determine the limits of dimming the LED fitting.
Regarding the power factor, the market is regulated by conventions and agreements of power distributors. Power distributors usually charge customers an additional fee when their power factor is less than 0.95. This fee is a significant and valid reason for customer feedback. Customers try to avoid this additional fee by increasing the power factor using electrical equipment declaring high power factor. This parameter is requested by customers and serious producers declare tested values in their datasheets of fittings.
Inrush current, as a very important parameter of electrical engineering of light installations, is missing in a lot of cases also, but we can confirm that this parameter varies a lot depending on the impedance of the power supply at the connection point. Therefore, the presented parameters do not have to meet the real state of things at real installations.
The correction of this problem is not as simple as it seems. Replacing projected circuit breakers with circuit breakers with higher nominal current or other Volt-Ampere characteristics is putting the installation at risk. This must be always consulted on with the electrical engineer responsible for the installation. Maximal current allowed for the determined conductor must be taken into consideration.
Another possibility is to divide the installation into more circuits. Usually, the quantity of LED fittings does not exceed 30 units for one circuit breaker with a “B” characteristic. This quantity depends on more parameters well known by LED driver producers, but datasheets of LED fittings often do not contain any information about maximum fittings allowed for one circuit breaker. Another problem may occur when users change the circuit breaker and instead of the previously planned “B” characteristic, a “C” is used because, usually, nobody controls the maximal earth fault loop impedance allowed for this kind of circuit breakers.
It is important to understand that these problems mostly occur for dimmed installations where the limit of dimming is not presented, not known, or the installation is over-dimmed.
In these cases, light installation can be operated with a lower power factor, higher total harmonic distortion as originally expected. It is important to check the installation also in conditions when LED fittings are dimmed at the minimum level allowed by the producer in datasheets of fittings. Another possibility is to examine the installation in this condition using proper instruments and then take actions to prevent the problems or damages presented in this paper. At the end of the conclusion, we must underline that we have chosen only products made in Europe. Selected products are considered in the wider professional installer community as higher standard with a good ratio between market price and long-term quality.
We can confirm that we see also the opportunity to improve the communication of these important preferences of their product to professionals, at least. Optimal solutions seem to put the info in the technical datasheet available for electrical engineers in the projecting phase of a project. As we have proven, most of the issues occur not only due to the quality level of these products but also due to the minimal knowledge of professional installers about the marginal operating state of LED fittings. This seems to be the main issue of quality products. As we see the progress in smart building, we see also issues around special and sensitive smart appliances influenced by low-quality electrical installations with high THD, low PF, and non-corrected inrush currents.
The next step is to create a modular active filter that will be possible to implement on luminaires/systems that would not pass our proposed selection criteria. From an economic and managerial point of view, however, it is recommended to use the methodology we have set aside, as it will require much fewer costs in the process of designing and planning smart installations than the subsequent implementation of a modular active filter.


