1. Introduction
There is now a general global consensus in actively exploiting and utilising clean energy [
1] because energy is one of the vital factors in achieving Sustainable Development Goals (SDGs) [
2]. However, energy poverty remains a serious worldwide issue, which hinders economic transformation and social development in all countries. The International Energy Agency (IEA) defines energy poverty (EP) as an over-reliance on biomass fuels for livelihood and a restraint in obtaining sustainable clean energy; it is one of the pillars of multidimensional poverty. According to a World Bank report in 2018, 3 billion people globally live in energy poverty, where an overwhelming majority are in developing nations [
3,
4,
5]. In the Association of Southeast Asian Nations (ASEAN), particularly in Indonesia, Malaysia, Cambodia, and Thailand, more than 880 million people are energy-impoverished [
6]. Nearly 2.5 billion people worldwide rely on traditional biomass for cooking; ~120 million use kerosene, and 170 million use coal. The toxic substances generated by these energy sources are responsible for >3.8 million deaths per year [
7]. According to a United Nations (UN) report in 2017 (The Sustainable Development Goals report 2016), nearly 43% of the world’s population utilises lagging energy technologies. In India, tens of millions of households have <12 h of electricity per day [
8]; globally, ~1.1 billion people have no access to electricity whatsoever [
9]. This situation is most critical in the Sahara region, where residents obtain energy by burning biomass [
10]. Although China achieved the goal of full electricity supply coverage by 2014, Yoon et al. (2019) found that approximately 490 million Chinese citizens use solid fuels in their daily lives [
11]. According to the results of the China Family Panel Survey (CFPS), more than 30% of households use conventional energy, of which the majority are rural households [
12].
Access to clean and reasonably priced energy sources can modernise one’s lifestyle by promoting good health [
13]. For example, the use of liquefied petroleum gas (LPG) for cooking has enhanced women’s lives [
14,
15,
16,
17]. Furthermore, adequate household lighting can increase the time available to students for learning and provide more opportunities for adults to engage in economic activities and increase their income. Clean energy also reduces environmental pollution and deleterious ecological impacts, indicating that the alleviation of energy poverty is a globally beneficial cause [
10].
Several countries have implemented measures to alleviate energy poverty. In 2015, China invested $102.9 billion (US) in renewable energies to optimise the national energy system and reduce energy poverty in rural areas; this investment is more than one-third of the total global renewable energy budget. The National Rural Revitalization Strategic Plan (2018–2022) of China mandates improvements to rural energy supply structures, infrastructure networks, and the promotion of rural energy consumption upgrades. The 2020 Central Economic Work Conference of China emphasised the need to accelerate energy structure adjustments and investments in new types of energy; thus, there is an urgency to explore the causes and solutions of energy poverty.
The western and rural regions of China exhibit more significant energy poverty conditions and are more reliant on unclean energies than the other parts of the country. The western region is rich in fossil fuel reserves that serve as a primary support for livelihoods. Rural pastoral areas have long used firewood and livestock dung as their main fuel energy resources. Many studies have shown that the combustion of fossil fuels and biomass produces harmful substances that can have deleterious effects on the environment and human health, thereby deteriorating economic development [
18,
19,
20].
Lhasa is an important economic and cultural centre located in Tibet on the Qinghai-Tibet Plateau of western China. This area has abundant solar and wind energy potential, as well as hydropower opportunities owing to the presence of many rivers. The Yangbajing Basin, with a strong geothermal potential, is also located within Lhasa’s jurisdictional limits. However, despite the potential for renewable energy production in the agricultural and pastoral areas of Lhasa, energy poverty is prevalent. In 2017, to address the adjustments and improvements to the energy structure in the region, the Lhasa Development and Reform Commission proposed a decade-long energy improvement plan.
The present study undertook a field survey collection in the agricultural and pastoral areas of seven counties in Lhasa to analyse the primary causes of energy poverty within the region. Empirical analyses were conducted, and the findings were used to propose targeted policy recommendations. Lhasa was chosen as the study region for three reasons. First, there is a substantial disconnect between the region’s abundant energy reserves and its level of energy poverty. Second, the natural, socioeconomic, and cultural conditions in Lhasa are multifaceted, offering a comprehensive perspective on the drivers of energy poverty. Third, Lhasa is highly representative of the features of underdeveloped areas in western China, including characteristics such as its complex geographical environment and low-level of socioeconomic development.
Survey data on Tibet’s unique natural and socioeconomic environment are scarce; therefore, this study aimed to address this gap. The results of this study contribute to addressing China’s uneven poverty distribution. Energy poverty alleviation is directly beneficial to decreasing the relative poverty levels and promoting rural revitalisation via a booster effect. Finally, the research presented here will provide theoretical support for reducing energy poverty elsewhere in the world.
The remainder of this paper is structured as follows.
Section 2 introduces the socioeconomic and energy consumption patterns in China and Tibet.
Section 3 reviews the literature and raises questions relevant to this study.
Section 4 offers a theoretical analysis and hypothesis.
Section 5 presents the data, variables, and statistical models.
Section 6 reports and analyses the results of the basic regression and robustness tests.
Section 7 further discusses the similarity and difference of result between this paper and previous literature, and analyses the reason of difference; at the same time, we discuss the main aim and contribution of this paper again. Finally,
Section 8 and
Section 9 present our research conclusions and policy recommendations.
2. Socioeconomic and Energy Consumption Patterns in China and Tibet
2.1. China
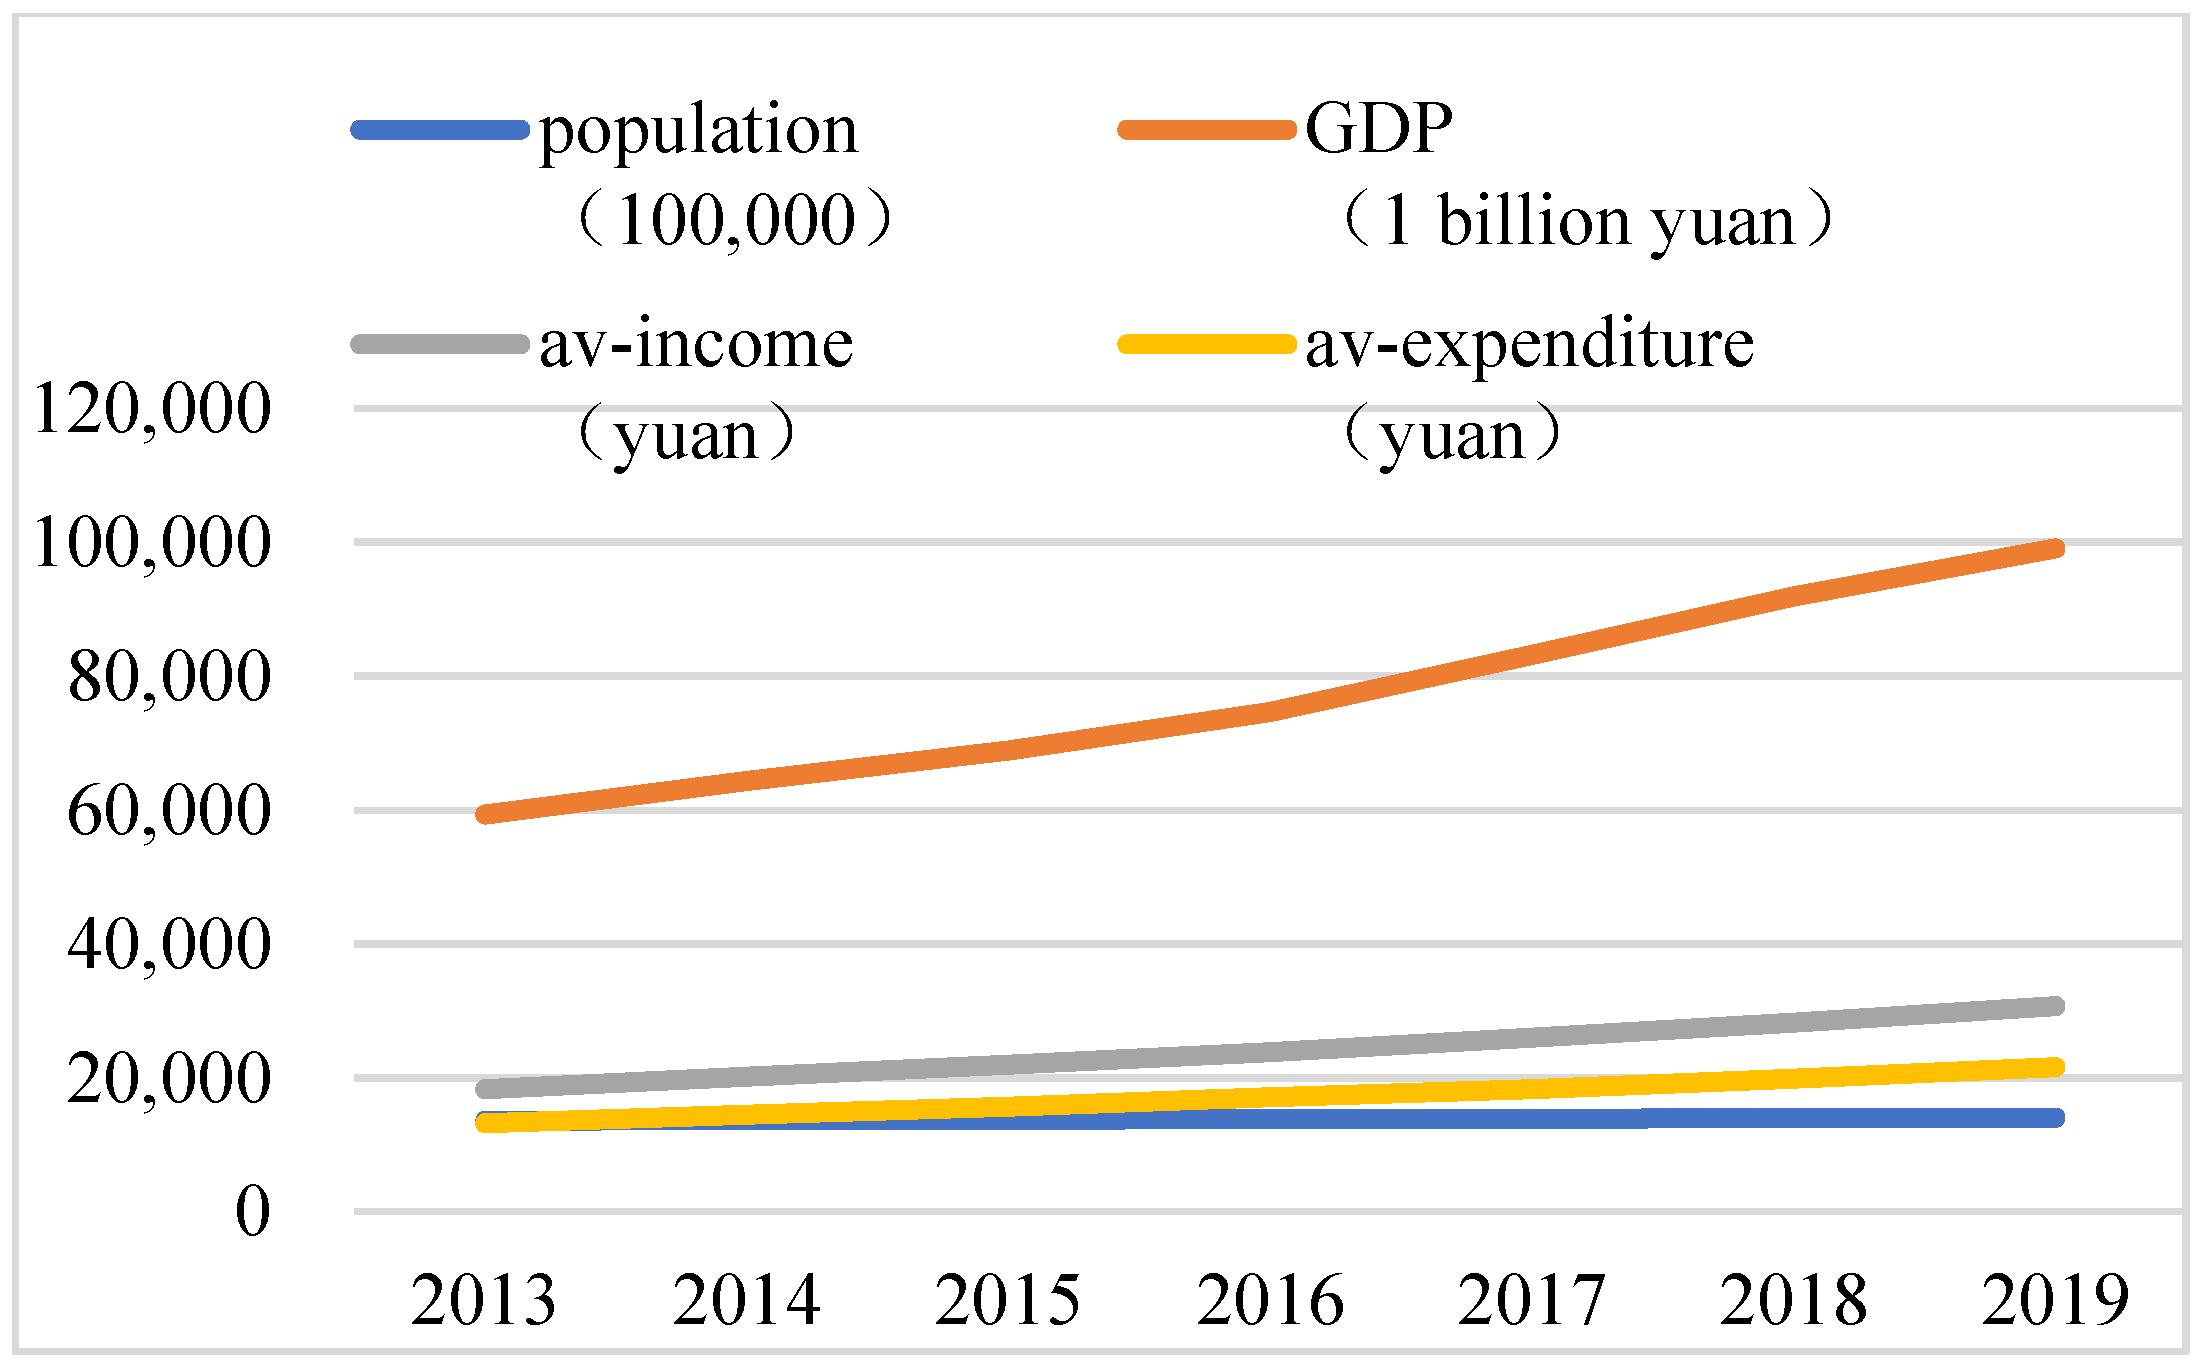
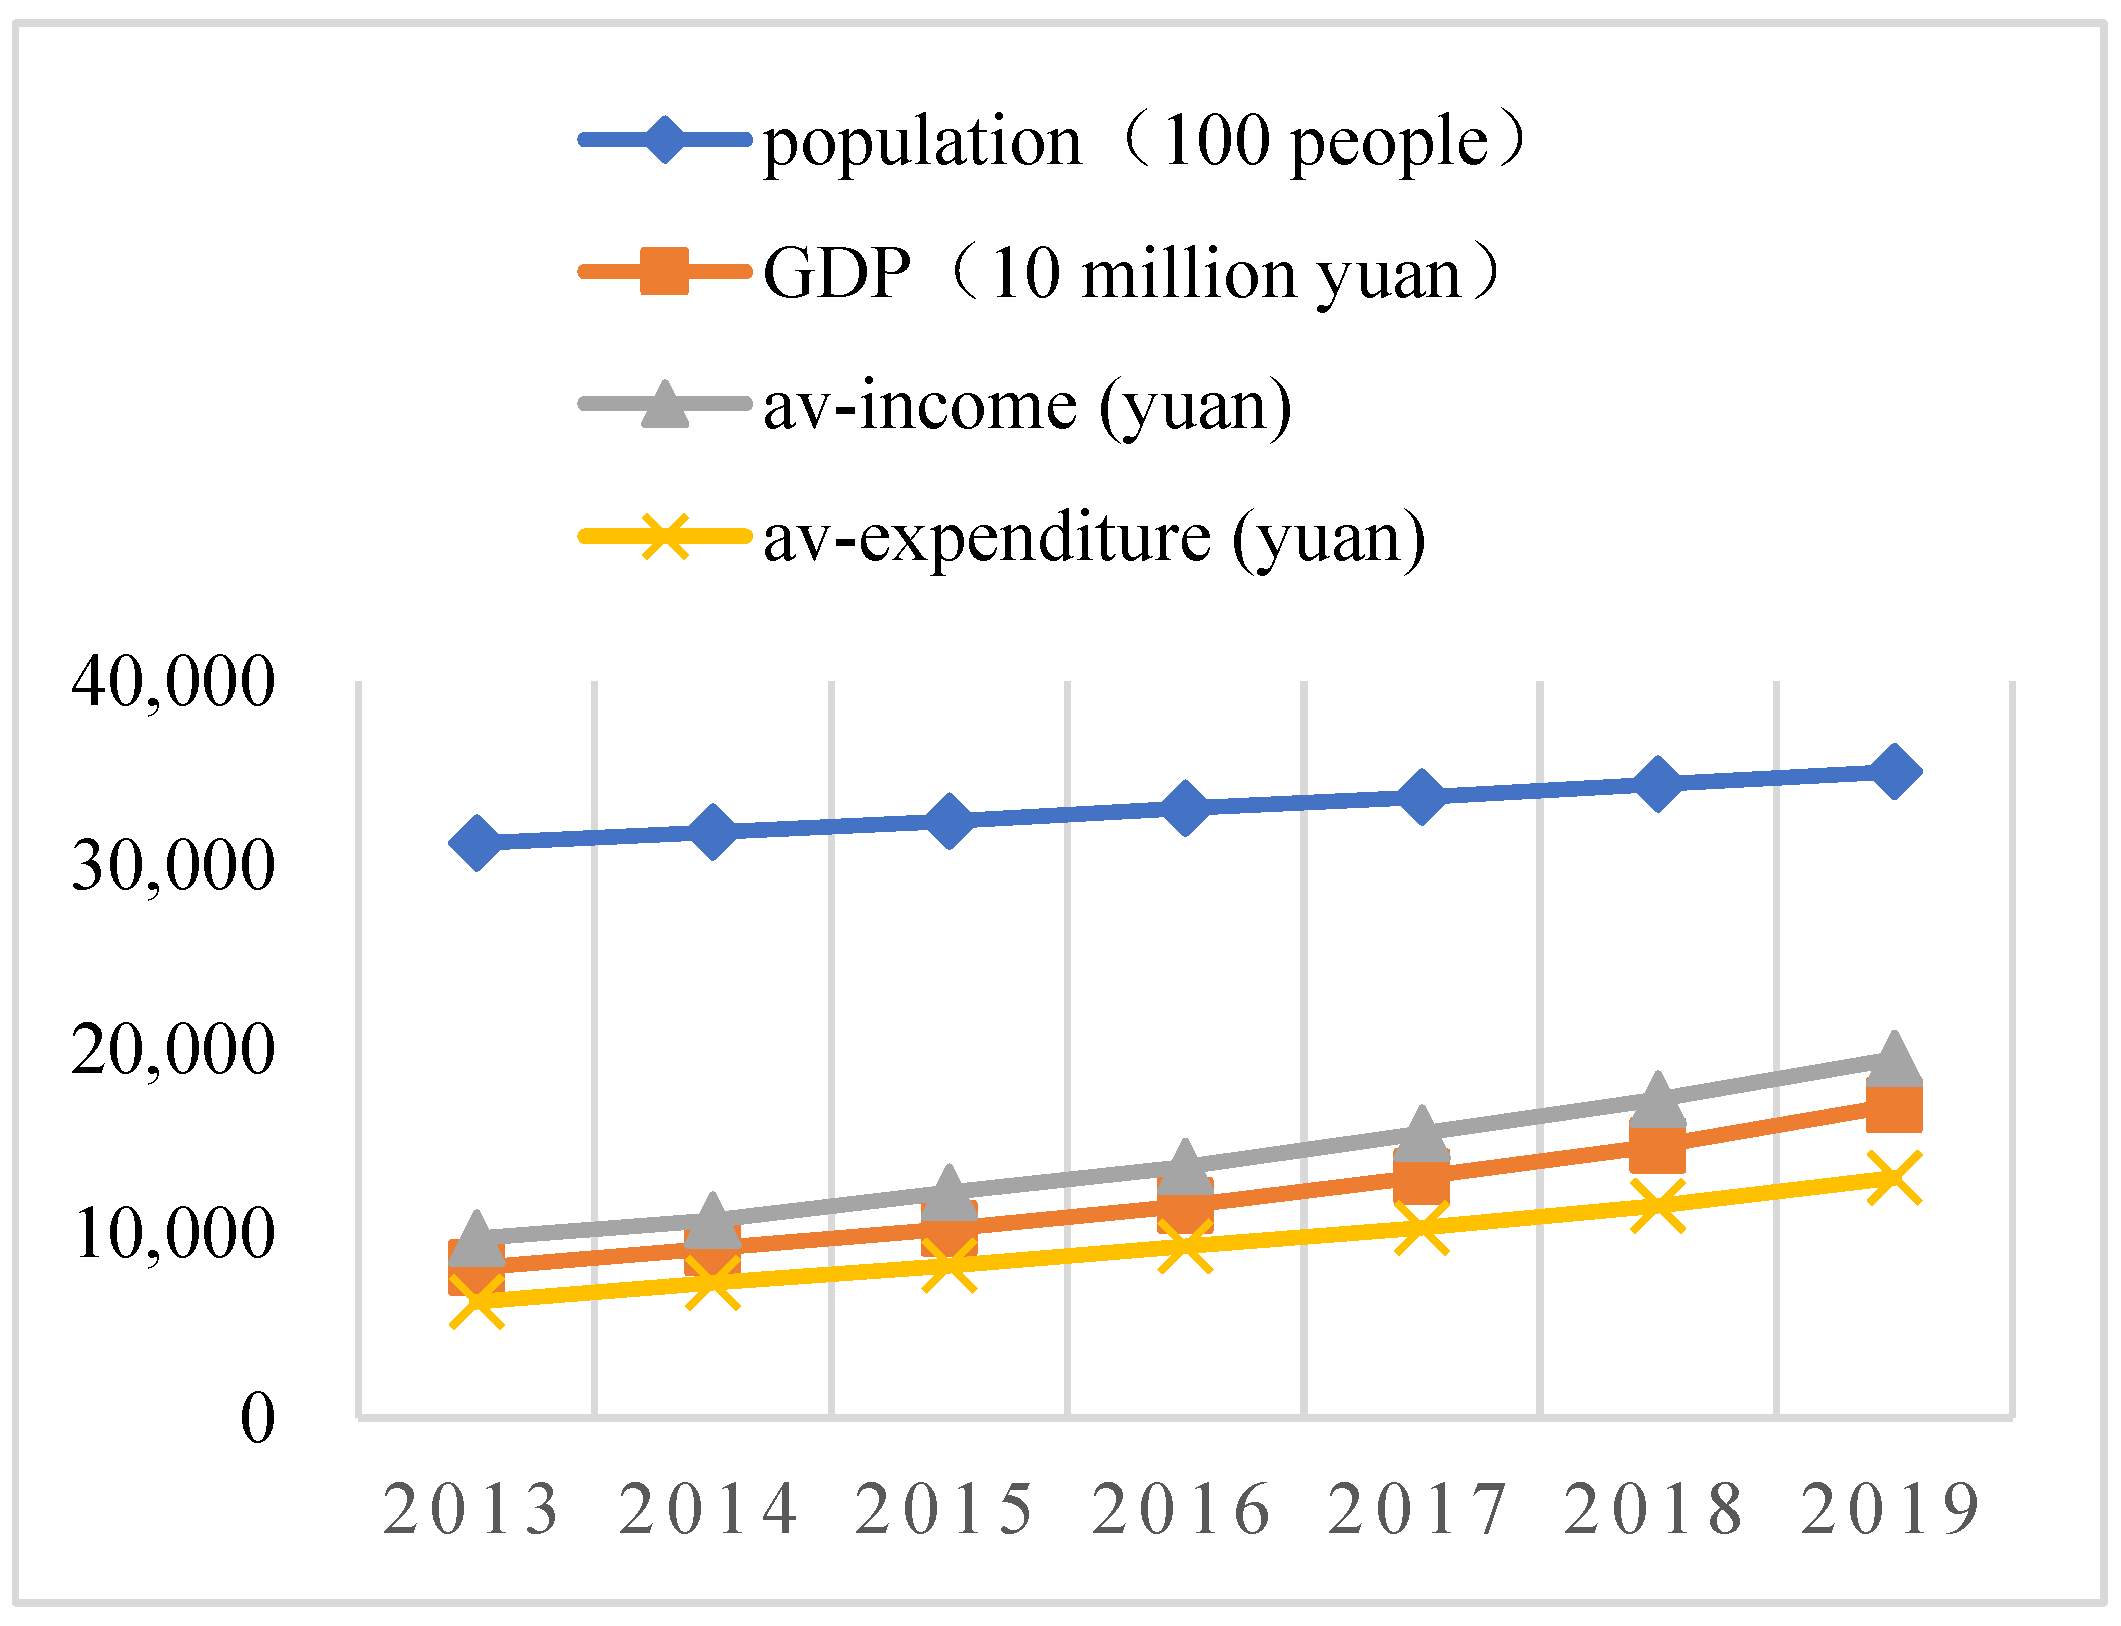
Based on data from the China Statistical Yearbook (2013–2019), basic indicators of China’s socioeconomic structure from 2013 to 2019 were compiled, including population, gross domestic product (GDP), consumer price index (CPI), per capita disposable income (av-income), per capita disposable expenditure (av-expenditure), livelihood energy consumption index, total energy consumption, total electricity consumption, livelihood electricity, and coal consumption.
In 2013–2019, China’s population growth was slow; GDP growth during this period reflected China’s rapid economic development. However, the av-income and av-expenditure rates were relatively slow due to the large population (
Figure 1).
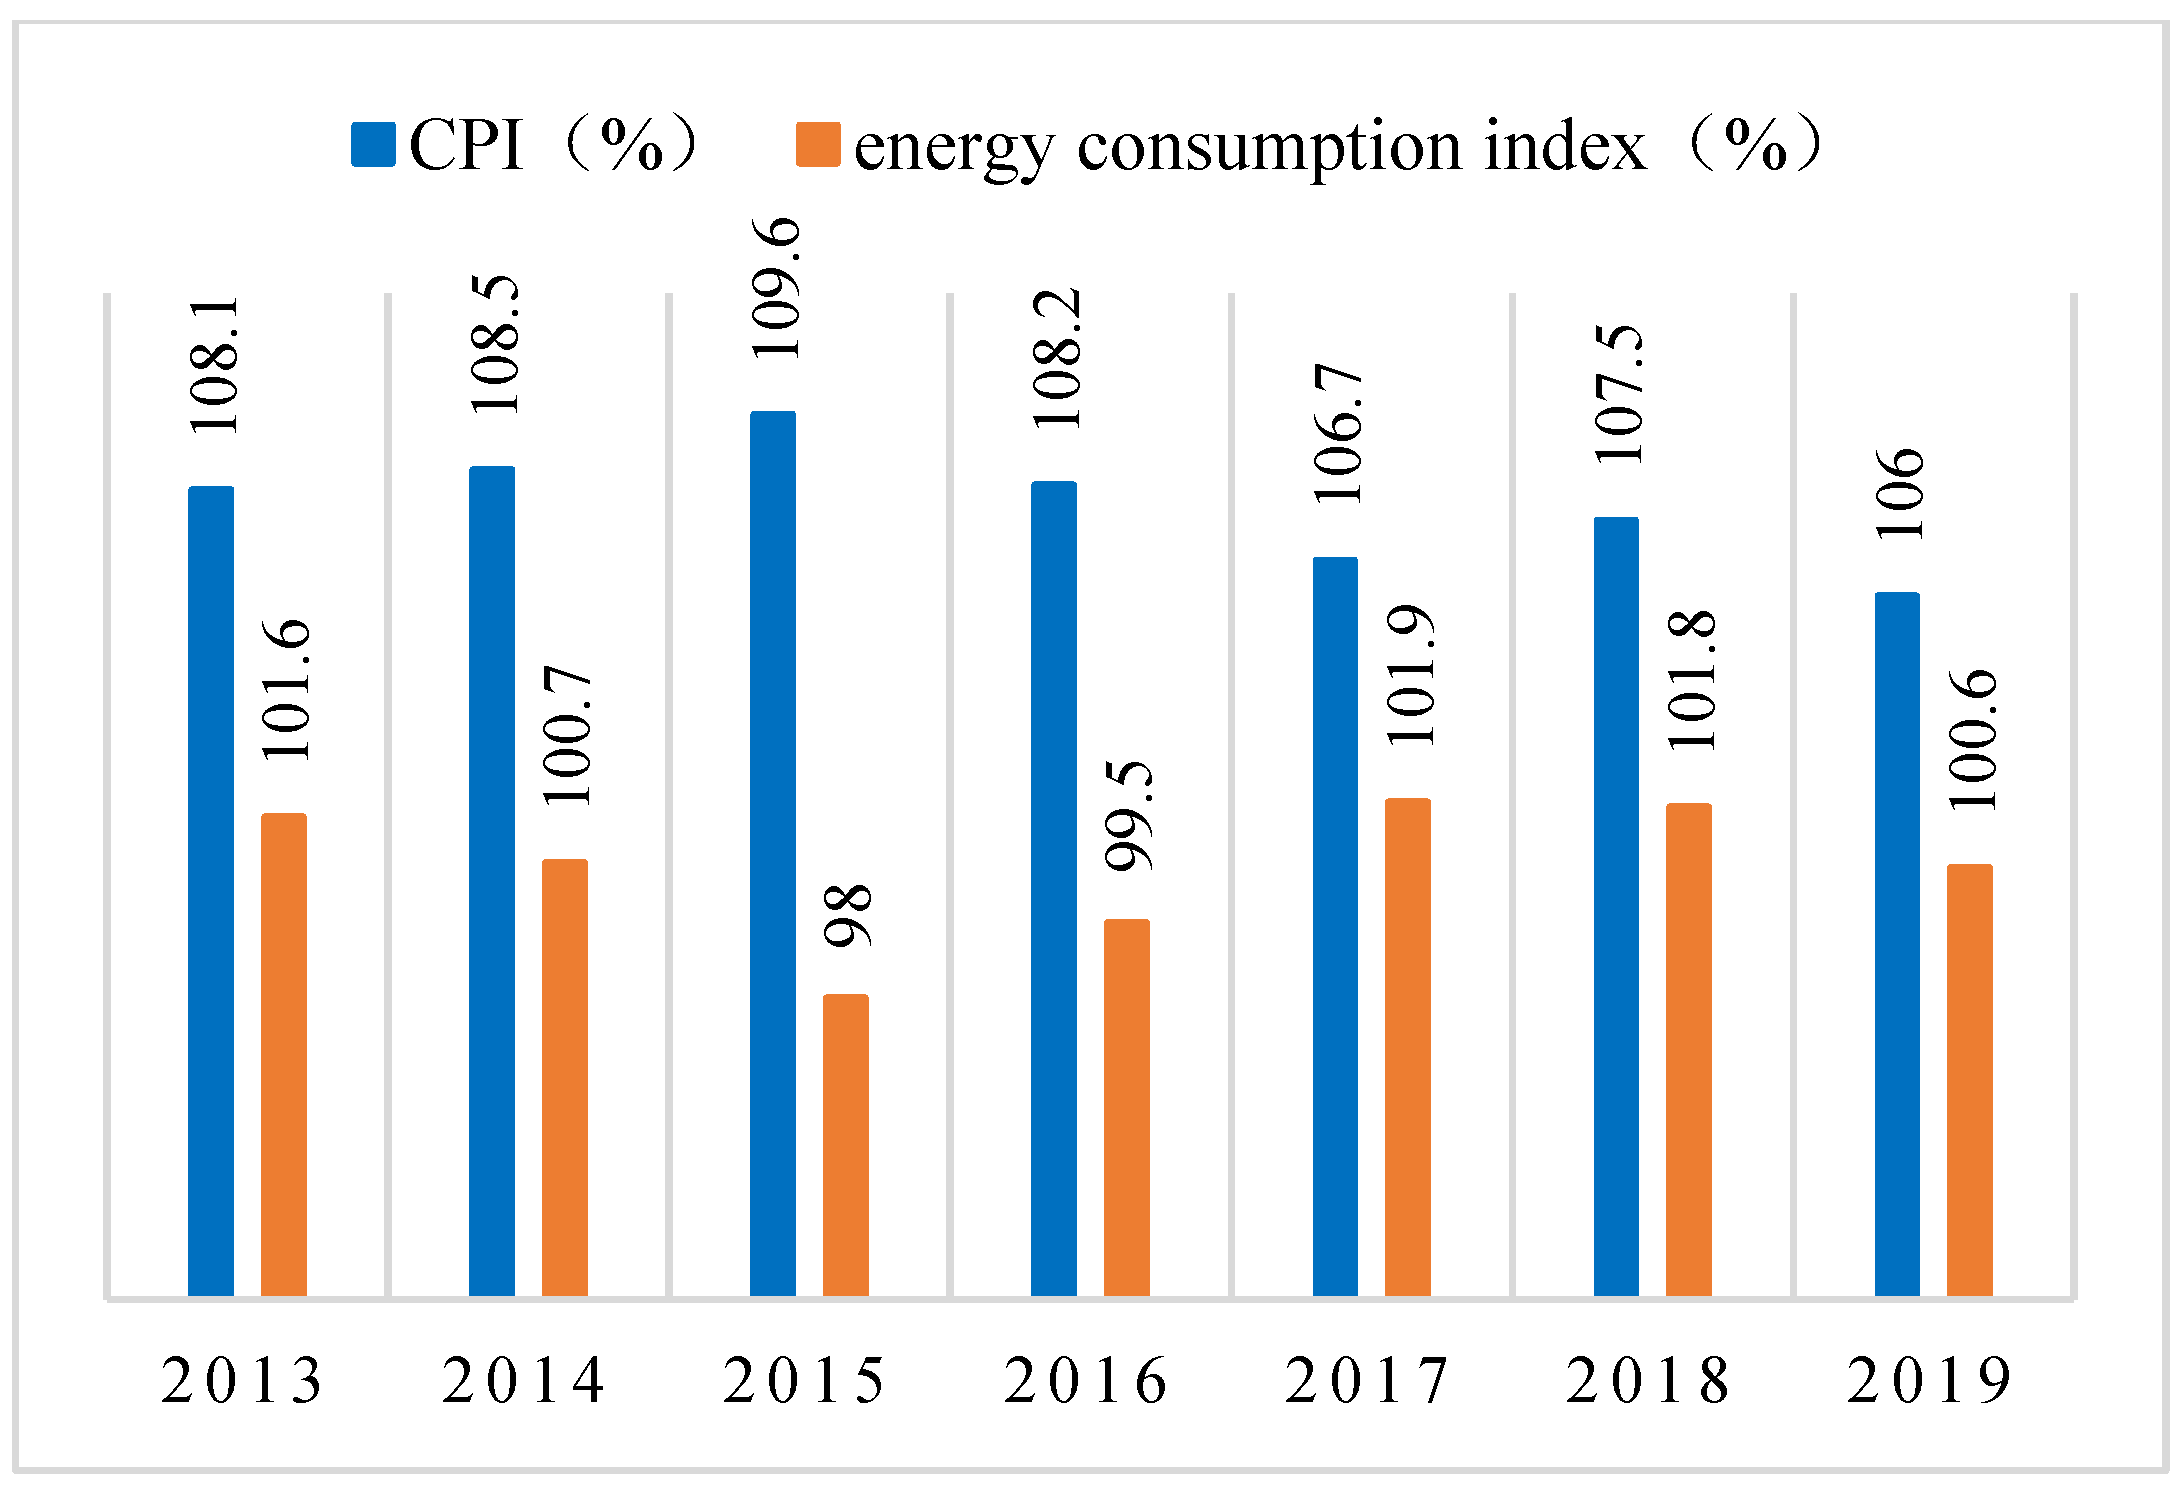
The energy livelihood consumption index was lower than the CPI, although it fluctuated significantly because of China’s recent ‘destocking’ and ‘adjusting structure’ economic strategies (
Figure 2). The overall downward trend in the CPI shows that the Chinese government’s macro-control policy on prices has achieved positive results.
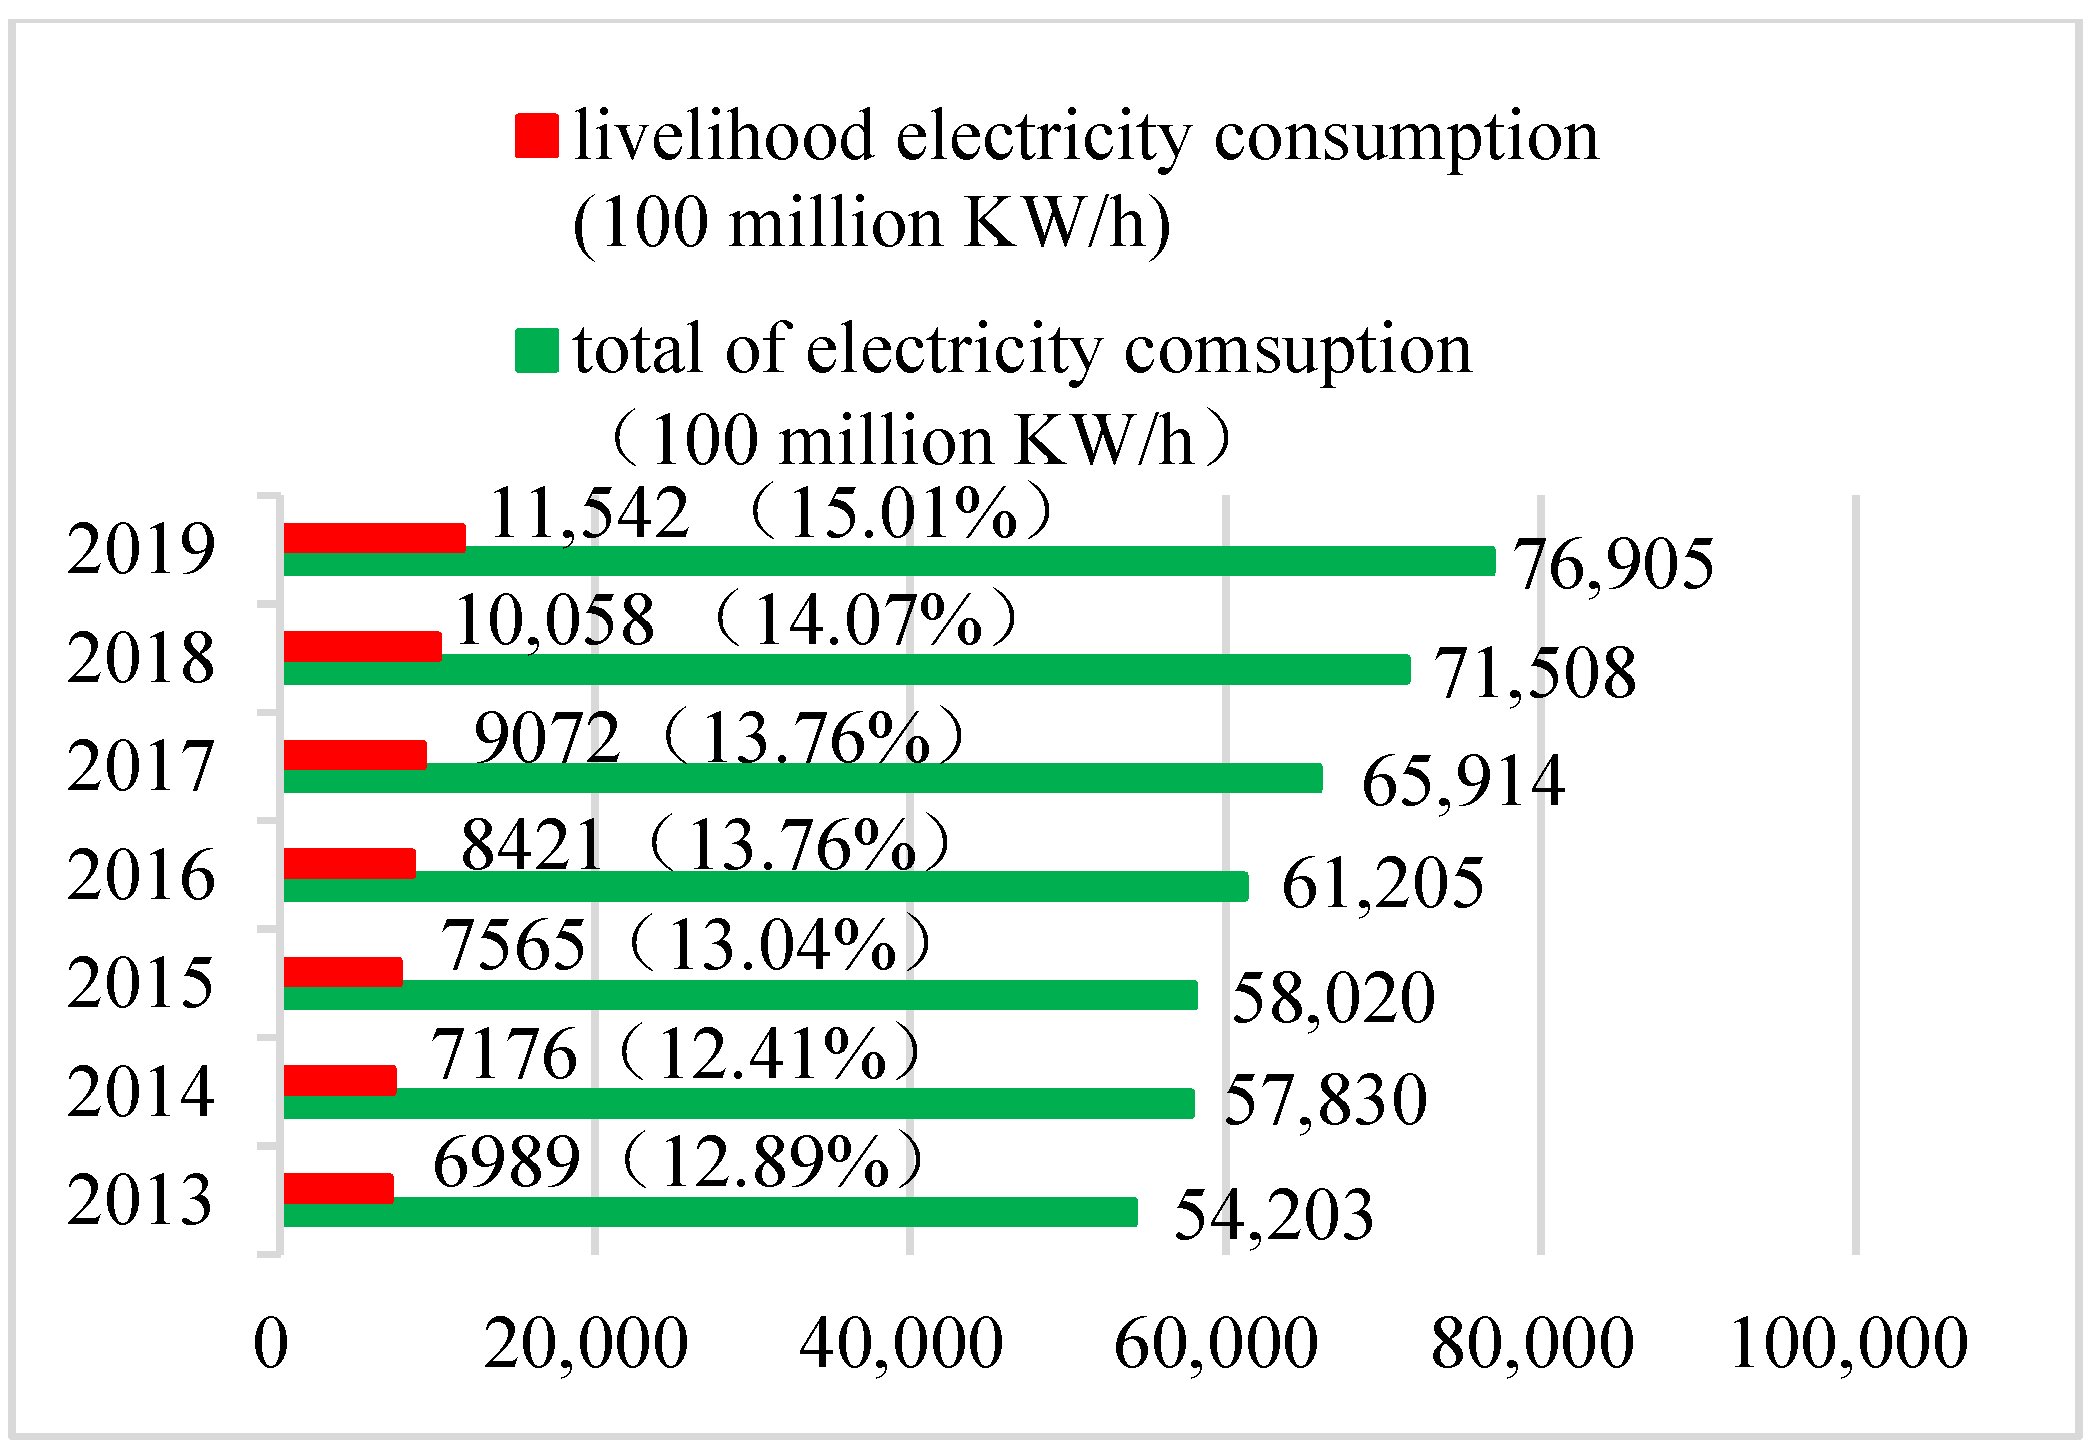
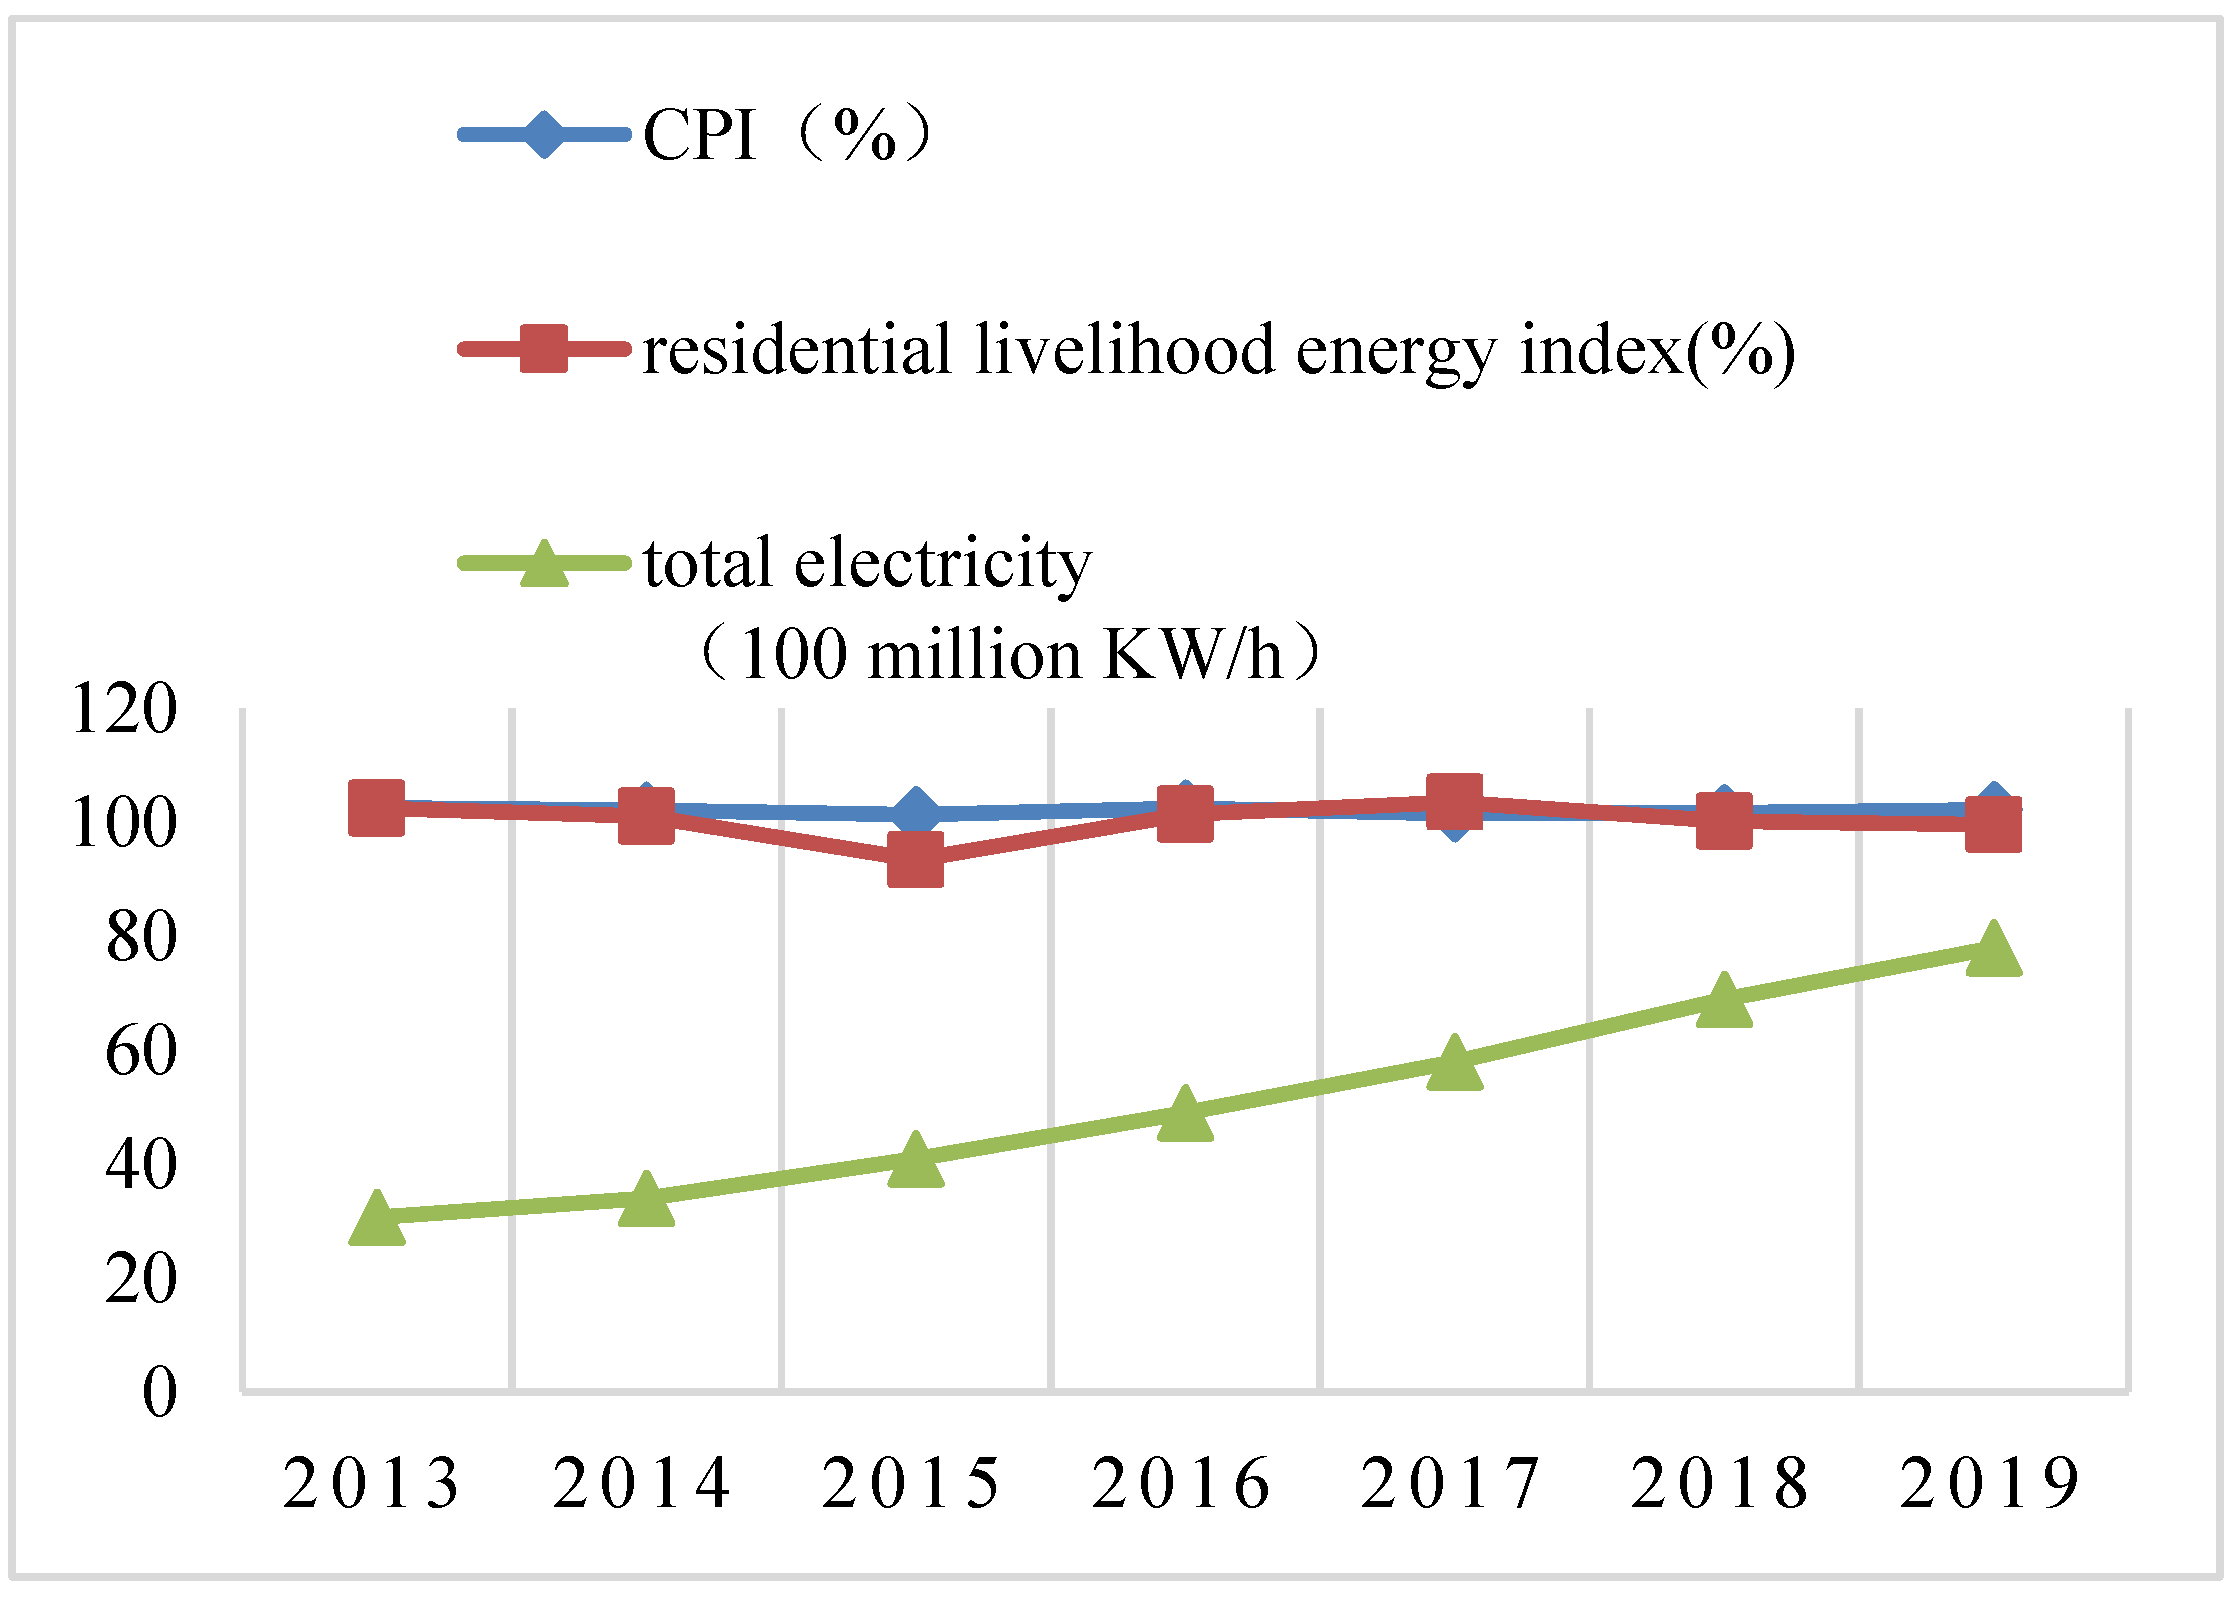
Both the resident livelihood and total electricity consumption increased from 2013 to 2019 (
Figure 3). The proportion of the electricity consumption associated with residential livelihoods in the total electricity consumption also showed an upward trend. The Chinese government has recently focused on the development of solar, wind, hydro, and nuclear power. The total amount of electricity produced from clean energy sources has continued to increase. With economic development, electricity consumption has also continued to increase.
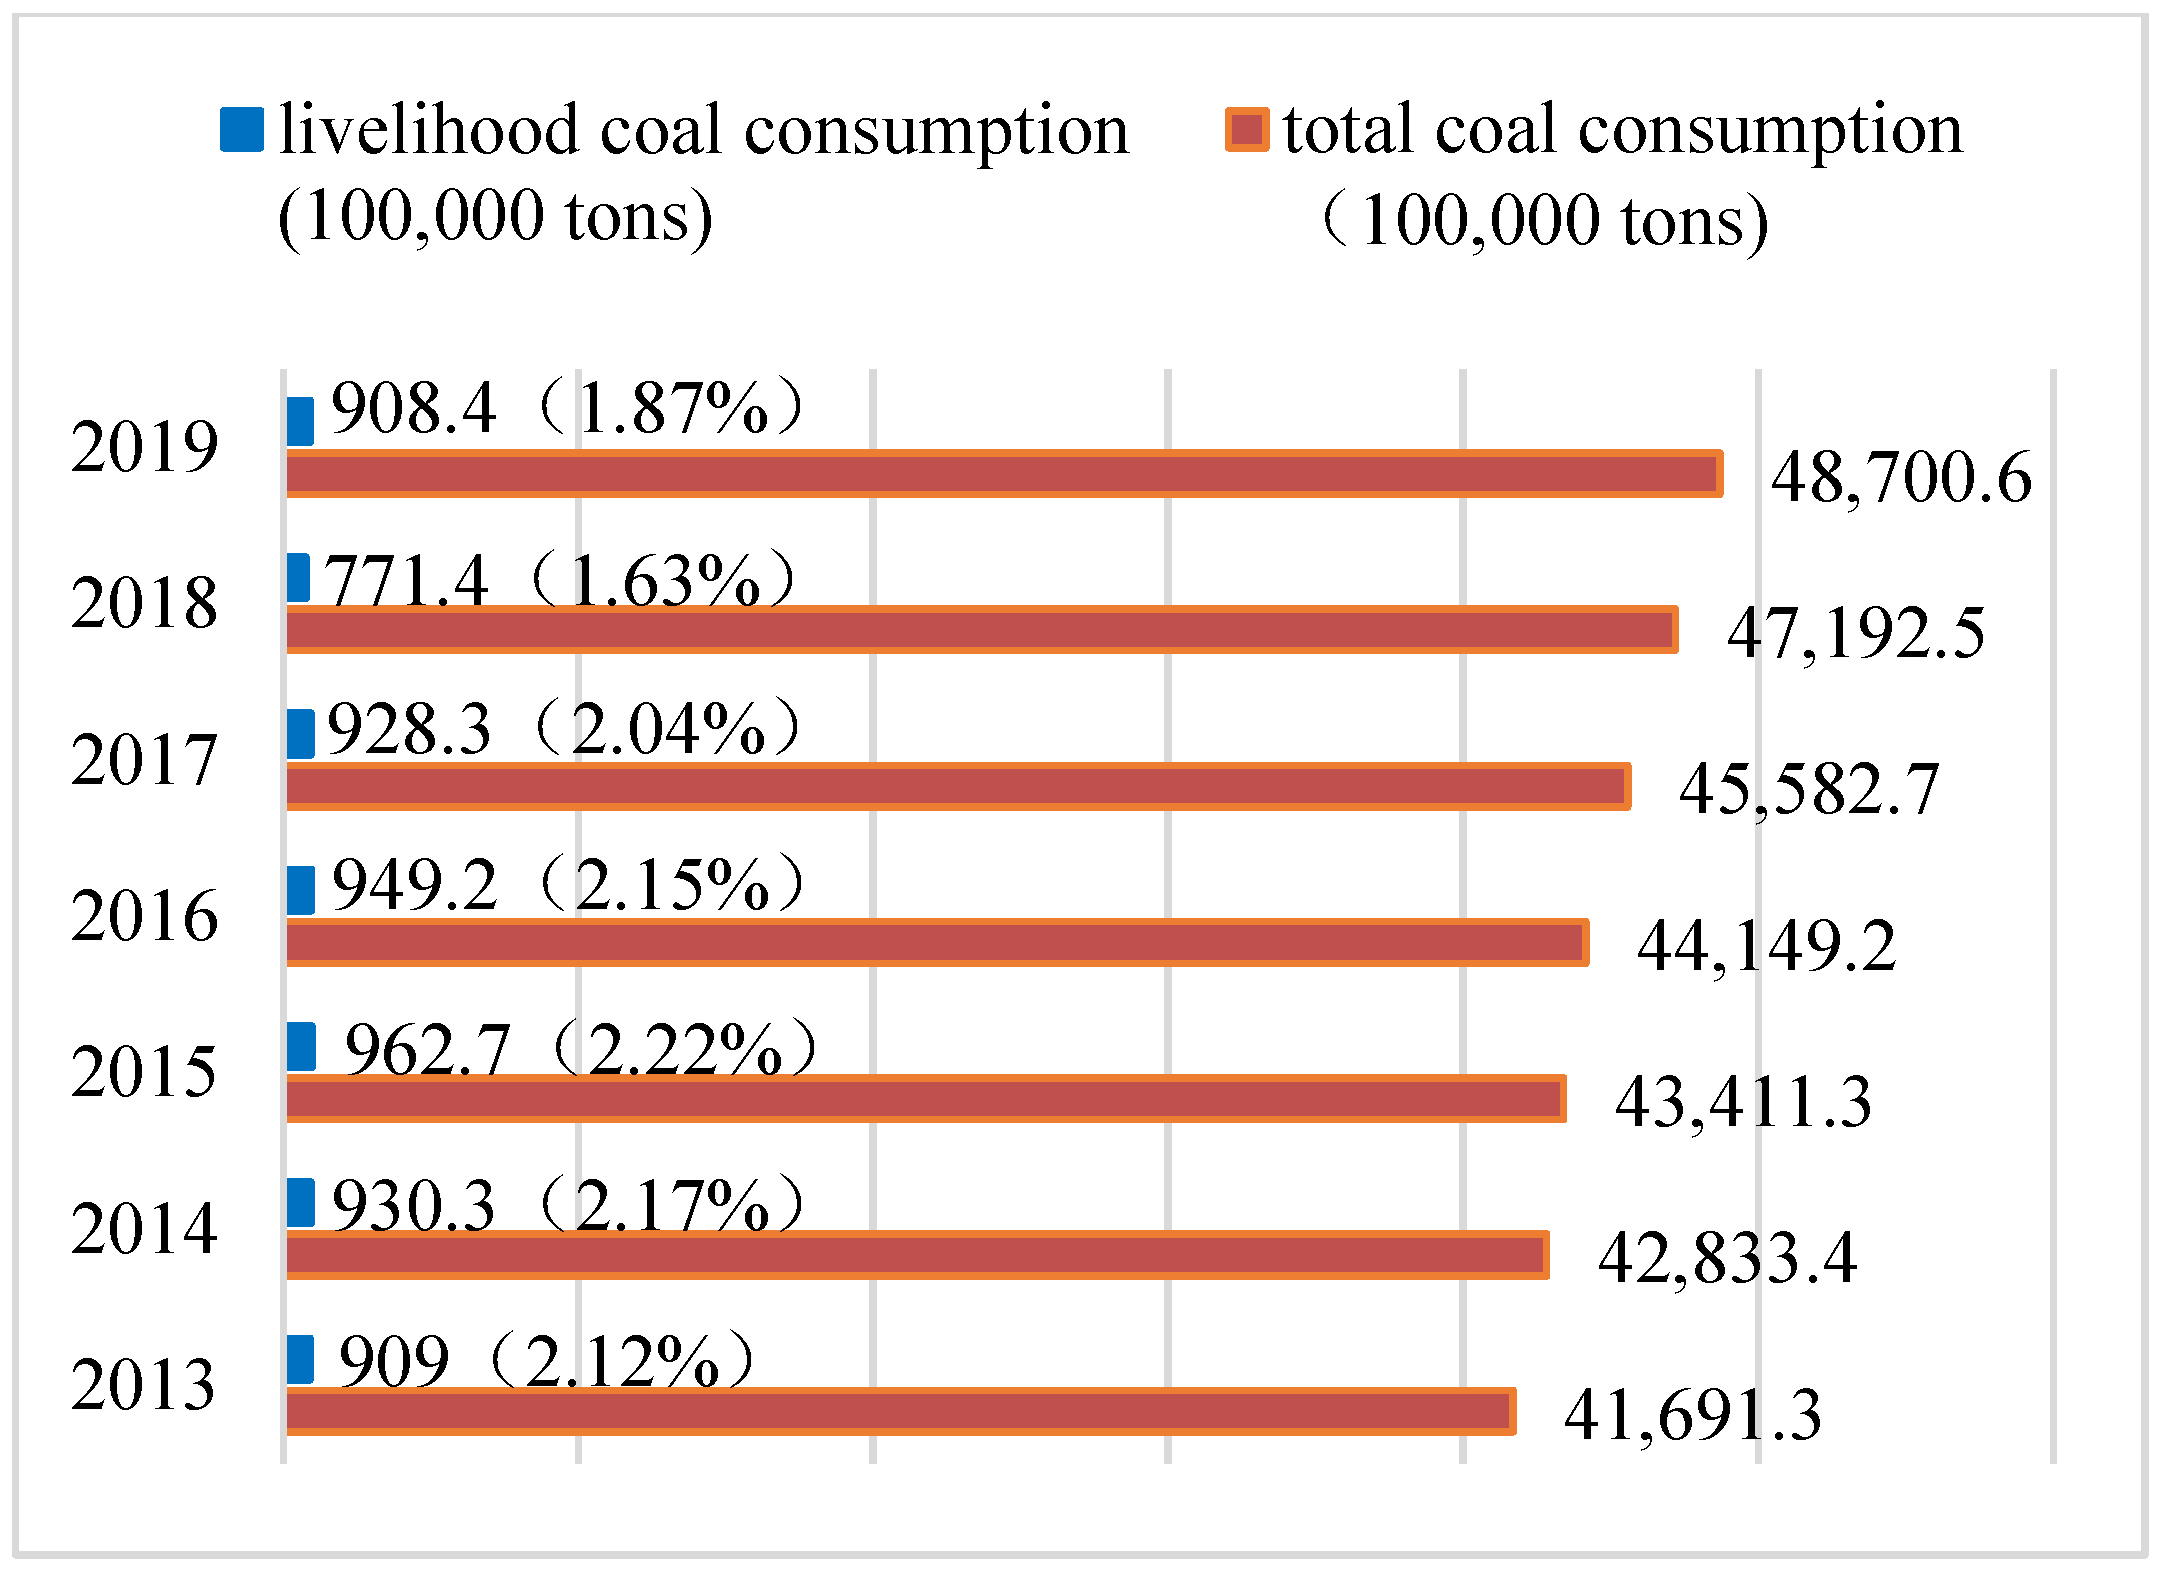
Residential consumption of coal for maintaining a quality livelihood has fluctuated, although its relatively low percentage implies that energy consumption for residential livelihoods is relatively clean and has a low carbon footprint (
Figure 4). Although the total coal consumption increased from 2013 to 2019, the growth rate was relatively slow, reflecting the Chinese government’s recent push toward a low-carbon economy.
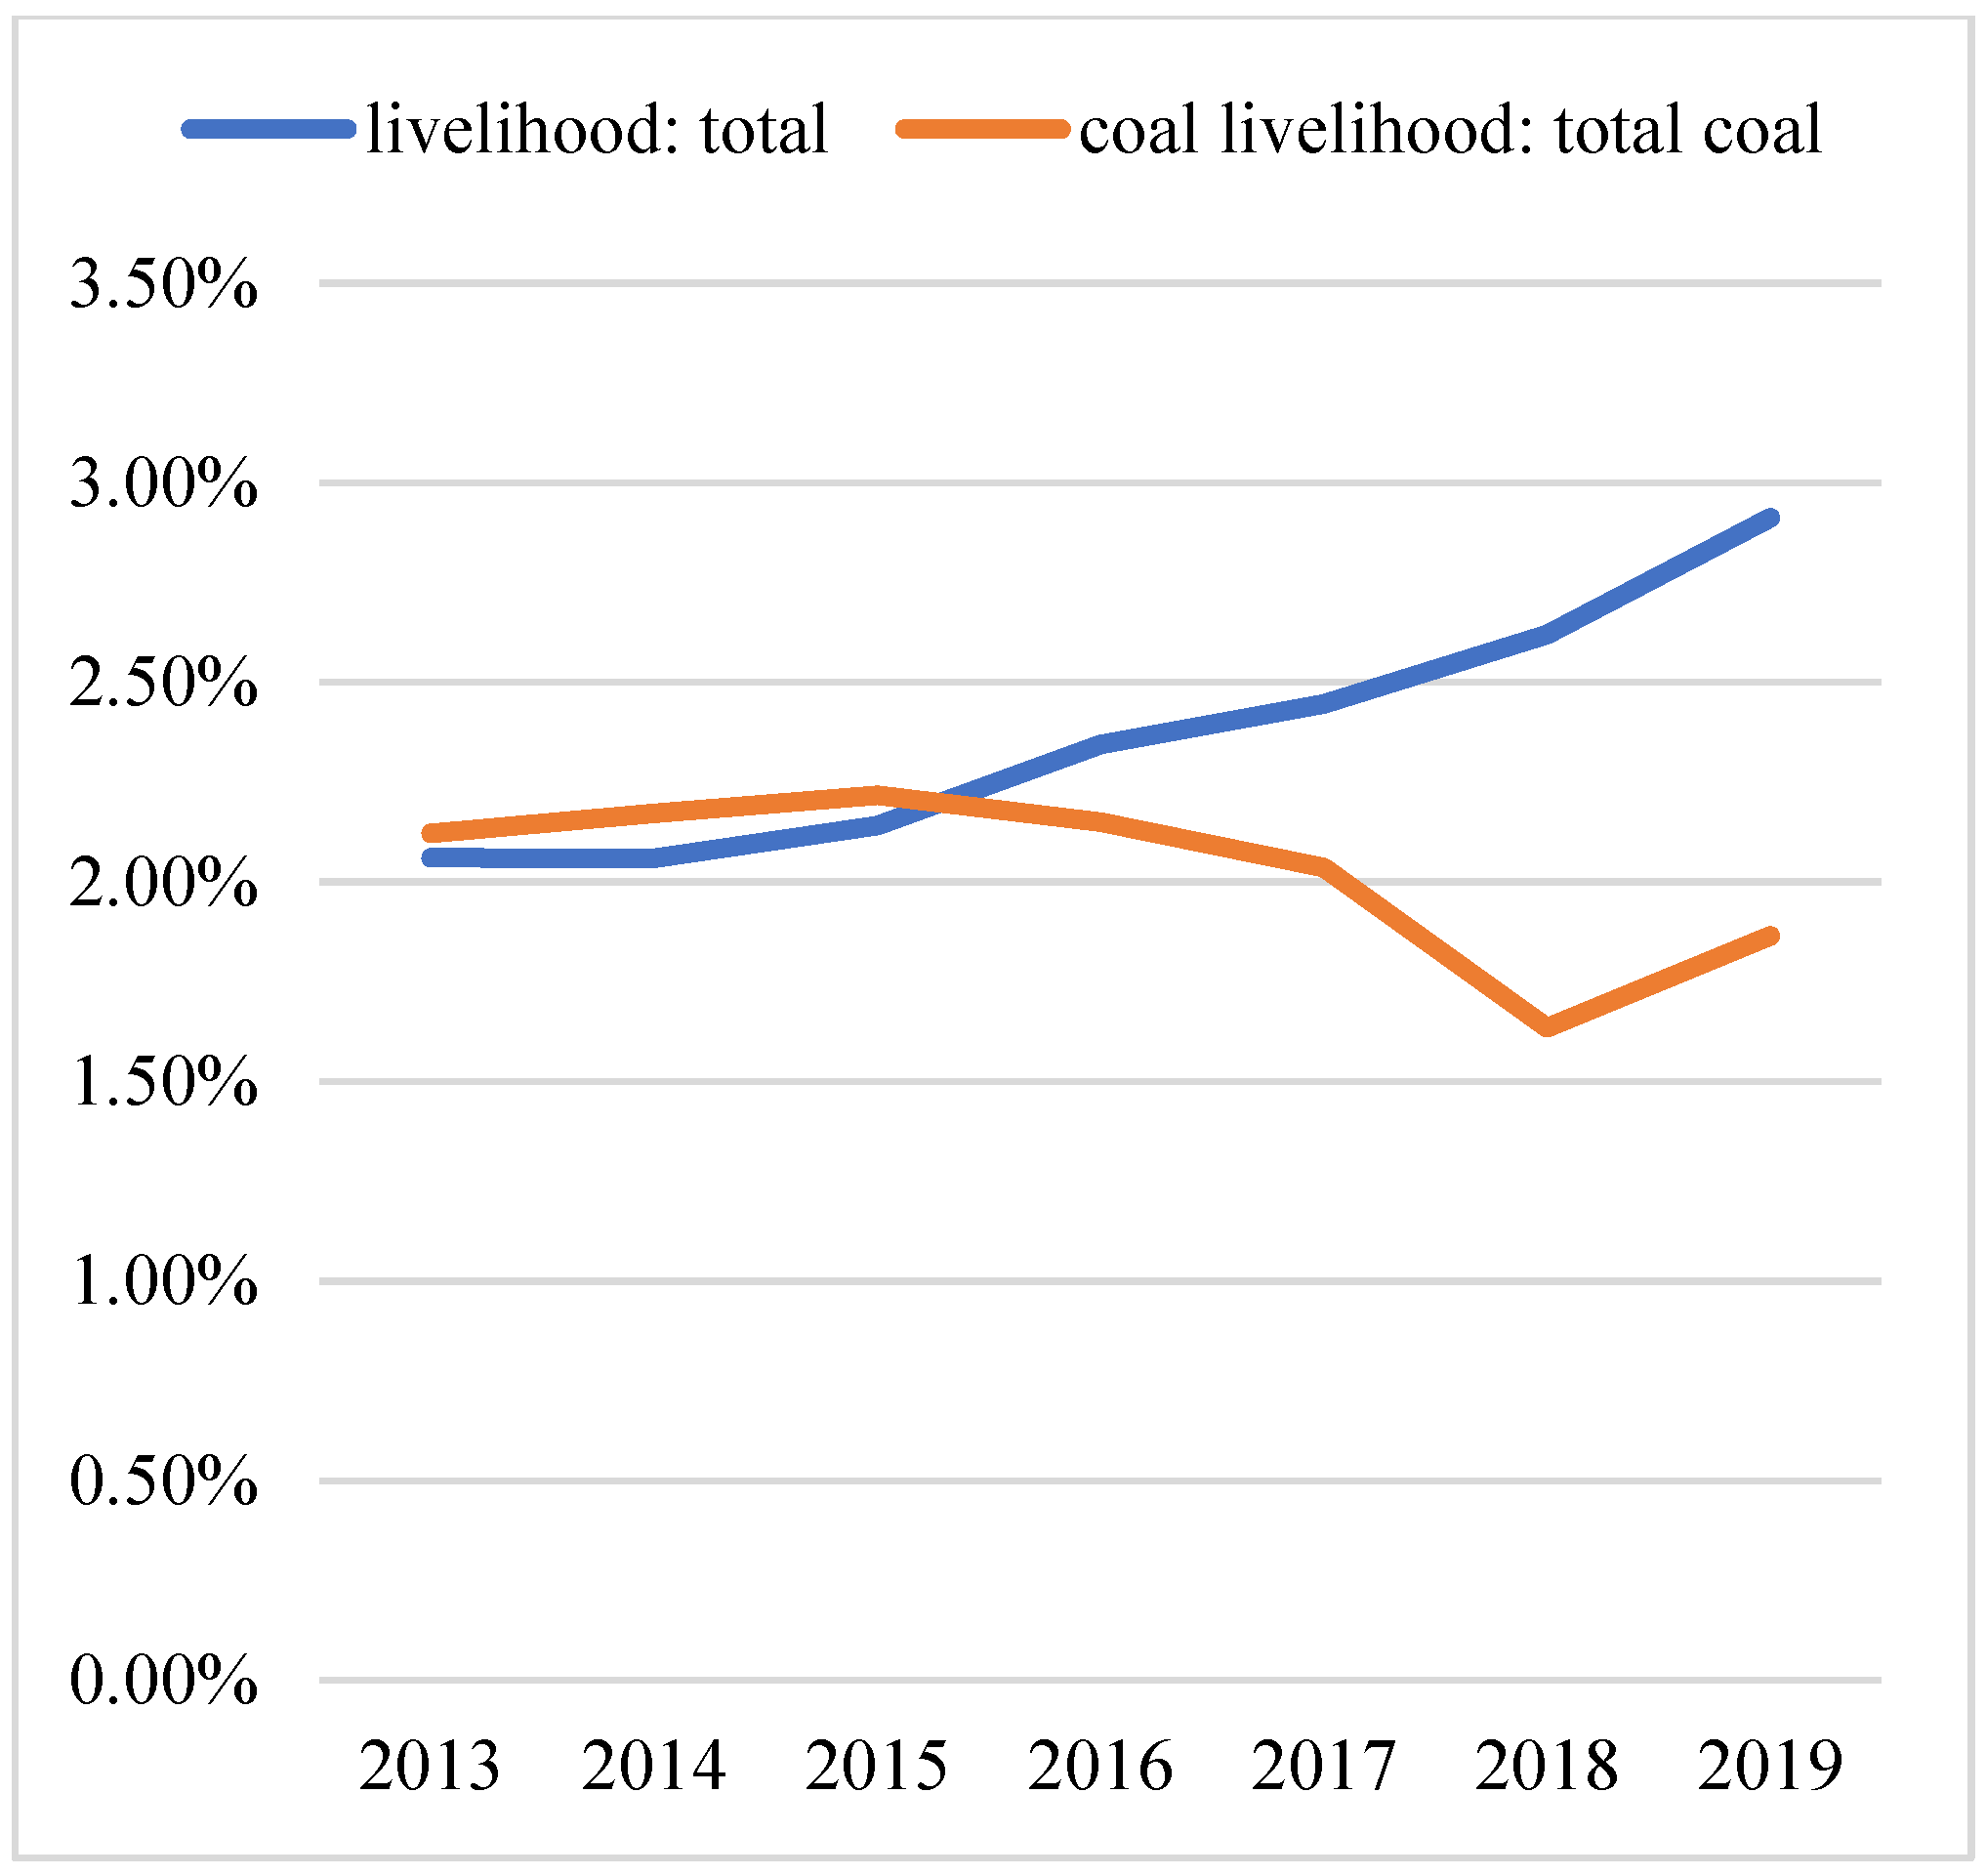
Using a standard ratio of 100 million kW·h
–1 per 12 290 tonnes of standard coal, both the electricity and coal consumption were uniformly converted into a standard unit of 100,000 tonnes of coal, and the residential electricity and coal consumption from 2013 to 2019 were calculated (
Figure 5). The ratio of residential coal to the total energy consumption exhibited a downward trend while the proportion of the residential livelihood electricity in the total energy consumption has increased annually; these findings indicate that residential energy consumption is becoming cleaner with a decreasing carbon content. These changes also indicate that China’s energy poverty problem is being gradually alleviated.
2.2. Tibet
Identical socioeconomic indicators were compiled for Tibet from 2013 to 2019 based on the statistical annual report data from the Tibetan Autonomous Region (
Figure 6).
The growth rate of Tibet’s population was negligible; this is largely a product of the low local population density. However, the GDP, income, and expenditure all increased significantly; this is attributable to targeted poverty alleviation efforts by the Chinese government that have driven the rapid development of the Tibetan economy and subsequent improvement in residential livelihood.
Tibet’s CPI did not change significantly from 2013 to 2019, indicating that prices are stable; when this finding is considered in combination with the observed increase in the annual income, we can reasonably conclude that the standard of living in Tibetan has gradually improved (
Figure 7). The energy consumption index for the livelihood has risen slightly, which agrees with the general law of the changes in the economic market price, wherein the demand increases with the price when other conditions are unchanged. Tibetan resident electricity consumption is increasing annually, which is partially related to the Chinese government’s plan to promote clean energy on the Qinghai–Tibet Plateau.
In summary, our analysis of the seven socioeconomic metrics shows that China’s economy is steadily growing, and Tibet’s socioeconomic progress is rapid. National energy production and the household and total energy consumption are all increasing, indicating that China’s clean energy sector is developing and Tibet’s energy poverty situation is beginning to improve.
3. Literature Review
Energy is an essential component of modern human life, which is used for cooking, lighting, and other vital activities [
21]. Access to affordable, reliable, clean, and safe energy sources is important for economic and human development [
22,
23,
24,
25]; however, energy poverty is a common problem globally. Most countries in Africa face not only economic, but also severe energy poverty. In sub-Saharan Africa, approximately 905 million people have no clean cooking fuels, while 578 million people are without electricity [
19,
26]. Energy poverty also exists in developed countries [
27]. For example, although the United Kingdom addressed the fuel energy issues early in the 20
th century, energy poverty remains a serious issue [
28]. Moreover, the energy status of Europe is pessimistic [
29]. Although the U.S. government has not explicitly acknowledged the existence of energy poverty within the country, it has been observed in western mountainous areas [
30]. Australia’s energy consumption is highly polarised. Residents in economically underdeveloped areas cannot pay for energy or obtain a stable energy supply [
31]. Rural populations across South America, including Brazil and Chile, have increasingly called for energy structure adjustments [
32]. Low energy consumption and weak energy use capacity problems are noticeable in China; since 1986, China has focused on addressing rural energy poverty [
11]. DellaValle (2019a) explained that energy poverty is not only confined to rural areas but also exists in some urban communities [
33]. Furthermore, Yip et al. (2020) arrived at a similar conclusion after examining the energy poverty situation in Hong Kong [
34].
Energy poverty’s impacts are diverse. Inefficient energy use increases time costs, thereby decreasing the opportunity to engage in other economic activities [
35]. The combustion of coal, fuelwood, and biological excrement for energy can cause long-term harm to human health, including a myriad of diseases [
36]. Perhaps more importantly, it can cause long-term psychological problems. Studies have found that energy-poor people think they are inferior to others [
37,
38]. Additionally, energy poverty can lead to environmental damage and resource stress, inhibiting sustainable development of the economy and society [
3,
38].
The factors that cause energy poverty are complex. Climatic conditions [
39], biological abundance [
40], and energy endowments [
22] all affect energy availability. Shirazi et al. (2019) stated that economic and energy poverty are basically equivalent [
41]. Some scholars have also pointed out that energy prices [
42,
43,
44] and the income level directly affect the types of energy used [
45,
46,
47,
48]. Education level and energy infrastructure can also directly affect the energy use ability and attitude [
3,
41,
42]. Huayi, C et al. (2020) used the data of Chinese General Social Survey (CGSS) in 2015, finding that the population and age structure have a significant impact on the energy consumption structure [
46]. Castaño-Rosa et al. (2020) found that the energy poverty of disadvantaged families is more serious [
49]. In addition, social relations, living habits, national policies, and transportation convenience have been found to lead to varying degrees of energy poverty [
50].
Residents of most areas in Tibet use manure as their primary fuel source [
48]; however, with the increasing use of solar cookers, both the living standards and social status of women have improved. Some researchers have proposed that the key cause of energy poverty in Tibet is its imperfect energy infrastructure; solutions should focus on accelerating development [
33]. Middlemiss and Gillard (2015) considered the causes of energy poverty in Tibet to be multidimensional [
44]. Zhang et al. (2019) pointed out that the government plays a leading role in alleviating Tibet’s energy poverty [
12]. Energy use will improve with targeted poverty alleviation in Tibet; currently, however, the energy development index of the entire Tibetan region, including Lhasa, remains low [
51].
In summary, although there is an abundance of global research on the current levels and drivers of energy poverty and its associated negative impacts, these studies are limited by subjective and objective constraints. Additionally, relatively few scholars regard the energy poverty in Tibet as a systemic issue. Some urgent and unanswered questions are as follows. How does energy poverty in Tibet compare to other regions? Does its unique cultural environment affect the present energy poverty levels? How best can energy poverty be alleviated to address relative poverty and promote rural revitalisation in Tibet? The remainder of this paper addresses these questions.
4. Theoretical Analysis and Hypothesis
The term ‘energy poverty’ stems from the discussion of poverty in developmental economics. Although different organisations, countries, and regions maintain different definitions of energy poverty, it is universally regarded as one of the pillars of poverty. Generally, the term poverty includes economic, ability, energy, and rights poverty (among others). Economic poverty refers to when an individual or household income cannot meet basic living conditions for an extended period. Clean energy is a valuable commodity, and an individual must pay to obtain it. Therefore, when an individual or household income cannot meet the clean energy expenditure over time, they will likely fall into energy poverty. In addition to income, allocation may also play a role in energy poverty because some households may not be able to afford clean energy due to other expenses, such as expenses for religious activities in Tibet. Based on these facets of poverty, we developed two hypotheses for the analysis of energy poverty in Tibet. The first hypothesis (H1) predicts that income and energy poverty are negatively correlated, while the second hypothesis (H2) predicts that religious expenditures and energy poverty are positively correlated.
Ability poverty refers to the disadvantage of subjects when participating in the distribution of social resources, where obtaining self-development through external forces is difficult. Clean energy providers must capture and deliver energy to residents while maintaining cost factors. If a family’s geographic location requires costly or inconvenient transportation, it may lead to lack of access to clean energy. According to 2019 survey data on livelihood development in Tibetan farming and pastoral areas, combined with the actual situation in Tibet, two additional hypotheses were posited. Hypothesis 3 (H3) predicts that the altitude of a family residence and energy poverty are positively correlated while hypothesis 4 (H4) predicts that traffic and energy poverty are negatively correlated (i.e., the more convenient the transportation, the lower the probability of energy poverty).
Rights poverty refers to a lack of political and economic rights of a social group. As Tibetan farmers and herders cannot obtain high-efficiency clean energy during long-term planting and breeding processes for a variety of reasons, they are accustomed to using nonclean fuel energy, such as straw and dung, losing their right to access clean energy in the process. This phenomenon is more conspicuous in families with a higher average age because they have formed a deeper dependence on nonclean energy sources and are less eager to embrace clean energy. Based on this information, we formulated the final two hypotheses of this study. Hypothesis 5 is two-pronged (H51 and H52): H51 predicts that planting behaviour and energy poverty are negatively correlated, and H52 predicts that breeding animals and energy poverty are negatively correlated, as farming family patterns are more likely to include a greater number of offspring. Hypothesis 6 (H6) predicts that age and energy poverty are positively correlated (i.e., the older the family members, the higher the probability of energy poverty).
5. Sample Description and Model Construction
5.1. Data Source
This study employed 2019 survey data on livelihood development in Tibetan farming and pastoral areas. The survey adopted an implicit stratification method to extract two-stage equal probability samples from administrative village committees as the first stage and family households as the second. Three levels of data were extracted (i.e., individual, family, and community), covering the basic characteristics of the respondents, families, economic income, expenditures, medical and health status, education, lifestyle (energy usage), and other information related to the community (village) industrial structure, traffic conditions, and energy supply and demand. Based on the research needs, we extracted relevant data from the counties of Duilongdeqing, Mozhugongka, Nimu, Damxung, Qushui, Linzhou, and Dazi in Lhasa as the sample data. Data validity was tested, and the results showed that kmo (Kaiser–Meyer–Olkin) = 0.6158; this indicates that the data are effective and can be used for statistical analysis.
5.2. Variable Selection and Descriptive Statistics
5.2.1. Variable Selection
This study employed energy poverty as the explanatory variable. Fuelwood, bio-dung, and coal (gas) were classified as nonclean, whereas natural gas, solar, geothermal, and wind energy were classified as clean energy sources. The questionnaire employed a sliding scale for responses (e.g., responses to the question ‘How often does your family use firewood energy?’ were offered on a 5-point scale indicated by Daily use = 5, Frequently = 4, Sometimes = 3, Rarely = 2, and Almost never = 1). The frequency of farmers’ and herders’ use of the six types of energy—firewood, coal, biological manure, natural gas, solar energy, and wind—was examined. If the frequency of the clean energy use was lower than the nonclean energy use, the EP value was set to 1 and defined as a household falling into energy poverty. If the frequency of use was equal, the EP value was set to 2 and defined as the poverty threshold. When the frequency of clean energy use was greater, the EP value was set to 3 and defined as a household not falling into energy poverty.
5.2.2. Explanatory Variables
Based on the survey data obtained from the questionnaire, this study defined four primary indicators as explanatory variables (
Table 1). These four variables include the following: (1) basic population characteristics (such as age, gender, education, and marital status); (2) demographic and social characteristics (e.g., including political, history with village cadres, migrant work, and employment); (3) basic familial characteristics (e.g., home ownership, agricultural areas to which a family belongs, residence altitude, and standing of the village); and (4) family economic characteristics (such as income, crop cultivation, livestock and poultry breeding, and automotive and religious expenditures).
Owing to the strong Buddhist beliefs in Tibet, education in temples is considered comparable with that in schools. The predominant industrial land use where the respondent’s family is located was classified as either agricultural, pastoral, or semi-agricultural and semi-pastoral areas. Village standing refers to the socioeconomic level of the interviewees’ village compared with others of the same type, as well as various other measurement standards, such as the economic output value and traffic. Regional differences in religious beliefs result in different levels of religious expenditures, such that it was included in the variables.
5.3. Descriptive Statistics
After accounting for extreme data values, we used
STATA (v.15) to calculate the descriptive statistics of the questionnaire results (
Table 2). The average economic poverty value was 2.107, indicating that more respondents are at the threshold or slightly above the energy poverty line. The average income was ~40,000 Yuan (
RMB), which is relatively low compared with other parts of the country; the average religious expenditure (ER) was ~400 Yuan (
RMB), which represents a relatively small fraction of the income. The average family altitude (FA) was ~3980 m (i.e., a high altitude). The average traffic level was 2.487, indicating a high percentage of highway coverage. The average values of planting and breeding were 0.706 and 0.894, respectively, which indicate that most families are involved in crop planting activities and raising cattle or sheep. The average age of the respondents was 49.8 years.
Table 2 lists the overall conditions of the other measured variables.
5.4. Model Setting
The definition of energy poverty was based on ternary discrete results (1 = Energy poverty; 2 = at energy poverty threshold; and 3 = Non-energy poverty) according to comparisons of the respondents’ frequency of use of different household energy types. The index variable data were both discrete and continuous. To investigate the requirements of the data characteristics and achieve the ultimate goal of exploring the factors that drive energy poverty, this study chose a multivariate logistic model. This method has been used by many studies [
52,
53] for examining problems related to household energy consumption.
There were
n independent variables (i.e.,
x1, x2, x3 ... xn) that affected the dependent variable
y, where the value of
y was
p = 1 or
p = 0. When
y was
p = 1, it was assumed that
y occurred under the condition of
x, whereas when
p = 0, it was assumed that
y did not occur under the condition of
x. The following are the expressions of the function model for the two cases:
and
Here, Equation (3) is as follows:
In practical applications, instead of directly regressing
P, we first defined a monotonic continuous probability function:
Therefore, the probability of occurrence and non-occurrence is as follows:
For this ratio as the odds of an event, we derived the following equation:
The logistic model generally uses the maximum likelihood method to obtain the parameters, with m independent samples, as follows:
The goal of this function was to find the parameter estimate with the maximum value of the function (i.e., to obtain m0, m1, m2, m3 ... mn).
In this study, x1, x2, x3,‖, xn were the explanatory variables affecting energy poverty, P (y = 1|x) was the occurrence of energy poverty under the influence of one or more dependent variables, and x was the impact of energy poverty. Alternatively, P (y = 0|x) indicates that one or more explanatory variables cannot lead to energy poverty, where x is not an influencing factor.
6. Empirical Results
6.1. Benchmark Regression
To ensure that the empirical results were reliable, this study adopted a stepwise regression method.
Table 3 summarises the logistic regression results of the factors affecting energy poverty.
The results for the income, planting, and breeding were not significant (
Table 3). The results of the ER were not significant; this finding, considering the lower average RE amounts observed, led to the conclusion that the current energy use of residents in this area was not affected by religious expenditures; therefore, H2 was rejected. The results for the age variable were not significant such that H6 was also rejected. Traffic was positively correlated at the 10% level, indicating that the more convenient the traffic, the more likely it is for energy poverty to occur (although these results have been temporarily rejected). The FA was significantly negatively correlated at the 1% level, indicating that the higher the altitude, the less likely energy poverty is to occur. This may be because higher altitudes receive longer durations of stronger sunshine and wind, allowing families to obtain more clean energy.
In addition, the MW variable was significantly positive at the 1% level in the second step regression, and significantly positive at the 10% level in the third and fourth steps of the regression. HO was significantly negative at the 10% level; however, we are skeptical of this result. Generally, whether the housing has independent property rights does not affect a resident’s choice of energy type. This was significantly positive at the 1% level, possibly because the higher the village status, the more likely it is that residents favourably perceive the use of nonclean energy. Villages that are more proximal to Lhasa have a notably higher status; proximity to the city also yields a more complete energy infrastructure and fewer obstacles to obtaining clean energy, thus decreasing the probability of energy poverty. Consequently, the results are inconclusive. All remaining variables were found to be insignificant energy poverty factors.
6.2. Robustness Test
To improve the credibility of the results and explore suspicious regression results, we used two robustness testing methods. First, an OLS model that differs from the benchmark regression was used to analyse model stability. Second, we set up a new energy poverty indicator as the explained variable, expressed as the sum of the frequency of the energy-type use. This variable was defined as follows: Daily use of nonclean energy = 5, Frequent use = 4, Sometimes used = 3, Rarely used = 2, and Almost never used = 1, as well as Daily use of clean energy = 1, Often used = 2, Sometimes used = 3, Rarely used = 4, and Clean energy = 5. Its value is the sum of the frequency of use of various energy sources; the larger the value, the less clean the energy. Using the robust standard error method to correct for heteroscedasticity, and after the multi-collinearity test, the variance inflation factor (VIF) was 1.5, which is significantly less than the empirical value of 10. This indicates that there was no problem with multi-collinearity.
Comparing
Table 3 and
Table 4, although the results of some indicators were different, the results of most indicators were essentially stable. Age, gender, education, politics, VCE, planting, and RE were insignificant in both regressions. Therefore, we suggest that the above variables are not contributing factors to energy poverty (again rejecting H2, H6, and H5
1).
The result of the robustness test for the MW variable was significantly negative at the 1% level. Although different from the benchmark regression, this finding is more reliable because migrant work not only increases residential income, but also improves the social experience. When residents have more opportunities to access and use clean energy, this reduces the probability of energy poverty. Based on the statistical results, the increasing income had a negative effect on energy poverty; therefore, H1 was not rejected. Employment was significantly positive at the 10% level; combined with the descriptive statistics, the average value was 6.389, indicating that respondent occupations are mainly in agriculture, animal husbandry, and freelance, with unstable income. Therefore, unfixed jobs are more likely to cause energy poverty. The HO variable was no longer significant in the fourth step, although it was not rejected because owning a house with independent property rights has no impact on the type of energy they use. In the robustness test, the area had a positive relationship with energy poverty; when considered with the descriptive statistics, the average value of this indicator was 1.895, showing that there were more residents living in pastoral areas. Herders migrate for approximately six months out of the year and have no fixed place of residence; their use of cattle and sheep dung as the main energy source places them into energy poverty. This analysis can also be used to support the result that breeding was significantly positive at the 10% level; therefore, we suggest that the probability of energy poverty was higher, thus not rejecting H52. The robustness results for the FA variable were also different from the benchmark regression; after comprehensive consideration, this study did not reject it. Higher altitude and more complicated geographical conditions (i.e., mountains) render it more difficult for the transmission of clean energy; however, residents living at higher altitudes also have more opportunities to directly obtain clean energy such that H3 was not rejected. The vs. was significantly negative at the 1% level; this result was verified because the higher the status of the village community, the better its economic development level, per capita income level, infrastructure conditions, and geographical location conditions. Thus, when vs. is high the probability of residents using clean energy is higher than that of other villages, corresponding to a lower probability of energy poverty. The traffic was significantly negative at the 10% level, and this was not rejected. The better the traffic conditions, the better the energy facilities, as well as a greater ease of transport for clean energy, all of which decrease the likelihood of energy poverty.
6.3. Endogenous Issue Treatment
For energy poverty, few studies have focused on the treatment of the endogenous issue. However, we suggest that the endogenous issue may exist in the empirical analysis results of the logistic and OLS models as a result of mutual causal and missing variables, which generate more errors in the results. Therefore, in this section, we used the Hausman test to understand whether there is endogeneity; we then used the instrument variable method and 2SLS model to process the endogeneity.
Based on previous studies, the Hausman test is currently the most commonly used method to detect endogenous issues. Its original hypothesis is ‘All variables are exogenous’. If the
p value > 0.05, the original hypothesis is not rejected; that is, there is no endorsement. If
p < 0.05, the original hypothesis is rejected; that is, there is endorsement. We used the Hausman method to test a significant impact factor in the basic regression and robustness analysis, whose results are summarised in
Table 5.
Based on the results in
Table 5, HO, Area, FA, VS, Breeding, and Traffic do not have endogenous issue. The reasons for this are as follows. (1) The Area and FA are natural factors for the absolute exogenous factors; whether or not there is energy poverty, these natural conditions will not change. (2) vs. is a social factor in the relative exogenous factors; despite a family’s situation, it will have an impact on the high or low status of the village agency, but the impact is small. (3) HO and Breeding are a relatively exogenous family factors; housing demand and the breeding of poultry are inherent behaviours in rural Chinese households. Whether or not energy poverty exists, the housing demand and farming behaviour are not easily changed.
In the influencing factors for energy poverty, there is an endogenous issue for MW, employment, and income. Therefore, we used the instrument variables and 2SLS models to manage this issue for these three influencing factors and energy poverty. The instrument variable method selected in this study was ‘the distance from the family to the county’. The reasons for selecting this variable were as follows. (1) Generally, the willingness (MW) will decrease with greater distances between the family and the county; furthermore, employment selection, income sources, and quantities also change. If the family moves closer to the county, the willingness of the MW will increase and employment can be selected, also influencing the source and quantity of income. Therefore, there is a theoretical correlation between the instrument variables and interpretation variables. (2) The distance between the family and the county does not directly affect the energy use of the family, such that there is no direct correlation between the instrument variable and energy poverty. In summary, the instrument variable meets the requirements; the 2SLS model can be used to return to the ‘two-step method’.
Based on
Table 6, in the first step, the instrument variable (i.e., ‘the distance between the family and the county’) was significantly negatively correlated among 5% of the interpretation variables. However, it was not related to the interpretation variables or the basic conditions for the instrument variables. In the second step, MW and energy poverty were significantly negatively correlated at the 5% level; employment and energy poverty were significantly negatively correlated at 10%; and income and energy poverty were significantly negative at 5%. Compared with the basic regression and robustness test results, the absolute value reduction of the regression coefficient for MW indicates the degree of external MW on energy poverty in the basic regression and robustness test. The absolute value of the employment regression coefficient was reduced, which also explains the employment level with respect to energy poverty in the basic regression and robustness. The absolute value of the income regression coefficient increased; that is, the impact of income on energy poverty had a high weight in the basic regression and robustness test. Finally, the F value was observed. According to previous studies, the F value is greater than 10% of the empirical value (10) such that that there is no weak instrument variable problem. Based on
Table 6, the instrument variable selected in this study was effective.
7. Discussions
Using survey data on livelihood development in Tibetan farming and pastoral areas in 2019, the present study employed the logistic and OLS techniques to examine the factors affecting energy poverty.
The core findings of this study revealed that an increase in family income, migrant working conditions and improved traffic conditions are beneficial in overcoming energy poverty; unemployment or participation in informal work facilitate energy poverty. These results are similar to the findings of Vavrek et al. [
4], Jiglau et al. [
27] and Rehman et al. [
20], who proved that income factors have a significant impact on energy poverty.
Similar to Tao and Yongwei [
54], we found that areas and breeding impacts energy poverty. They believe that different areas with large differences in natural resource endowment and living habits will directly affect falling into energy poverty. Breeding generally exists in pastoral areas, and residents often use livestock manure as fuel, which also increases the probability of energy poverty.
Our results also differ from existing research. For example, Amin et al. [
3] found that raising the education level can reduce energy poverty, but the results here show no relation between education and energy poverty. This is because Tibet has long been an area of severe poverty, and the residents’ education level is generally low, thus having no impact on energy poverty. Nonetheless, we believe improving residents’ education level will help overcome energy poverty.
Middlemiss et al. [
44] found marital status to be related to energy poverty. Specifically, married couples have a lower probability of falling into energy poverty due to double income. However, the marriage variable here is insignificant. We propose that because rural women in Tibet generally have no formal jobs, their incomes are unstable or they have no income, so the total family income does not change, and family energy use remains static. In addition, the household energy consumption structure is stable for periods of time and does not change drastically based on marriage status, which also explains why age and gender have been found to be unrelated to energy poverty in most previous studies [
55].
Liming and Hebang [
56] think that households with planting behaviour are more likely to choose unclean traditional energy, such as burning straw; therefore, they are more prone to energy poverty. However, the relationship between the planting variable and the energy poverty variable in our study is not significant. The reason is that Tibet is located on a plateau, and there are only a few arable areas, hence this will not affect energy poverty.
It is worth mentioning that some variables and results here have barely appeared in the literature. For example, we demonstrate that village standing (VS) and family altitude (FA) impact energy poverty, but political, village cadre experience (VCE) and expenditure on religious activities (ER) do not. These results provide new references for subsequent research.
8. Conclusions
From a macro-perspective, energy poverty hinders development efficiency and national-level (regional) economy and society; from a micro-perspective, energy poverty is not conducive to decreasing family poverty, and it improves living standards. Therefore, investigating the factors affecting energy poverty and how to overcome energy poverty have become a common goal of humanity.
This study investigated the causes of energy poverty in Tibet through the use of survey data on livelihood development in Tibet’s farming and pastoral areas in 2019. A logistic model was used to perform benchmark regression and analysis, and two methods were employed to test the robustness of the findings. Finally, we analysed and compared the results of the two regressions, drawing the following conclusions. (1) The age, gender, education, marriage, political, village cadre experience, planting, and religious expenditures are all irrelevant for the evaluation of whether families fall into energy poverty. (2) Families with migrant work experience, families in higher-status villages, families with higher income levels, families with better transportation conditions, and families living at higher elevation are negatively correlated with energy poverty. (3) The employment, area, FA, and breeding are all positively related to energy poverty (i.e., families with unstable jobs, families in pastoral areas, families with higher altitude homes, and families with cattle and sheep are more likely to be in energy poverty). For the relationship between the FA and energy poverty, both positive and negative correlations can be reasonably explained.
This study shares consensus with existing the literature regarding certain conclusions but also shows some differences. Certain factors causing energy poverty in Tibet are the same as in other world regions, which facilitates proposing policies to overcome energy poverty. Compared with other areas, Tibet features huge differences in geography, resource endowment, economic level, social development and cultural background. Therefore, there are some characteristic conclusions conducive to targeted suggestions specifically for energy poverty elimination in Tibet.
9. Policy Recommendations on Alleviating Energy Poverty
Alleviating energy poverty depends on government macroeconomic policies and measures. This study makes both universal and specific conclusions, based on both extensive and focused perspectives, proposing three policy recommendations from a relatively macro perspective. These recommendations not only contain specific policy advice for solving Tibetan energy poverty but also for resolving it worldwide.
- (1)
Improve the construction of energy infrastructure and supporting facilities, and increase the conversion and utilisation rate of clean energy. Tibet has natural advantages for clean energy, with abundant reserves of solar, wind, geothermal, and hydro power; however, the low conversion rate of clean energy over time has not only raised energy prices but has also become an obstacle to clean energy popularisation. Therefore, we recommend that the Chinese government should accelerate the construction of energy development and supply facilities, improve the efficiency of transforming clean energy into secondary energy, such as electricity, expand clean energy reserves, and reduce prices to improve residential access to clean energy. Simultaneously, financial support and other approaches can be used to help farmers and herders speed up upgrades to energy-using facilities while enhancing the residents’ ability to use clean energy.
- (2)
Strengthen east–west collaboration within China, develop characteristic industries, increase employment positions, and increase residential income. The strategy of cooperation between the east and west has played an important role in the fight against absolute poverty in Tibet. To address energy poverty, we must combine the capital and technology of more developed eastern regions with the characteristic industries of Tibet. This will develop industries with unique regional culture, providing local residents with stable jobs and the ability to increase income, which, in turn, will enhance residential access to clean energy.
- (3)
Strengthen the publicity and popularisation of clean energy use, and gradually improve upon combustion energy sources to improve the quality of residents’ lives. Firewood, cattle, and sheep dung are the primary sources of energy for households in Tibet. Farmers and herders have a historical and cultural practice of burning biomass energy; their subjective demand for clean energy is not sufficiently strong, with some even rejecting it. Therefore, it is necessary for society and the government to strengthen the promotion of clean energy use, as well as guide farmers and herders to realise the detrimental effects of nonclean energy and the benefits of clean alternatives. In particular, it is necessary to guide herders in the grazing process and in the use of clean energy equipment (e.g., solar cookers). In summary, the government should implement these three suggested measures to encourage clean energy use while ensuring safety among residents using nonclean energy.


